Article

Assessment of Cultivated Land Productivity and Its Spatial Differentiation in Dongting Lake Region: A Case Study of Yuanjiang City, Hunan Province

1
The College of Urban & Environmental Sciences, Central China Normal University, Wuhan 430079, China
2
School of Life Sciences, Central China Normal University, Wuhan 430079, China
*
Authors to whom correspondence should be addressed.
Sustainability 2018, 10(10), 3616; https://doi.org/10.3390/su10103616
Submission received: 22 August 2018 / Revised: 7 October 2018 / Accepted: 8 October 2018 / Published: 10 October 2018

Abstract

:
Cultivated land is an important carrier of grain production, and scientific assessing of cultivated land productivity is of great significance to ensure food security. This paper assessed the overall productivity of cultivated land in Yuanjiang city from the perspectives of quantitative structure, spatial distribution and correlation with national land use. We applied statistical and GIS (geographic information system) spatial analysis methods to 16 secondary indicators of productivity. The results showed that the productivity index of cultivated land ranged from 1642.79 to 4140.09, concentrated in classes 2–6, among the most productive of 15 classes in total. The cultivated productivity indexes of most towns showed quantitative structural patterns of “inverted pyramid” and “dumbbell” types. Cultivated lands with high productivity showed a spatial distribution that decreased from the north to the south and increased from the center to the periphery. The spatial distribution of the higher-level classes in the cultivated land productivity index and the national cultivated land use index was similar. The correlation coefficient between the indexes for cultivated land productivity and the annual standard crop yield was 0.8817, implying that the index reflected local grain production capacity very well. In general, the research offered a reference and technical support for the sustainable use of cultivated land resources and enhanced regional cultivated land production capacity.

1. Introduction

Cultivated land is one of the fundamental elements that governs the production capacity of food and is an essential and important resource and material base for humans [1,2,3]. Recently, with the rapid development of urbanization and the continuous growth of the population in China, the quantity and quality of cultivated land has decreased, which has threatened food security and has put pressure on the protection of cultivated land [3,4]. Ensuring food production and security is the primary task for state administrators and is a major strategic issue for national economic development, social stability and national self-reliance [5,6]. Studying regional grain production capacity and spatial change is of great practical significance for the implementation of the policy to protect farmland and for guaranteeing food security [7,8,9].
Research into the productive capacity of cultivated land in countries outside China has mainly focused on the potential of land production and the influence of factors such as light, temperature, soil conditions and water conditions on crop yield [10,11]. In particular, the application of crop growth models [12], remote sensing production estimation models [13], multivariate statistical models [14] and other methods for crop growth monitoring and yield estimation have been emphasized. In China, since the 1970s when Huang first proposed the concept and methods for measuring potential crop photosynthesis [15], many studies have been undertaken from different perspectives, including on land productivity, crop climate productivity, crop, light and temperature productivity and cultivated land productivity [16,17,18]. Since Lester R. Brown asked, “who will feed China?”, problems with food security have become the focus of political and research attention around the world. Most research in China has looked at the conceptual models and theoretical systems in cultivated land productivity [19,20,21], mainly at the macro or meso spatial scales [22,23,24,25]. Researchers have calculated cultivated land productivity and have analyzed the differences in time and space and the influencing factors [25] based on the results of grading agricultural land [26], evaluating cultivated land quality [27] and testing regional yields [28] through the potential decay method, improved agricultural ecological zoning and the agro-ecological zone model [24,29,30], or building a new cultivated land productivity evaluation system [31]. However, most of these calculations of cultivated land productivity that are based on grading agricultural land are deficient in their evaluation because of a lack of indexes reflecting the technical level of regional agriculture. Hence, a further step should be taken in building a more integrated and comprehensive evaluation system to measure cultivated land productivity.
In view of this, a comprehensive evaluation of the cultivated land production capacity was carried out in this paper through the effective integration of natural environmental factors and socio-economic and technological factors, taking Yuanjiang city, Hunan province as the study area. The spatial distribution of cultivated land productivity was investigated. A comparative analysis was made between the evaluation of cultivated land productivity, the actual standard food crop yield and the national agricultural land use index to complement the regional cultivated land capacity calculation. This will provide a reference and technical support for the sustainable use of cultivated land resources and greater regional cultivated land production capacity.

2. Data Collection and Analysis

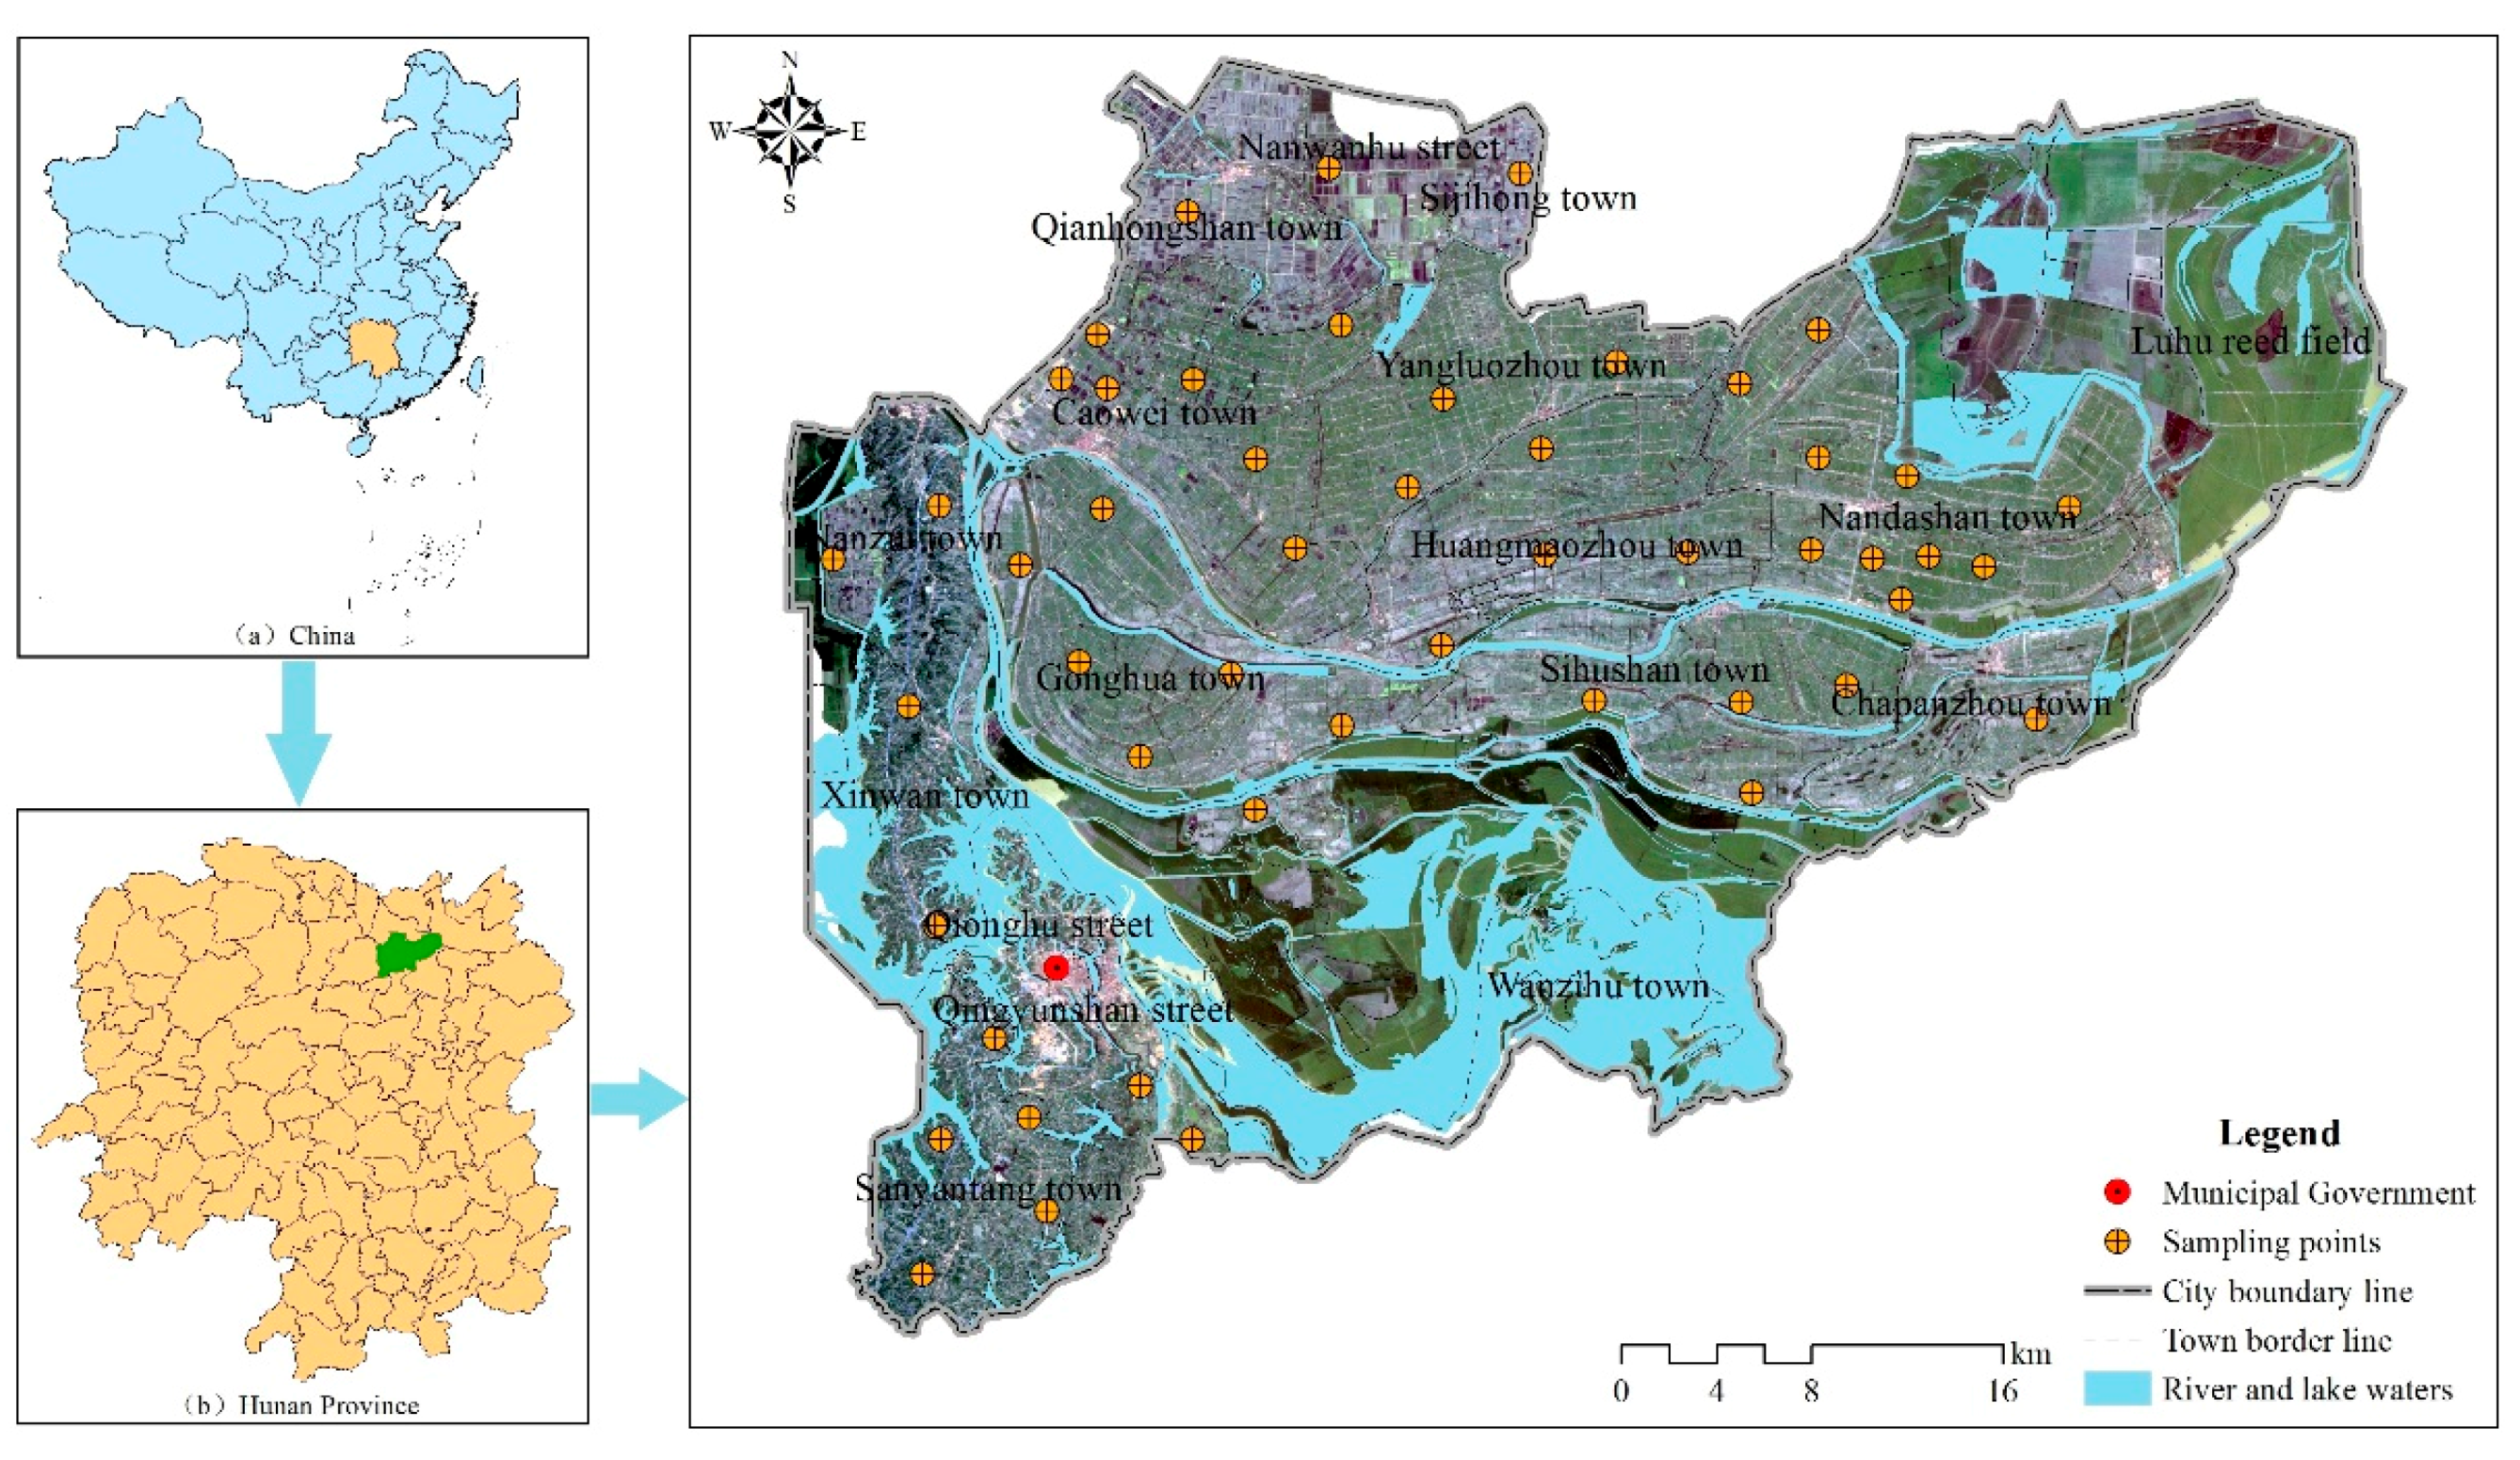
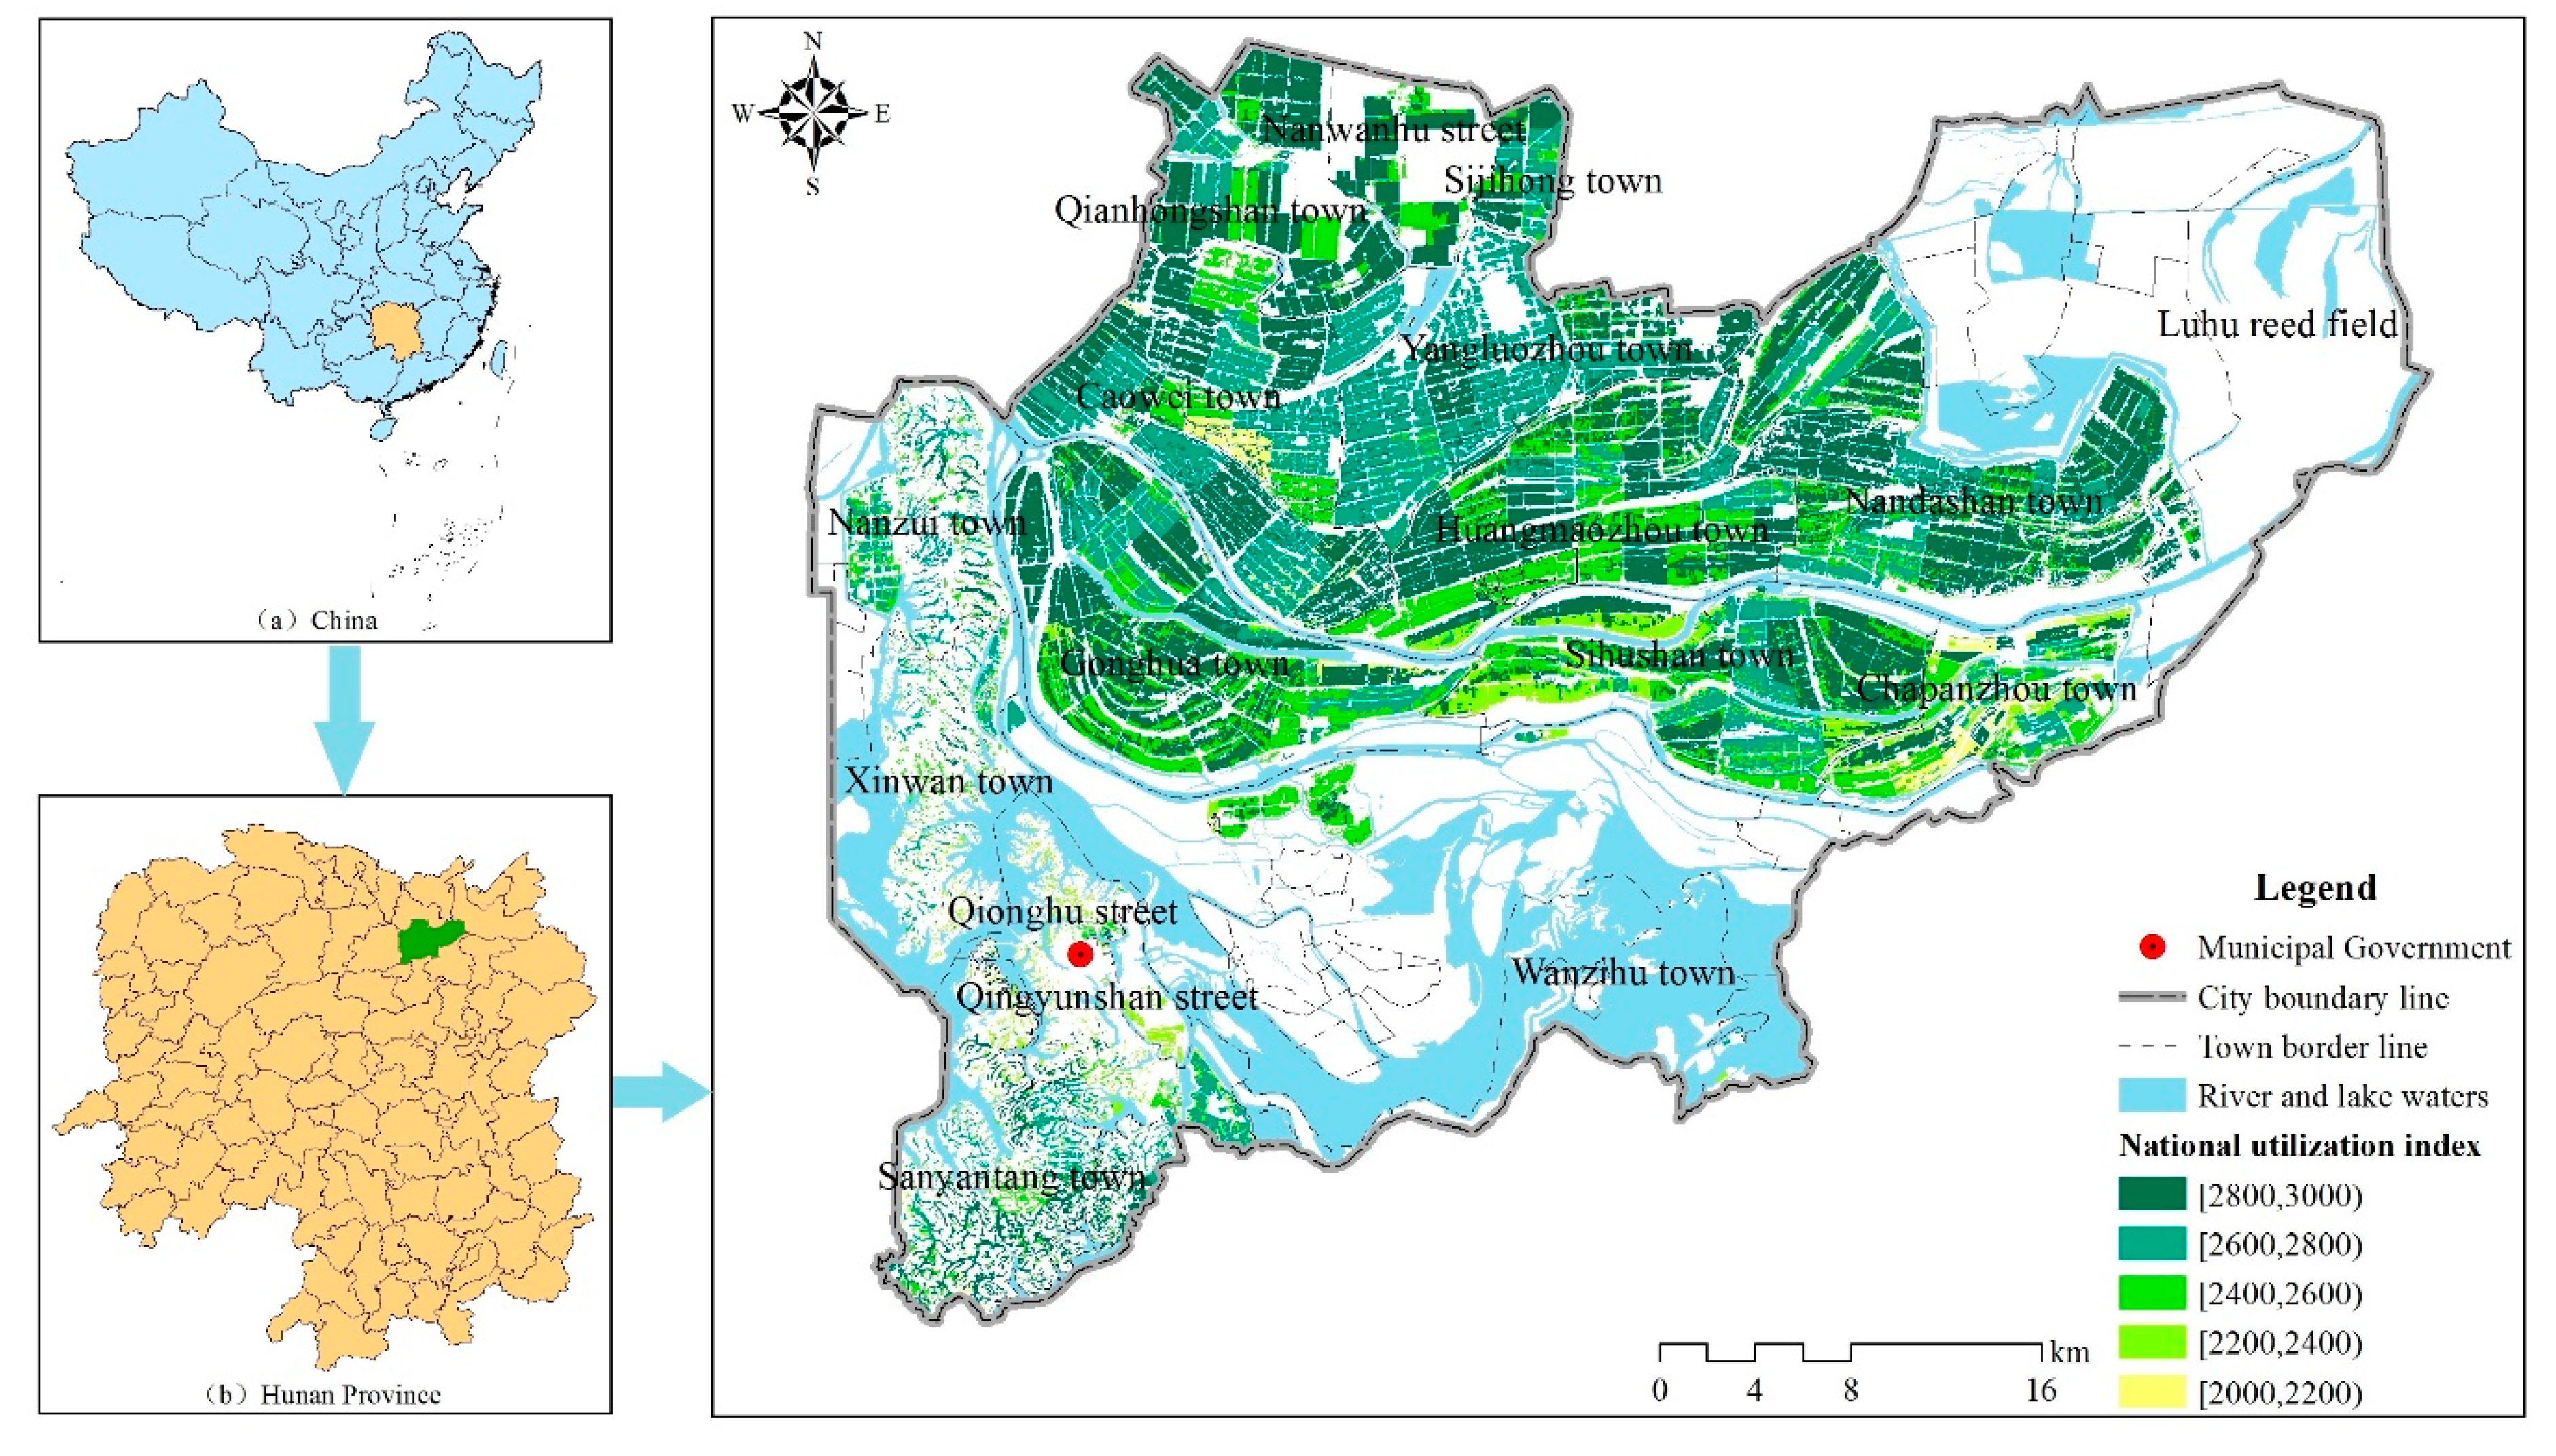
2.1. Survey of Research Area

Yuanjiang city is part of Yiyang city in Hunan province, China, located at 112°14′37″ to 112°56′20″ E, and 28°42′26″ to 29°11′17″ N. The city is in the hinterland of the Dongting Lake region, with numerous rivers and lakes. Plains are the main landform. The climate is a subtropical humid monsoon system with abundant sunshine and rainfall. The agricultural system is the standard farming system that is found in the middle and lower reaches of the Yangtze river. At the end of 2015, the total land area of the city was 212,943.82 ha, and the cultivated land was 63,819.03 ha, accounting for 29.97% of the total land area. The cultivated land included 42,985.00 ha of paddy field, 20,779.53 ha of dry land and 54.43 ha of irrigated land. The natural conditions for agricultural resources are favorable, and the soil nutrients are suitable for plant growth (http://www.yuanjiang.gov.cn/c139/index.html). Therefore, Yuanjiang is a nationally important grain and cotton commodity production base.

2.2. Data Collection and Preprocessing

The remote sensing data that were used in this paper to obtain the land use and elevation data for Yuanjiang city mainly came from high-resolution remote sensing from Gaofen-1 and GDEMDEM 30 M resolution data in 2016 in the geospatial data cloud (http://www.gscloud.cn/). The slope and topographic data for cultivated land were obtained using ArcGIS 10.1 (The software comes from the American Environmental Systems Research Institute, based in Redlands, California.). Sampling points in this paper were evenly distributed across the area according to fertilization sampling data of Yuanjiang city, the distribution map of agricultural land grade and use, land type, soil type and land use status. Different areas of attributes were classified, and the samples were located by GPS. Altogether, 50 sampling points were chosen (Figure 1). The actual latitude and longitude coordinates, the topographic position, the texture of the tillage layer and the structure of the soil were investigated in August 2017. Soil samples were analyzed for physical and chemical properties, including total nitrogen, organic matter content, pH, available phosphorus, available potassium and soil bulk density. Data, such as effective soil thickness, type of barrier layer and distance from the surface, irrigation guarantee rate and drainage conditions were derived from the Yuanjiang agricultural land quality classification data. The level of pest control, irrigation and flood control standard, agricultural machinery and equipment, agricultural management and other data were obtained from Hunan province rural statistical yearbook (2016), Yuanjiang city statistical yearbook (2016), Yuanjiang city comprehensive agricultural mechanization level summary report (2016) and Report on the first national water resources survey of Yuanjiang city. The light and temperature production potential index for different crops in the study area was derived from The light and temperature (climate) crops in countries and cities in agricultural land quality classification rules (GBT28407-2012). Based on the 2016 Yuanjiang agricultural land quality score data, the index for national use of agricultural land, comprehensive land use index, number of cultivated land points and other relevant data were obtained, and 18,330 cultivated land points were extracted as the evaluation units for cultivated land productivity. All data were preprocessed in the following ways. The reliability of the data was verified, and the unity and standardization of the data were checked. The data were transformed to a single map projection and coordinate correction was carried out for the map data. The 1980 Xi’an plane coordinate system was used for the coordinate system. All data covered the study area. ArcGIS10.1 software was used to match the data for 16 index attribute values to the cultivated land map spots, and a spatial database to evaluate cultivated land productivity in Yuanjiang city was constructed.

2.3. Analytical Methods

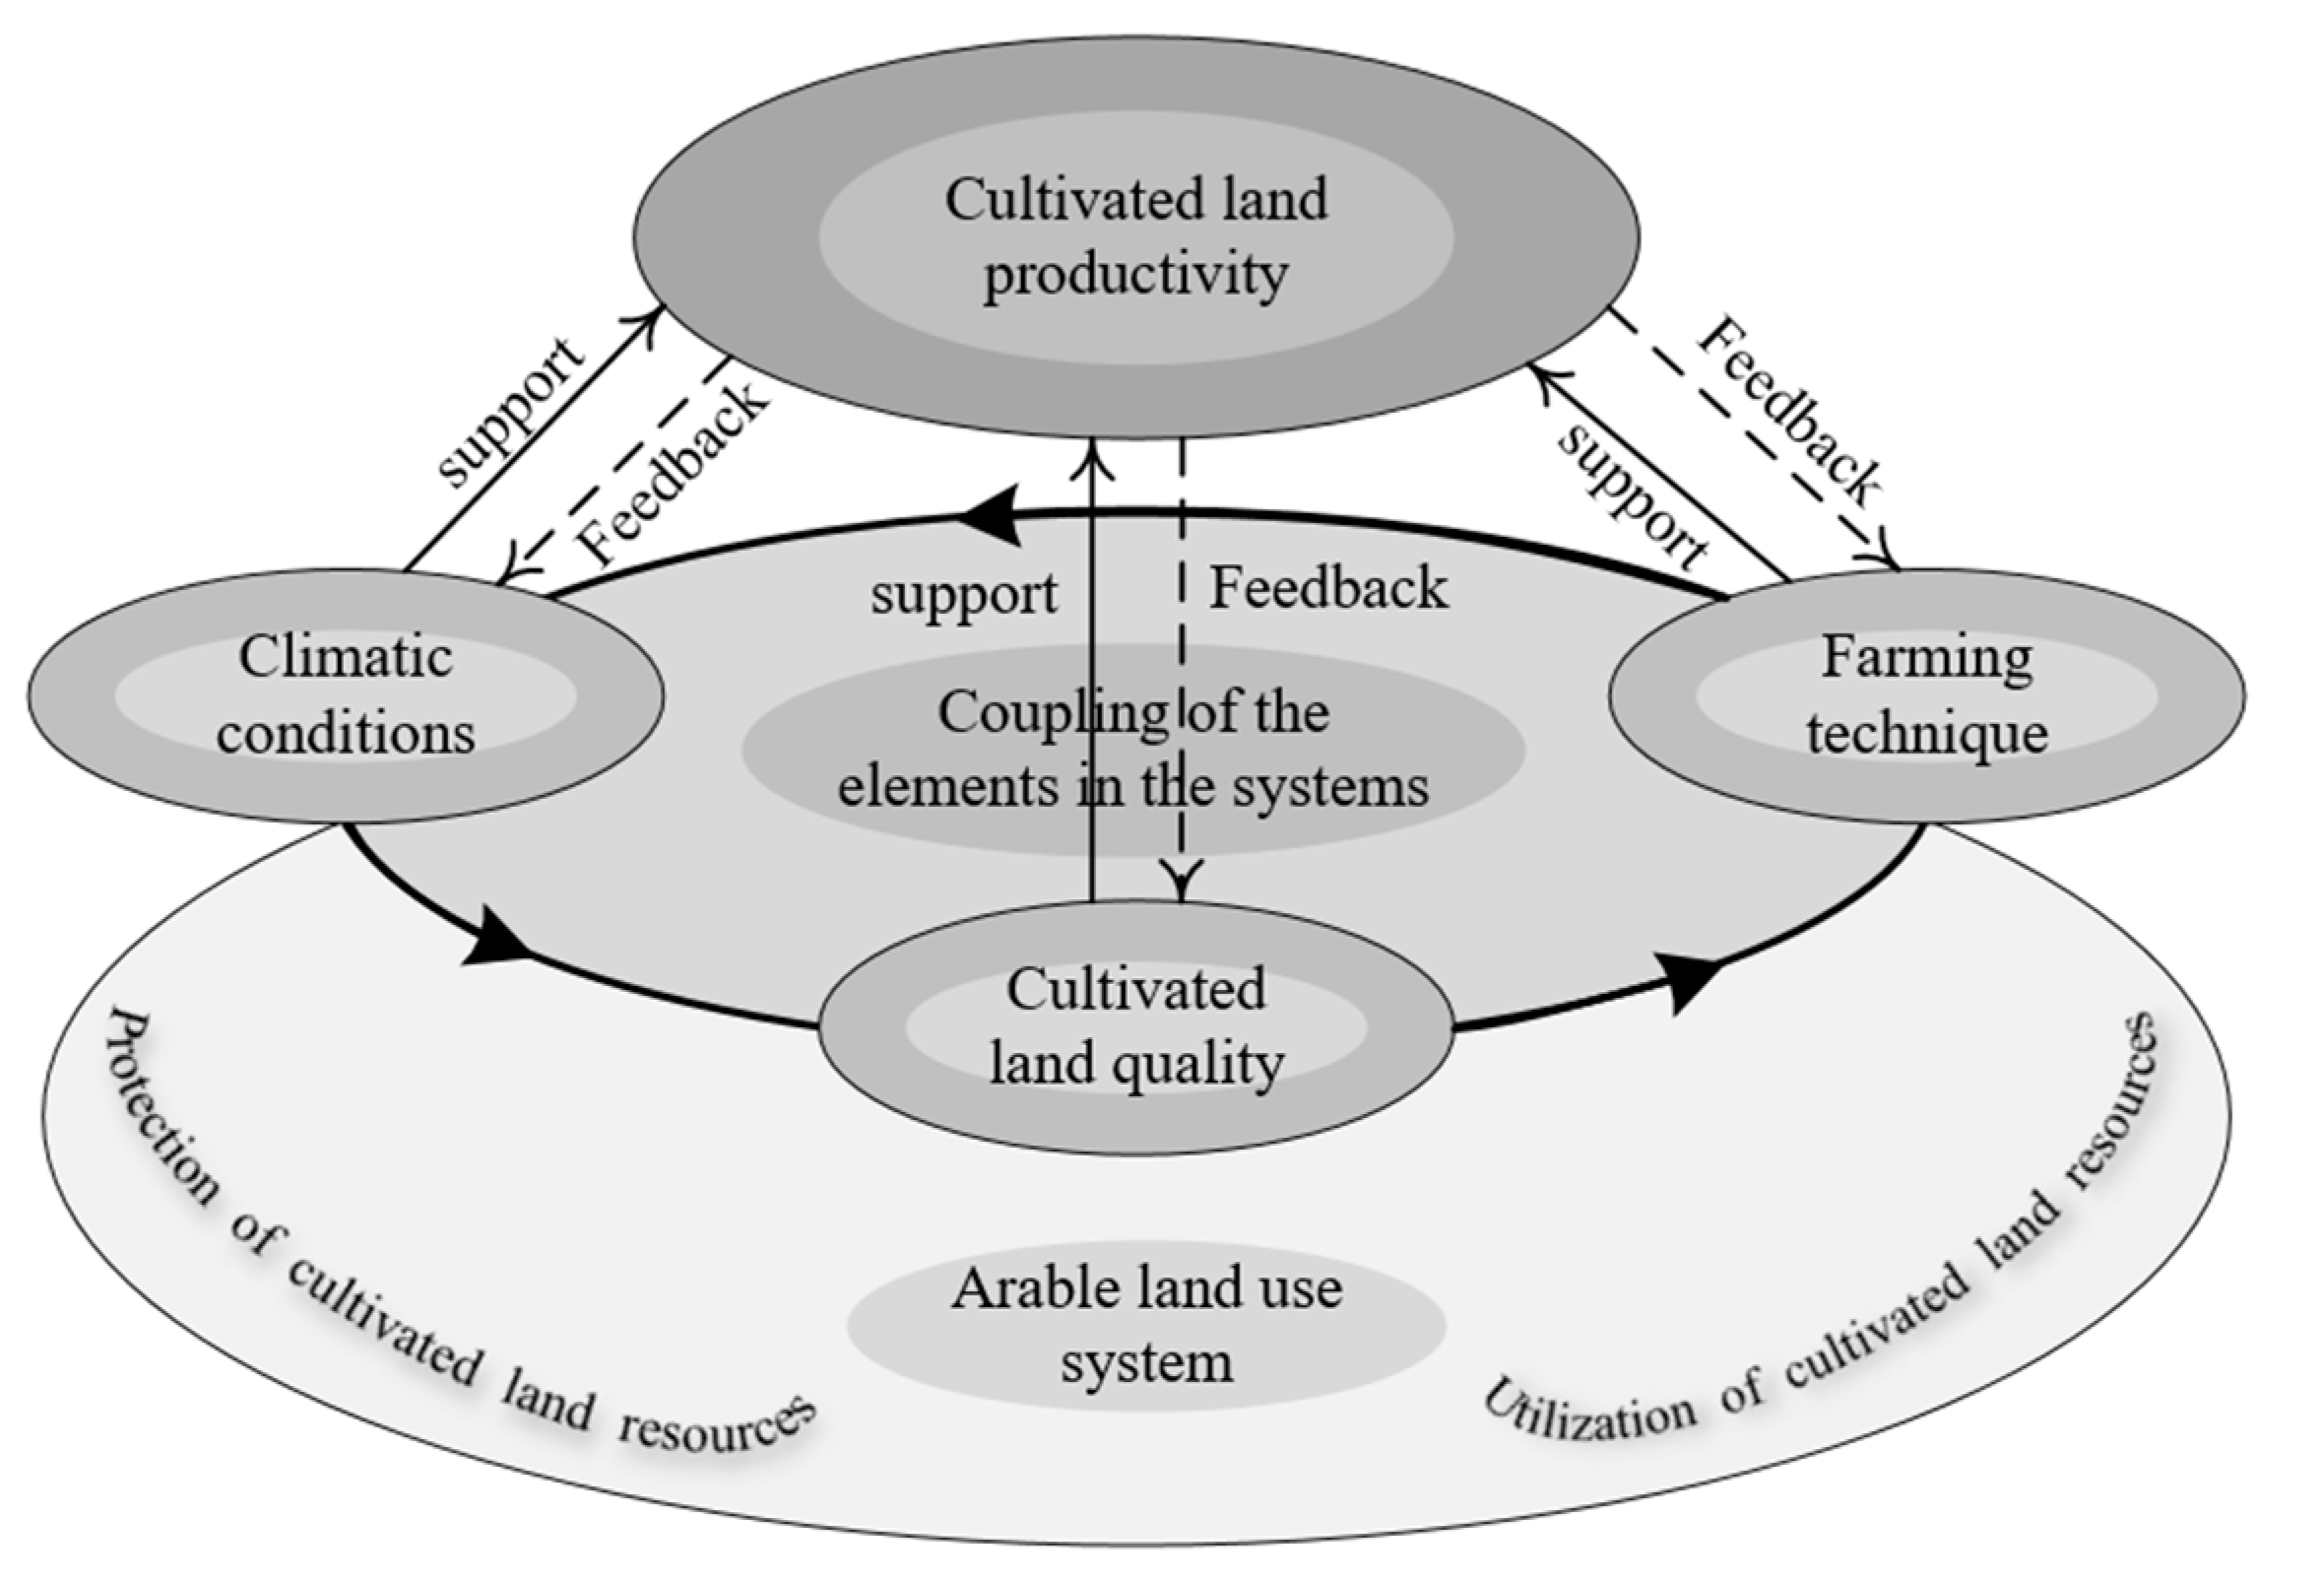
2.3.1. The Definition of Cultivated Land Productivity

The productivity of cultivated land is a complex system that is affected by the natural environment and the social economy, which has both natural and socio-economic properties. The diversity of its functions leads to the diversity of cultivated land use [32]. Cultivated land productivity is formed based on the cultivated land use system and is determined by the quantity and quality of cultivated land. The quality of cultivated land, which reflects the conditions of light, temperature, precipitation, soil and agricultural infrastructure, is the basis of cultivated land productivity [33]. Therefore, cultivated land productivity can be defined as the productivity level that is formed by the interaction and systematic coupling between the cultivated land base, climatic conditions, farming technology level and other factors in a given region at a given stage (Figure 2). Based on the concept of cultivated land productivity and factors of climate, cultivated land quality and farming technology that affect productivity, an assessment index system was constructed, which included three primary indicators and 16 secondary indicators. The weight of each index was determined by an analytic hierarchy process (AHP, Table 1). The coefficient of cultivated land quality was used as the agricultural quality score based on the grade of the agricultural land. The yield ratio coefficient of the specified crop β and the technical use level coefficient replaced the land use coefficient, which was the ratio between crop yield per unit area and the maximum yield in the control area. The light and temperature production potential index was revised accordingly. Finally, cultivated land productivity was calculated, and this formed the data for the analysis of spatial differences in cultivated land productivity in Yuanjiang city (Figure 3).

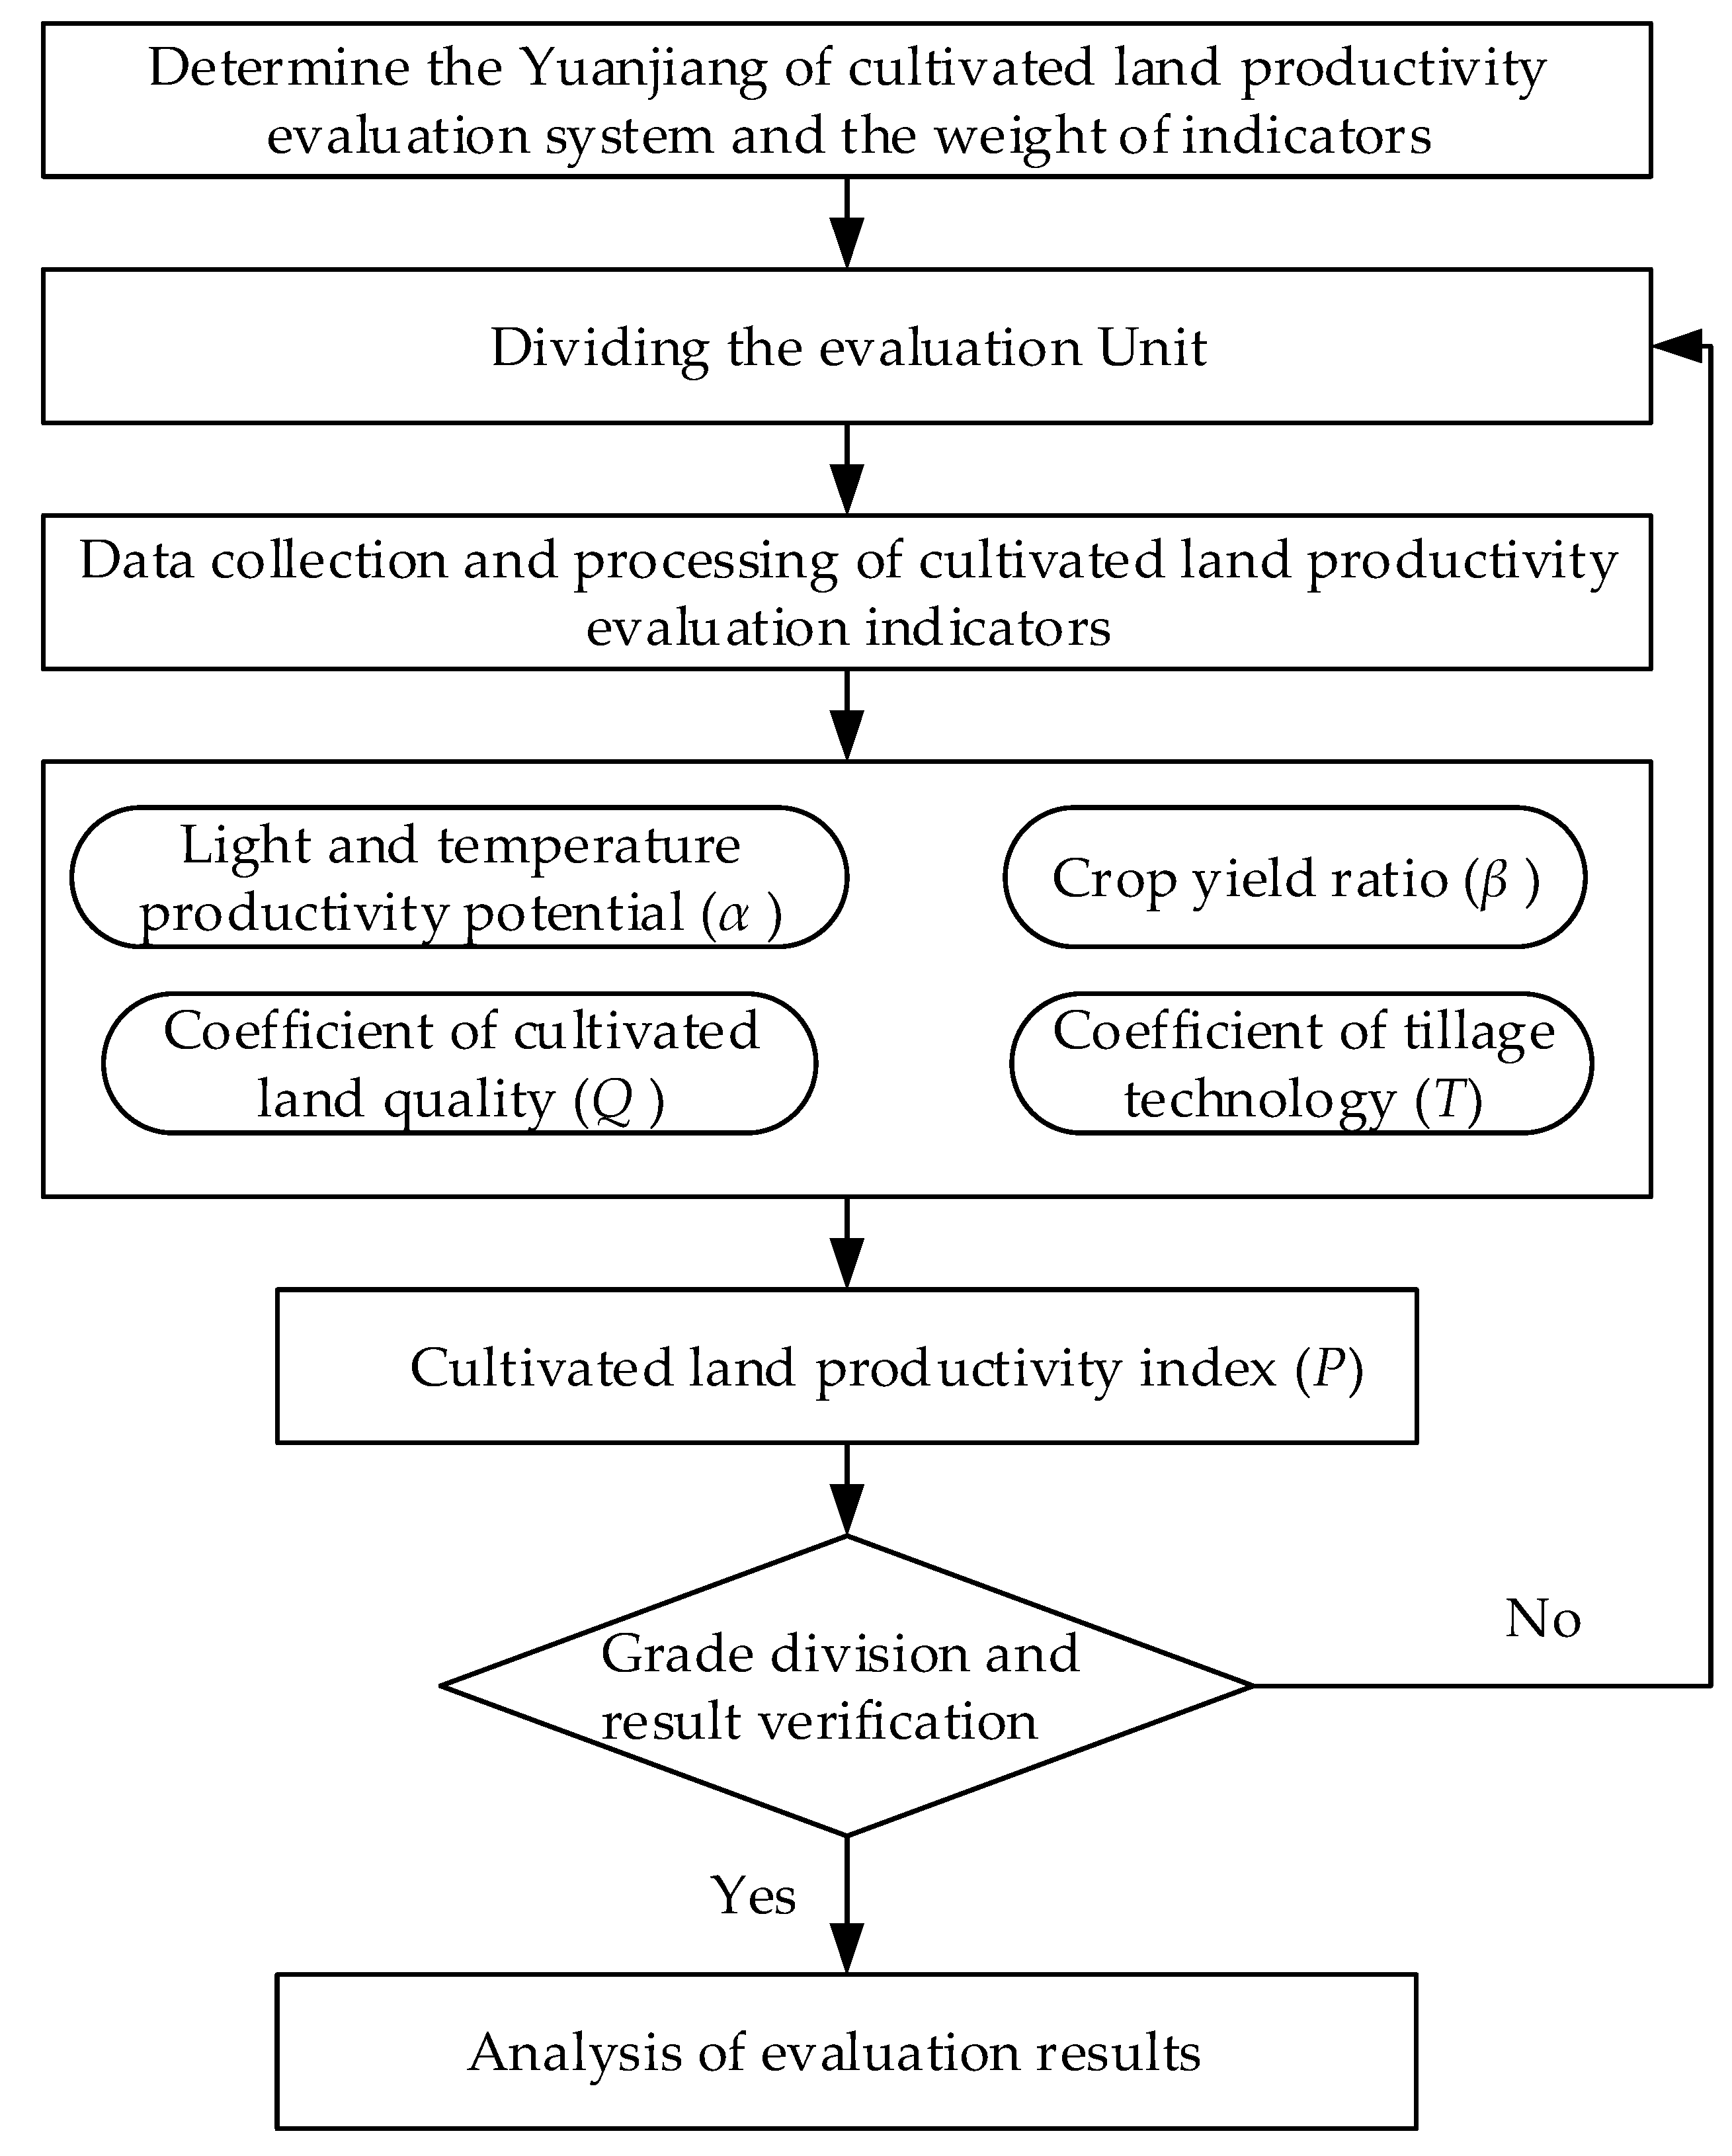
2.3.2. Calculation of Cultivated Land Productivity

Coefficient of cultivated land quality
The coefficient of cultivated land quality was calculated based on indexes of geological condition and soil properties in each evaluation unit using a weighted sum method. The formula was as follows:
Q = i = 1 n ( D i × W 1 + T i × W 2 )   / 100
where Q indicates the coefficient of cultivated land quality of the i unit, D i and T i indicate the values of indexes of geological condition and soil properties for the i unit, respectively W 1 and W 2 indicate the weights of indexes of geological condition and soil properties for the i unit, which were 0.2 and 0.8, respectively n indicated the number of evaluation units.
Coefficient of tillage technology
The coefficient of tillage technology was calculated based on the attribute value of each unit by the weighted sum method. The formula was as follows:
T = i = 1 n f i W i   / 100
where T indicates the coefficient of tillage technology of the i unit, f i indicates the standard value of the secondary indicator of the i unit and W i indicates the weights of the secondary indicator of the i unit.
Cultivated land productivity index
Based on the cultivated land quality coefficient and tillage technology coefficient, the index of light and temperature production potential reflecting climatic conditions was modified by gradation correction to obtain the cultivated land productivity index. The formula was as follows:
p = i = 1 n ( α i × β i ) × Q i × T i
where p indicates the cultivated land productivity index of the i unit, α i , β i , Q i and T i indicate the index of light and temperature production potential, crop yield ratio, cultivated land quality coefficient and tillage technology coefficient of the i unit, respectively. The cultivated land productivity index was divided into 15 classes using 300 grade spacing. The classes were: [4200, 4500], [3900, 4200], [3600, 3900], [3300, 3600], [3000, 3300], [2700, 3000], [2400, 2700], [2100, 2400], [1800, 2100], [1500, 1800], [1200, 1500], [900, 1200], [600, 900], [300, 600] and [0, 300]. The cultivated land productivity index was greatest at the class values of [4200, 4500], and decreased until it reached the lowest value at the grades of [0, 300].

3. Results and Discussion

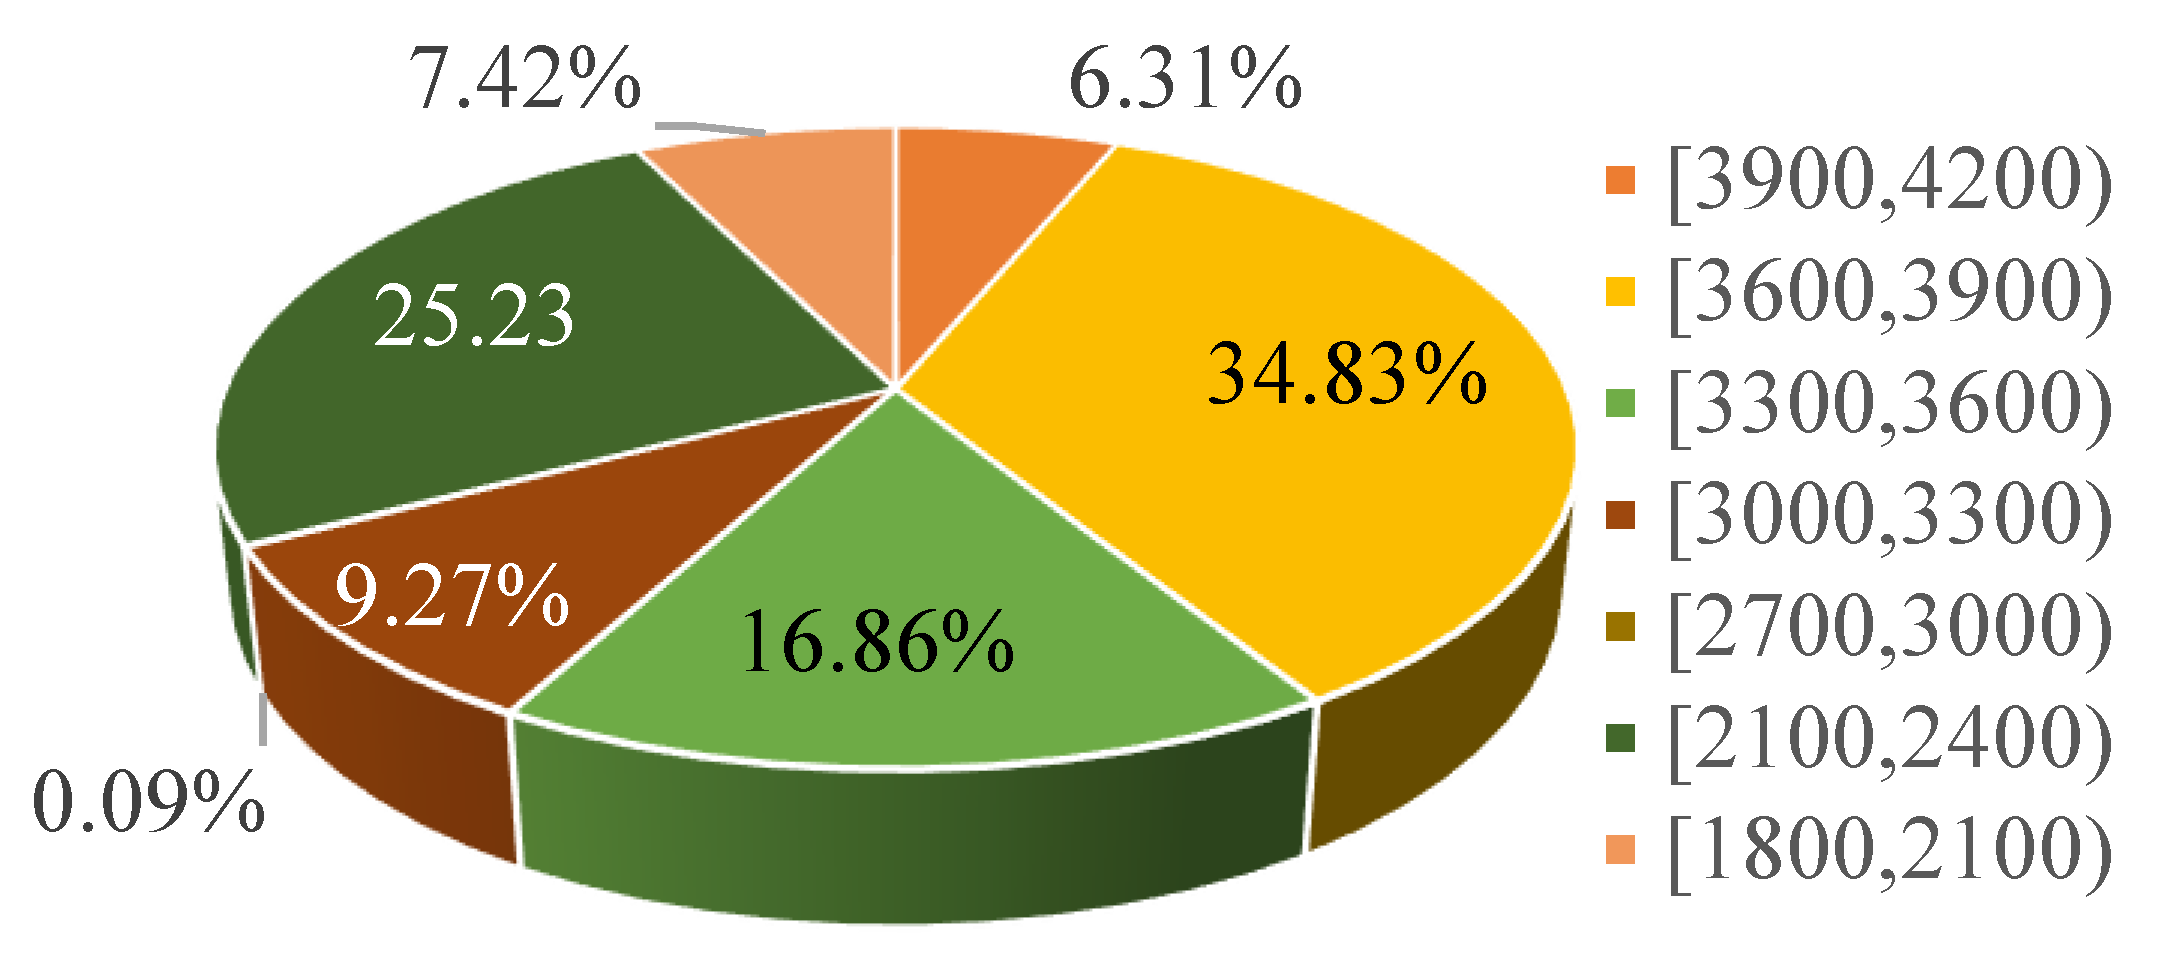
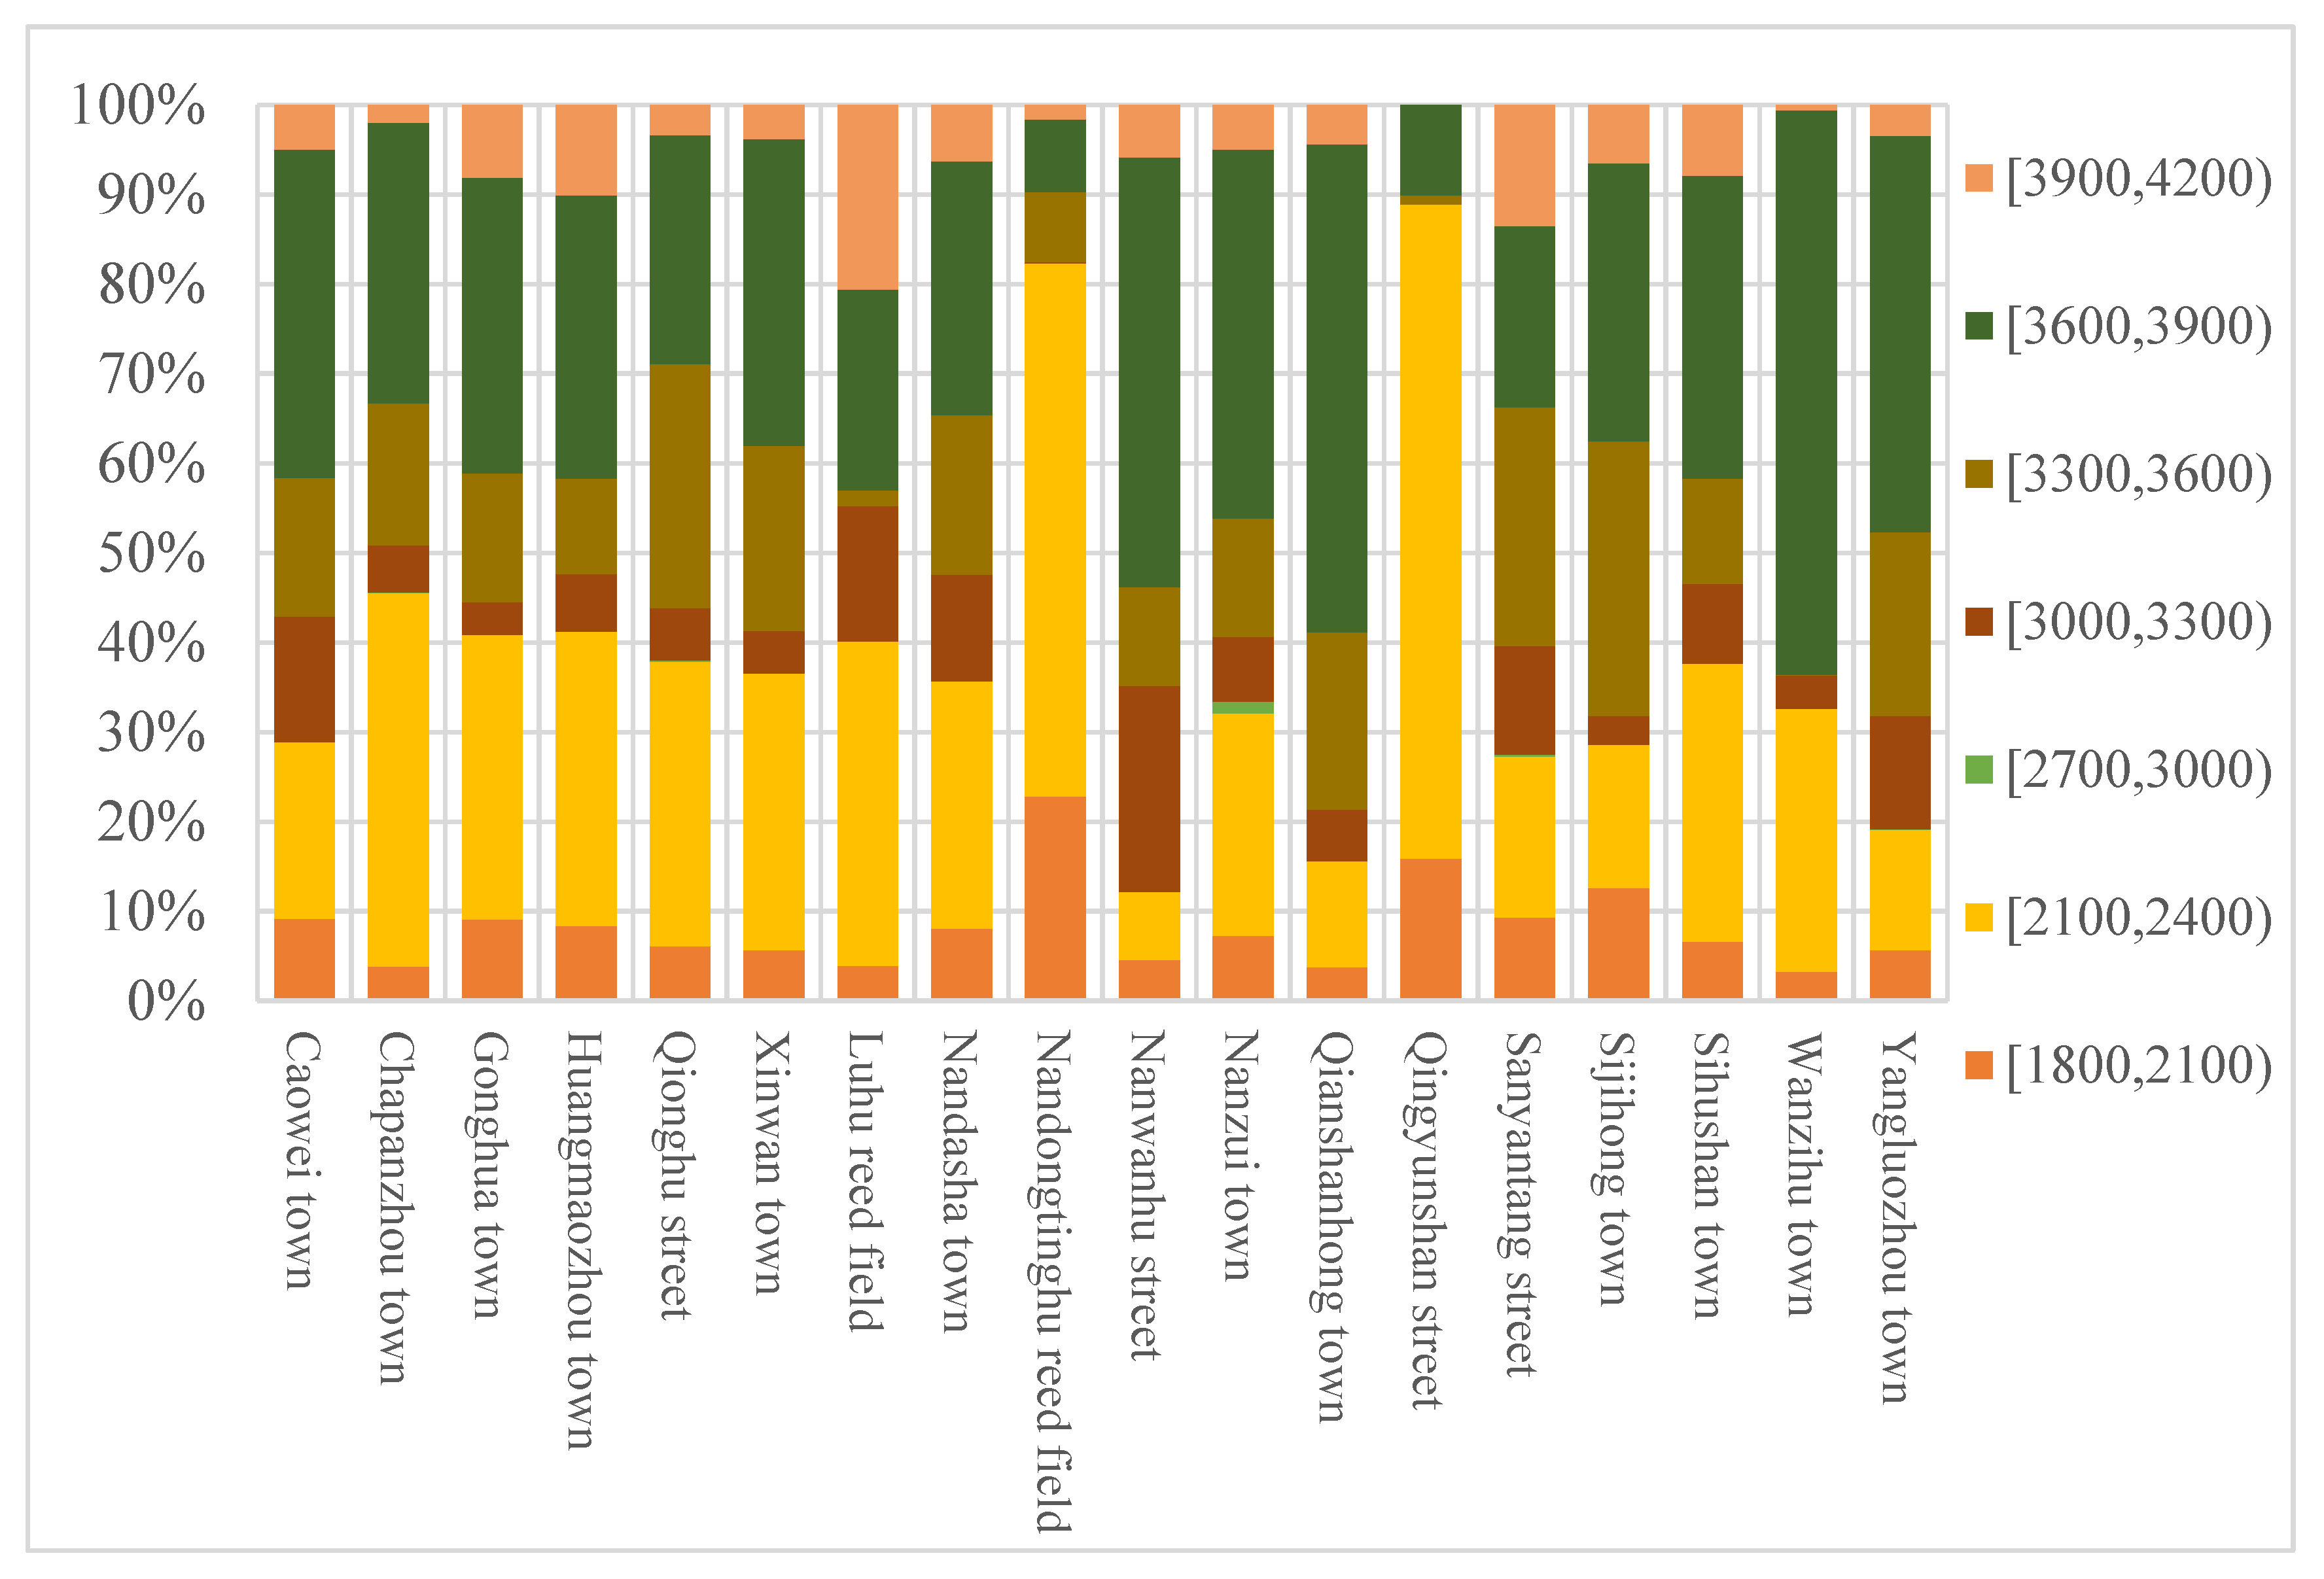
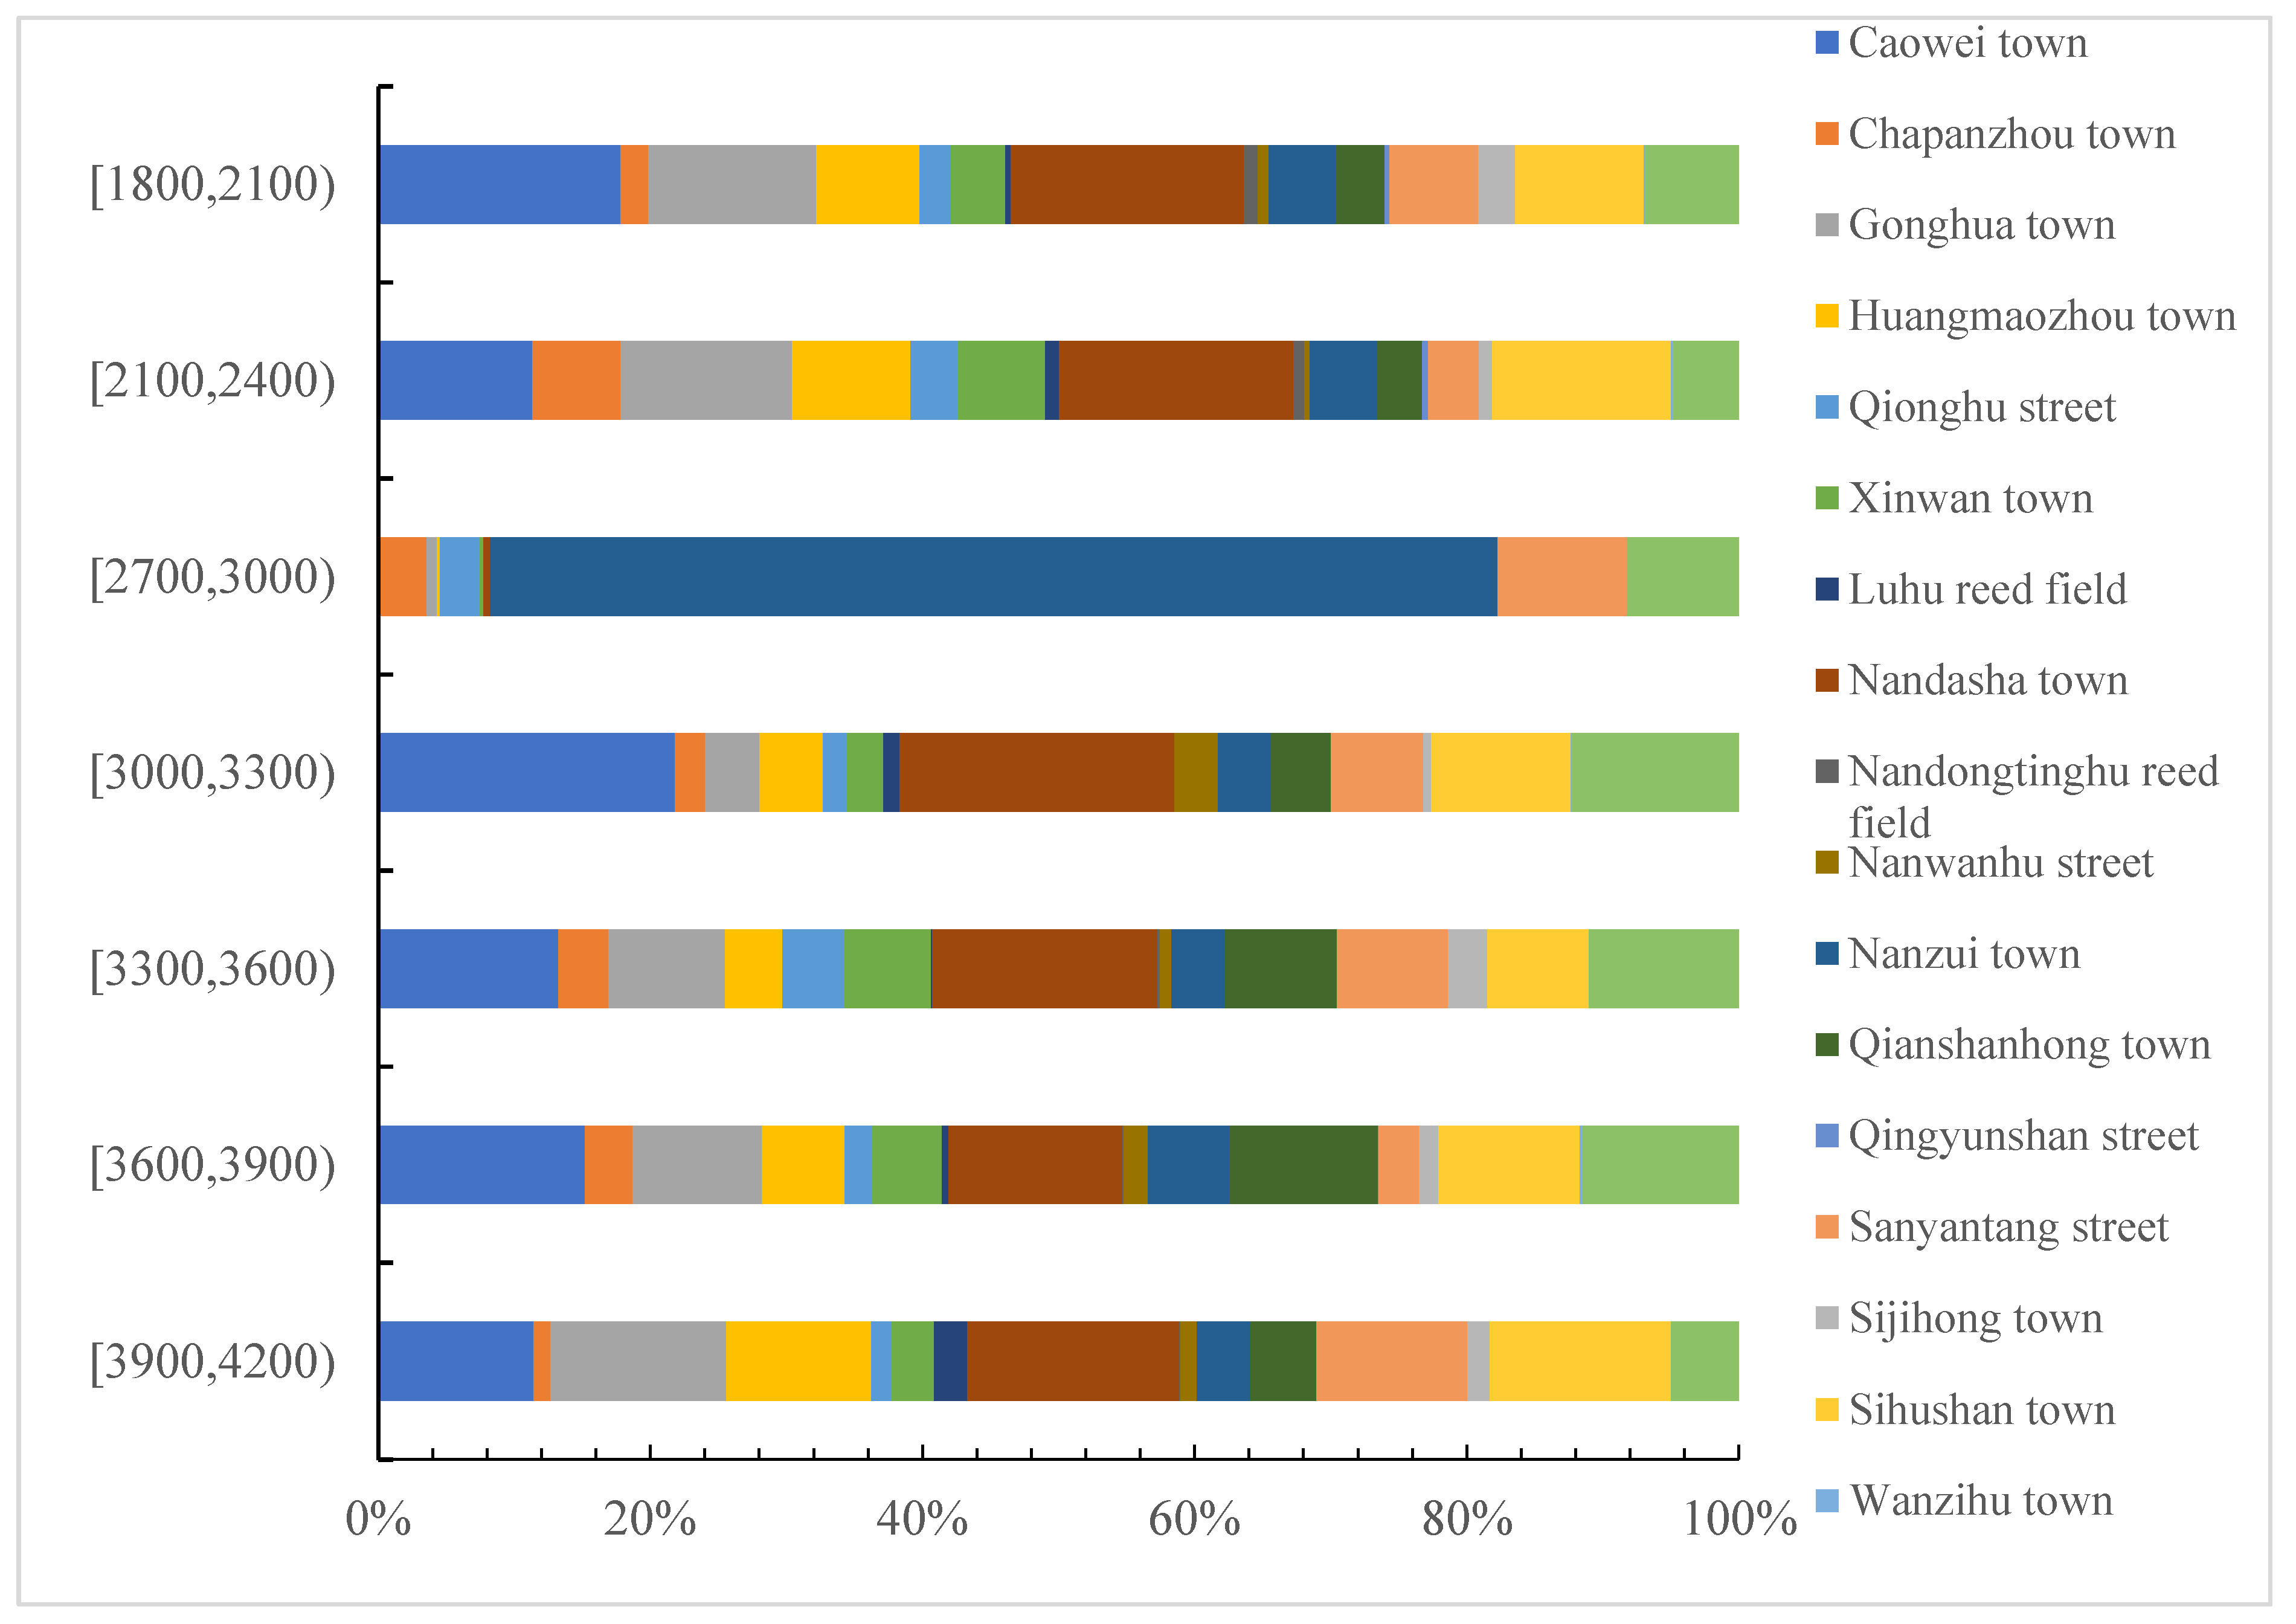
3.1. The Quantitative Structure of Cultivated Land Productivity

The cultivated land productivity index, which was calculated by gradation correction, varied from 1642.79 to 4140.09, with a range of 2499.3. The quantitative breakdown is shown in Figure 4. Most of the land was located within seven index classes: [3900, 4200], [3600, 3900], [3300, 3600], [3000, 3300], [2700, 3000], [2100, 2400] and [1800, 2100]. The area of cultivated land was the largest in the classes of [3600, 3900], [3300, 3600] and [2100, 2400], which accounted for 49,085.03 ha (76.91%) of the total cultivated land area in the city. This indicates that the cultivated land productivity index of Yuanjiang city was relatively concentrated, and the cultivated land of this city was mainly located between classes 2–6.
The cultivated land area for the productivity index of paddy field, located at values of [3900, 4200] (highest class) and [2700, 3000] (lowest class) were 4020.89 ha and 56.26 ha, accounting for 9.36% and 0.13% of the total paddy field area in Yuanjiang city, respectively (Table 2). The cultivated land area for the paddy field productivity index located at [3600, 3900] was the largest, accounting for 22,228.28 ha (51.71%) of the total paddy field area in Yuanjiang city. The cultivated land productivity for irrigated land and dry land were both concentrated at values of [2100, 2400], and the areas were 48.89 ha and 16,050.93 ha, accounting for 89.11% and 77.24%, respectively.
The cultivated land productivity indexes for the towns in Yuanjiang city showed great variations (Table 3, Figure 5). The quantity and structural distribution characteristics of the “inverted pyramid” were present in cultivated land areas of towns at different productivity levels, such as Caowei town, Nanwan Lake, Qianshanhong town, Sijihong town and Yangluozhou town. Their productivity grade for cultivated land was mostly moderate to excellent and at a grade of 2–3. The areas accounted for 41.63%, 53.76%, 58.83%, 37.53% and 47.66%, respectively of the total in these towns. The cultivated land areas at different productivity levels of Chapanzhou town, Gonghua town, Huangmaozhou town, Xinwan town, Luhu reed farm, Nandashan town, Nanzui town, Sihushan town and Wanzi Lake Township showed characteristics of the “dumbbell” structure with two large end values and small middle values. Their cultivated land areas at excellent and low levels accounted for 33.3% and 32.12% of the total, respectively. The quantity and structural distribution characteristics of the cultivated land areas in Qionghu Street, Nandongting Lake reed farm and Qingyunshan Street were “pyramid-shaped” at different productivity levels. The areas at grades from 8 to 9 for cultivated land productivity accounted for 37.89%, 82.32% and 88.87%, respectively. These towns had a greater area of cultivated land at low levels of productivity. The distribution characteristics of the “spindle-type” of quantity structure with two small ends and a large middle were present in the cultivated land area of Sanyantang town at different productivity levels. The cultivated land area at grades of 4–6 accounted for 38.99% of the total in this town.

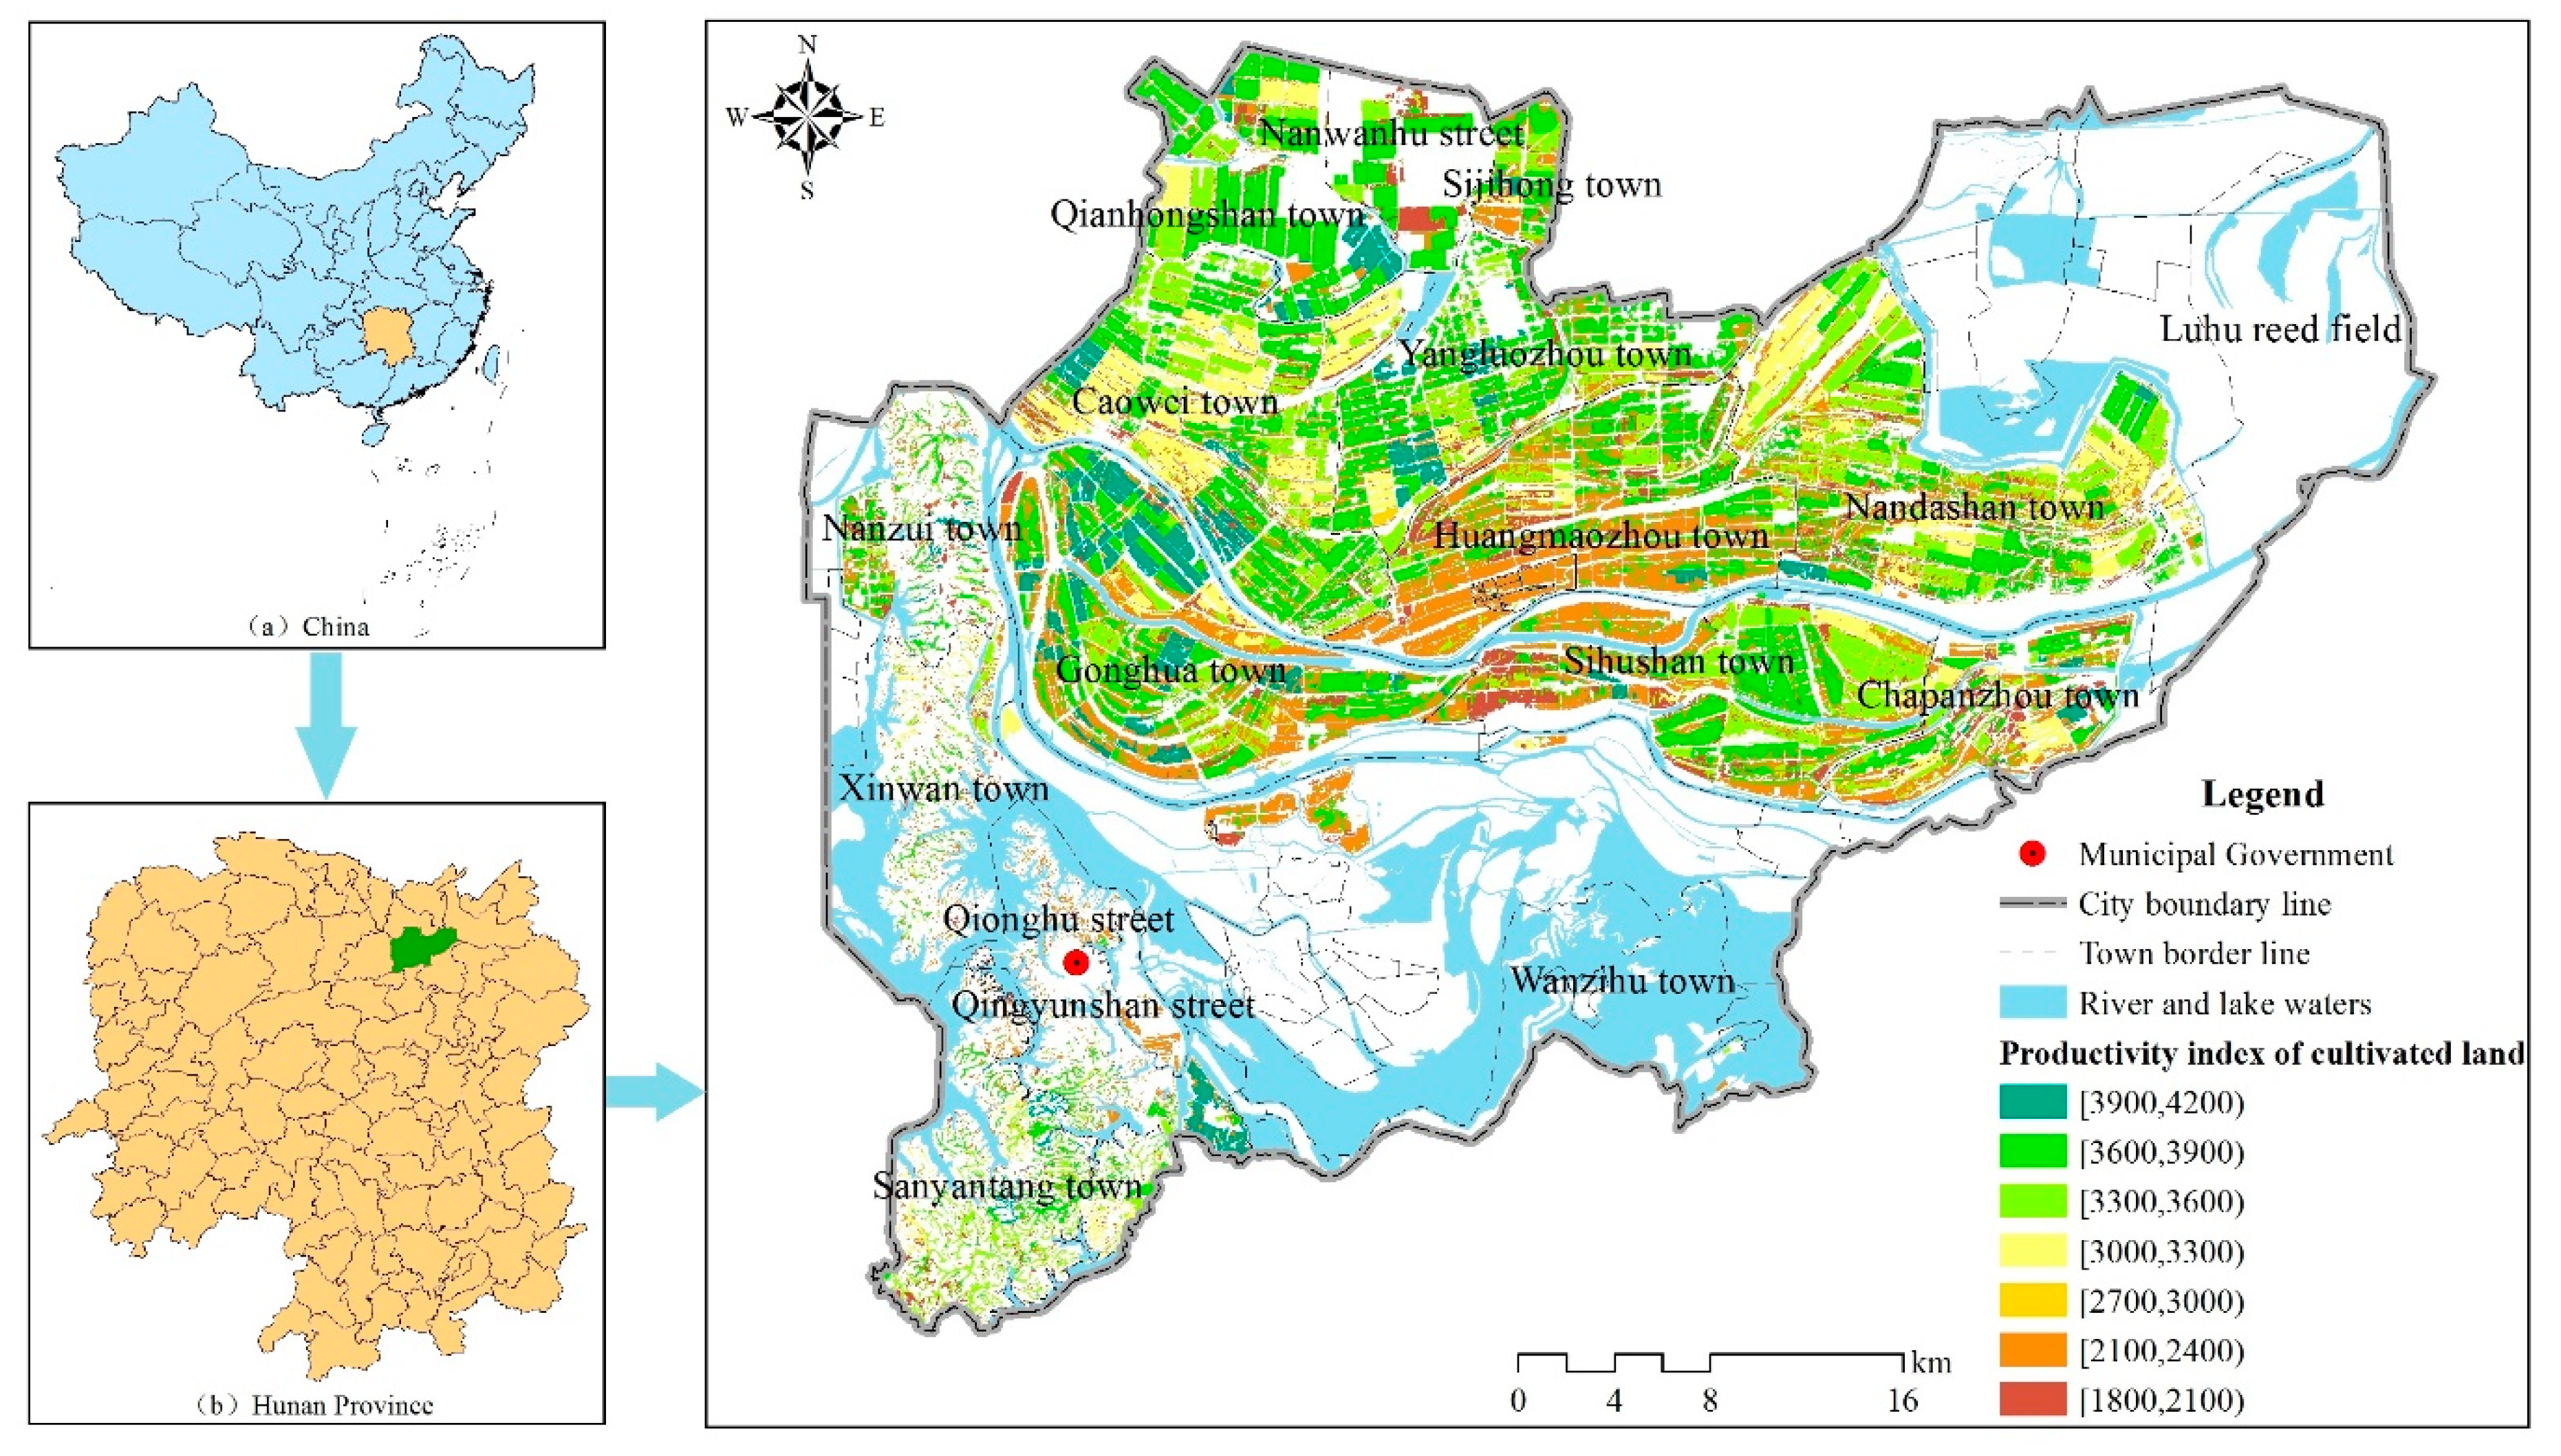
3.2. Spatial Distribution Characteristics of Cultivated Land Productivity

Based on the spatial distribution of cultivated land productivity, there was a relatively significant difference in the regional distribution in Yuanjiang city, showing a general trend of decreasing from the north to the south and increasing from the middle to the periphery (Figure 6 and Figure 7). High quality cultivated lands in the productivity index class of [3900, 4200] were mostly located in the northwest, southwest, northeast and south-central towns in Yuanjiang city, including Caowei, Gonghua, Sanyantang, Nandashan and Sihushan towns, with an area of 3018.3 ha which accounted for 74.99% of the total regional cultivated land area in this index class. At the productivity index grade [3000, 3300], most of the good cultivated lands were located in the northwest, northeast, north and south-central towns, including Caowei, Nandashan, Sihushan and Yangluozhou towns, with an area of 3821 ha, which accounted for 64.56% of the total regional cultivated land area in this index class. At the productivity index grade of [1800, 2100], most of the cultivated lands were located in the north-central, northwest and northeast towns along rivers, including Huangmaozhou, Gonghua, Caowei and Nandashan towns, with an area of 2240.04 ha, which accounted for 47.32% of the total regional cultivated land area in this index class. The cultivated land in these areas was mainly cultivated rice soil, such as tidal mud. The land was distributed in the lower part of flat fields and alluvial fields, suffering from frequent waterlogging and with poor drainage capacity. All of these conditions are not favorable for improving cultivated land productivity.
Three primary indicators, including climate condition, cultivated land quality and tillage technology in seven classes of [3900, 4200], [3600, 3900], [3300, 3600], [3000, 3300], [2700, 3000], [2100, 2400) and [1800, 2100] were standardized using a range of methods. Hence, the data were within the range of [0, 1], and the average value of the first-level indicators in each section was calculated using the arithmetic mean to further explore the interaction of various factors and the system coupling effect on the cultivated land productivity in different classes. From Figure 8 and Table 3, it can be seen that the dimensional area of cultivated land productivity decreased from the high class of [3900, 4200] to the medium class of [2700, 3000]. The dimensional area of tillage technology decreased the most, followed by that of cultivated land quality and climate condition. However, the dimensional area of climate condition significantly decreased, while that of tillage technology and cultivated land quality gradually increased when the cultivated land productivity index decreased from the medium class of [2700, 3000] to the low class of [1800, 2100].
In general, the dominant factors influencing the change of the cultivated land productivity index in different classes varied. When the class changed from low to medium levels, climate condition was the dominant factor. When the class changed from medium to high levels, tillage technology and cultivated land quality were the main influencing factors.

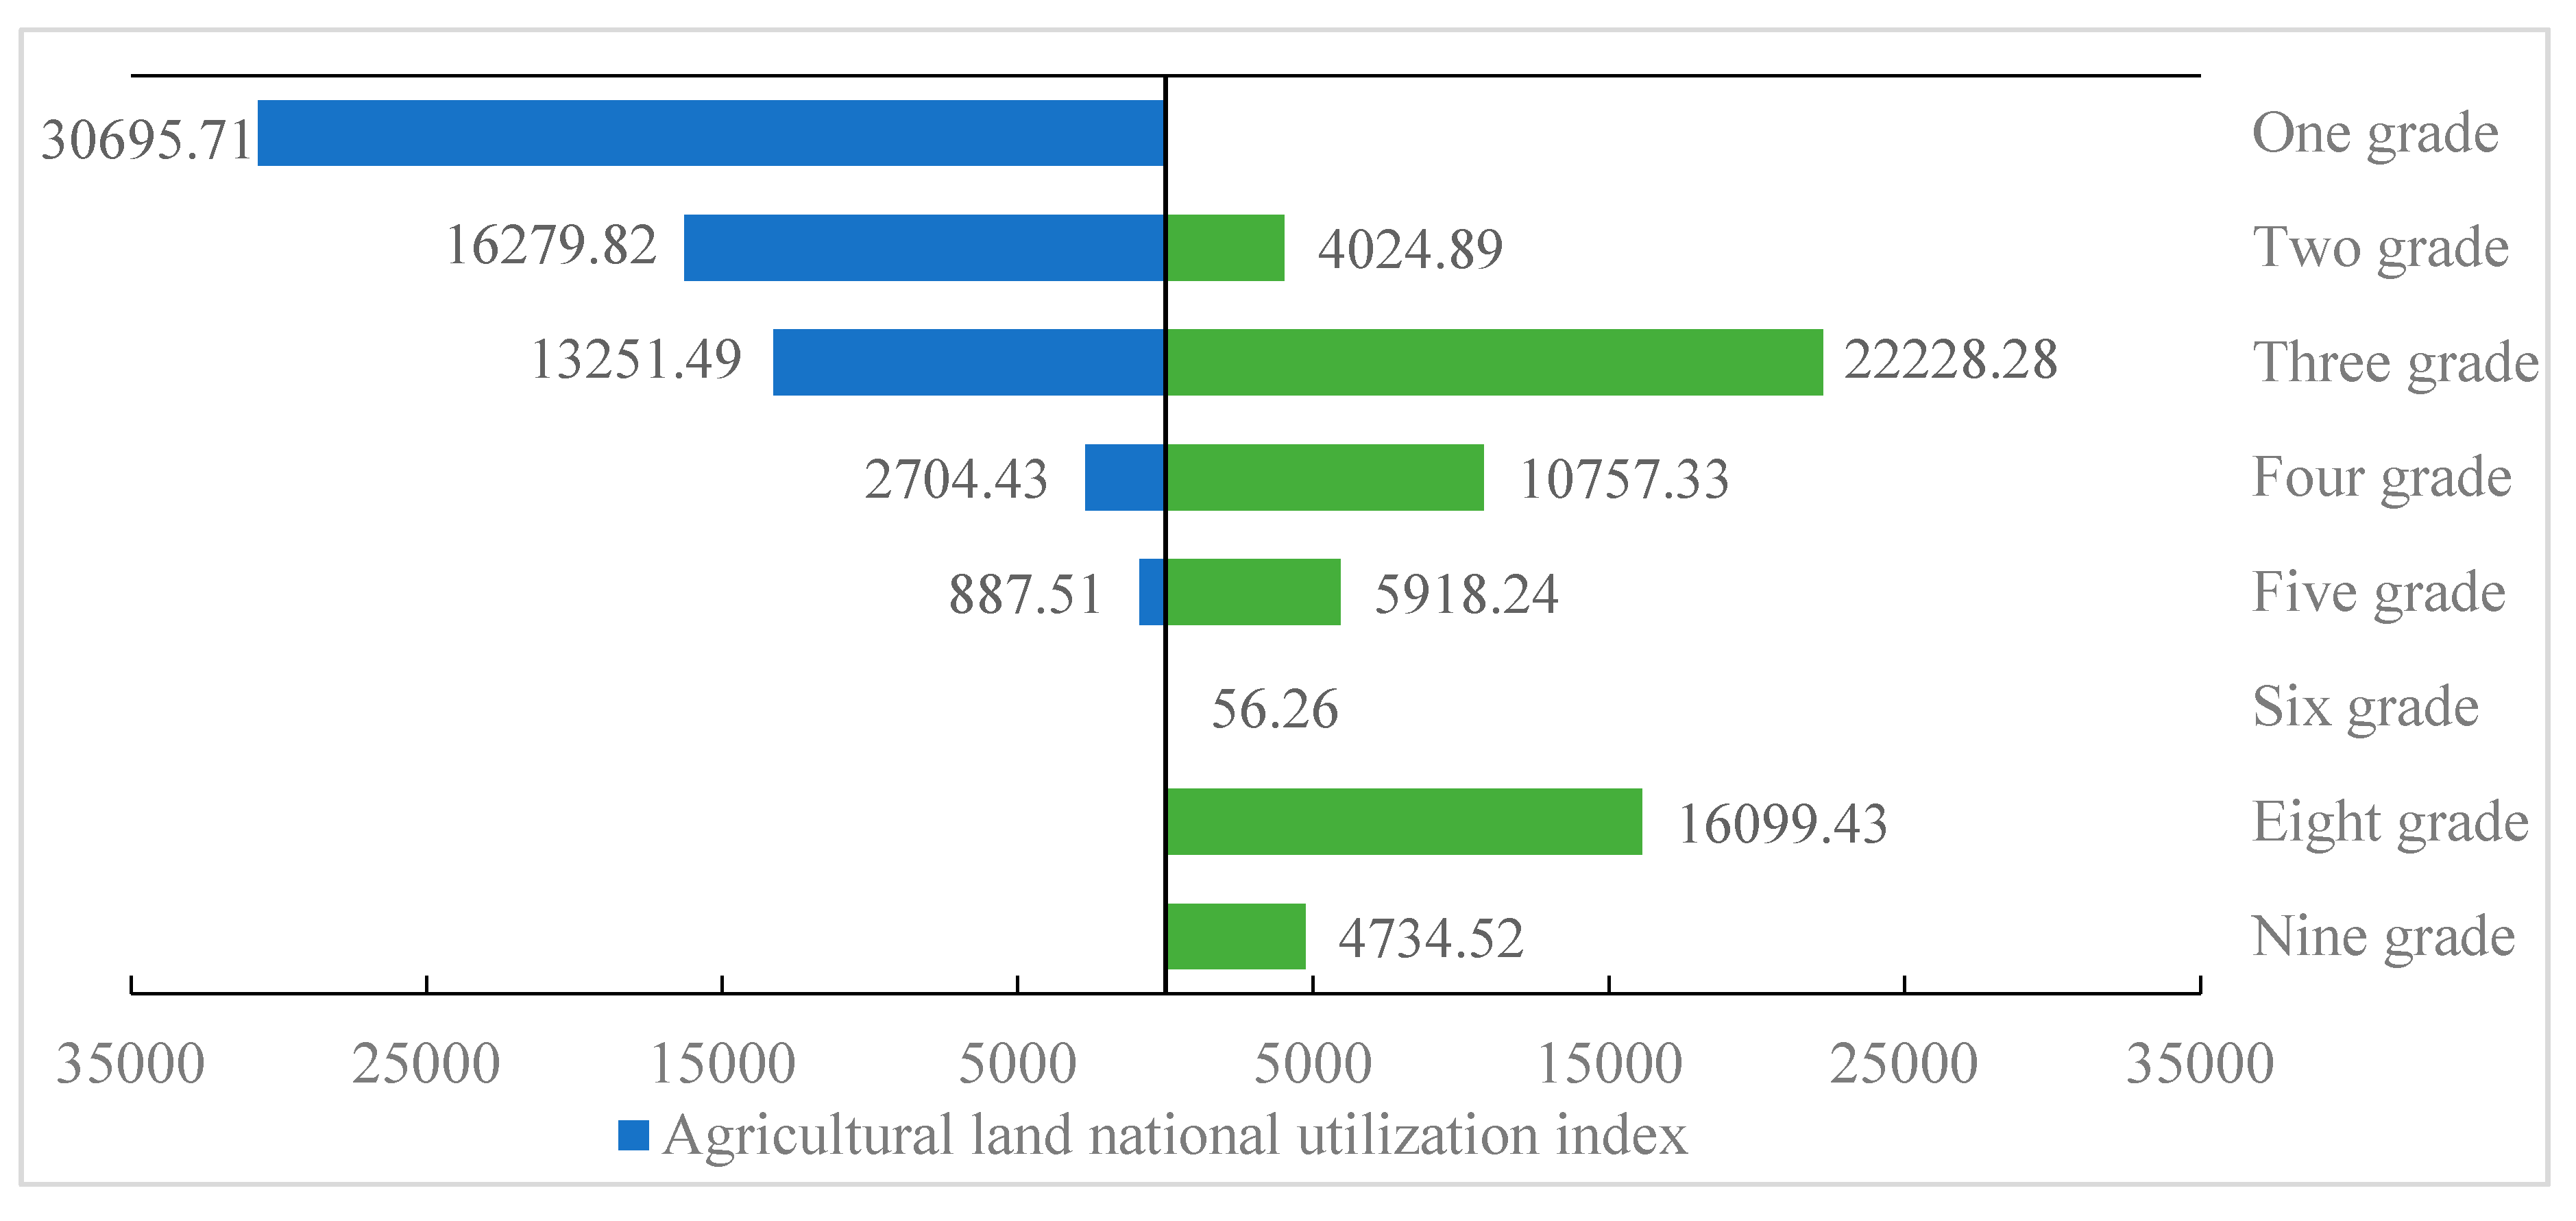
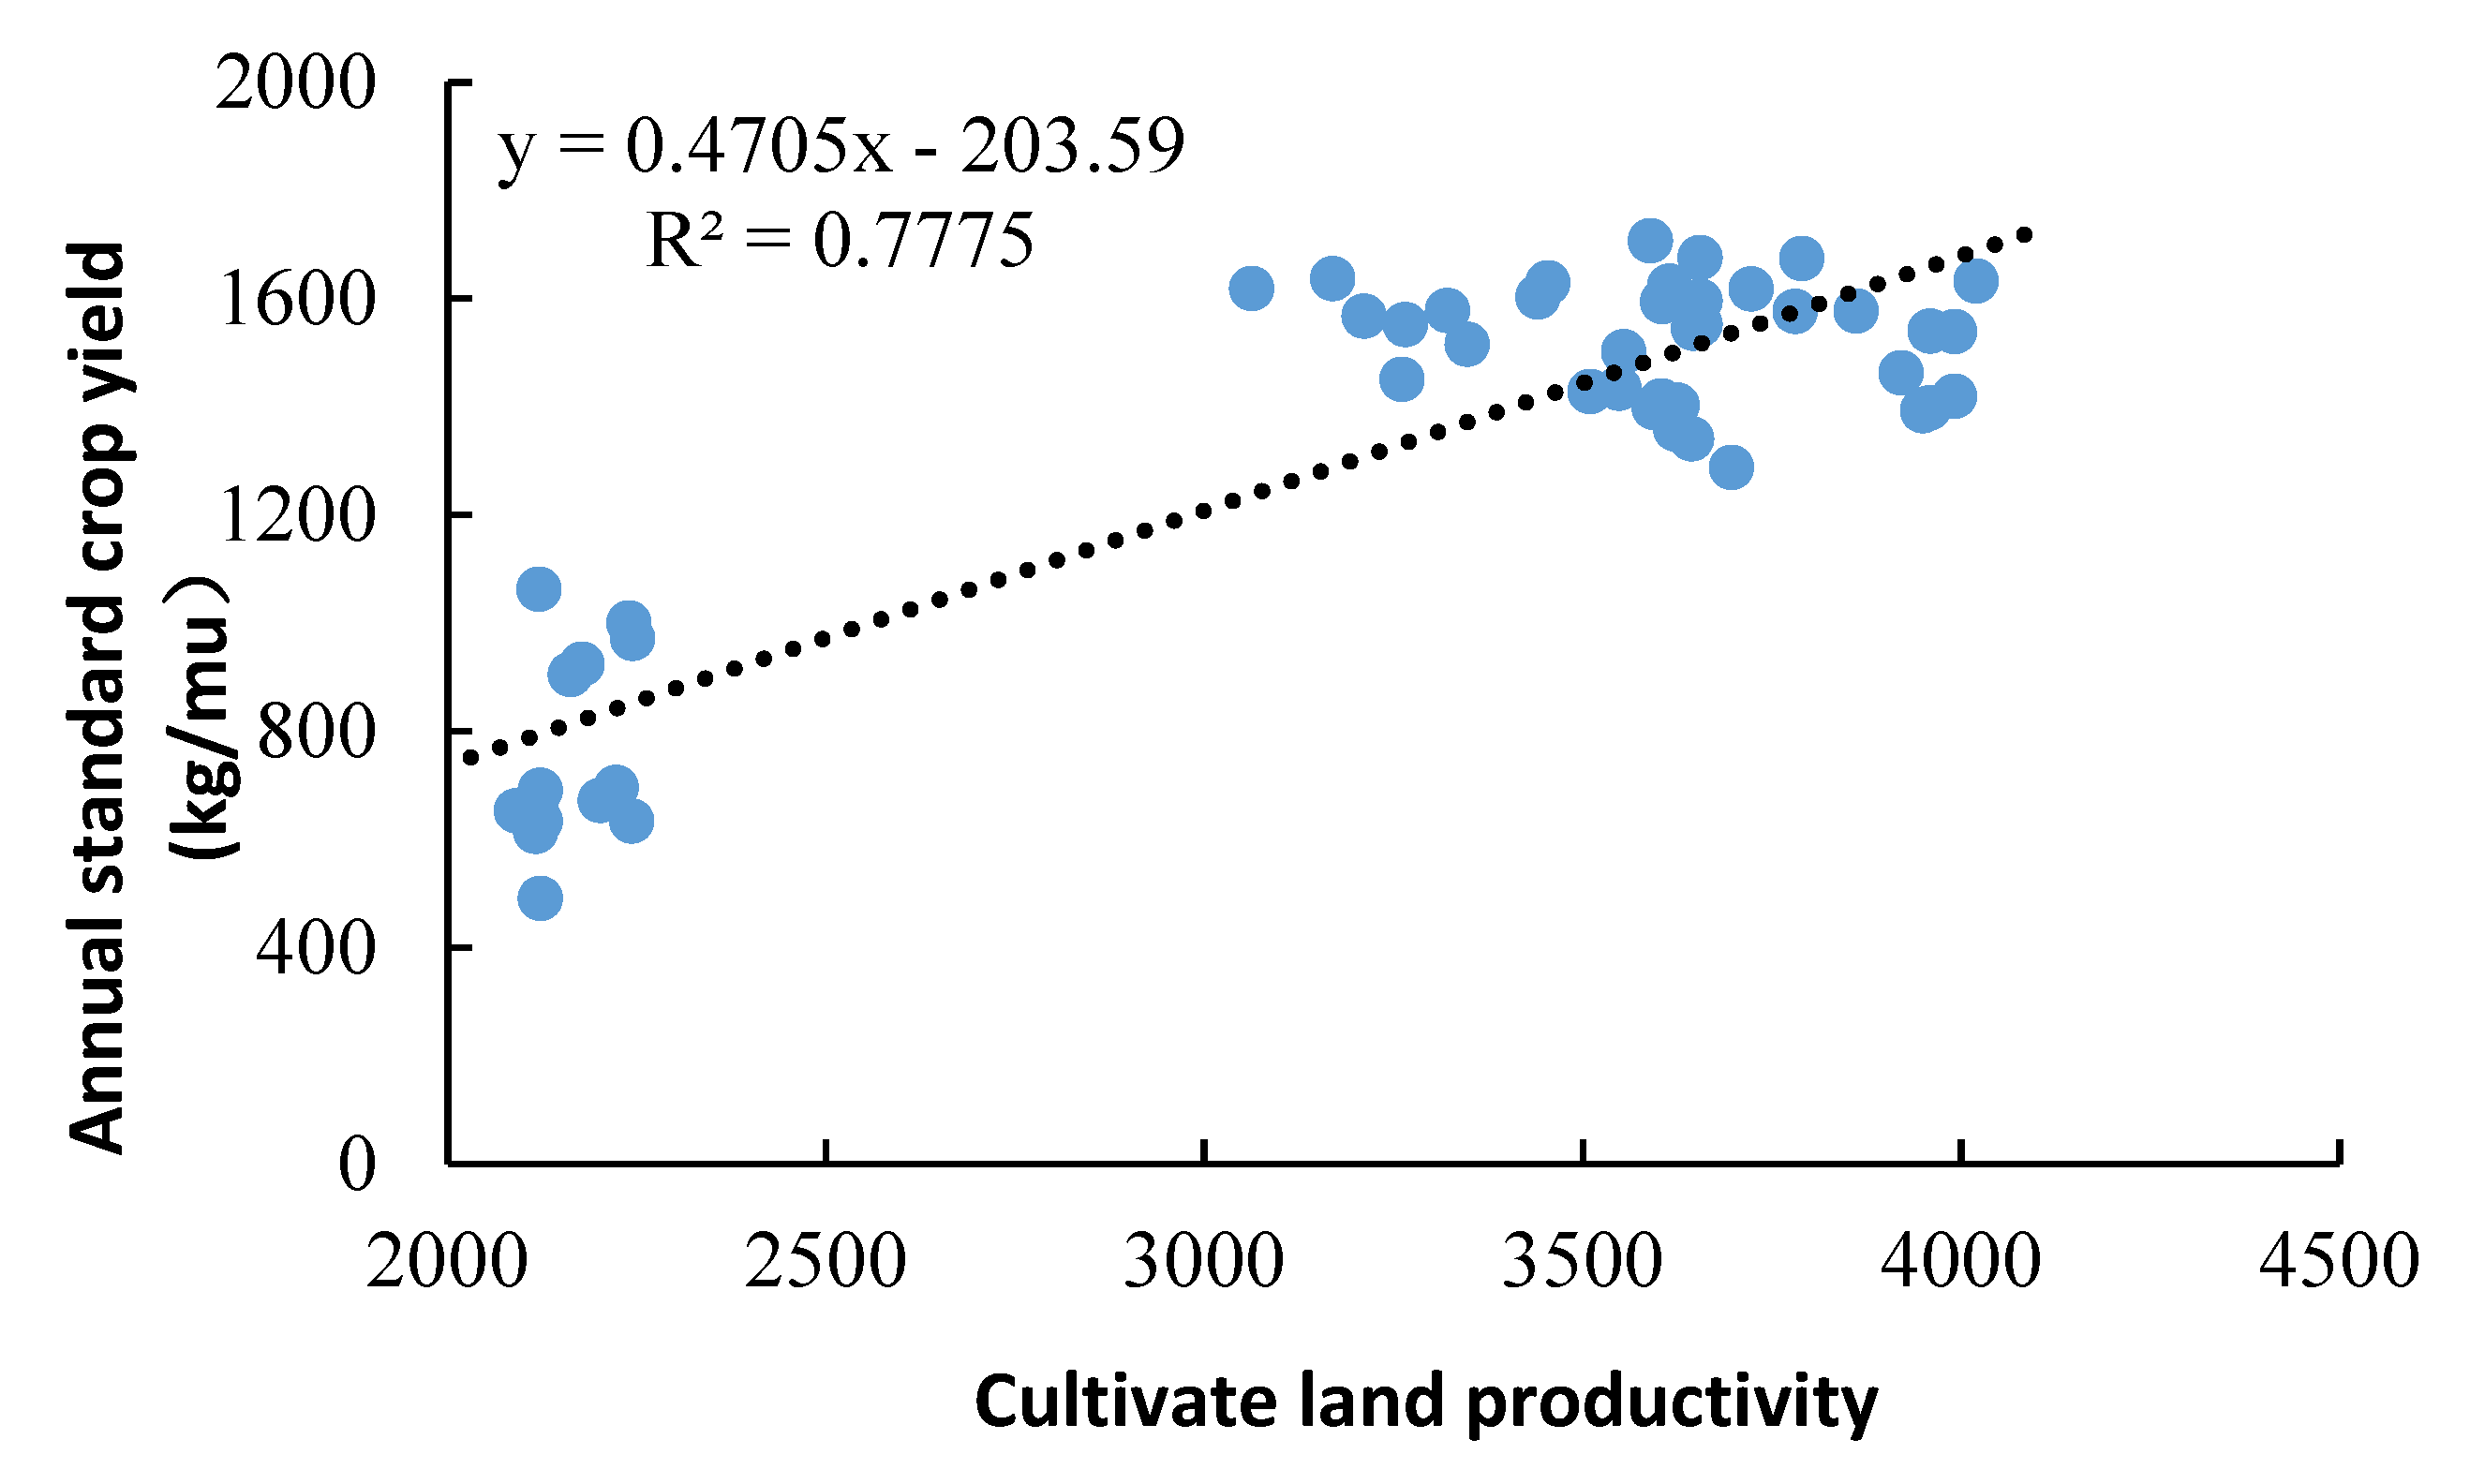
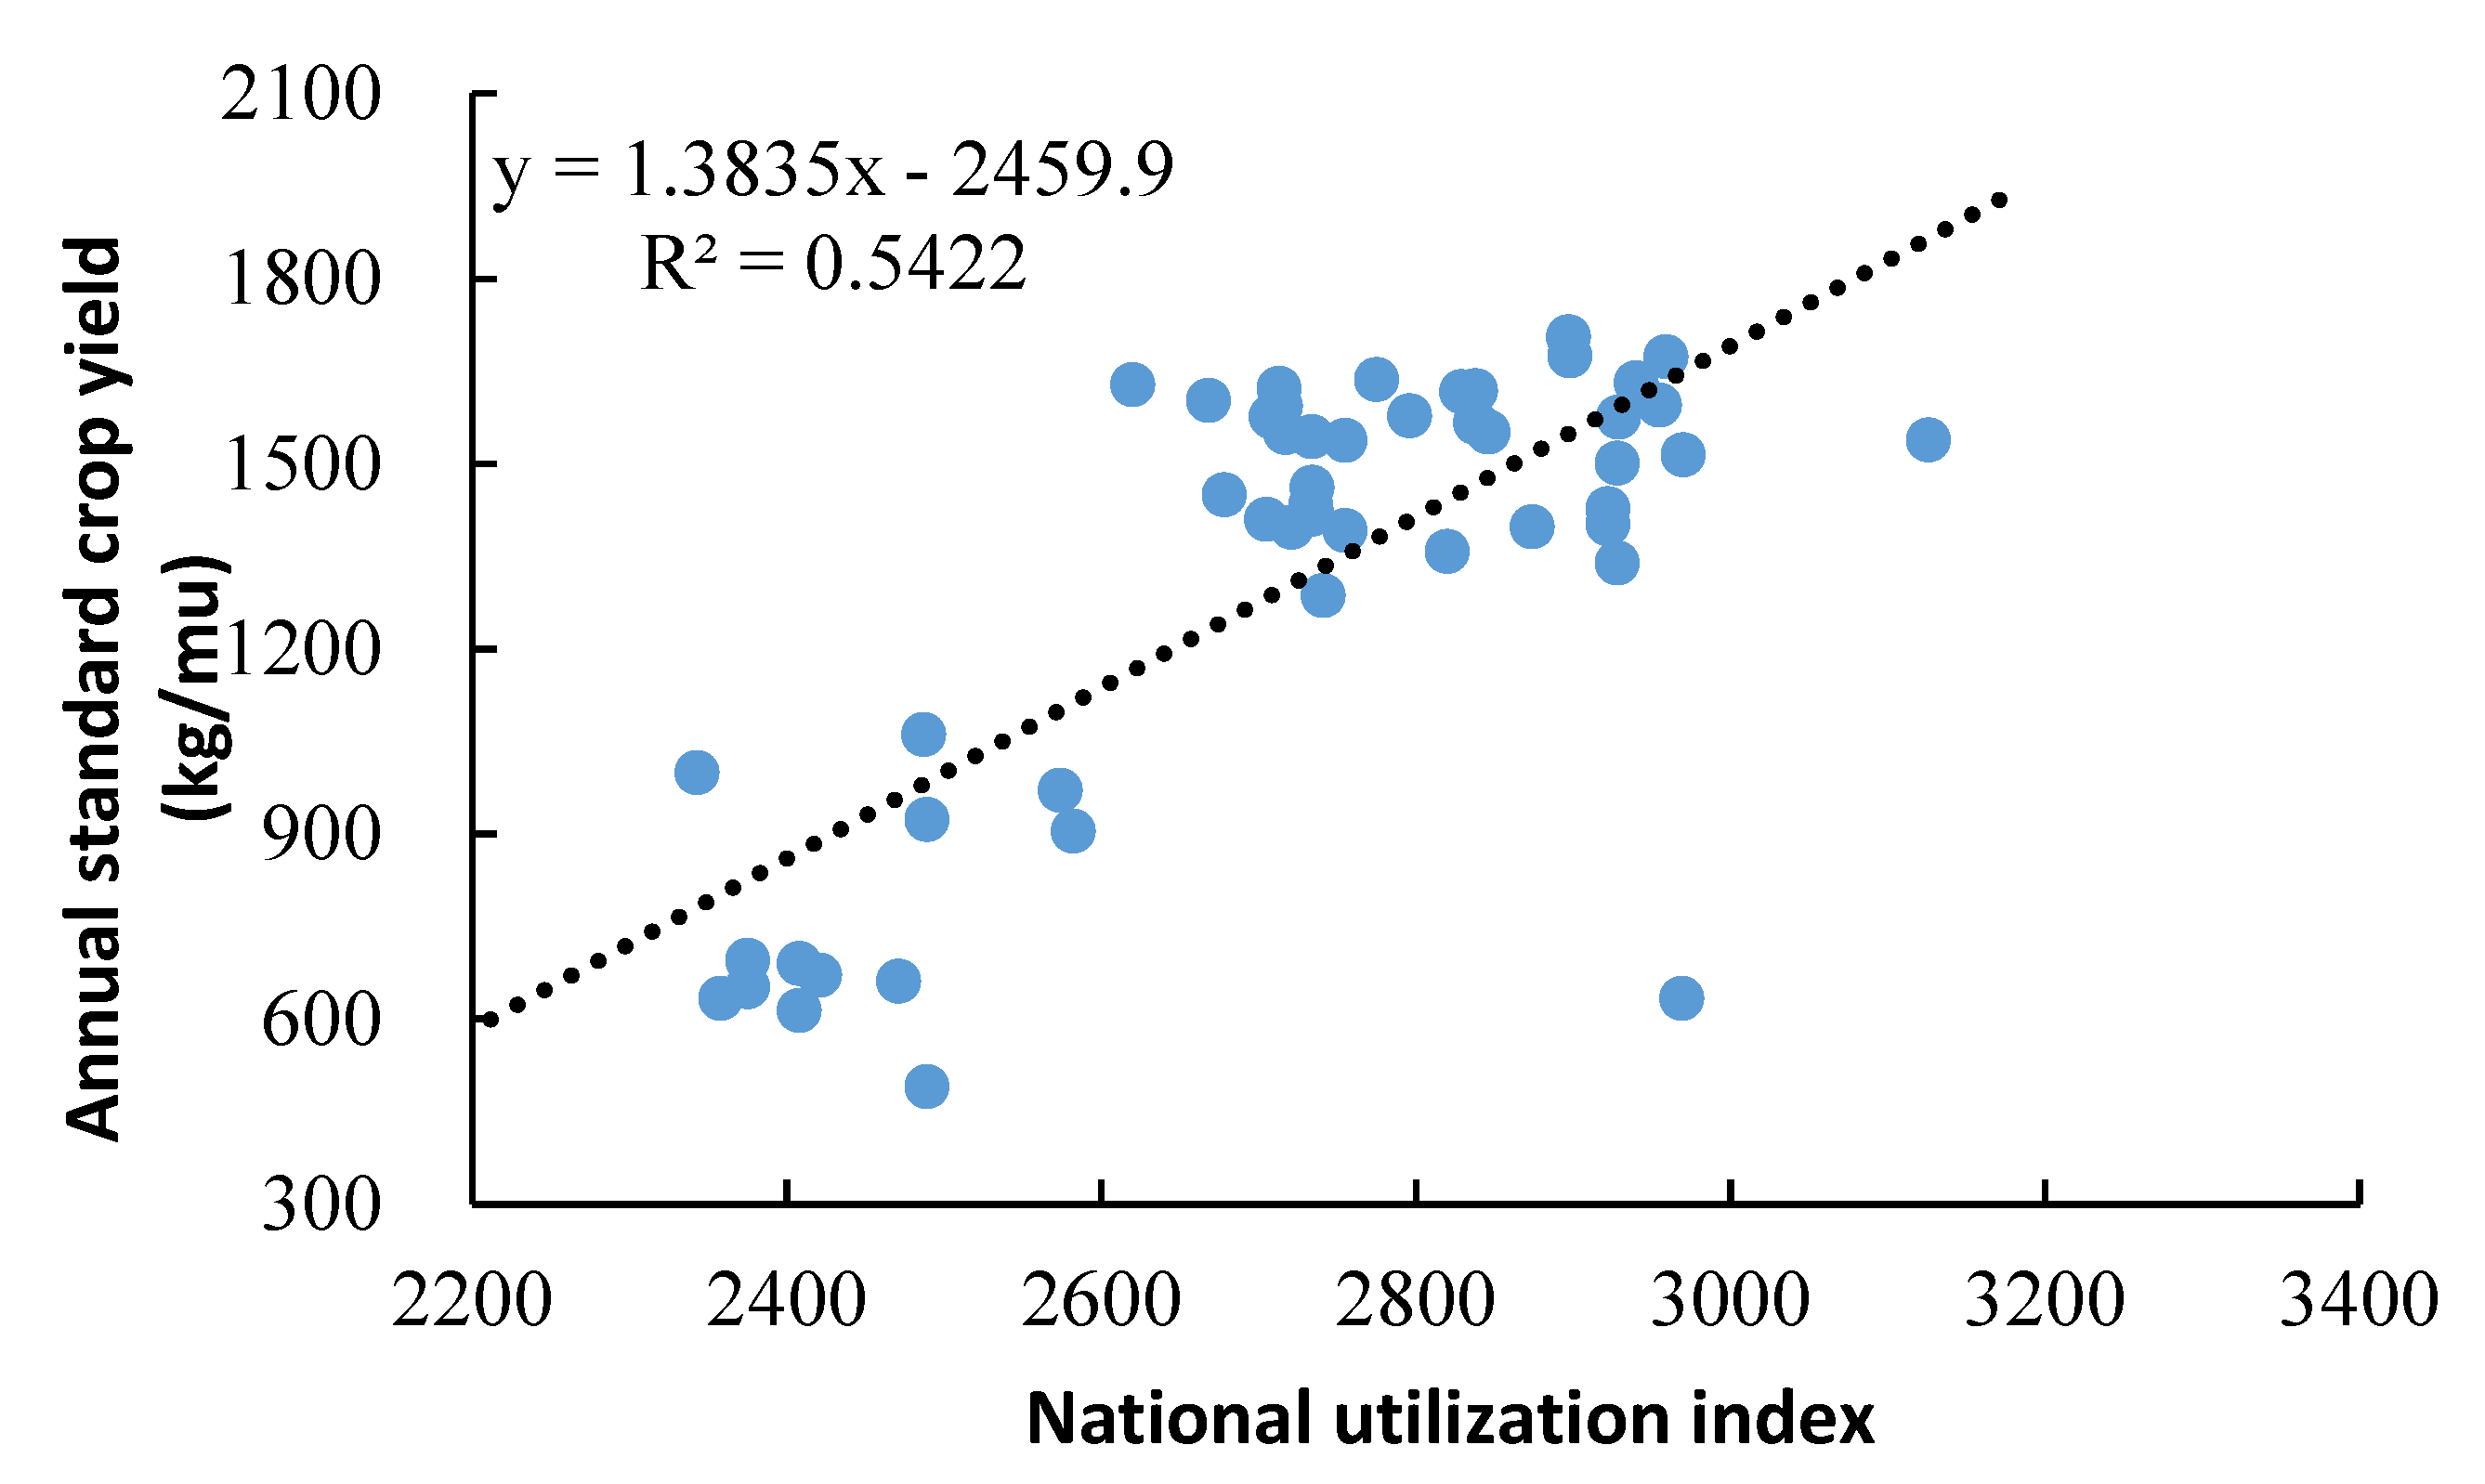
3.3. Comparative Analysis of Cultivated Land Productivity Index and National Use Index

The quantitative structure, spatial distribution and linear correlation between the cultivated land productivity index and the national use index of agricultural land quality were compared and analyzed (Figure 9). The cultivated land area in the productivity classes of [4200, 4500], [3900, 4200] and [3600, 3900] was 26,253.17 ha, accounting for 41.14% of the total. Most of the agricultural cultivated land was located in the national use index classes of [2800, 3000], [2600, 2800] and [2400, 2600], which covered 60,227.02 ha (94.37%) of the total area. The cultivated land area in the productivity classes of [2700, 3000], [2100, 2400] and [1800, 2100] was 20,890.21 ha, accounting for 32.74% of the total. However, no agricultural cultivated land was located in other national use index classes. Compared with the agricultural cultivated lands in different use index classes, cultivated lands in different productivity classes showed a scattered distribution pattern, with the characteristics of a “dumbbell” structure. However, the distribution of agricultural cultivated lands in different use index classes was relatively concentrated, presenting the quantitative structure distribution of an “inverted pyramid”.
According to the spatial distribution characteristics of cultivated land in different classes, lands with productivity indexes in the high classes of [4200, 4500] and [3900, 4200] (grades 1 and 2) were mostly distributed at the northwest, north-central, northeast, southwest and south-central towns in Yuanjiang city, including Caowei, Gonghua, Huangmaozhou, Nandashan, Sanyantang and Sihushan towns, with an area of 3018.3 ha, which accounted for 74.99% of the total (Figure 6 and Figure 10). The agricultural cultivated lands in the national use index classes of [2800, 3000] and [2600, 2800] (grades 1 and 2) were mostly located at the northwest, north and northeast towns, including Caowei, Gonghua, Huangmaozhou, Nandashan and Luoyangzhou towns, with an area of 31,837.24 ha, which accounted for 67.77% of the total. In the low cultivated land productivity index class of [1800, 2100], lands were mostly located at the northwest, central-west and northeast towns, including Caowei, Gonghua and Nandashan towns, with an area of 2240.04 ha, which accounted for 47.32% of the total. Similarly, in the lower classes of the agricultural cultivated land national use index at [2000, 2200], most of the lands were located at the northwest, north and northeast towns, including Caowei and Gonghua towns, with an area of 770.62 ha, which accounted for 86.83% of the total. In general, the spatial distribution trend of cultivated land in the relatively high classes of the productivity index and the national use index of agricultural land were relatively consistent, except that the coverage was different.
Correlations were analyzed between the annual standard crop yield, the cultivated land productivity index and the national use index of agricultural cultivated land (Figure 11 and Figure 12). Annual standard crop yield was calculated based on the actual yields of different crop species. A significant positive correlation was determined between annual standard crop yield and the productivity index and national use index, with R2 values of 0.7775 and 0.5422 and correlation coefficients of 0.8817 and 0.7363, respectively. The linear regression model performed better with the annual standard crop yield and productivity index, implying that the results that were obtained from the evaluation of cultivated land productivity better reflect the production capacity of local crops.

4. Discussion and Conclusions

4.1. Discussion

The cultivated land use system is a complex system of human and natural processes that is affected by natural environmental factors and socio-economic factors. The results of the cultivated land productivity showed that it was both comprehensive and able to deal with complexity. In fact, the cultivated land production capacity reflects the cultivated land productivity level and output effect, which is greatly affected by land potential, climate condition and labor condition. On one hand, the evaluation result of cultivated land productivity needs to reflect the productivity level of cultivated land under the co-constraint conditions of natural and soil factors. On the other hand, it needs to reflect the constraint of human management measures on the productivity level of cultivated land. The difficulty of the evaluation of cultivated land productivity lies in the indexes selection and quantitative measurement based on three core concepts of geological condition, soil character and tillage technology. This paper focused on the evaluation and comparative analysis of cultivated land productivity in a specific period and a specific region. However, the time scale variation of cultivated land productivity and the sensitivity of index weight were involved. A further breakthrough needs to be made in the subsequent research on the accumulation of multi-source data and methods.
Due to the mismatch of data sources and the inconsistency of weights and methods in most evaluation research, it is often difficult to avoid the discrepancy between the descriptions of the real situation of the region and the evaluation results. In this paper, we believe that subjective weighting is better than objective weighting on the calculation of index weight. This is due to the results of entropy value method, which is mainly affected by data with larger variation, based on the principle in reflecting the difference between indicators. However, it can be found that not every index with great variations is important for the evaluation of the cultivated land productivity which involves multiple indexes. Therefore, it is necessary to make index weight control with subjective judging.
The level of demand for cultivated land productivity is changing with rapid socio-economic development, from the initial pursuit of high yield, stable production to ecological, safe and sustainable production. With the progress of science and technology, modern agricultural infrastructure has been improved and advanced agricultural technology has been gradually popularized and applied. In different development stages, the influence of single factor or multiple factor coupling on cultivated land productivity is changing. Therefore, future research should focus on how to comprehensively consider the impact of various factors on cultivated land productivity, and further optimizing the evaluation index framework, classification method and valuation rules to build a practical evaluation system for cultivated land productivity.

4.2. Conclusions

This paper constructed a comprehensive evaluation index of cultivated land productivity and, using a set of cultivated land points, carried out an empirical analysis of the production capacity of cultivated land from the multidimensional perspectives of the quantitative structure of cultivated land productivity, spatial differentiation and comparison with national use indexes. Yuanjiang city was used as the research area. The conclusions were as follows.
First, Yuanjiang city had a productive natural environment and good farming conditions. The cultivated land productivity index ranged from 1642.79 to 4140.09 and was concentrated in classes from 2 to 6. Different land types varied in terms of cultivated land productivity index, and paddy field was better than dry land and irrigated land. The cultivated land productivity index of different towns presented four kinds of quantitative structure distributions, namely the “inverted pyramid”, “dumbbell”, “pyramid-shaped” and “spindle-type”.
Second, the regional distribution of cultivated land productivity in Yuanjiang city showed a pattern of variation, with a spatial distribution trend of decreasing from north to south and increasing from the center to the periphery. The cultivated lands with relatively high productivity were mainly distributed in the northwest, southwest, northeast and south-central areas of Yuanjiang city. The dominant factors that were influencing the variation of the cultivated land productivity index were different in different classes. When the class changed from low to medium, climate condition factors were most important, while when the classes changed from medium to high, tillage technology and cultivated land quality were dominant.
Finally, cultivated lands in different productivity classes were scattered, showing the distribution characteristics of a “dumbbell” quantity structure. However, the distribution of agricultural cultivated lands in different use index classes was relatively concentrated, showing the quantitative structure distribution of an “inverted pyramid”. The spatial distribution trend of cultivated land in the higher value classes of the productivity index and the national use index of agricultural land were relatively consistent, except that the coverage was different. According to the correlation analysis, the results that were obtained from the evaluation of cultivated land productivity reflect the production capacity of local crops better than those from the evaluation of the national use of agricultural cultivated land.

Author Contributions

Funding acquisition, Y.Z.; methology, X.L.; investigation, P.X.; writing-original draft preparation, C.Z., X.L. and J.J.; writing-review and editing, C.Z. and X.L.

Funding

This research was funded by the National Natural Science Foundation of China, grant number 41271534; This research was funded by self-determined research funds of Central China Normal University, grant number CCNU18TS023 and CCNU15A05008.

Conflicts of Interest

The authors declare no conflict of interest.

References

  1. Li, H.; Zhang, X.; Zhang, X.; Wu, Y. Utilization benefit of cultivated land and land institution reforms: Economy, society and ecology. Habitat Int. 2018, 77, 64–70. [Google Scholar] [CrossRef]
  2. Jiang, G.; Zhang, R.; Ma, W.; Zhou, D.; Wang, X.; He, X. Cultivated land productivity potential improvement in land consolidation schemes in Shenyang, China: Assessment and policy implications. Land Use Policy 2017, 68, 80–88. [Google Scholar] [CrossRef]
  3. Li, H.; Wu, Y.; Huang, X.; Sloan, M.; Skitmore, M. Spatial-temporal evolution and classification of marginalization of cultivated land in the process of urbanization. Habitat Int. 2017, 61, 1–8. [Google Scholar] [CrossRef]
  4. Li, W.; Wang, D.; Li, H.; Liu, S. Urbanization-induced site condition changes of peri-urban cultivated land in the black soil region of northeast China. Ecol. Indic. 2017, 80, 215–223. [Google Scholar] [CrossRef]
  5. Huang, M.; Zou, Y. Integrating mechanization with agronomy and breeding to ensure food security in China. Field Crop. Res. 2018, 224, 22–27. [Google Scholar] [CrossRef]
  6. Prosekov, A.Y.; Ivanova, S.A. Food security: The challenge of the present. Geoforum 2018, 91, 73–77. [Google Scholar] [CrossRef]
  7. Jin, X.; Zhang, Z.; Wu, X.; Xiang, X.; Sun, W.; Bai, Q.; Zhou, Y. Co-ordination of land exploitation, exploitable farmland reserves and national planning in China. Land Use Policy 2016, 57, 682–693. [Google Scholar] [CrossRef]
  8. Li, T.; Long, H.; Zhang, Y.; Tu, S.; Ge, D.; Li, Y.; Hu, B. Analysis of the spatial mismatch of grain production and farmland resources in China based on the potential crop rotation system. Land Use Policy 2017, 60, 26–36. [Google Scholar] [CrossRef]
  9. Cheng, Q.; Jiang, P.; Cai, L.; Shan, J.; Zhang, Y.; Wang, L.; Li, M.; Li, F.; Zhu, A.; Chen, D. Delineation of a permanent basic farmland protection area around a city centre: Case study of Changzhou City, China. Land Use Policy 2017, 60, 73–89. [Google Scholar] [CrossRef]
  10. Bouma, J.; Batjes, N.H.; Groot, J.J.R. Exploring land quality effects on world food supply. Geoderma 1998, 86, 43–59. [Google Scholar] [CrossRef]
  11. Dung, E.J.; Sugumaran, R. Development of an agricultural land evaluation and site assessment (LESA) decision support tool using remote sensing and geographic information system. J. Soil Water Conserv. 2005, 60, 228–235. [Google Scholar]
  12. Williams, J.R.; Jones, C.A.; Kiniry, J.R.; Spanel, D.A. The EPIC Crop Growth Model. Trans. Chin. Soc. Agric. Eng. 1989, 32, 497–511. [Google Scholar] [CrossRef]
  13. Hill, M.J.; Senarath, U.; Lee, A.; Zeppel, M.; Nightingale, J.M.; Williams, R.D.J.; McVicar, T.R. Assessment of the MODIS LAI product for Australian ecosystems. Remote Sens. Environ. 2006, 101, 495–518. [Google Scholar] [CrossRef]
  14. Döös, B.R.; Shaw, R. Can we predict the future food production? A sensitivity analysis. Glob. Environ. Chang. 1999, 9, 261–283. [Google Scholar] [CrossRef] [Green Version]
  15. Huang, B.W. Sixty Years of Comprehensive Work in Natural Geography—Huang Bingwei’s Anthology, 1st ed.; Science Press: Beijing, China, 1993; pp. 183–196. ISBN 9787030033421. [Google Scholar]
  16. Cao, M.; Ma, S.; Han, C. Potential productivity and human carrying capacity of an agro-ecosystem an analysis of food production potential of China. Agric. Syst. 1995, 47, 387–414. [Google Scholar] [CrossRef]
  17. Zhang, X.; Liu, W. Simulating potential response of hydrology, soil erosion, and crop productivity to climate change in Changwu tableland region on the Loess Plateau of China. Agric. For. Meteorol. 2005, 131, 127–142. [Google Scholar] [CrossRef]
  18. Deng, X.; Huang, J.; Rozelle, S.; Uchida, E. Cultivated land conversion and potential agricultural productivity in China. Land Use Policy 2006, 23, 372–384. [Google Scholar] [CrossRef]
  19. Yan, H.; Liu, J.; Huang, H.Q.; Tao, B.; Cao, M. Assessing the consequence of land use change on agricultural productivity in China. Glob. Planet. Chang. 2009, 67, 13–19. [Google Scholar] [CrossRef]
  20. Xiao, L.; Yang, X.; Cai, H.; Zhang, D. Cultivated Land Changes and Agricultural Potential Productivity in Mainland China. Sustainability 2015, 7, 11893–11908. [Google Scholar] [CrossRef] [Green Version]
  21. Song, W.; Pijanowski, B.C.; Tayyebi, A. Urban expansion and its consumption of high-quality farmland in Beijing, China. Ecol. Indic. 2015, 54, 64–70. [Google Scholar] [CrossRef]
  22. Song, W. Decoupling cultivated land loss by construction occupation from economic growth in Beijing. Habitat Int. 2014, 43, 198–205. [Google Scholar] [CrossRef]
  23. Li, Y.; Wu, H.; Shi, Z. Farmland productivity and its application in spatial zoning of agricultural production: A case study in Zhejiang province, China. Environ. Earth Sci. 2016, 75, 159. [Google Scholar] [CrossRef]
  24. Zhang, B.; Zhang, Y.; Chen, D.; White, R.E.; Li, Y. A quantitative evaluation system of soil productivity for intensive agriculture in China. Geoderma 2004, 123, 319–331. [Google Scholar] [CrossRef]
  25. Duan, X.; Li, R.; Zhang, G.; Hu, J.; Fang, H. Soil productivity in the Yunnan province:_Spatial distribution and sustainable utilization. Soil Tillage Res. 2015, 147, 10–19. [Google Scholar] [CrossRef]
  26. Yang, Z.; Yu, T.; Hou, Q.; Xia, X.; Feng, H.; Huang, C.; Wang, L.; Lv, Y.; Zhang, M. Geochemical evaluation of land quality in China and its applications. J. Geochem. Explor. 2014, 139, 122–135. [Google Scholar] [CrossRef]
  27. Liu, Y.; Zhang, Y.; Guo, L. Towards realistic assessment of cultivated land quality in an ecologically fragile environment: A satellite imagery-based approach. Appl. Geogr. 2010, 30, 271–281. [Google Scholar] [CrossRef]
  28. Fan, M.; Shen, J.; Yuan, L.; Jiang, R.; Chen, X.; Davies, W.J.; Zhang, F. Improving crop productivity and resource use efficiency to ensure food security and environmental quality in China. J. Exp. Bot. 2012, 63, 13–24. [Google Scholar] [CrossRef] [PubMed]
  29. Xiong, W.; Conwan, D.; Holman, L.; Lin, E. Evaluation of CERES-Wheat simulation of Wheat Production in China. Agron. J. 2008, 100, 1720–1728. [Google Scholar] [CrossRef]
  30. Tian, Z.; Zhong, H.; Sun, L.; Fischer, G.; Velthuizen, H.V.; Liang, Z. Improving performance of Agro-Ecological Zone (AEZ) modeling by cross-scale model coupling: An application to japonica rice production in Northeast China. Ecol. Model. 2014, 290, 155–164. [Google Scholar] [CrossRef]
  31. Gu, Z.; Xie, Y.; Gao, Y.; Ren, X.; Cheng, C.; Wang, S. Quantitative assessment of soil productivity and predicted impacts of water erosion in the black soil region of northeastern China. Sci. Total Environ. 2018, 637–638, 706–716. [Google Scholar] [CrossRef] [PubMed]
  32. Kong, X.B. Influence of Land Use Transformation of Regional Farmers on the Quality of Cultivated Land, 1st ed.; Science Press: Beijing, China, 2012; pp. 11–20, (In Chinese). ISBN 9787030395337. [Google Scholar]
  33. Song, W.; Pijanowski, B.C. The effects of China’s cultivated land balance program on potential land productivity at a national scale. Appl. Geogr. 2014, 46, 158–170. [Google Scholar] [CrossRef]
Figure 1. Distribution of sampling points in the Yuanjiang City study area.
Sustainability 10 03616 g001
Figure 2. The framework for the evaluation of cultivated land productivity.
Sustainability 10 03616 g002
Figure 3. The work flow chart for the evaluation of cultivated land productivity.
Sustainability 10 03616 g003
Figure 4. The proportion of cultivated land in different land productivity classes.
Sustainability 10 03616 g004
Figure 5. The comparison of cultivated land productivity in different towns.
Sustainability 10 03616 g005
Figure 6. The comparison of cultivated land productivity for different towns in the same index class.
Sustainability 10 03616 g006
Figure 7. Spatial distribution of farmland productivity in Yuanjiang City.
Sustainability 10 03616 g007
Figure 8. The comparison of cultivated land productivity in different classes.
Sustainability 10 03616 g008
Figure 9. The comparison of the cultivated land area in the productivity index and in the national land use index.
Sustainability 10 03616 g009
Figure 10. Spatial distribution of different levels of the national land use index in Yuanjiang City.
Sustainability 10 03616 g010
Figure 11. The scatter plot of the cultivated land productivity index and the surrounding standard grain output.
Sustainability 10 03616 g011
Figure 12. The scatter plot of the national land use index and the surrounding standard grain output.
Sustainability 10 03616 g012
Table 1. The evaluation index system for cultivated land productivity.
Primary IndicatorSecondary IndicatorWeight
Cultivated land productivityClimate conditionLight and temperature productivity potential Crop yield ratio--
--
Cultivated land qualityGeological conditionsTerrain area0.50
Field slope0.50
Soil propertiesEffective soil thickness0.12
Organic matter content0.11
Farming layer texture0.21
Obstacle course type and depth from the surface0.04
Soil configuration0.21
Soil bulk density0.10
Soil nutrient element0.21
Tillage technologyIrrigation guarantee rate0.16
The drainage condition0.30
Disease and insect pest control level0.08
Field flood control standard0.07
Agricultural machinery and equipment0.26
Agronomic management0.13
Table 2. The area and productivity index for different types of cultivated land in Yuanjiang city.
Productivity Index
[3900, 4200][3600, 3900][3300, 3600][3000, 3300][2700, 3000][2100, 2400][1800, 2100]
Land typePaddy fieldArea (hectare)4024.8922,228.2810,757.335918.2456.26————
Ratio (%)9.3651.7125.0313.770.13————
Irrigated landArea (hectare)——————————48.495.92
Ratio (%)——————————89.1110.89
Dry landArea (hectare)——————————16,050.934728.60
Ratio (%)——————————77.2422.76
TotalArea (hectare)4024.8922,228.2810,757.335918.2456.2616,099.434734.52
Ratio (%)6.3134.8316.869.270.0925.237.42
Table 3. The comparison of the technical level of land quality and of climatical condition in same land productivity classes.
Grade Section of Cultivated Land Productivity IndexTechnical LevelCultivated Land QualityClimate Condition
[3900, 4200]0.990.761
[3600, 3900]0.750.641
[3300, 3600]0.410.561
[3000, 3300]0.020.511
[2700, 3000]00.151
[2100, 2400]0.540.700
[1800, 2100]0.410.520

