1. Introduction
Since the late 20th century, firms’ boundaries started to fade away worldwide, and businesses entered a hypercompetitive state [
1]. This phenomenon is becoming more prevalent in the 21st century, and the boundaries of the electronics industry, automobile manufacturing industry, telecommunications industry, and airline industry are not as obvious as they were before. As a result, technology-intensive firms’ successes and failures can be determined in a short period of time. Semiconductor firms hugely affect this ever-changing environment of industry.
Firms constantly need their growth engine to survive and prosper in the marketplace through new product development practices. New product development (NPD) is not an option but a mandate for firms not to stay in the status quo. Existing products never help firms reach their full potential. How to effectively manage NPD determines the sustainable growth of firms. For this reason, existing research has focused on examining various factors to leverage NPD and testing how they affect NPD performance.
For example, Rothaermel and Deeds (2004) explored how to maximize the effectiveness of NPD through gradual R&D investment and strategic alliances with appropriate organizations [
2]. Petersen et al. (2005) examined how supplier involvement and management influence financial performance in the value chain [
3]. They proposed a NPD framework using such variables as product advantage, organization, technology synergy, market synergy and proficiency of market related activities.
Although they offer useful insights on NPD, their research focused on the external environment of NPD, not the products themselves. There is a need to examine NPD from the product-level development viewpoint and explore key technological factors that affect this development. As Coombs and Bierly (2006) argued, superior technological advancement makes a firm stand out in the race of product development with other firms and this is particularly true with a technology-intensive market environment [
4].
Cooper and Kleinschmidt (1987) proposed nine NPDs, which include product advantage, market potential, market competitiveness, marketing synergy, technological synergy, protocol, proficiency of predevelopment, proficiency of market related activities, and proficiency of technological activities [
5]. Among these nine, product advantage, protocol, and proficiency of predevelopment are related to product-level NPD. They suggest that it would be more effective when firms apply a platform concept to a product family, having superior technology. In this paper, deriving from the formula developed by Kang and Montoya (2013), we proposed a new variable, product platform efficiency, and empirically tested it, which is the contribution of our paper [
6]. Kang and Montoya (2013) suggested a formula of pioneering intensity [
6]. This formula is the rate of first-to-market launches in the product portfolio (the number of first-to-market products/the number of new products).
According to the resource-based view (RBV) of a firm, technological capability is an intangible asset which cannot be easily imitated from the competitors [
4,
7,
8,
9,
10]. This asset is especially critical for technology-intensive firms (Coombs and Bierly, 2006) [
4]. Extant research on technology capability, however, was viewed as an internal resource of the firm, but few studies examined how this resource influences firms’ financial performance through new product development. Therefore, in this paper, we empirically investigate how technology capability through new product development positively affects the financial performance of the firm. To the authors’ knowledge, few papers have conducted a large-scale empirical study on this topic. Therefore, this contributes to the current literature of strategic management.
The current study chose fabless semiconductor firms as the main context of research because the fabless semiconductor industry is highly technology-intensive and is less affected by material, manufacturing, capital, workforce and outside suppliers in the value chain of the semiconductor industry [
11]. Therefore, by selecting fabless semiconductor firms, we are able to more effectively explore the effects of technological factors on firms’ financial performance.
Many firms now have areas of specialization, including IDM (integrated device manufacturer), foundry, and fabless semiconductor sectors. IDM firms have technologies regarding design and fabrication. Foundry firms only have fabrication facilities. IDM and foundry firms require large work forces and capital for fabrication. Fabless semiconductor firms only design, so they do not need capital and workforce, which are required for fabrication [
12].
Financial performance is an important headstone to firms for their survival and growth since firms cannot survive without a good connection between financial performance and new product development [
13]. Thus, we analyze technological capability and new product development, which are especially important for the financial performance of fabless semiconductor firms. This research will examine the determinant factors that affect financial performance of fabless semiconductor firms.
Our research question is: are product platform efficiency and technology capability the driving or determining factors that positively lead to financial performance in the context of the fabless semiconductor industry? Based on our literature review, we highlight technological capability and product platform efficiency as two important determinants. Using 17,256 patents from 2005 to 2014 and financial data from 2012 to 2016 from 57 fabless semiconductor firms, this study empirically investigates how they influence the financial performance (growth and profitability) of the firms.
The rest of the paper consists of the following topics. In
Section 2, literature regarding technological capability, new product development, financial performance, and the semiconductor industry are reviewed and analyzed. In
Section 3, a structural equation model comprised of variables that define technological capability, new product development and financial performance are developed, and valid variables are selected for simulating structural equation modeling. In
Section 4, the research model is determined, and the structural equation simulation result is analyzed. In
Section 5, we summarize the investigation result and explain the cause. In
Section 6, we conclude with the contributions of this paper and propose a new product development strategy. The variable definition and literature are given in the
Appendix A (
Table A1).
2. Literature Review and Hypotheses
Until recently, the semiconductor industry has been dominated by the technology-driven innovation model to make high performance products in a short development period (e.g., Moore’s law states that the number of transistors on a microprocessor chip will double every two years [
14]). However, the radical transition of the new technology paradigm, for example, the emergence of the Internet of Things (IoT) and wearable devices, accelerates the mobilization, and the smallest form-factor requires technological performance to reach high-edge computing, low power consumption, and new flexible materials in the semiconductor industry [
14].
Numerous semiconductor chips should be integrated into a chip with a variety of functions such as communication, analog–digital converting, and digital signal processing because these extreme requirements can be achieved through optimizing design on the system-level instead of partial improvements made on the module-level. Also, customers want these to monitor and support specific things such as environmental conditions (e.g., air pollution, air pressure, or location), physical health (e.g., blood pressure, temperature, or heart rate), and autonomous driving (e.g., lane recognition, object detection, or parking assistance).
Therefore, during a planning period, a firm should consider new product development about gaining comparative advantages through procurement of the core products, especially for product customization beyond differentiation from the products of other competitors. Furthermore, a firm should build a product platform that encompasses the chip design and components shared by a set of products, which enables the firm to obtain diverse benefits from short product design time, efficient resource management, and likelihood of entering other markets [
15,
16].
2.1. Financial Performance
An important index in strategic management is financial performance [
17,
18,
19], since financial performance greatly affects a firm’s survival and growth [
20,
21]. There are numerous studies that measured performance from diverse aspects, such as efficiency, growth, profit, size, liquidity, success, failure, market share, and leverage [
20]. Since direct value should be chosen from financial performance related values for objectivity, growth and profitability are chosen, both of which are important [
22].
Logically, the correlation between growth and profitability is relatively high [
23]. However, from the literature review, we found that it is possible to have no correlation between a financial performance variable and another financial performance measure [
20]. Therefore, growth and profitability are analyzed individually [
24]. For example, to achieve long-term growth, a firm may sacrifice short-term profit, which suggests that growth and profitability should be viewed independently. This is especially true when R&D investment is high. For example, a firm may sacrifice short-term profit for long-term growth [
18,
25].
2.1.1. Growth
Many variables are used to express growth in other literature. For example, revenue, number of employees, market share, job generation, and number of acquisitions are used to describe growth [
20]. In this paper, we focused on financial values to describe growth because financial values are closely related to the survival of a firm.
2.1.2. Profitability
Many variables are used to describe profitability as well, including net profit, gross profit, and market to book [
20]. In this paper, we also focused on financial values to describe profitability because financial values are closely related to the survival of a firm.
2.2. New Product Development
For effective and efficient new product development, a firm needs to build a product platform. Product platforms greatly affect the performance of new product development, where performance is measured in cost, design, production lead time, flexibility, international operations, and R&D management [
26]. This paper analyzes fabless semiconductor firms and their efficiency of new product development from a product platform aspect.
2.2.1. Product Platform Efficiency
Product family design and platform-based product development have been continuously researched [
15], with a focus on product architecture, product variety, product portfolio, and product family positioning [
15]. To gain a competitive advantage, firms increase financial performance by diversifying their products [
27]. It is known that developing product families is an effective way to gain economies of scale while embracing increased market demand [
28,
29]. These products are applied to each market segment to create revenue, which in turn creates income.
Product family design is used when designing each product to plan concepts and logics in order to produce the next product quickly and accurately. It also enables a planning process that is capable of distributing plans according to each customer’s needs under the same framework [
15]. Market segment refers to the classification of customers’ needs into appropriate groups [
15]. Product families that target market segments are mapped, and the end products in each product family are provided to customers as a single package for sales.
There are two methods to plan the whole structure while designing the end products: product platform design and product customization design. There are two aspects in product platform design [
15]. The first aspect is about designing a core element and applying it to many different products [
30]. The second aspect is about efficiently developing systems and interfaces so that derived products can also be developed quickly and accurately. This paper follows the second aspect because this aspect is generally accepted in the automobile industry and the electronics industry.
Actual product design is completed by combining these core products with structure planning. Core products include IP (Intellectual Property) and parts that are used in the end product.
A better product platform enables the design of multiple products so that a firm can acquire many differentiated products, which can be used as a basis to enter other market segments.
As a result, a firm is faced with two choices. One of the choices is the strategy that values efficiency to achieve maximum performance, and the other choice is the strategy that reacts to every demand from the market to maximize the value creation. For example, a firm may choose from many different strategies with niche products to target scope economy to increase their share in a market. On the other hand, if there exists a dominant design or standardized product, then a platform-based product development strategy will be effective when considering product revisions, product development transaction costs, and shorter product cycles since it can achieve the maximum efficiency.
Product platform efficiency will be analyzed based on the classification above (
Table 1) [
28,
31]. Product platform efficiency is a method used to analyze whether or not a firm developed an end product by designing an efficient platform so that it can easily be applied to other market segments [
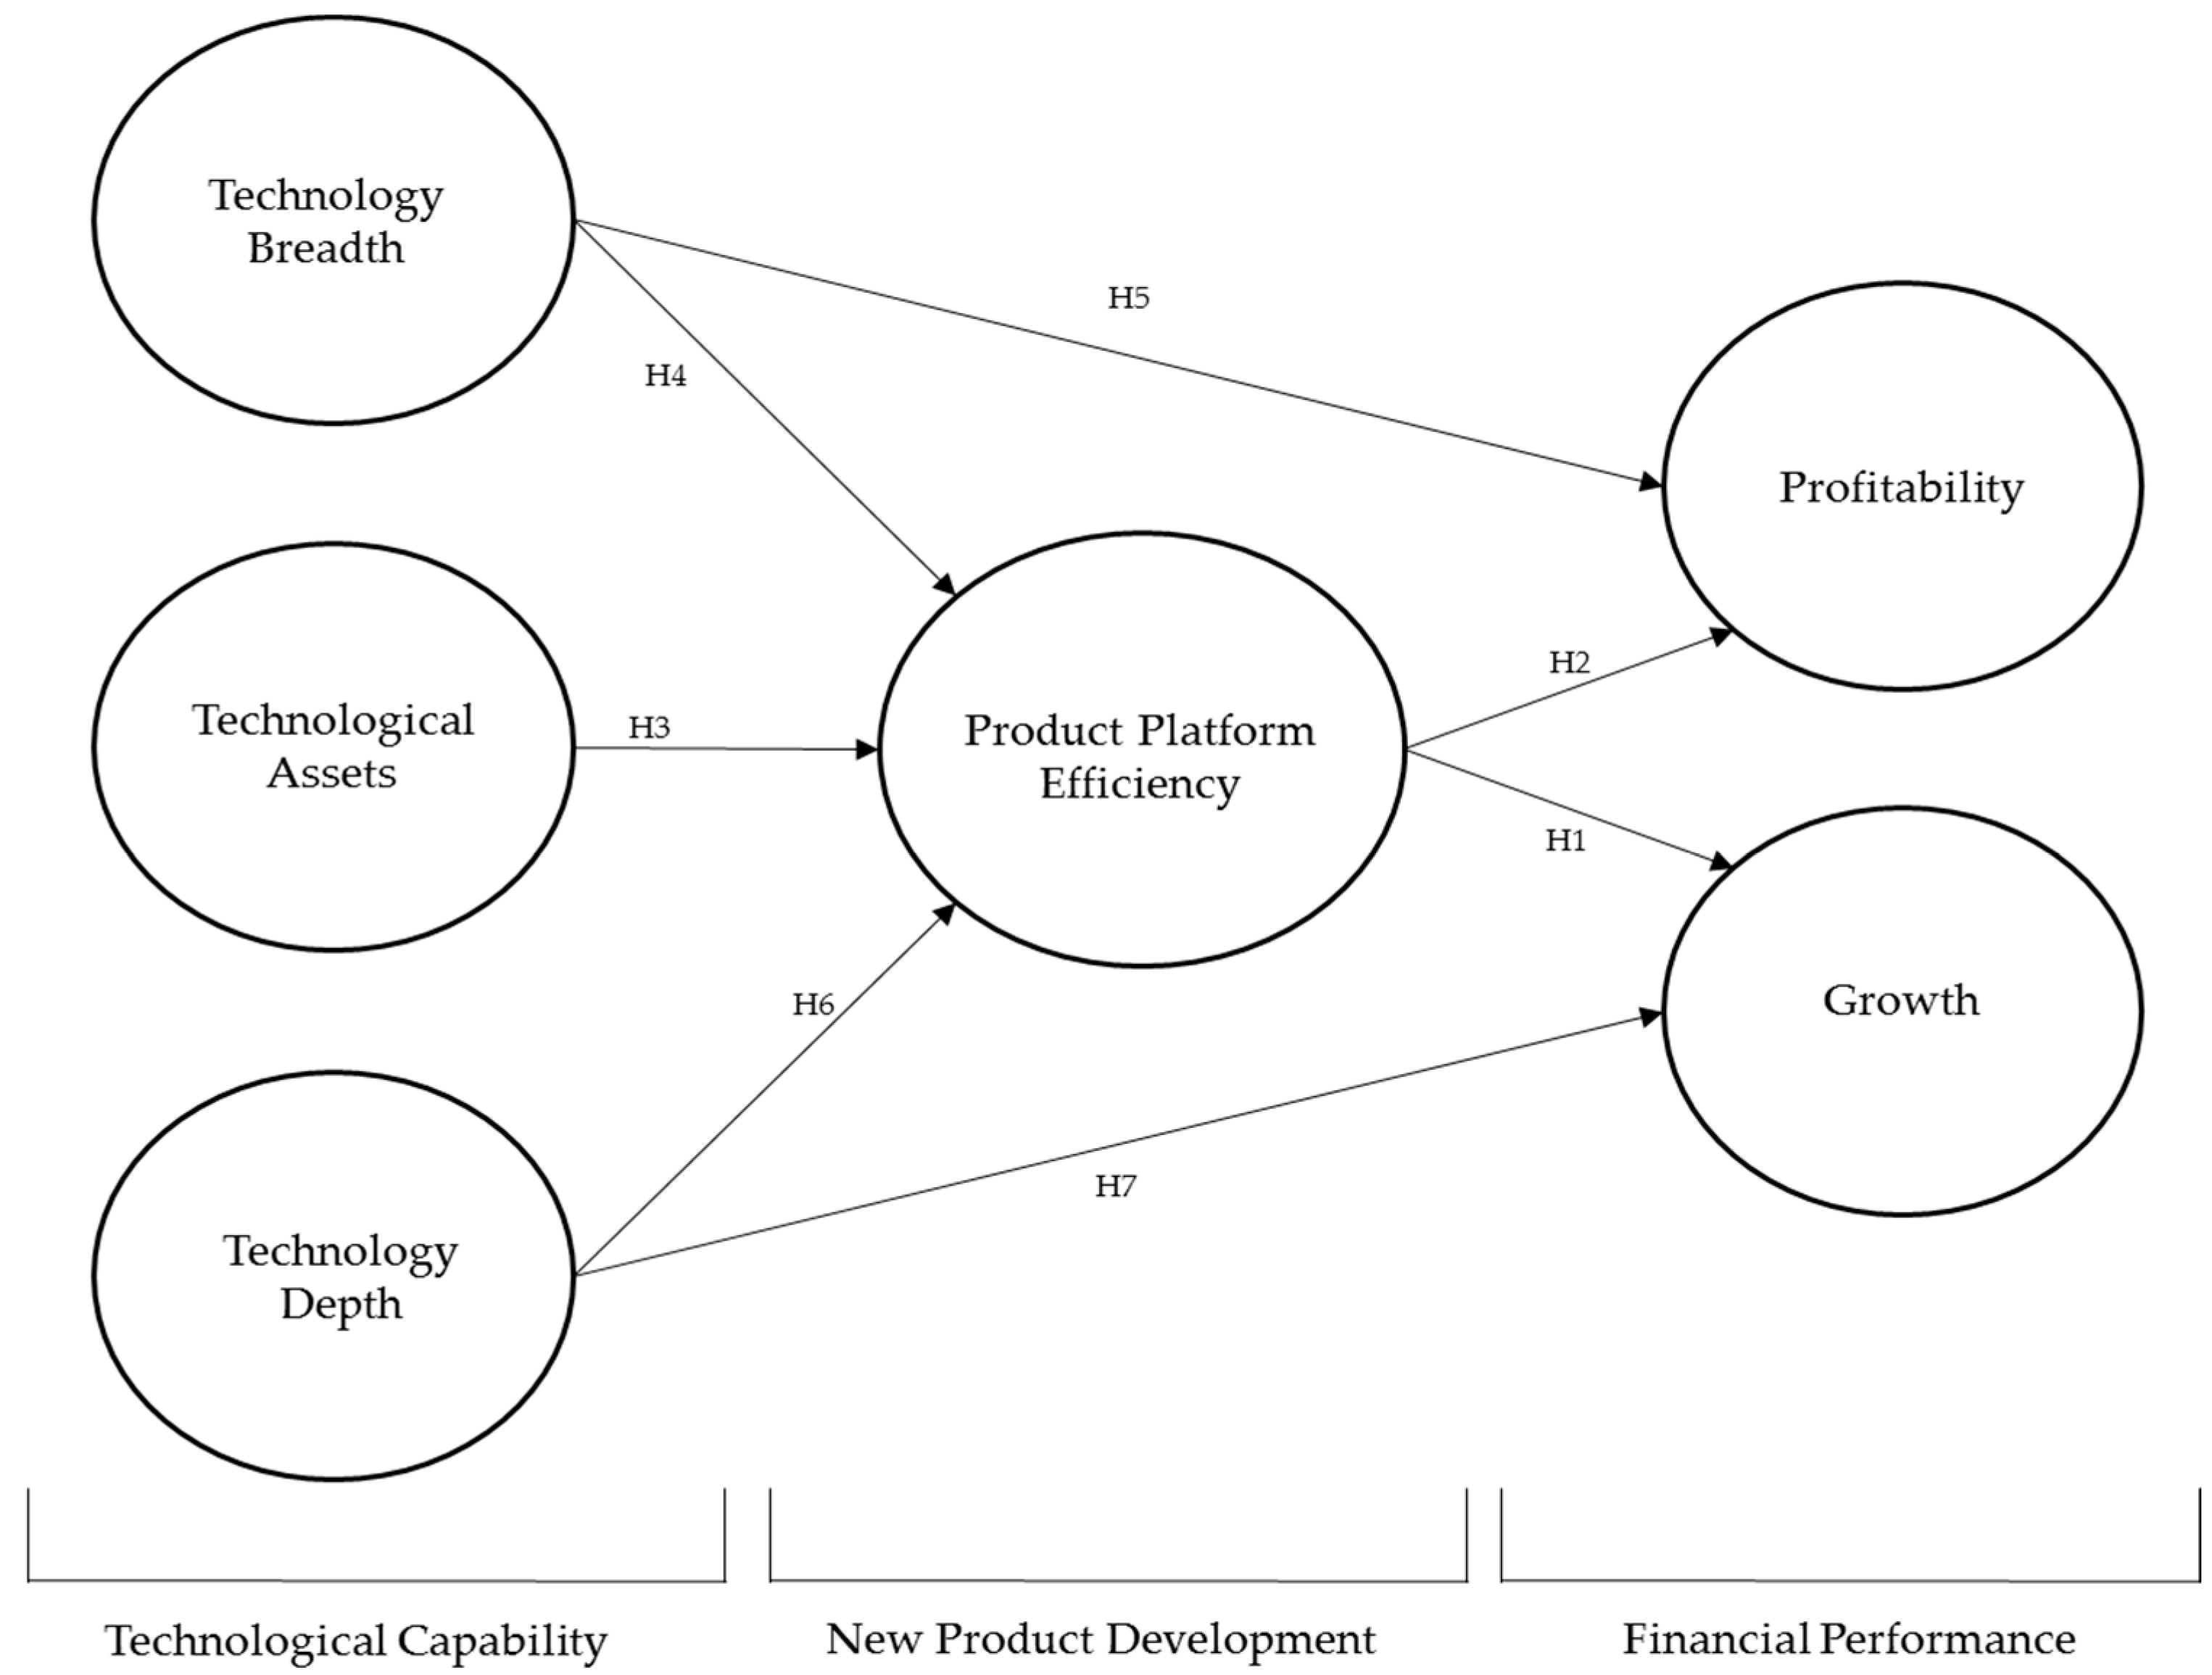
32]. We established the following hypotheses in order to find out the optimal strategy that will maximize a fabless semiconductor firm’s performance. The research model for these hypotheses is shown in
Figure 1.
A case for a product platform is as follows. For instance, although firm A is developing a Field Programmable Gate Array (FPGA) that can be used in various markets, if the firm does not have the core technology, which enables implementation of multi-functionality according to customers’ demand, the firm cannot grow continuously and will face deterioration when the market changes. FPGA is a semiconductor that is available for programming.
According to Meyer and Mugge (2001), a new product platform provides entrance to new market applications, and has a positive impact on high growth [
33]. However, Shamsuzzoha et al. (2009) suggests that it is important to reflect customers’ preferences into customization and production for a firm’s profit and growth [
34]. For Hypothesis 1, we claim that product platforms impact growth and help firms enter into new markets since it enables easier and faster application of semiconductor design in the fabless semiconductor industry.
Shibata and Kodama (2013) claim that product platform strategy has a positive effect on profit [
35]. However, Shamsuzzoha et al. (2009) asserts that it is important to reflect customers’ preferences into customization and production for a firm’s profit and growth [
34]. Since product platforms positively affect design efficiency and profitability in the fabless semiconductor industry, we claim it as Hypothesis 2.
Hypothesis 1 (H1). Product platform efficiency positively affects growth.
Hypothesis 2 (H2). Product platform efficiency positively affects profitability.
2.3. Technological Capability
In core competences theory, the core products are defined as sub-assemblies or components that contribute to the value of end products, and they are composed of one or more core competences (i.e., technological capabilities in technology-intensive firms) [
36]. So, many scholars agree that technological capability is the key to achieving better financial performance.
Recently, the semiconductor market, which once was described with Moore’s law, moved from dynamic status to a high velocity condition where customers’ needs are diversified and individualized [
14,
37,
38,
39]. Thus, increasing technological capability and optimizing management are becoming more and more important. In other words, the new strategy for technological capability must focus on creating and maintaining comparative advantage. In this paper, we clarify concepts regarding technological assets and technology strategy, which are parts of technological capability, and we research their relationship with new product development. As shown in
Figure 1, technology capability is conceptualized as technological assets and technology strategy (i.e., technology depth and technology breadth).
2.3.1. Technological Assets
Of the technological factors that contribute to a firm’s value, technological assets refer to quantitative factors, which include but are not limited to lead time, learning effects, design and production know-how, and possession of industrial standards [
40]. Protection and utilization of technological assets act as important differentiation factors among firms [
41].
A firm’s technological assets act as a driving force for the firm’s innovation. For example, by applying the Generational Product Innovation (GPI) concept, Turner et al. (2010) claimed that a firm with many technological assets (R&D investment, patents, etc.) is the firm that is good at technological innovation [
42]. However, some researchers claim that this view is not suitable for a firm to grow into a larger firm [
43]. Possession of more fabless-related technological assets will result in successful new product development. Under successful new product development, it is possible to establish a product platform by combining system levels. Since it can be seen that technological assets are important in general for fabless semiconductor firms, we claim the following Hypothesis 3.
Hypothesis 3 (H3). Technological assets positively affect product platform efficiency.
2.3.2. Technology Strategy (Technology Breadth and Technology Depth)
In order to maintain a competitive position, technology-intensive firms focus on strategies like technology management and innovation, which in turn build efficiency and effectiveness of technological assets and positively affect financial performance [
43]. In this paper, we view technology strategy as a component of technological capability. Also, we categorized technology strategy further into technology breadth and depth. Technology breadth shows coverage of a firm’s technologies [
44]. Technology depth shows the impact of a firm’s technologies [
44].
In addition, since quantitative measuring of technology strategy is not suitable, patents are used to measure technology in this paper. Since the value of a patent relies on both technological quality and technological scope, patents represent the strategic importance of specific technologies which the firm holds or develops [
45]. Therefore, patents are used to analyze technology breadth and technology depth.
Many literatures categorize the application of patents into two paths. The first path is an offensive patent strategy that is geared towards commercialization and rights protection. The second path is a defensive patent strategy that builds entry barriers to prevent other firms from using the patent that a firm possesses and allows technology licensing for some profit [
45]. However, to acquire technology innovation that enables comparative advantage and differentiation, both paths require firms to choose from either technology breadth or depth because resources and time are limited. Also, the two paths require a contrary decision regarding the usage of resources.
If the priority is given to technology depth, then technology breadth becomes relatively narrow, resulting in weaker expansion regarding rights protection. Also, although it raises the competitiveness of technology, it requires more resources. However, it still gives positive effect to growth, and previous research also shows that firms with more technology depth are more likely to survive [
46,
47,
48].
If the priority is given to technology breadth, then there is a concern regarding regression of innovation along with the quality and differentiation of patents. However, broad technology breadth increases the efficiency of resources, which brings positive effects to profit. Previous research also shows that technology breadth brings synergy among the resources a firm holds, which positively affects the firm’s performance [
49,
50,
51].
For fabless semiconductor sector technologies, the number of patents are the most important barrier to entry. In this paper, we employed technology breadth and technology depth as sub-variables.
Firms utilize technological assets, technology depth, and technology breadth to design and manufacture products. However, in order to apply patents to chip design and produce chips that conform to a product specification of a market segment, a different method is needed [
38]. This will be explained by concepts from a product platform efficiency perspective.
There is also literature about how broad technology breadth brings positive effect to product platform efficiency. According to Chen et al. (2011), breadth of technology knowledge brings positive effect to a firm’s innovative performance [
52]. We claim this as Hypothesis 4.
From the research regarding the effect of technology breadth on profitability, Moorthy and Polley (2010) claimed that it brings positive effect to profitability [
53]. However, Zahra (1996) claimed that technology breadth does not bring positive effect to profitability in the short-term [
54]. This paper follows the claim that there is a positive effect because, as mentioned previously, when considering fabless semiconductor firms’ characteristics, technology breadth is confined only to semiconductors, and broad technology breadth brings synergy among different technologies, which in turn brings positive effect to efficiency. We claim this as Hypothesis 5.
From the research about the effect of technology depth to product platform efficiency, Chen et al. (2011) claimed that depth of technology knowledge also brings positive effect to a firm’s innovative performance [
52]. Due to the characteristics of the fabless sector, technologies with more technology depth are important, and this helps the general application of technologies to products as a part of product platform. We claim this as Hypothesis 6.
From the research regarding the effect of technology depth on growth, Moorthy and Polley (2010) claimed that there is a positive effect to growth [
53]. More technology depth in the fabless sector means that it is the leading technology, which directly connects to a firm’s growth. Therefore, we claim this as Hypothesis 7.
Hypothesis 4 (H4). Technology breadth positively impacts product platform efficiency.
Hypothesis 5 (H5). Technology breadth positively impacts profitability.
Hypothesis 6 (H6). Technology depth positively impacts product platform efficiency.
Hypothesis 7 (H7). Technology depth positively impacts growth.
3. Data and Methods
3.1. Research Design
To analyze the relationship between an independent variable and a dependent variable, regression analysis and correlation analysis are carried out. To analyze the impact of parameters and independent variables on dependent variables, structural equation modeling (SEM) is used.
Based on the results from the correlation analysis and the regression analysis, financial value as an independent variable is deleted since it had unacceptable fitness according to the data.
In this paper, we analyze the effect of the role of the multinational activity. After correlation analysis and regression analysis, the variables (i.e., the number of countries who had family patents and applications) are removed.
SEM combines confirmatory factor analysis, path analysis, and multiple regression analysis. Confirmatory factor analysis is developed from sociology and psychology, and is based on measurement theory. Path analysis and multiple regression analysis are based on simultaneous equation, which is developed from econometrics. SEM consists of a measurement model and a structural model, which concern confirmatory factor analysis and multiple regression analysis, respectively.
The main focus of SEM is to check whether or not the model made by a researcher is supported by data. In general, confirmatory factor analysis is used, but exploratory factor analysis is used if a model’s fitness is not good enough.
To verify the hypotheses proposed in
Section 2, we used SEM, which has the following advantages [
55].
First of all, in regression analysis, a variable can only be used once, so conducting the experiment with regression analysis requires multiple analysis. However, SEM allows estimation of multiple variables and their interrelationship [
56]. Secondly, structural equation modeling can reflect measurement errors when estimating regression coefficients, which allows better results [
57].
In this paper, research scope is limited to cross sectional analysis [
58]. However, we focused on verifying cause and effect by adding a time interval between the independent variable, mediate variable, and dependent variable. Simulation will be used to find a solution by analyzing the measurement model, the validity of the model, and the proposed model.
Measurement model analysis checks a model’s fit by reduced combination of verified variables. That is, it assesses unified dimensionality for all existing latent variables and measurement variables. To achieve an acceptable fit, the measurement model is improved based on squared multiple correlation (SMC) value and the statistical significance of regression coefficients. SMC in the measurement model shows the percentage of explanation of latent variables described by measurement variables, so SMC is used in the measurement model to assess the confidence of the measurement variables.
Convergent validity and discriminant validity are checked through assessing the validity of the measurement model. Convergent validity is used to measure the correlation among the different measurements used to measure the same concept. That is, it assesses the concurrence of multiple items that measure the same concept, and in this paper, construct reliability is used. Discriminant validity is used to check whether or not there exists a difference in measurements among the different variables. Thus, the correlation among the variables must be low, and two standard-error interval estimates are used in this paper.
Analysis of the proposed model is the last analysis used in structural equation modeling to verify the hypotheses, and it uses the critical ratio (C.R.) value of regression weights to accept or reject the hypotheses. The C.R. value shows statistics about hypothesis testing regarding the difference in average value, and if this value is bigger than ±1.96 (Z value that translates to a p-value of 0.05 in standard normal distribution), then the estimate is credible. Also the fit of proposed model should be maintained at an appropriate level. Thus, the proposed model will be improved to obtain a better fit before carrying out hypothesis testing.
3.2. Data
Information regarding fabless semiconductor firms are gathered from the global semiconductor alliance (GSA) (
www.gsaglobal.org). Members of this alliance include worldwide semiconductor firms, and the alliance provides analysis regarding technology trends, market trends, and financial data. It also provides accurate data and insights regarding the market and technology [
12]. We selected 57 fabless semiconductor firms.
The patents used in this paper are based on the ones from the US because it is logical to assume that firms running fabless semiconductor businesses in America, the world’s largest market, have a competitive advantage in technology. Ten years’ worth of patents are used and filing dates span from January 2005 to December 2014. Due to the rapid growth of mobile phones, faster telecommunication speed, and increased electronics used in automobiles since the beginning of the early 2000s, the supply and demand of semiconductor technology has skyrocketed. Demand for system IC (Integrated Circuit) has increased as well. It is adequate to use the most recent 10 years of data to verify each firm’s technology trend [
59]. The patent pool comes from patent applications. This paper’s patent pool is collected from patent applications. Patents are collected from wisdomain (
www.wisdomain.com). This is one of the biggest patent information institutes in Korea, and has high public confidence [
60].
The financial data are collected from 2012 to 2016. The moving average of three years’ financial data is used to minimize noise and outliers [
61]. Two years of time lag is considered for input financial data, which is a part of technological assets. Normally, scholars agree that there are two years of delay for the relationship between financial performance and R&D investment [
62].
Data regarding product families and market segments are gathered and processed based on the information from the GSA [
12]. We summarized the data in
Table 2.
3.3. Variables
3.3.1. Growth
This paper analyzed equity, revenue, and assets by assessing their growth. Narin et al. (1987) examined revenue for a firm’s performance and verified that there is a positive relationship to the number of patents [
63]. There was a lot of research that used equity to assess a firm’s performance [
64]. Also, other literature used assets to assess a firm’s performance [
65]. For normalization, it is divided by revenue. Normalization minimizes the effect of firm size and clarifies comparison standards. Growth data from 2016 is used.
3.3.2. Profitability
This paper used gross profit, operating income, ROS (Return on Sales), and ROA (Return on Assets) to analyze profitability. Gross profit equals to the difference between revenue and cost of revenue, and it is used to assess a firm’s efficiency. Operating income, ROS, and ROA have also been used in other literature [
20]. Some papers often use gross profit as a dependent variable [
66]. For normalization, it is divided by revenue. Profitability data from 2016 is used.
3.3.3. Product Platform Efficiency
There was a lot of research that studied methodologies to build product platforms and to apply the developed platform to a product family [
15,
33]. However, there was no indicator that measures product platform efficiency.
In this paper, we propose a method to statistically measure a product platform, which was once viewed as a level of a product family. We constructed the Product Platform Efficiency (PPE) indicator formula by referencing the formula from Kang and Montoya (2013), and we redesigned the denominator and numerator [
6]. This form of the formula may be simple, but it provides direct interpretation.
where,
PPEi: Product Platform Efficiency Indicator (
ith of firm),
NMi: sum of market segment count (
ith of firm),
NPi: sum of product family count (
ith of firm)
3.3.4. Technological Assets
According to absorptive capacity, the knowledge accumulated in a firm is proportional to the amount of R&D investment and absorptive capacity. Absorptive capacity shows how well a firm can absorb and accumulate knowledge. In this respect, R&D intensity, which is measured as the ratio of R&D investment to sales (or employees), and the ratio of engineers are used as technological assets [
4,
38]. Also, according to Schumpeterian, a larger firm has more resources to spare, which is an advantage in innovating technology capability. On the other hand, some researchers claim that a newer and smaller firm can achieve efficient innovation results since they can react faster to environmental changes. Therefore, in order to analyze the scope of technological assets, there is a need to consider a firm’s size and age as the components of technological assets [
7,
17]. Lastly, the very starting point for innovation starts from the patents a firm owns. Teece (1986) asserted that even firms with great innovation capability are not guaranteed to succeed in a market and proposed the methods of innovation a firm can choose [
7]. Therefore, the number of patent applications should be considered when analyzing the semiconductor industry, which has a strong appropriability regime. In this paper, R&D intensity, firm size, and age are used as variables. Data is from 2014. R&D intensity is normalized by dividing R&D investment by revenue, and firm size is normalized by dividing employee by revenue. Age is calculated by subtracting a firm’s foundation year from 2014.
3.3.5. Technology Breadth
On the premise that most of the technologies that a firm holds are patented, the claims are often employed as a quantitative indicator to investigate technology breadth because the claims in the patent specification show the important technological know-how protected by the patent [
45,
67].
Patent strategy differs from firm to a firm. For example, a firm may apply many separate patents regarding its inventions, but a firm may also apply a single patent that includes all of its inventions. To cope with this, the method to analyze the extent of technological diversification of a firm is applied. There is literature that has studied the scope of technology by calculating the percentage of international patent classification (IPC) for the patents a firm owns [
50,
68,
69,
70]. IPC is a classification of patents.
In this paper, both claim intensity and technological diversification are adopted for technology breadth. The number of claims is used for the average value of claims per patent application. Technological diversification is calculated by the entropy measurement at the subgroup level of IPC. Patents from 2005 to 2014 are used.
where
Pi is the proportion of technology field in
nth IPC code at the subgroup level in all patents of a firm.
3.3.6. Technology Depth
Due to territorial principle, a patent must be filed in each country for commercialization and protection even if it is the same invention. This is referred to as a family patent. Lanjouw and Schankerman (2004) addressed that just less than one-third of patentees seek protection outside their home market. In addition, only five percent of patents in the US were patented in more than 10 countries [
67]. A firm only applies patents to many countries when it views the technology in question has enough economic value since it is cumbersome to file patents in multiple countries [
71]. Firms prefer incremental innovation because it reduces risks since it is path dependent. In addition, incremental innovation allows steady improvement in performance and service by maximizing the efficiency of utilization of resources. Thus, patent citation counts are used as the most objective index that measures the quality of a patent, and the H index method is used in this paper to calculate the patent citation counts for each firm [
72,
73,
74]. Patents from 2005 to 2014 are used.
3.4. Measures
Measurement model analysis verifies the fitness of a model by combining all latent variables and measurement variables existing in the model. To achieve an acceptable fit, the measurement model is improved based on SMC and statistical significance of regression coefficients (C.R.: Critical Ratio). SMC in the measurement model shows the percentage of explanation of latent variables described by measurement variables, so SMC is used in the measurement model to assess the confidence of measurement variables. The C.R. value is used to evaluate the relevancy of measurement variables.
To verify the fitness of the data, χ2, p, χ2/DF, root mean square residual (RMR), goodness of fit index (GFI), adjusted GFI (AGFI), comparative fit index (CFI), normed fit index (NFI), incremental fit index (IFI), and root mean square error of approximation (RMSEA) values are used. To acquire high fitness, measurement variables that have SMC lower than 0.4 are eliminated one by one. The criteria for fitness are as follows.
McIver and Carmines (1981) suggested to use values between two and three for
χ2/DF [
75], and Marsh & Hocevar (1985) suggested to use values between two to five for
χ2/DF [
76]. Bryne et al. (1989) claimed that a
χ2/DF value of two is inappropriate for fitness [
77]. This paper applied a
χ2/DF value smaller than two as the criterion. Smaller root mean square residual (RMR) is better. An RMR of zero indicates a perfect fit. However, an RMR smaller than 0.05 is generally accepted. The goodness of fit index (GFI) was devised by Jöreskog and Sörbom (1984) [
78]. GFI is less than or equal to 1. A GFI value of 1 indicates a perfect fit. A GFI larger than 0.9 is generally accepted. The upper bound of the adjusted goodness of fit index (AGFI) is 1, which indicates a perfect fit. A comparative fit index (CFI; Bentler, 1990) value close to 1 indicates a very good fit. A CFI value larger than 0.9 is generally accepted [
79]. Bentler and Bonett (1980) explained their research using a normed fit index (NFI) value larger than 0.9 [
80]. A Bollen’s (Bollen, 1989) incremental fit index (IFI) value close to 1 indicates a very good fit. An IFI value larger than 0.9 is generally accepted [
81]. Browne and Cudeck (1992) claimed that a root mean square error of approximation (RMSEA) value smaller than 0.05 is adequate, and that threshold is now generally used [
82].
Convergent validity and discriminant validity are checked through assessing the validity of the measurement model. Convergent validity is used to measure the correlation among the different measurements used to measure the same concept. That is, it assesses the concurrence of multiple items that measure the same concept, and in this paper, construct reliability is used. Discriminant validity is used to check whether or not there exist differences in measurements among the different variables. Thus, the correlation among the variables must be low, and two standard-error interval estimates are used in this paper.
Analysis of the proposed model is the last analysis used in structural equation modeling to verify the hypotheses, and it uses C.R. value of regression weights to accept or reject the hypotheses. However, if the fit of the proposed model is not good enough, there is no way to accept or reject the hypotheses. Thus, the proposed model will be improved to get a better fit before carrying out hypothesis tests.
4. Results
Logarithmic function is applied to the variables in
Section 3.3 to attain linearity. SPSS is used to simulate the structural equation method. The simulation procedure in
Section 3.4 is followed.
First of all, the assessment of measurement model is carried out, and the results can be seen in
Table 3. The obtained results are
χ2 = 33.670,
χ2/DF = 3.367,
p = 0.000, GFI = 0.892, AGFI = 0.611, CFI = 0.914, RMR = 0.036, RMSEA = 0.206, NFI = 0.889, and IFI = 0.919. The hypothesis is rejected since
χ2 = 33.670 (
p = 0.000) because the
p-value is smaller than 0.05. However,
p-value is not the necessary condition. Other indexes also need to be reviewed. In general, values over 0.9 are acceptable for GFI, AGFI, CFI, NFI, and IFI, values below 0.05 are acceptable for RMR, and values below 0.1 are acceptable for RMSEA. It can be seen that CFI, RMR, and IFI values are satisfying the criterion. Therefore, it is possible to conclude that the fitness of the model is acceptable. In addition, it can be seen that all of the factor loading and SMC show values greater than zero. The C.R. for family patents and assets exceeds ±1.96. This standard is not applied if there is only one measurement variable in a latent variable. For SMC, since the H index, family patents, equity, and assets show values over 0.4, it is possible to conclude that these variables are explained well.
From the previous research, there are many standards that can be used to judge the fitness of models [
83,
84]. Therefore, in this paper, indices generally used in other research are examined, and we decided to accept the model if and only if more than half of the indices indicate that the model is acceptable.
After the assessment of the measurement model, validation of data was carried out, and several variables were eliminated. Equity and assets are chosen for variables representing growth, and revenue was eliminated. Gross profit is chosen for the variable representing profitability, and operating income, ROS, and ROA are eliminated. Product platform efficiency is used as the product platform efficiency indicator. R&D intensity is chosen for the variable representing technological assets, and firm size and age are eliminated. Technology diversification is chosen for the variable representing technology breadth, and claims are eliminated. H index and family patents are chosen for variables representing technology depth.
Secondly, after analyzing the measurement model, the validity of the measurement model is assessed. The results are shown in in
Table 4. The validity of the measurement model is checked by using convergent validity and discriminant validity. Construct reliability is used to assess convergent validity, and two standard-error interval estimates are used to assess discriminant validity. All of the construct reliability values are over 0.7. Two standard-error interval estimates are used to verify discriminant validity, and no coefficients included one. Therefore, it is possible to conclude that all variables hold validity from the measurement model.
Lastly, the result of the analysis of the proposed model is summarized.
Table 5 shows the detailed result of structural equation modeling for the proposed model. The proposed model showed acceptable fitness. Specifically, values obtained are
χ2 = 39.157,
χ2/DF = 2.447,
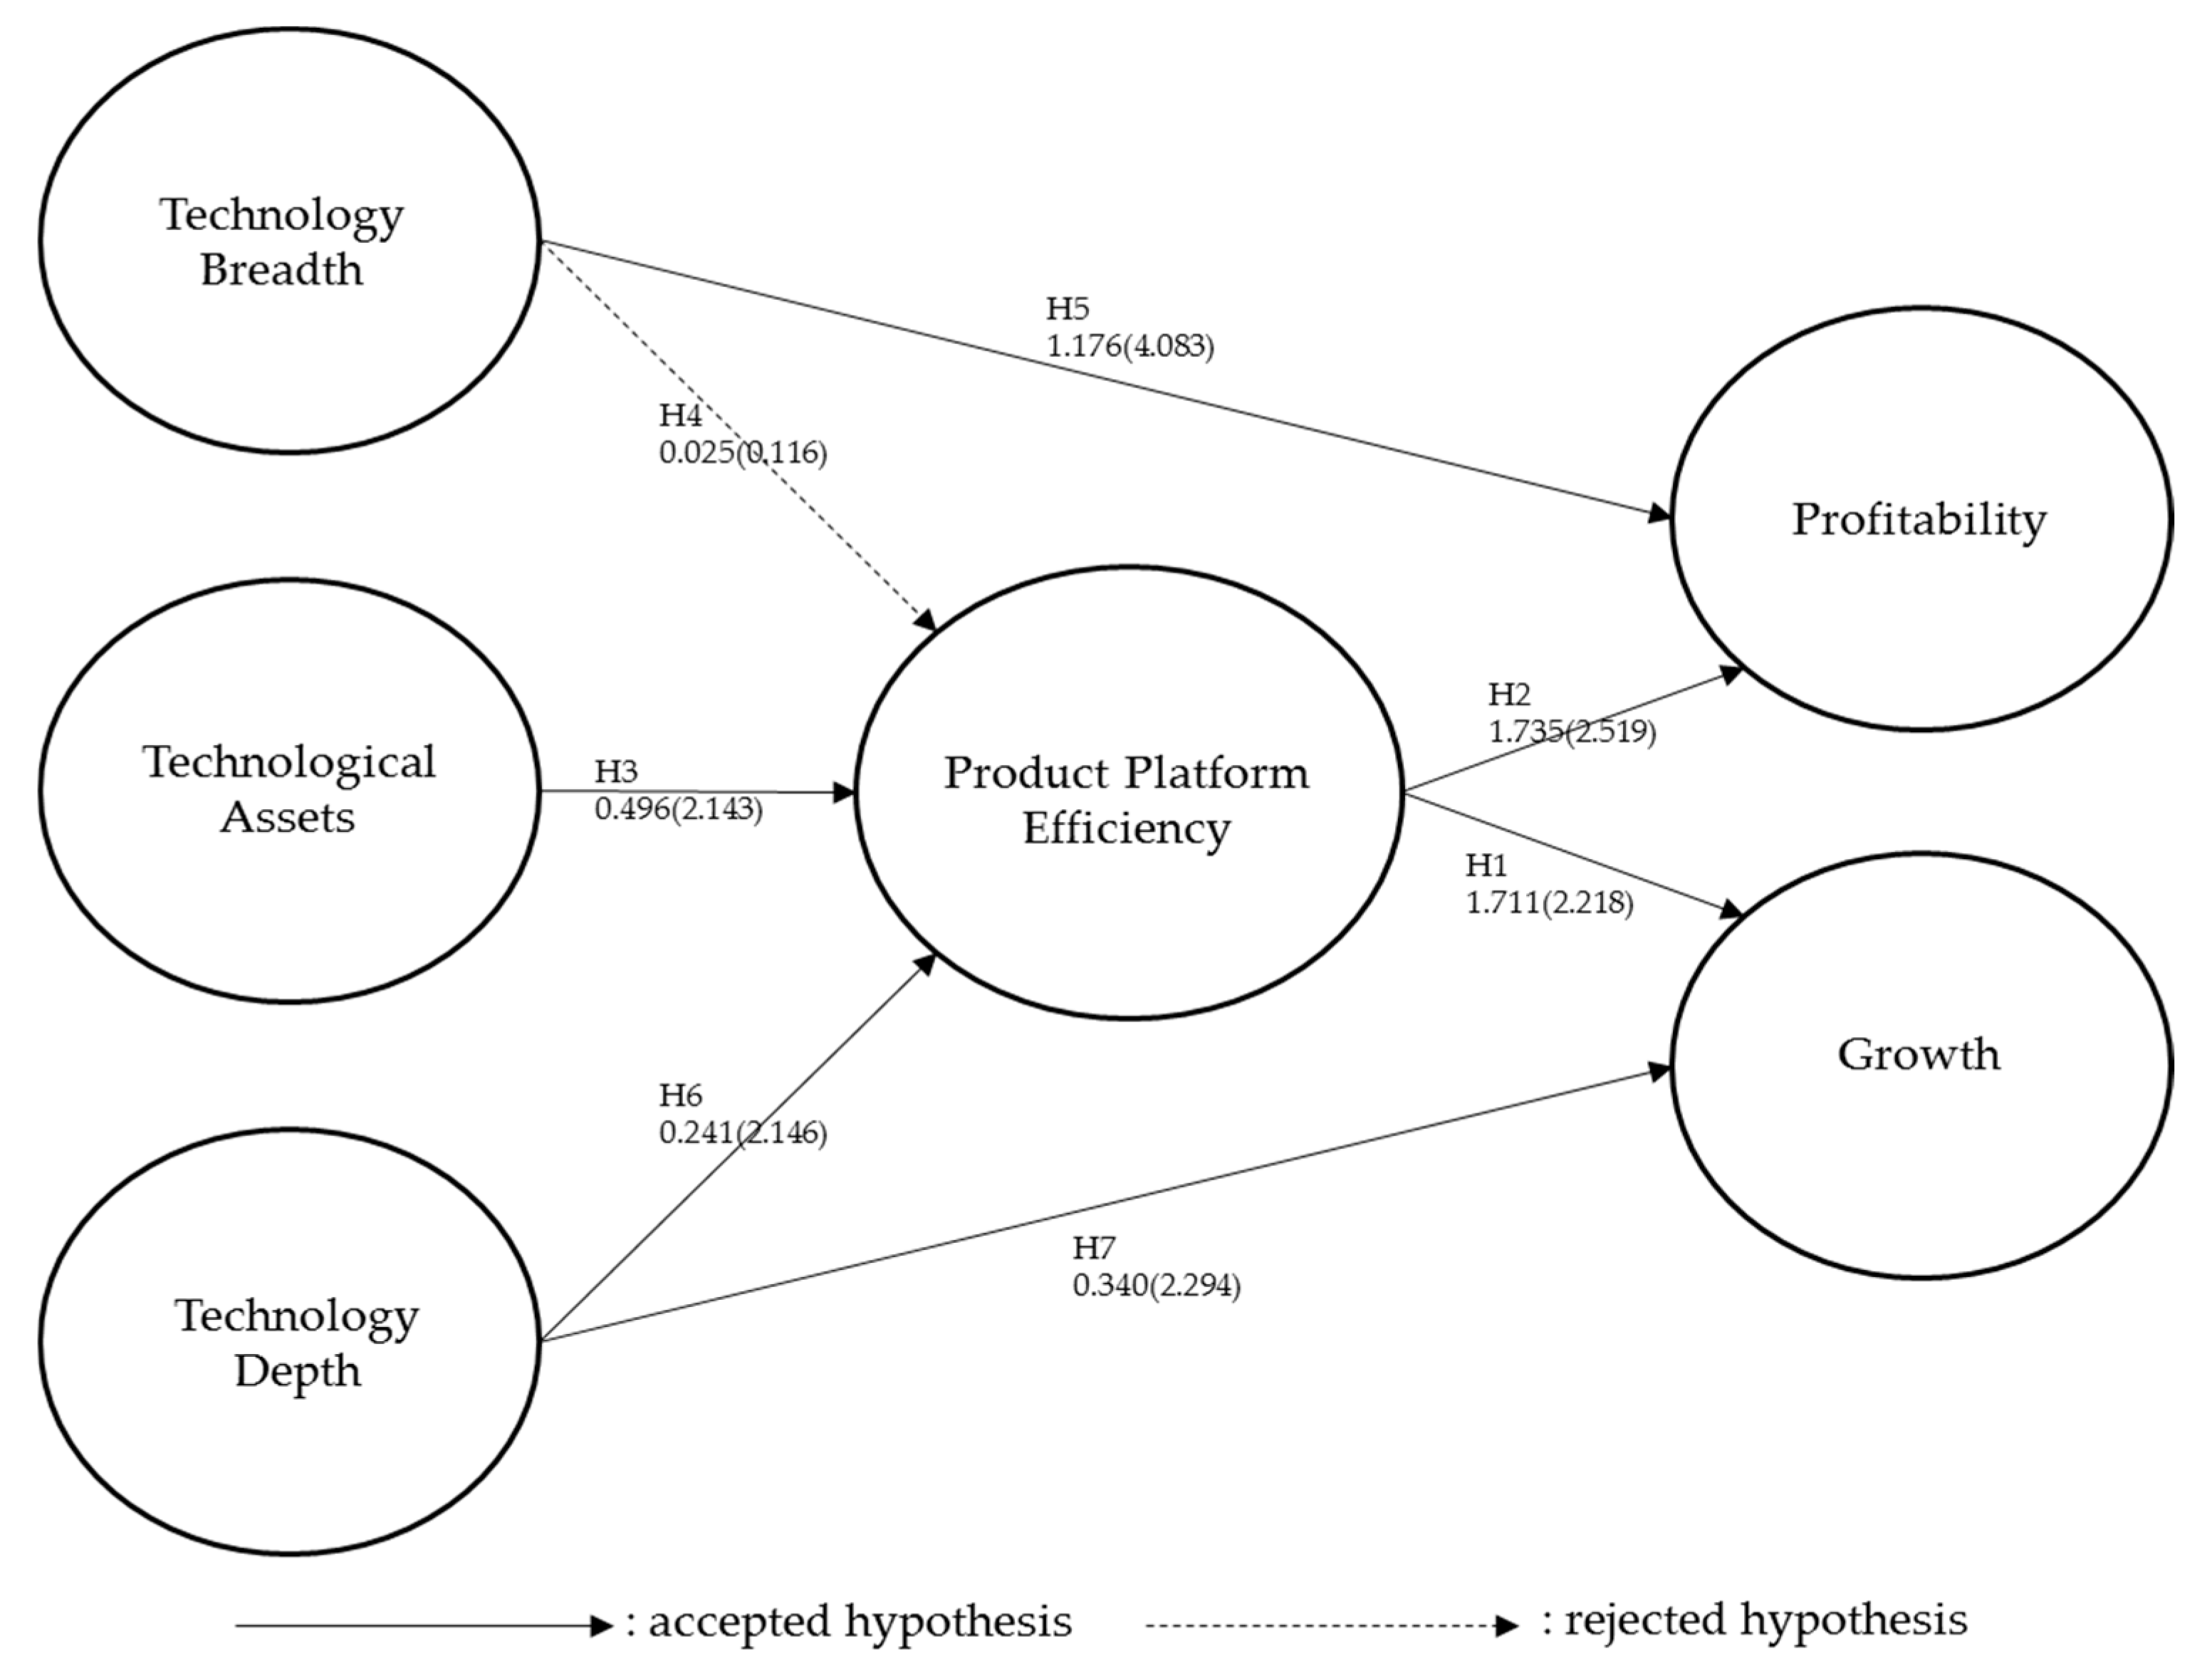
p = 0.001, GFI = 0.834, AGFI = 0.626, CFI = 0.916, RMR = 0.036, RMSEA = 0.161, NFI = 0.871, and IFI = 0.919. The results are summarized in
Figure 2. The dotted line represents the rejected hypothesis, and other lines represent accepted hypotheses.
Hypothesis 1 has a coefficient of 1.711 and a C.R. of 2.218, which is statistically significant at the 95% confidence interval (CI) level. Hypothesis 2 has a coefficient of 1.735 and a C.R. of 2.519, which is statistically significant at the 95% CI level. Hypothesis 3 has a coefficient of 0.496 and a C.R. of 2.143, which is statistically significant at the 95% CI level. Hypothesis 4 has a coefficient of 0.025 and a C.R. of 0.116, so it is rejected at the 95% CI level. Hypothesis 5 has a coefficient of 1.176 and a C.R. of 4.083, which is statistically significant at the 95% CI level. Hypothesis 6 has a coefficient of 0.241 and a C.R. of 2.146, which is statistically significant at the 95% CI level. Hypothesis 7 has a coefficient of 0.340 and a C.R. of 2.294, which is statistically significant at the 95% CI level.
5. Discussion
In this paper, technological assets and technology depth positively affect product platform efficiency, and product platform efficiency has a positive effect on growth and profitability of fabless semiconductor firms.
First of all, the results of this study suggest that product platform efficiency positively affects a firm’s financial performance (i.e., growth and profitability) (Hypotheses 1 and 2). The effect of product platform efficiency on growth is 1.711 and the effect on profitability is 1.735, which is very similar. A larger product platform efficiency value suggests enlarged coverage of market segments with a smaller number of product families since it means that the product platform is well designed so that many products can be made quickly and diversely. On the other hand, smaller product platform efficiency values suggest coverage of less market segments with many product families because it requires customization in many different products. Although it is a firm’s strategic choice, larger values of the product platform efficiency indicator provide more chances for growth since the firm can enter many markets. In addition, there is less loss when designing, so it is better for the firm’s profitability. For example, many logic IC-related fabless firms in the semiconductor industry used cores from ARM (Advanced RISC Machines) Holdings to develop their own product, which enables optimization of resources for each firm. Also, the CIS (Complementary metal–oxide–semiconductor Image Sensor) chip from Sony is utilizing standardized designing method and know-how to expand its market to the camera, smartphone and automobile industries.
Secondly, higher level of R&D investment in the fabless semiconductor industry leads to a positive influence on product platform efficiency (Hypothesis 3). The reason is that R&D investment helps establish customization and a product platform, which in turn facilitates product design processes. Since this can be applied to new markets, R&D investment leads to a firm’s growth and profitability (Hypotheses 1–3). Unlike foundry and IDM, since R&D investment in fabless semiconductor firms is purely used for designing, it is possible to accurately measure the effect of R&D investment. Higher R&D investment enables a firm to use more in product platform development, which in turn makes it possible for the firm to efficiently manage its resources compared to other firms.
Third, technology depth in the fabless semiconductor industry has a positive impact on product platform efficiency (Hypothesis 6). In this paper, technology depth consists of the H index and family patents. H index shows a patent’s citation counts, and family patents show overseas application of patents. Higher technological level increases citation counts, and in order to protect the high-level technology, more overseas applications are made. Since high-level technology is valuable, it is also used when establishing a product platform, which increases competitiveness and demand from customers, which eventually increases a firm’s growth and profitability (Hypotheses 1, 2 and 6). Technology depth also has a direct and positive effect on a firm’s growth (Hypothesis 7). This path effect value is 0.340. Technology depth also has an indirectly positive effect to a firm’s growth (Hypotheses 1 and 6). This path is Hypothesis 6–Hypothesis 1 and its effect value is 0.412 (0.241 × 1.711). So, the indirect path using product platform efficiency is more effective (Hypotheses 1, 6 and 7). For example, modem chips made by Qualcomm are considered as the core technology, and the chips are used in the product line up to acquire market dominance. Technology depth requires more resources. This alone confirms that it affects growth more than profitability.
Last, no correlation between technology breadth and product platform efficiency is found (Hypothesis 4). Technology breadth was measured by patents’ IPC coverage, and it was hard to conclude that it affects product platforms because it is not easy to check whether or not the IPC coverage is in fact covering the technologies that are needed when building a product platform. Although it did not reach a statistically significant level, it can be deduced that there is some positive effect to the product platform (Hypotheses 2 and 4). In addition, technology breadth brings positive effects to profitability, even in the fields that cannot easily build product platforms.
However, technology breadth positively affects profitability (Hypothesis 5). Technology breadth brings a synergy effect. The main purpose of technology breadth, as mentioned previously, is to utilize a firm’s resources efficiently, which in turn brings positive effects to a firm’s profitability.
Finally, this paper suggests that product platform efficiency impacts firm growth and profitability.
6. Conclusions
In this paper, we proposed product platform efficiency from a new product development perspective and empirically tested how technology capability through new product development positively affects the financial performance of the firm in the fabless semiconductor industry. This study has several contributions to theory and practice, which are mentioned below.
First of all, in this paper, we developed the product platform efficiency variable as a way to quantitatively measure fabless semiconductor firm’s product platform efficiency. This variable can be also applied to other semiconductor industries, including IDM and foundry. This application will be especially useful in automotive and electronics industries since they utilize many product platforms.
Secondly, our study suggests that H index and family patents have values in technological depth of the fabless semiconductor industry. In addition, they have positive effects on product platform efficiency, so it can be argued that fabless semiconductor firms must develop advanced level technologies and apply for patents for them by using H index and family patents to establish the product platform.
Third, in our paper, technological breadth is measured with technological diversification. Its direct relationship to product platform efficiency was not verified, while its positive direct relationship with the gross profit was confirmed. In other words, technology breadth has no indirect relationship with profitability through product platform efficiency. Therefore, fabless semiconductor firms should apply for patents that have a wide range of IPC in order to increase gross profit.
Fourth, in the fabless semiconductor industry, all R&D investment goes into chip design. However, in order to effectively manage research funds, this investment would need to be made on researchers and on research funds, which enable firms to efficiently design product platforms and customize chip designs.
This paper proposes a new product development strategy for fabless semiconductor firms. Firms should increase R&D investment to design product platforms and should reinforce technology depth to establish product platforms, which can be used to diversify market segments and line ups by utilizing technological capability at a lower cost with higher efficiency. This will accelerate growth and increase profitability.


