1. Introduction
Under the auspices of the United Nations Framework Convention on Climate Change (UNFCCC), nations around the world work together to address climate change. The UNFCC brings together the 197 ratifying nations of the convention, who jointly develop ‘protocols’ or ‘agreements’ in order to advance climate change mitigation objectives. One of the goals of the UNFCCC is to stabilize greenhouse gas (GHG) concentrations in the atmosphere at a level that would prevent dangerous anthropogenic interference with the climate system [
1]. Although the first major step of the UNFCCC was to introduce the Kyoto Protocol, intended to reduce GHG emissions, particularly in developed nations, the most recent agreement, known as the Paris Agreement, specifically identifies a target of keeping climate change-induced temperature rises below 2 degrees Celsius compared to pre-industrial era levels. Beyond this goal is an ambitious effort to limit these temperatures to just a 1.5 degree increase [
2].
The development of nationally-determined contributions (NDC), including individual GHG reduction targets, forms part of the Paris Agreement, however, only 170 of the 197 UNFCCC ratifying nations have subsequently ratified the Paris Agreement, and one notable exception is the United States of America (USA). The USA is responsible for some 15% of global carbon dioxide (CO
2) emissions from fossil fuel combustion and industrial processes [
3], making the cooperation of the remaining nations, and particularly Northeast Asia, (which is responsible for over 40% of global CO
2 emissions), even more important. China, the main contributor to Northeast Asia’s CO
2 emissions, has been particularly vociferous about the need for all ratifying parties to work together to implement the Paris Agreement [
4].
This study undertakes an evaluation of the six Northeast Asian nations of China, Japan, the Republic of Korea (Korea), the Democratic People’s Republic of Korea (DPRK), Mongolia, and Russia. The evaluation uses decomposition analysis of CO2 emission intensity and fossil fuel share of the energy mix, energy efficiency, economic development, and population to determine the key contributing factors toward CO2 emission changes in each nation assessed. Further, based on a comparative analysis of these factors, the potential for inter-regional cooperation on carbon reduction and sustainable development is assessed, alongside the necessary enablers and barriers to cooperation.
While cooperation is considered necessary to enhance emission reduction outcomes under the UNFCCC, each nation also has individual policy goals (separate to their NDCs), often linked to national energy strategies, and unique national attributes. For example, China, with the largest economy in Asia, is working toward ‘Made-in-China 2025’ which calls for an enhancement of industrial capability through innovation-driven manufacturing, quality improvements, optimizing industry, nurturing human talent and, importantly, green development [
5]. In addition, China will implement a national carbon trading scheme by 2017, which is expected to lead to a market-oriented carbon emission allowance approach where a number of factors, including fossil fuel pricing, could have an influential impact on this scheme [
6]. Similar to China, which has realized the importance of renewable energy generation [
7], Japan is pressing toward an energy transition which shifts it away from heavy dependence on international fossil fuel imports, with an interim renewable energy target of 22–24% of electricity generation by 2030, and a broad liberalization of energy markets [
8].
For Korea, also heavily dependent on fossil fuel imports, a ‘low-carbon, green growth’ plan was introduced in 2008, aiming to introduce additional renewable energy and increase nuclear-based generation to meet an ambitious GHG reduction target of 37% by 2030 [
9]. Russia has a strategic plan in place which considers the economic, environmental, and social aspects of sustainable development, however, environmental aspects are not considered prominently and economic aspects, particularly sustainable economic growth is considered most important, at least until 2020 [
10].
With regard to Mongolia, a heavy reliance on mineral and fuel exports, which make up approximately 40% of gross domestic product (GDP) has stagnated diversification, putting at risk sustainable, inclusive development [
11]. An additional challenge for Mongolia is the low level of access to electricity in rural areas, approximately 51% in the year 2014 [
12]. The issue of access to electricity is exacerbated in the DPRK, where it is estimated that approximately 41% of urban households and just 13% of rural households have access to electricity [
10]. While limited information is available about the status or aims of sustainable development in the DPRK, the United Nations Development Program (UNDP) has a presence, with the goal of “restoring the quality of life of people to the highest level achieved before economic and humanitarian difficulties in the mid-1990s”. The three main focus areas for improvement are: food security and rural development, socio-economic development, and environment and climate change [
13].
The dual aim of this study is to clarify the key driving factors of CO2 emissions and their change over time, and, from these results, to identify and discuss the potential for regional cooperation toward carbon mitigation, sustainable development, and green growth in Northeast Asia.
Section 2 outlines the methodology and underlying factors considered to clarify energy system trends over time in each of the assessed nations.
Section 3 describes the data sources used in the analysis and outlines the trends identified for CO
2 emissions, carbon intensity, and renewable energy share, as well as the diversity of each nation’s energy supply portfolio.
Section 4 discusses these results and their applicability to inter-regional cooperation toward sustainable development and the management of CO
2 emissions, along with the enabling mechanisms for such cooperation.
Section 5 summarizes the conclusions of this study.
2. Methods
This study applies the Kaya Identity as a decomposition analysis framework to clarify the key driving factors involved in CO
2 emission changes [
14]. We use the following five indicators to decompose the CO
2 emissions changes: carbon intensity (CI), fossil fuel share in total primary energy supply (Share), energy efficiency (EE), economic development (Econ), and population at the country scale (Pop).
We define the CI indicator as the CO2 emissions (ton-CO2) per fossil fuel use (TJ) to provide the information about energy strategy of low carbon fossil fuel. The CI indicator increases if the high carbon fossil fuel consumption increases more quickly than the low carbon fossil fuels. Next, the SHARE indicator is defined as the fossil fuel use (TJ) divided by the total primary energy supply (TJ), which indicates the share of the fossil fuel use in total energy use. This indicator increases if the fossil fuel consumption increases more quickly than the renewable energy use.
The EE indicator is defined as total energy use (TJ) per unit of GDP. This indicator reflects the energy efficiency of economic activities. EE can be decreased by reducing the total energy consumption while keeping the GDP, or increasing GDP without total energy consumption growth. The ECON indicator is defined as GDP per population, which represents the country’s economic development. Finally, the POP indicator is defined as the population and represents the scale of the country.
Here, we introduce a decomposition approach. The CO
2 emissions change (CO
2) is decomposed using fossil fuel use (Fossil), total primary energy use (TPES), GDP, and population, as shown in Equation (1):
We consider the change in CO
2 emissions from year t − 1 (CO
2t−1) to year t (CO
2t). Using Equation (1), the growth ratio of the CO
2 emissions can be represented as follows:
We transform Equation (2) into a natural logarithmic function to obtain Equation (3):
Multiplying both sides of Equation (3) by
yields Equation (4), as follows:
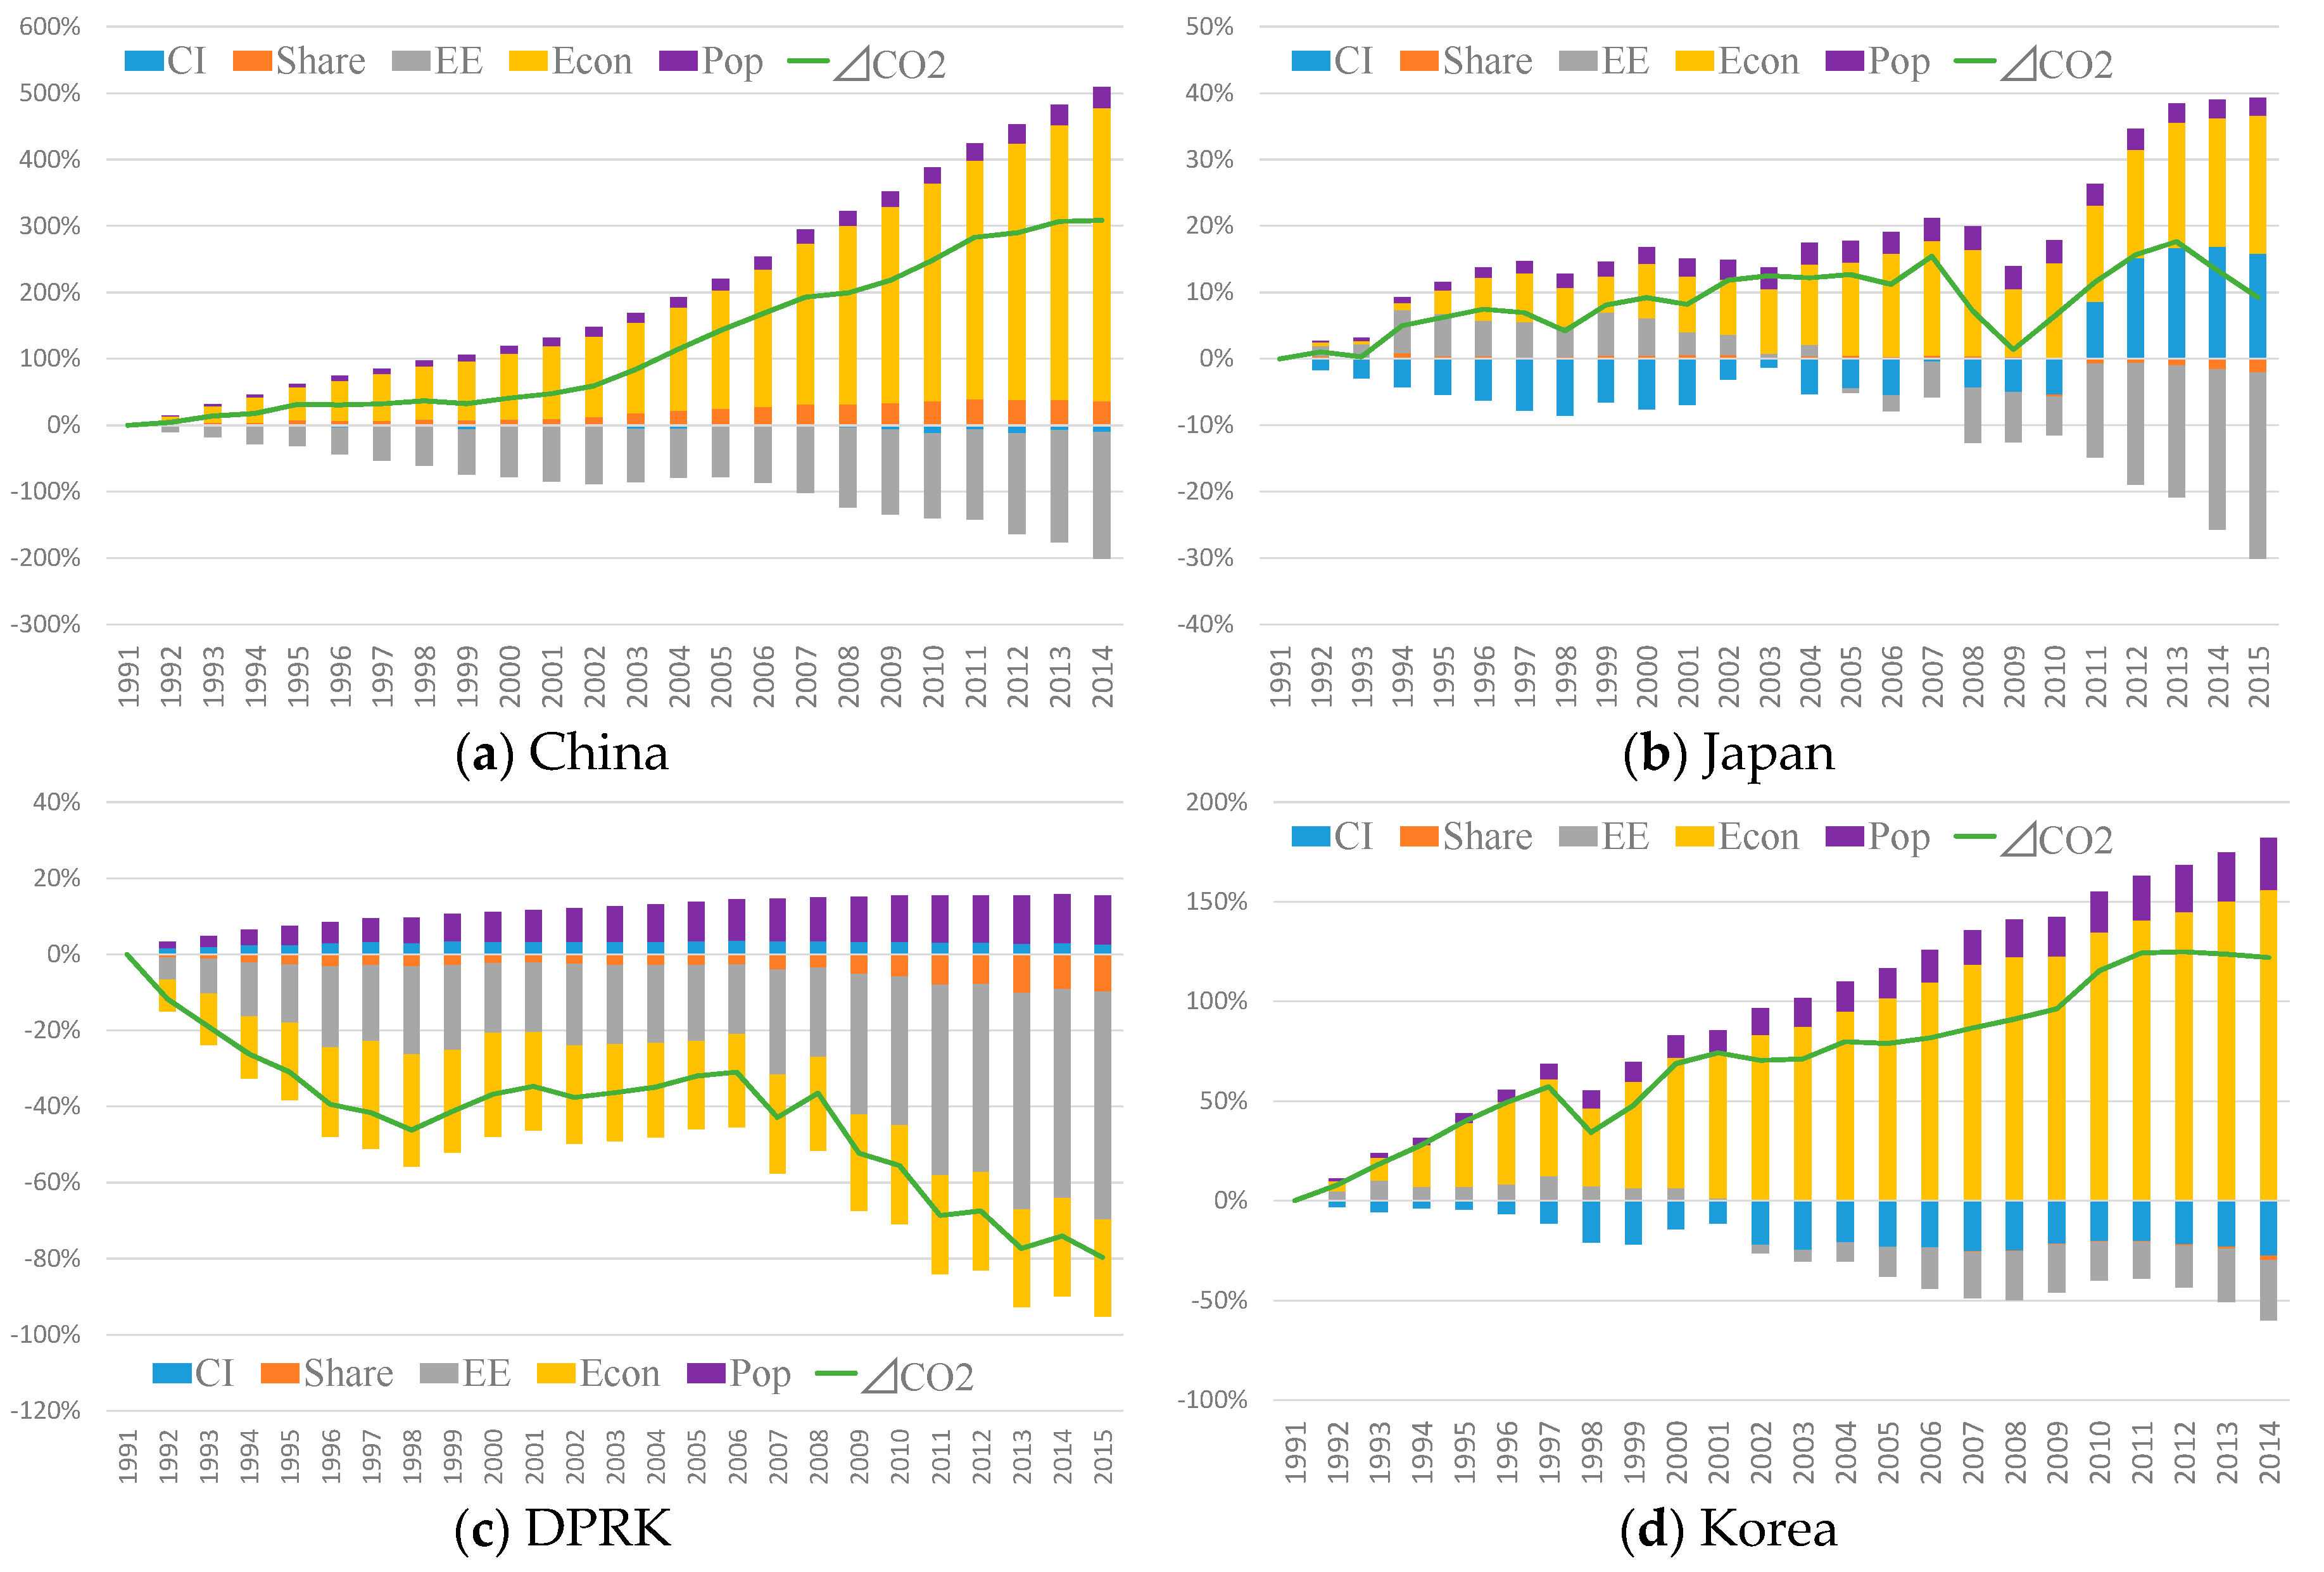
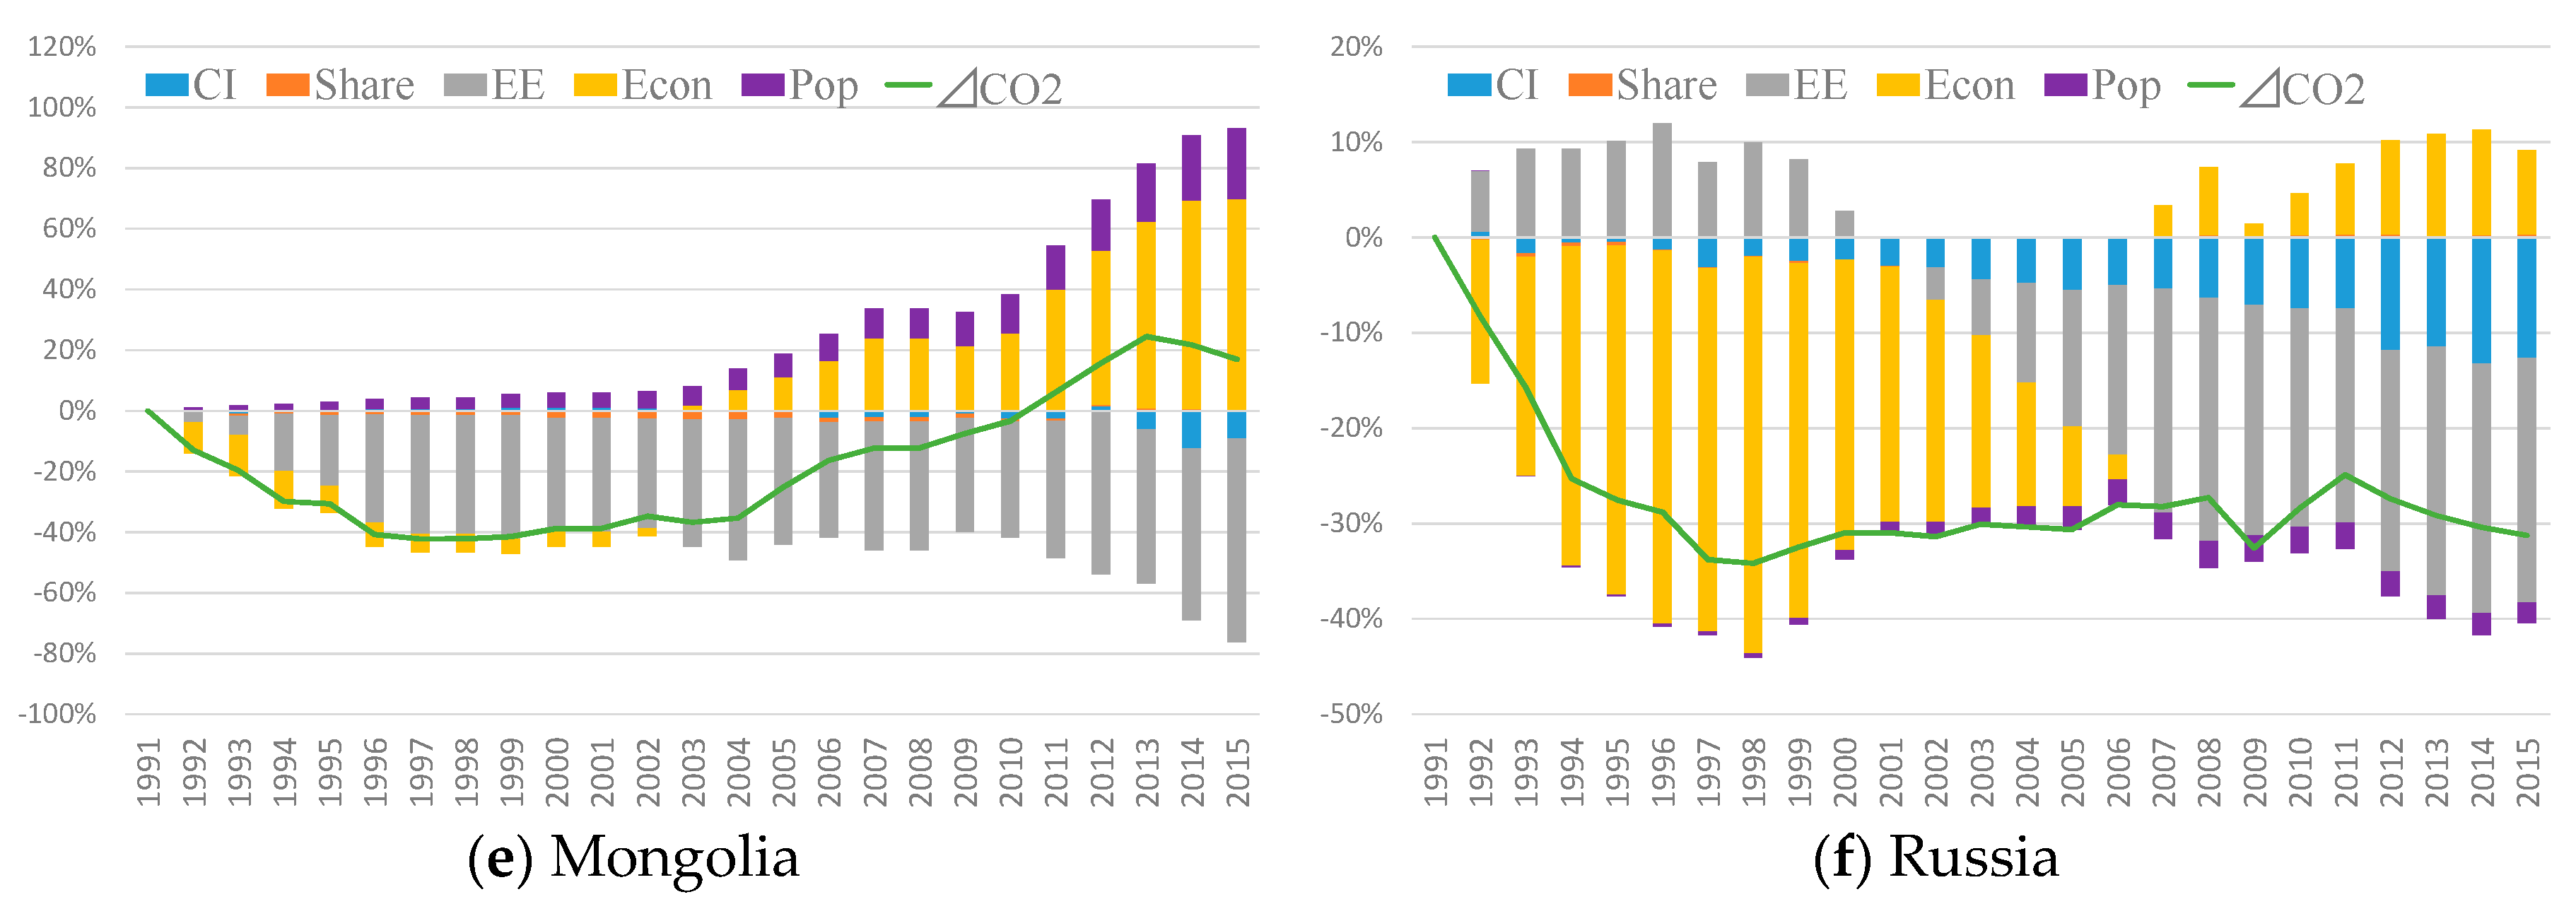
Therefore, changes in the CO2 emissions (⊿CO2) are decomposed by changes in the CI (first term), SHARE (second term), EE (third term), ECON (fourth term), and POP (fifth term). The term operates as an additive weight for the CO2 emissions.
The decomposition technique for the emission change factors is called the Logarithmic Mean Divisia Index (LMDI) and was developed by Ang et al. [
15]. The term
operates as an additive weight for CO
2 emissions estimated within the LMDI framework. The LMDI approach has been used predominantly in energy studies [
16]. As far back as 1991, LMDI has been used to investigate the drivers of CO
2 in the manufacturing sector [
17] and, more recently, the LMDI approach has been applied to corporate environmental management research to clarify the key drivers of toxic chemical emission changes [
18,
19]. Additionally, LMDI was applied in patent decomposition analyses to investigate research and development priority changes over time [
20,
21].
4. Discussion
The countries assessed in this study each have distinct levels of development, culture, political systems, and geographic realities which lead to a broad range of sustainable development issues which need to be addressed. Of the six countries assessed, all except Japan share at least one land border, boding well for future regional cooperation in terms of an interconnected grid, or the physical transport of people and resources. This study discusses the DPRK, however, under the United Nations Resolution 2375, passed on 11 September 2017, in addition to preceding resolutions, meaning that certain energy imports are restricted and joint ventures and international movement of workers is prohibited [
24]. In this research, these restrictions are ignored in order to develop ‘possible’ regional cooperation mechanisms. Regional cooperation is considered in terms of sustainable development, and particularly the concept of green growth [
25] with a focus on cooperation between developing and high-income countries in terms of green innovation, human and natural capital, infrastructure, and policy design.
From the results presented regarding CO
2 emissions and their underlying factors, it is apparent that Korea and China (and, to a lesser degree, Mongolia) have rapidly-growing economies, which have led to a commensurate increase in emissions. Conversely, the DPRK and Russia have experienced a reduction in emissions due to efficiency gains, but also have limited economic growth, in the case of Russia, or negative growth, as in the DPRK. These outcomes seem to offer a symbiotic arrangement, whereby countries with rapidly-growing economies and high emissions could shift or outsource some of their economic activity to nations with lower CO
2 emissions. The potential of such cooperation can be assessed by considering each nation’s comparative technological readiness (the ability of a nation to adopt existing technologies which enhance the productivity of industry) and innovation capacity (the availability of innovation funding and research prowess etc. [
26]) alongside the results presented in this study. Of the six nations considered, Japan and Korea have the highest comparative technological readiness and innovation capacity scores [
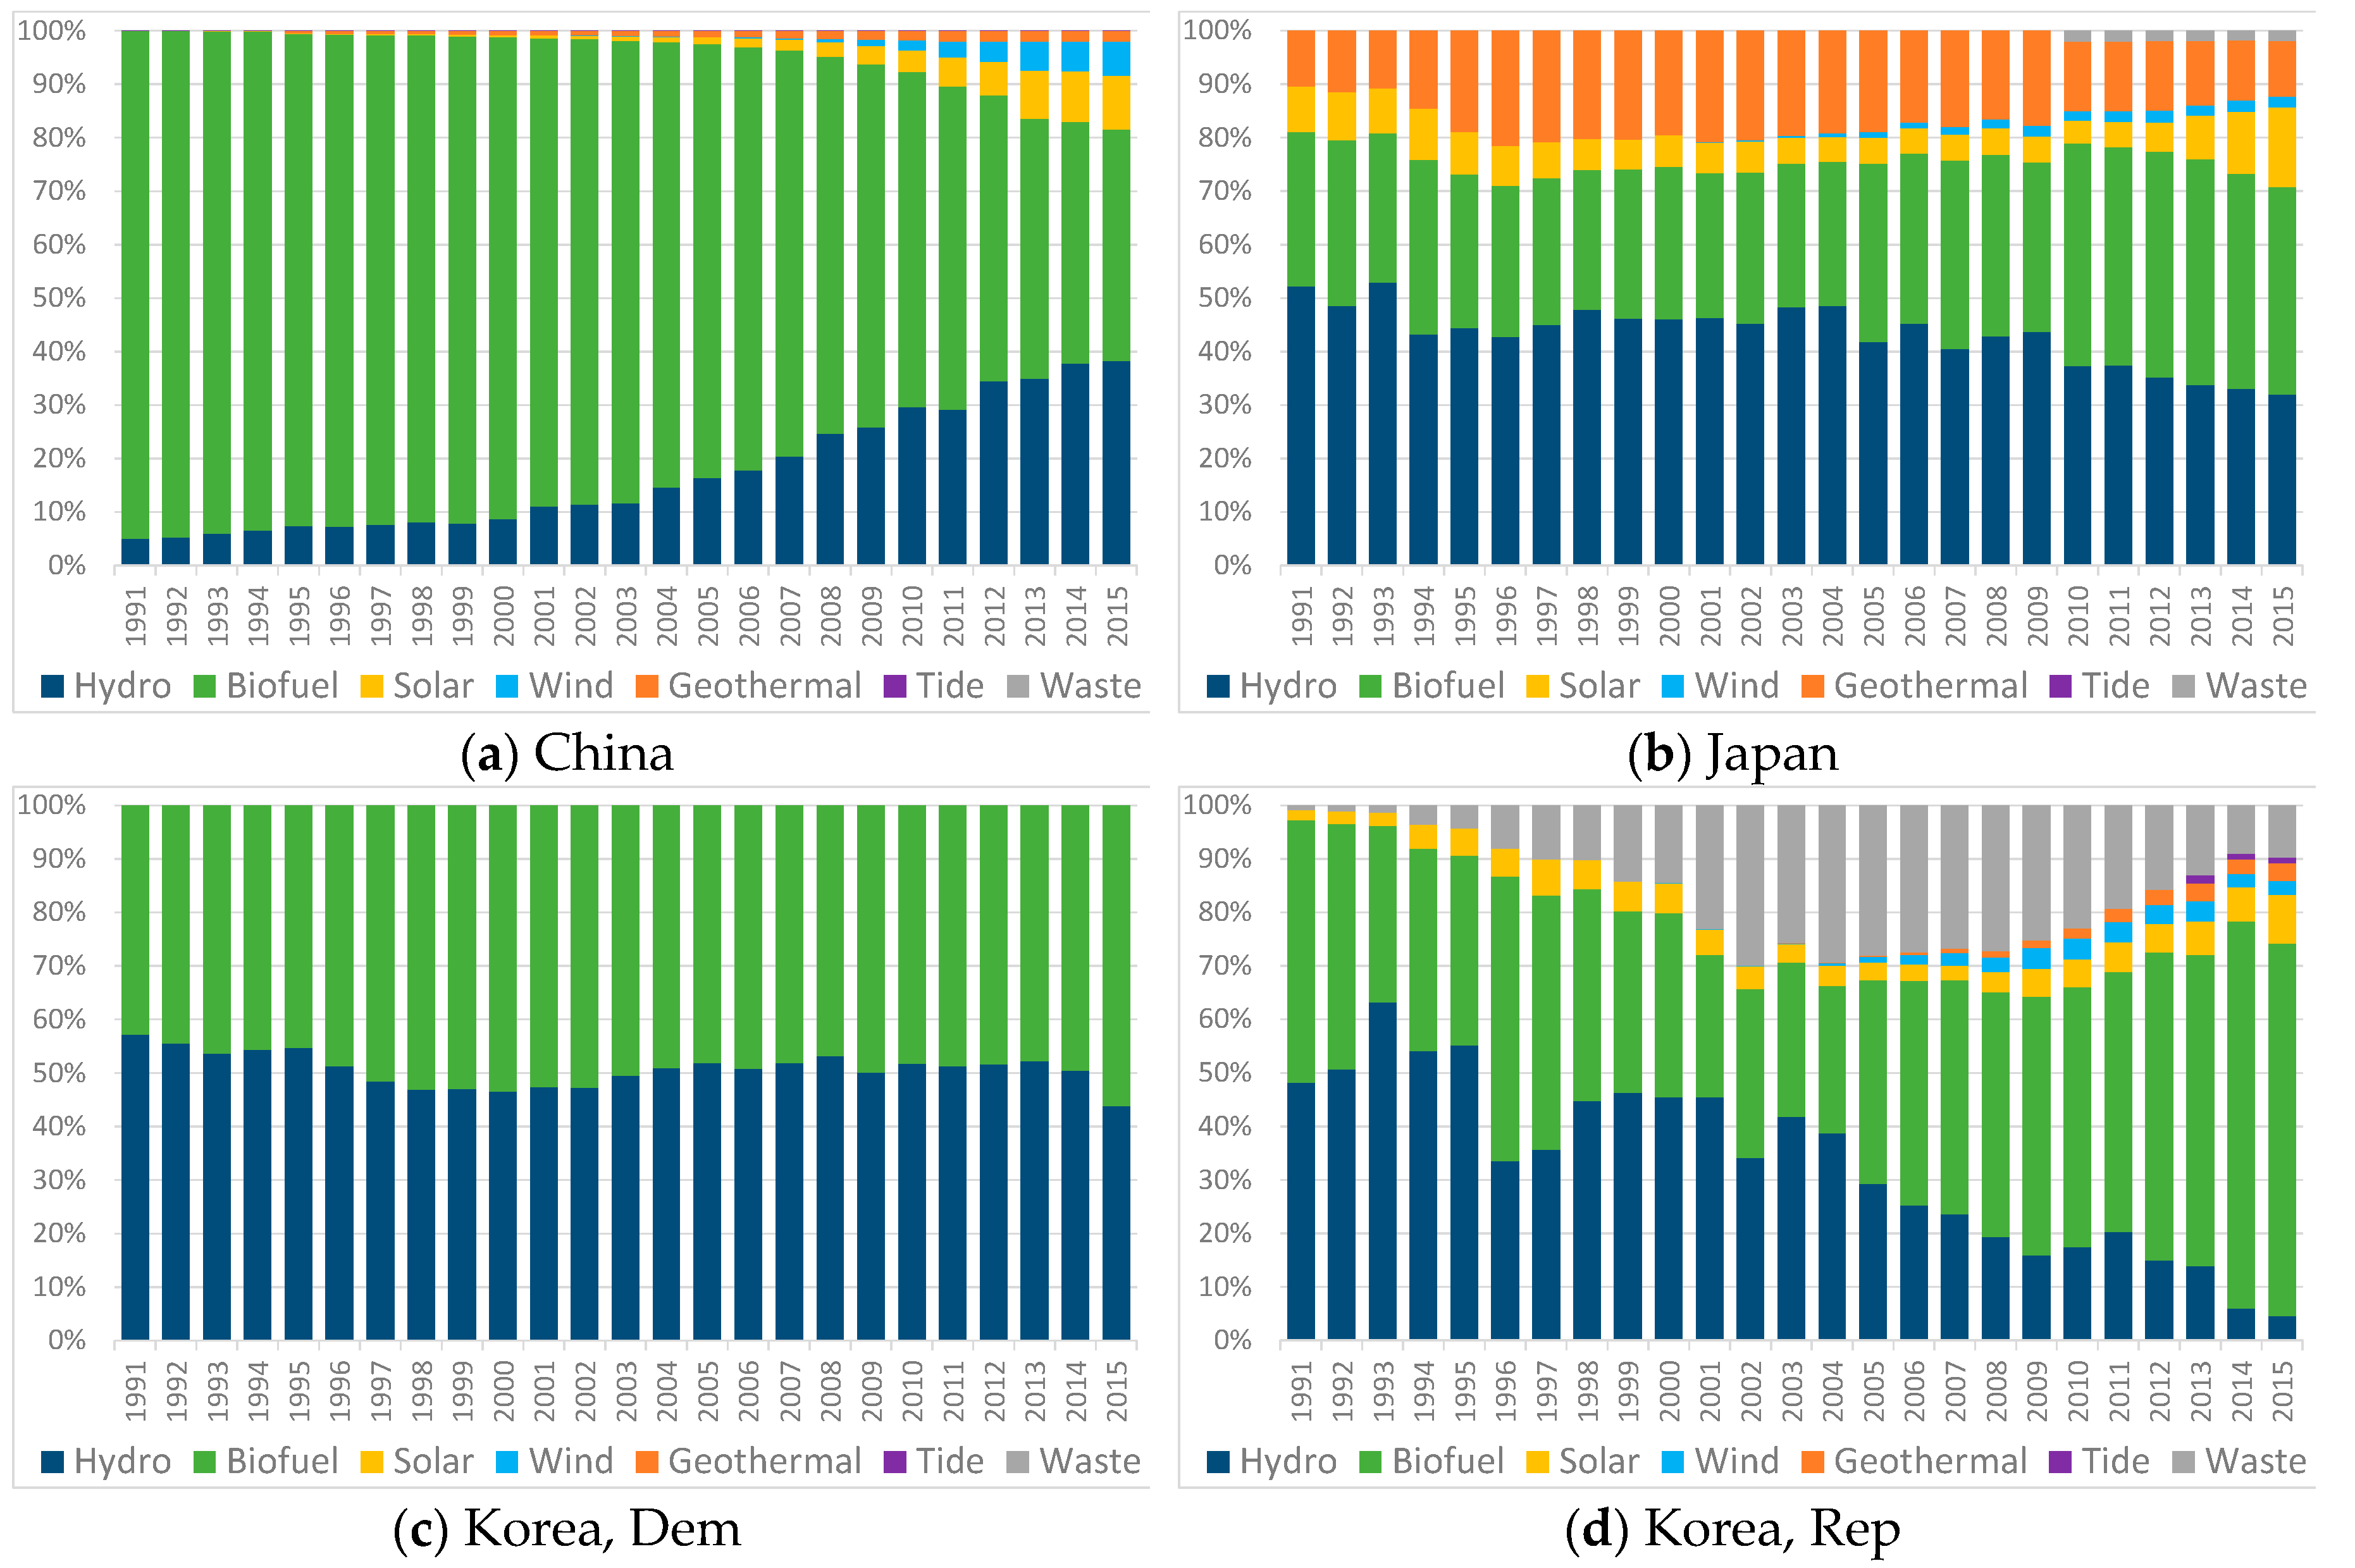
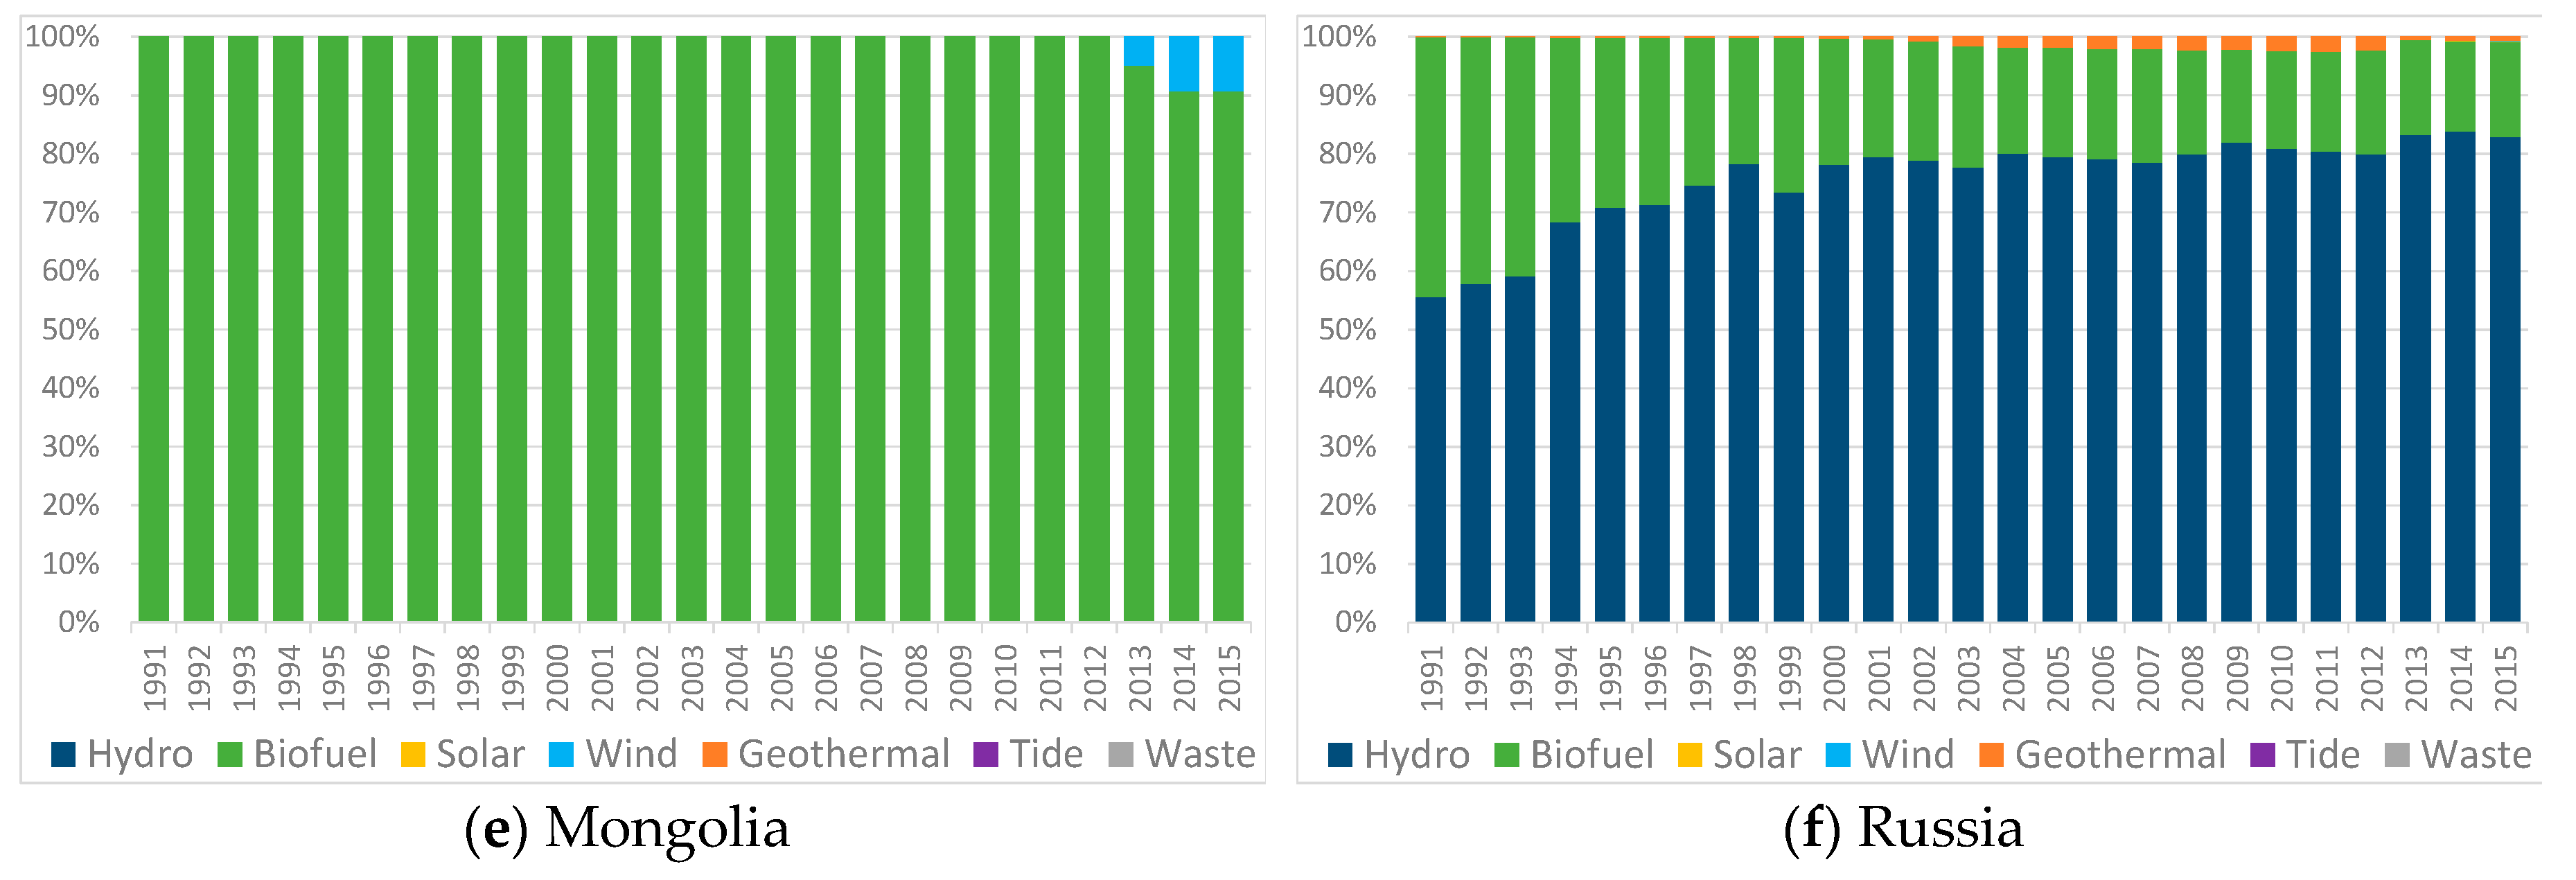
27], suggesting that they might be best suited as ‘donor’ countries in terms of technology know-how and funding. This is further supported by the high level of diversity of renewable energy sources currently in use in Japan and Korea (see
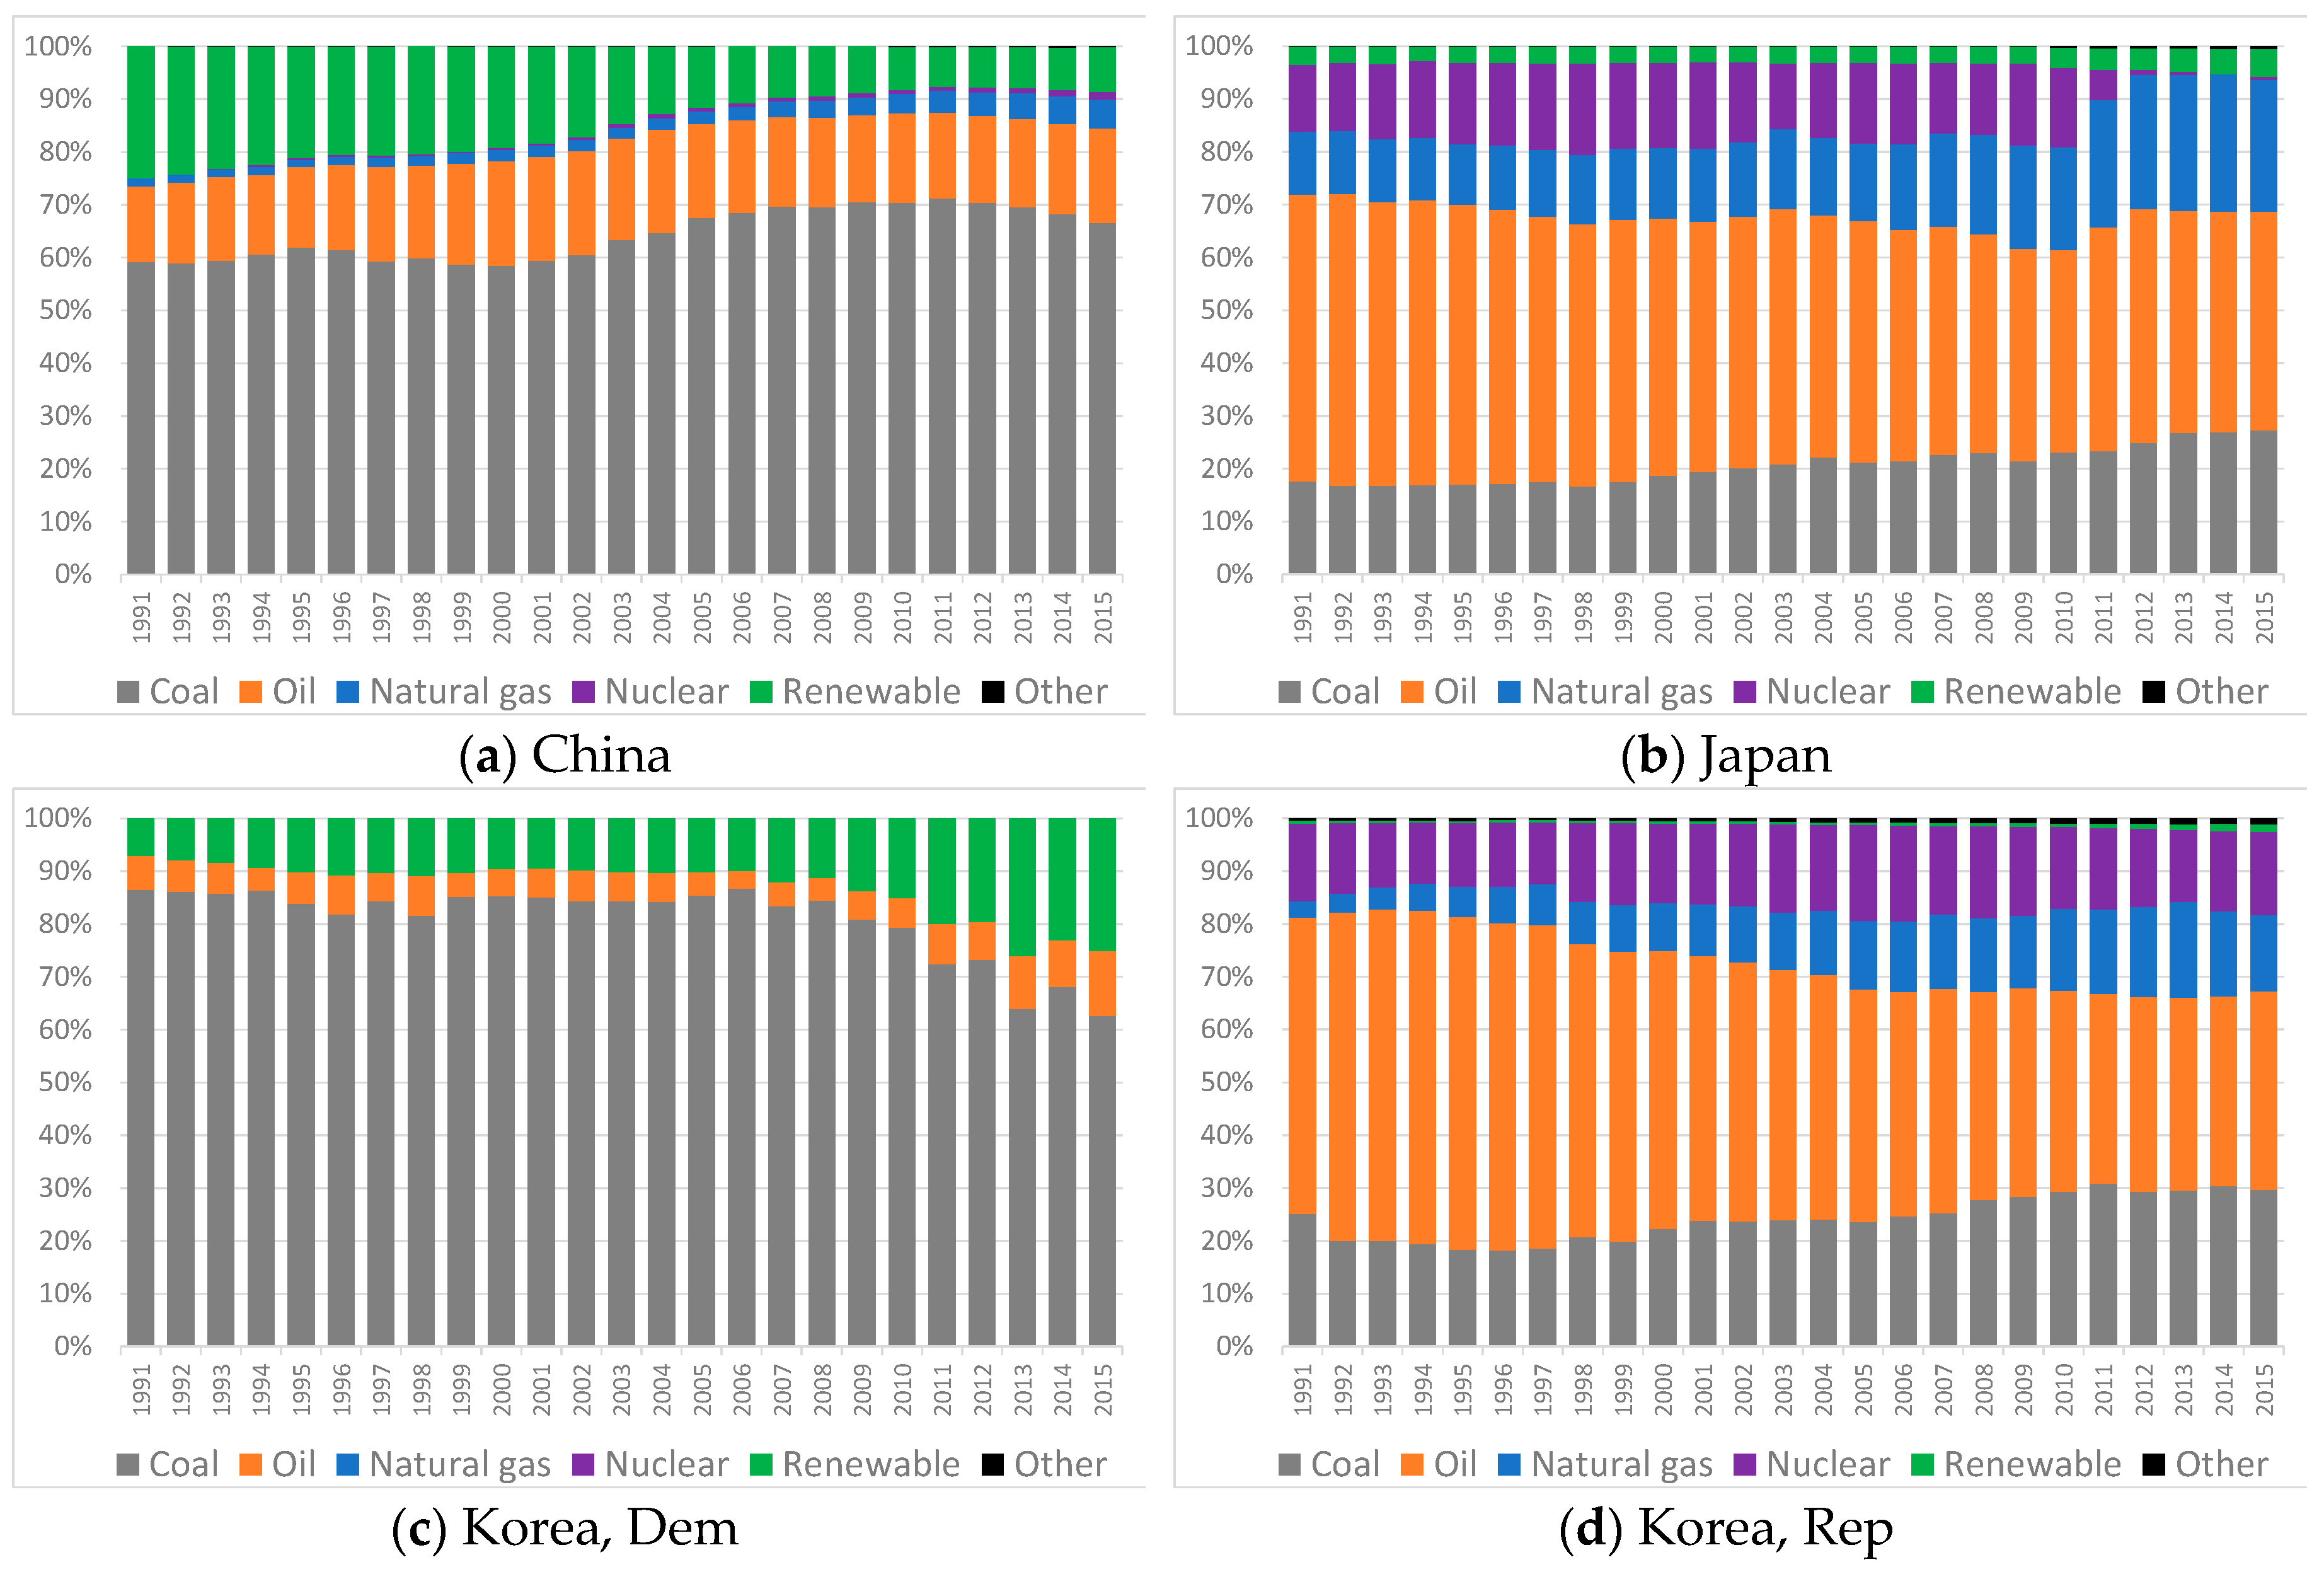
Figure 4), not seen in DPRK, Mongolia and Russia, which rely heavily on biofuel and hydro sources. In recent years, China’s renewable energy portfolio has begun to diversify, particularly in terms of solar and wind, with a small contribution from geothermal sources.
From our results, it appears that cooperation could potentially flow in two distinct ways. Firstly, with a shifting of some emission-intensive activities from Korea, China, and Mongolia into the DPRK and Russia, and, secondly, through the provision of technological know-how and funding for sustainable development from Japan and Korea into the DPRK, Mongolia, and Russia.
There are a number of measures which can be employed to enhance cooperation between countries in enhancing their sustainable development and for mitigating CO
2. Under the administration of the UNFCCC, three flexible mechanisms are currently available: emissions trading, the clean development mechanism (CDM), and joint implementation (JI). These flexible mechanisms were initially defined under the Kyoto Protocol to enable the cost-effective reduction of emissions in cooperation with other countries [
28]. In addition, Article 6 of the Paris Agreement identifies new market and non-market mechanisms for international cooperation. The nature of these mechanisms is currently under development within the UNFCC [
29] and are expected to succeed the Kyoto Protocol mechanisms. It is anticipated that new market mechanisms may include internationally-transferred mitigation outcomes (ITMOs), a new carbon market incorporating the World Bank (Carbon Market 2.0) and enhancement of CDM outcomes and targets [
30]. With regard to Kyoto Protocol mechanisms, CDMs are still in effect, and are initiated in Annex I countries (Japan and Russia), and then conducted in non-Annex I countries (DPRK, Korea, Mongolia, and China), in such a way that funding and assistance flows from developed to developing countries improving sustainable development while also reducing emissions in the developed country. The current major beneficiaries of CDMs include China and Korea, first and third, respectively, in the number of certified emission reduction (CER) credits issued [
31]. JIs on the other hand, take place between Annex I countries, allowing investment in emissions reducing projects in preference to reducing emissions within national borders.
Based on the findings and potential cooperation flow recommendations identified in this research, CDMs could be enhanced between Japan and the DPRK, Mongolia, and Russia, along with JI-based investment flows from Japan to Russia. Emissions trading on the other hand, which can be undertaken both within and outside of the UNFCCC framework, which may help to offset CO2 emissions in one country, does not guarantee any improvement to sustainable development in the country taking on the emissions.
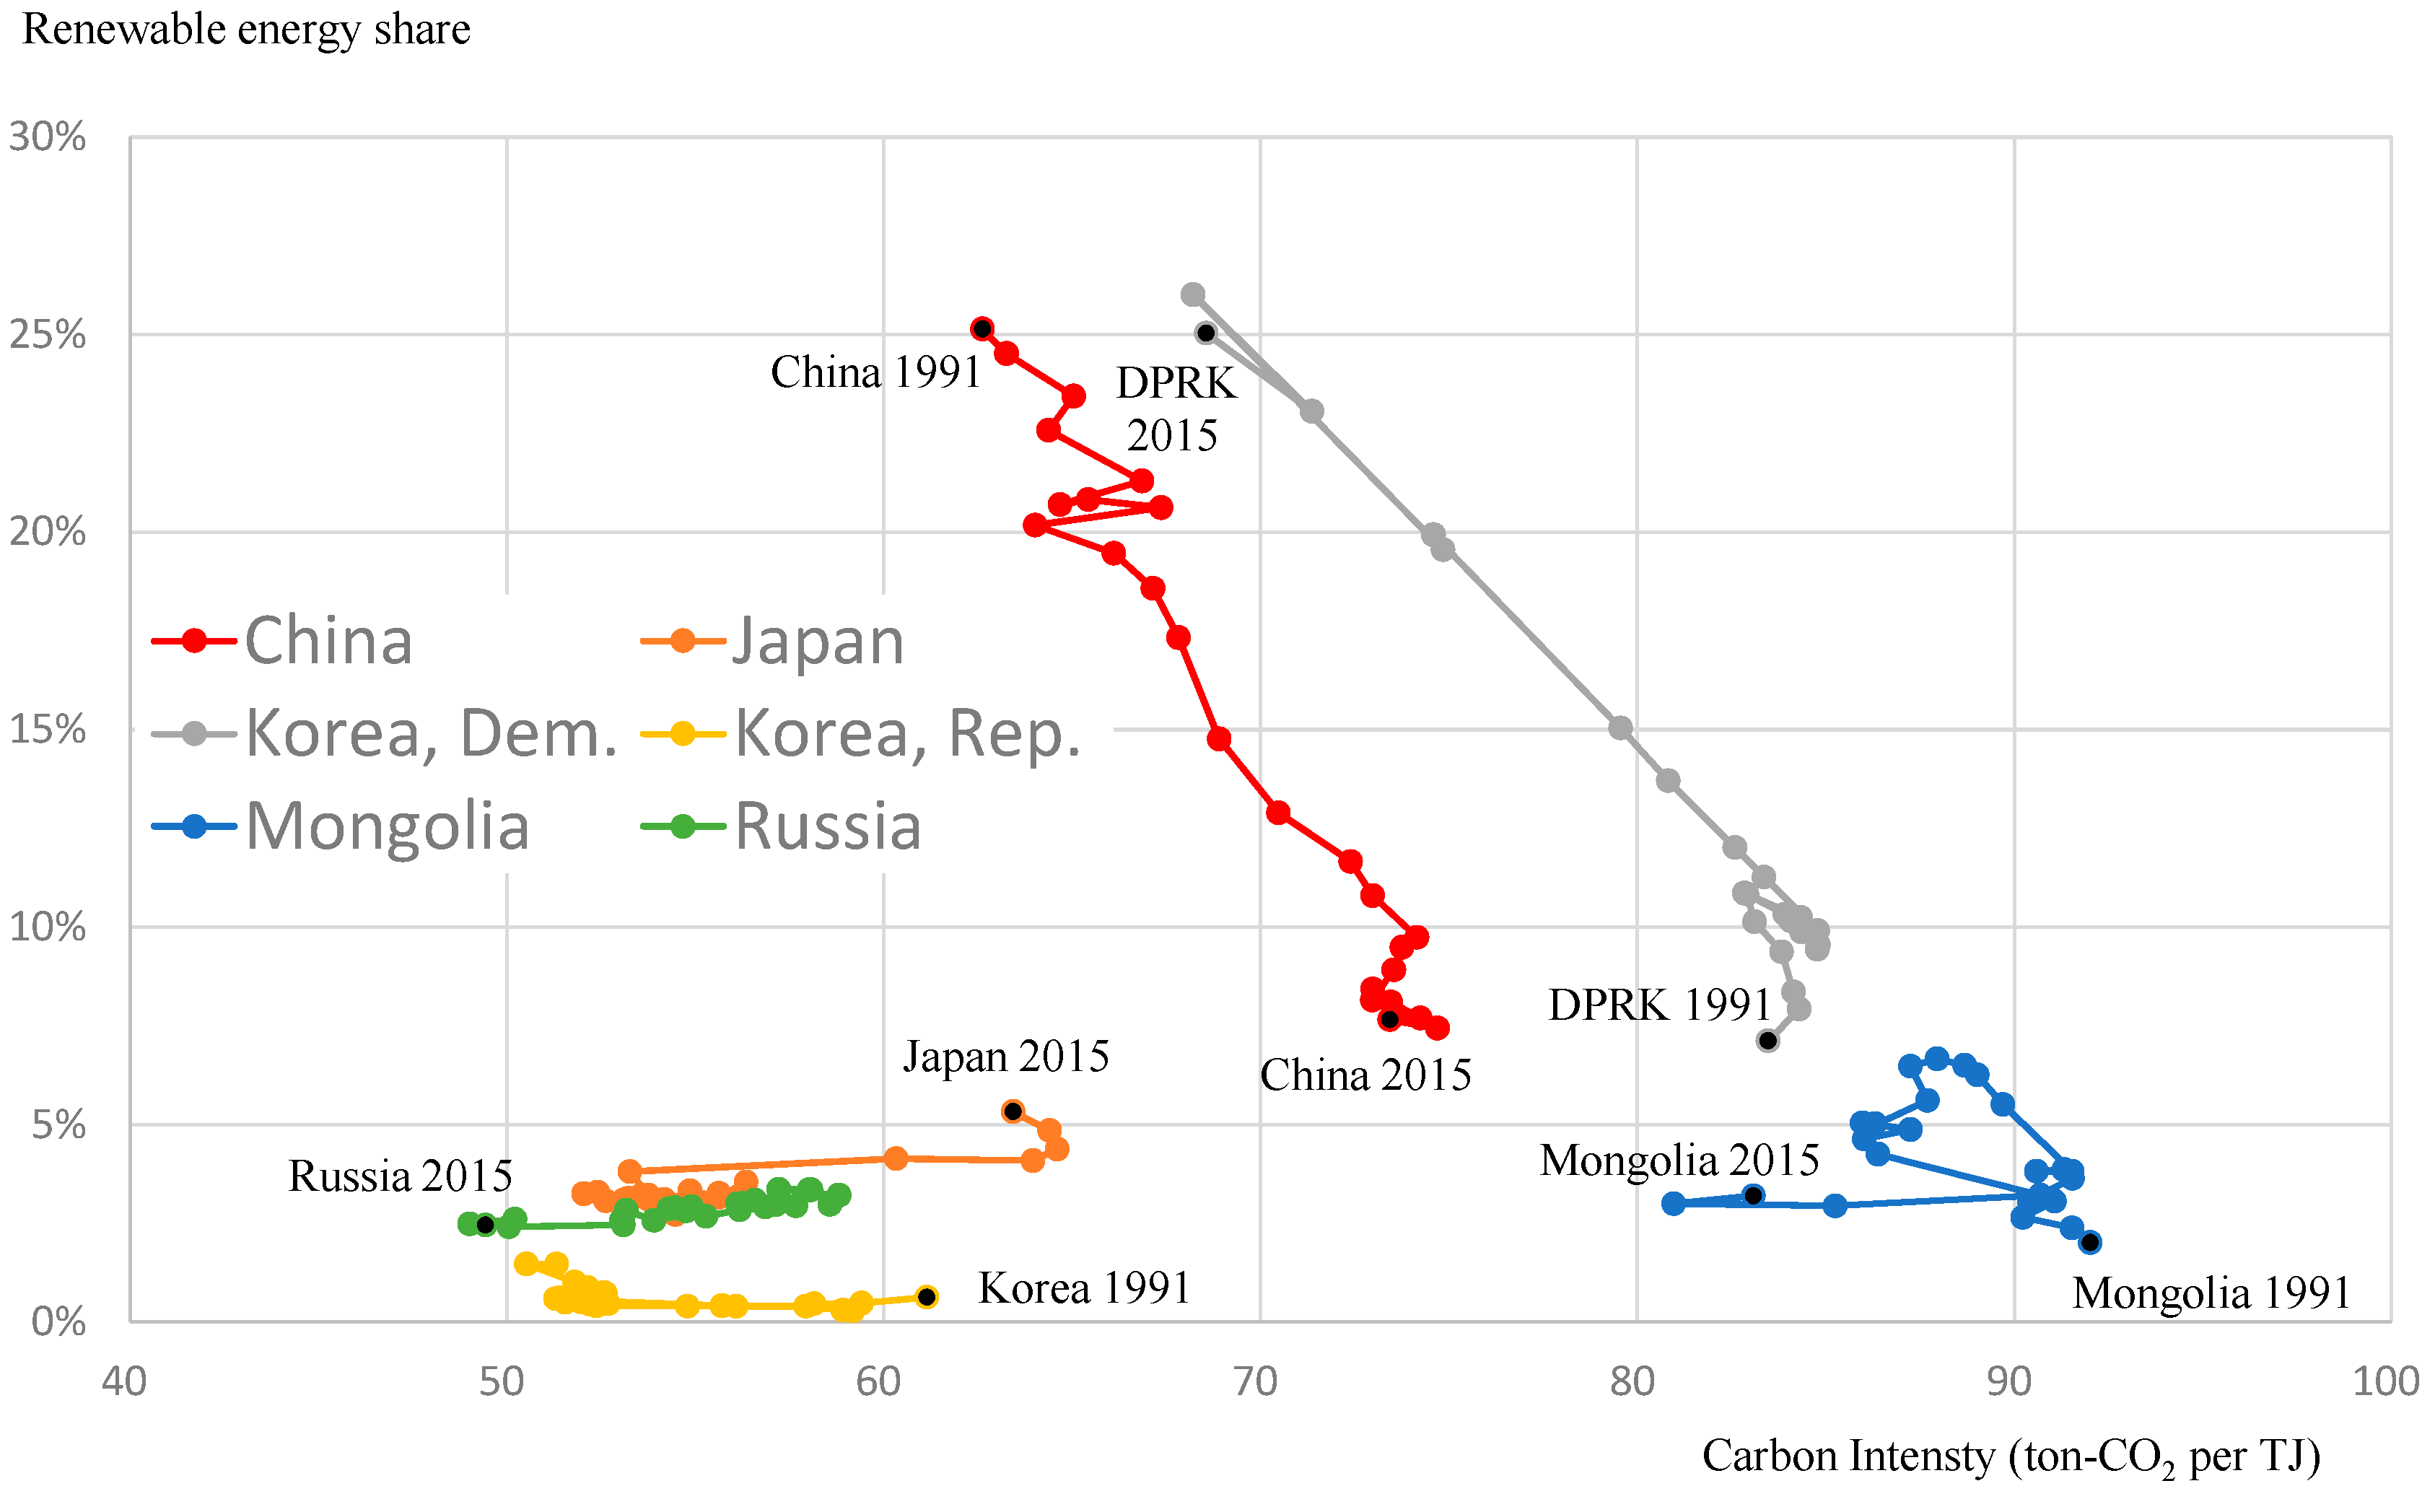
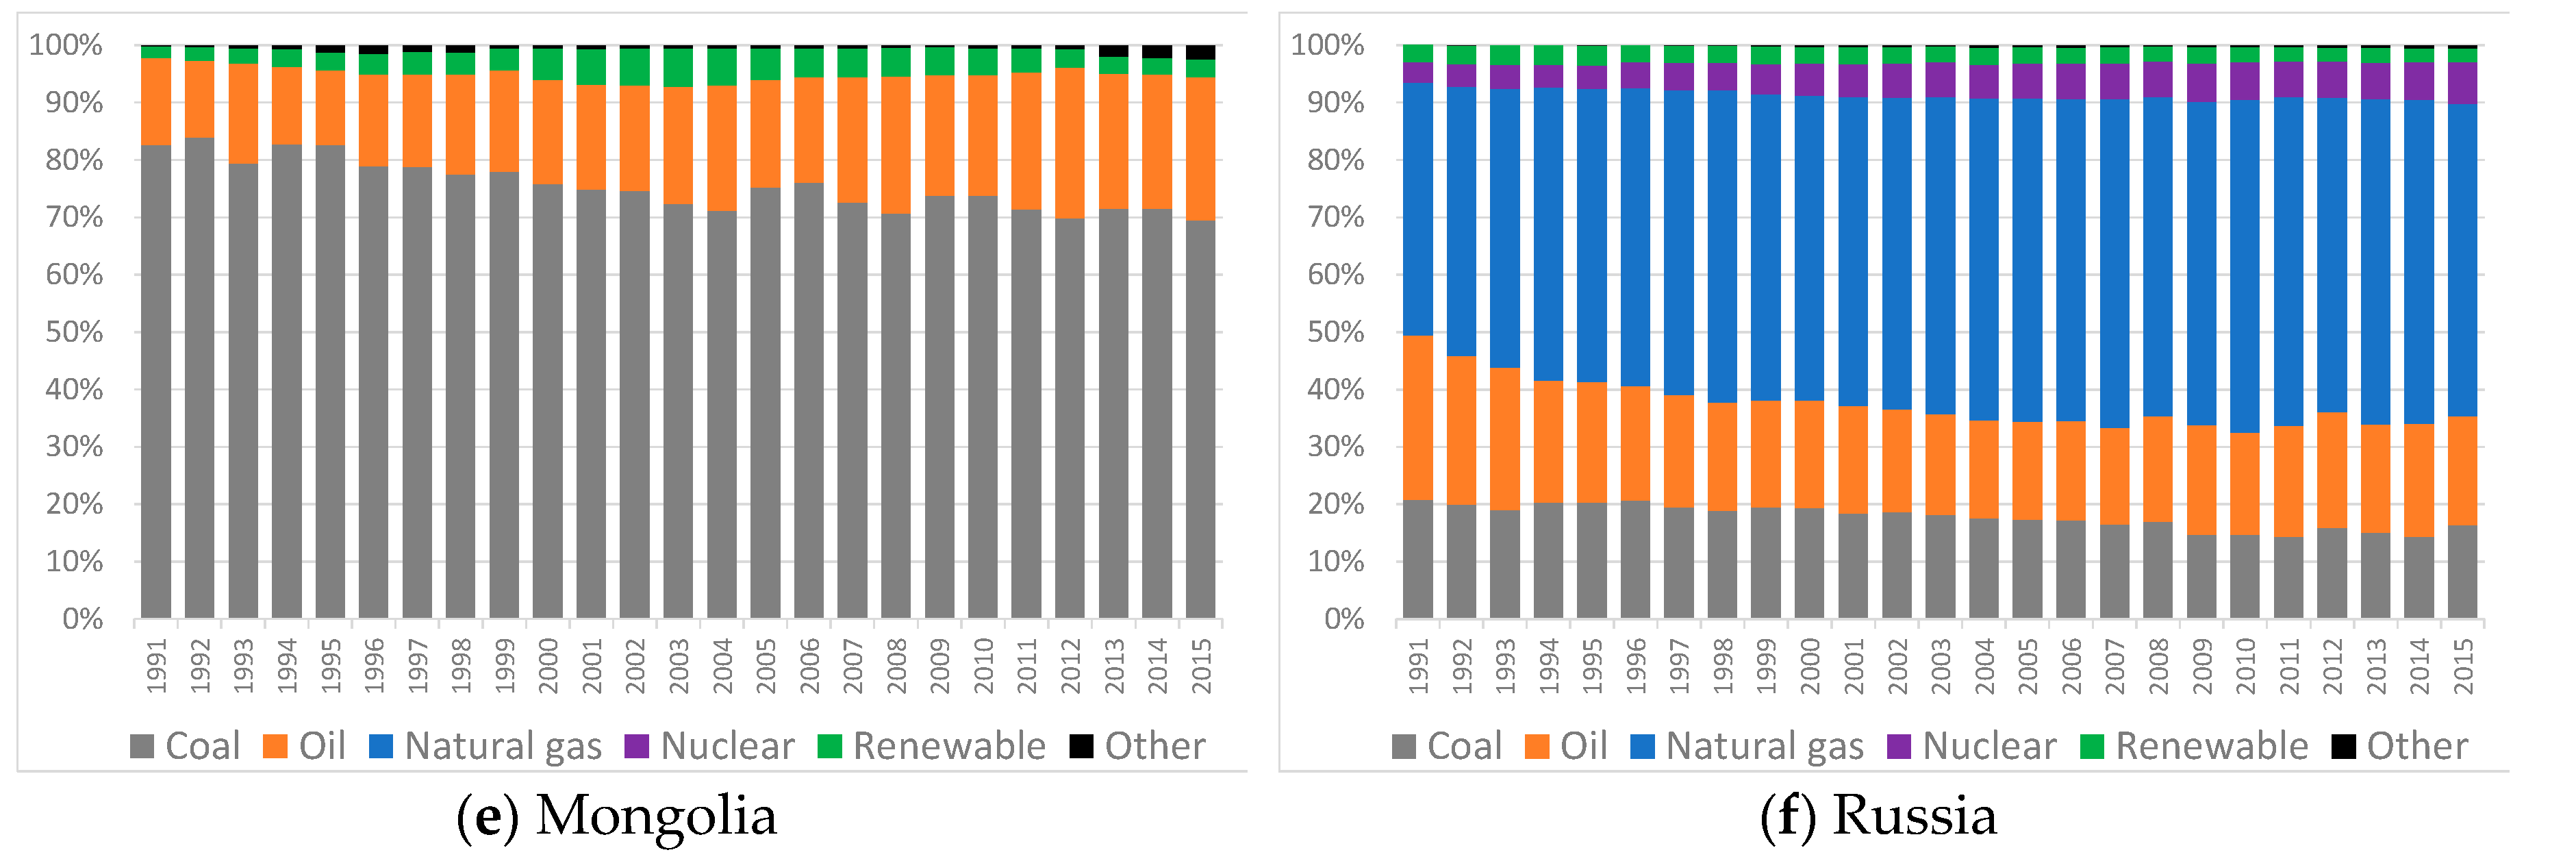
In terms of proposed Paris Agreement mechanisms, Japan has initiated the Joint Crediting Mechanism (JCM), a project based bilateral offset crediting mechanism to diffuse low carbon technologies. The JCM offers opportunities for technology transfers which enable emission reductions, with some feasibility studies already underway for highly-efficient, ultra-super critical (USC) coal power plants (Japan to Vietnam, India, and Indonesia). These feasibility studies may lead to cooperation whereby countries that are highly dependent on coal, including China, North Korea, and Mongolia (see
Figure 2) can benefit from emerging technologies being developed and implemented by Japan [
32]. In addition, these same three countries all have relatively low penetration of natural gas-based electricity generation, which has a lower carbon intensity than existing generation approaches. Countries with natural gas know-how, such as Japan and Russia, could use JCMs to deploy natural gas facilities into nations which are heavily reliant on coal and, therefore, have higher national carbon intensities (see
Figure 2).
An alternative approach to sustainable development cooperation under the UNFCCC, is through more conventional investment-based approaches, including the investment option known as ‘green bond’. Green bond markets can provide financial support to countries where a demand for green infrastructure investment is high, but traditional bank loans are not as readily available. Additionally, labelling a bond ‘green’ conditionalizes its use toward verifiable green projects [
33]. This green bond market is rapidly growing, from US
$42 billion in 2015 to US
$86 billion in 2016, with strong interest from China, Japan, Russia, and Korea in terms of both investment from multilateral development banks and international financial institutions, and the development of guidelines to facilitate future investment in sustainable development. Such investment is expected to help sustain growth of the global economy and to mitigate climate change and adaptation risks, which include financial loss and market volatility [
34].
The Paris Agreement furthers the process of harmonizing emissions reduction goals, and all six nations in this study have signed the agreement [
35], seeking to reduce emissions. Further, the focus of Asian cooperation has been highlighted recently, cognizant of the strained relationships between some of the investigated nations, however, highlighting the need for energy cooperation in order to provide a counterbalance to Middle Eastern instability and the supply of fossil fuels into the region [
36].
5. Conclusions
This study sought to achieve two aims; the clarification of the driving factors of CO2 emission trends, and to identify opportunities for cooperation toward sustainable development in Northeast Asia. The driving factors of CO2 emissions were found to be unique between individual nations, with a growth in CO2 emissions driven by economic development in Korea and China, a reduction in emissions experienced in the DPRK and Russia due to efficiency improvements, and a limited change in Mongolia and Japan, the result of economic development and energy efficiency improvements somewhat cancelling each other out. Of the five factors investigated (population, energy efficiency, economic development, fossil fuel share, and carbon intensity of energy generation) economic development and energy efficiency were found to be the most influential. Underpinning these findings, the energy system in each country was also found to be somewhat unique, both in terms of the share of fossil and renewable fuel sources, and the diversity of the energy supply portfolio.
Based on these findings, the potential for cooperation between countries was identified. The range of cooperation initiatives found to be appropriate to the investigated Northeast Asian countries are linked to the transfer of know-how and funding from developed to developing nations, and the enhancement of economic activity in developing nations, in order to reduce CO2 emissions in the most developed nations. In addition to established mechanisms for such cooperation, this study also assesses green bonds as a further stimulus for green infrastructure in countries where traditional financing instruments are difficult to obtain.
In order to achieve inter-regional cooperation, the harmonization of environmental policies and regulations between countries is required. Although the Paris Agreement is a positive step towards harmonization of environmental goals, further work is required in the region to realize sustainable, green growth.


