Spatial Configuration and Online Attention: A Space Syntax Perspective


1
School of Geographic and Oceanographic Sciences, Nanjing University, 163# Xianlin Ave., Nanjing 210023, Jiangsu, China
2
Department of Parks, Recreation & Tourism Management, North Carolina State University, 2820 Faucette Dr., Campus Box 8001, Raleigh, NC 27695, USA
3
Guangzhou Urban Planning & Design Survey Research Institute, 10-12# Jianshe Ave., Guangzhou 510060, Guangdong, China
*
Author to whom correspondence should be addressed.
Sustainability 2018, 10(1), 221; https://doi.org/10.3390/su10010221
Submission received: 11 December 2017
/
Revised: 7 January 2018
/
Accepted: 12 January 2018
/
Published: 17 January 2018
(This article belongs to the Special Issue Tourism Planning and Sustainable Development)
Abstract
:The spatial behavior of tourists is an important part of the research on congestion management and sustainable planning of tourism destinations. Combined with user-generated content (UGC) and site-based survey data, this study conducted an overlaying analysis between street network configurations that resulted from space syntax and tourist preferences. Based on space syntax, tourist movement is influenced by the distribution of scenic spots and the structure of tourist trails in scenic mountain areas. The results reveal that the distribution of scenic spots has a significant impact on tourist flow and visitors’ choices of entrance to the mountain; the volume of online sign-ins is highly correlated with landscape attention, axial control values and the local integration value of the trails; and tourists’ attention focuses on the entrance area and the few tourist-sight markers. This study advances the understanding of the spatial patterns of within-destination tourist behavior; this knowledge will be helpful in alleviating congestion in mountain scenic areas and providing effective guidance for tourists to plan an ideal tour route.
1. Introduction
Mountain tourism is one of the main types of global tourism, and mountainous scenic areas are the most typical natural and cultural sites in China. Understanding the spatial behavior associated with the most distinguished sightseeing type is very important for destination planning and management, especially for tourist evacuation, which is still a pressing problem for mountain scenic spots in China.
The research suggests that the attraction and spatial distribution of scenic spots within resorts are key factors that influence tourists’ behaviors [1,2]. Mountain hiking trails to scenic spots are winding and complex. However, tourists still seek these roads to find the scenic spots they want to see or that have been recommended as a must-see [3,4]. “I see not the true face of Lushan Mountain because I am in the mountain”, wrote a famous Chinese poet almost a thousand years ago. However, this interesting phenomenon does not have corresponding empirical research.
Very little research has examined the spatial patterns and tourist behavior of mountain scenic areas [5]. The interaction between tourists’ subjective pursuits and the objective environment deserves close attention in small-scale tourism spaces [6]. Within the space syntax framework, physical space may be abstracted as topological relationships composed of nodes and axes [7].
The reason for the lack of related research could be due to the complexities associated with the behaviors of mountain tourists and the difficulty in obtaining spatial and behavior data. However, this study conducted a rare cross-validation of big data and questionnaire data. First, a questionnaire survey was adopted, and 510 effective route samples were collected. Then, the numbers of photos and sign-ins for corresponding scenic spots were collected from a famous travel community website. Such data are useful for studying the differences between the distribution of scenic spots in real space and the attention of tourists in cyberspace [8].
The remainder of the paper is organized as follows. The next section provides a brief review of space syntax applied in the tourist behavior research. The third section clarifies the collection process of two data sources and discusses the details of space syntax in mountainous areas. The fourth section presents a case study of Mt. Sanqingshan and takes advantage of space syntax and kernel density in visualization to analyze the relationship between the flow of tourist visits and the spatial hierarchy of scenic spots. Finally, a discussion and conclusion are presented to provide a better understanding of tourists’ preferences and wayfinding behaviors [4,9,10].
2. Literature Review
2.1. Space Syntax in Tourism Research
As a language that quantitatively describes spatial structure, space syntax considers human spatial behavior to be a type of natural movement [7]. Hillier et al. analyzed the interaction among attraction, configuration and movement, including through-movement and to-movement (Figure 1), and they proposed the concept of natural movement to indicate that the distribution of movement depends on spatial structures [7]. Spatial structure and accessibility have an impact on human spatial choice.
Space syntax has become a key method for studying the relationship among space, spatial structures and human behavior in the fields of urban geography, the built environment and scenic spots [11,12,13], especially with respect to small-scale areas. In the field of tourism, Landré found that the distribution of boats on the waterways of Cyperaceae National Forest Park was significantly correlated with the general and local integration of the road network [14]. By observing the spatial behavior of 1208 tourists in Ningaloo Ocean Park, Smallwood et al. concluded that the decision to visit a place depended significantly on the spatial formation of the road network [1]. In addition, attractions’ spatial occupations affect human spatial behavior, and different environmental elements have various impacts on tourist behavior [15]. Li et al. applied space syntax analysis to provide an understanding of road networks and space-time evolution and studied the correlation with tourist preferences for urban historic sites [16].
Therefore, determining how to interpret spatial structures becomes important when studying tourists’ spatial behavior. Recently, studies have discussed the spatial behavior of tourists in small-scale scenic areas. Nonetheless, studies on the spatial characteristics of tourist preferences within-destination have rarely been addressed in the current research [6].
2.2. Tourist Preference and Spatial Distribution
Attraction, as an important concept in tourism, is a core element of tourism activities [17]. Attractions are objectively not only natural landscapes or sites of cultural heritage, but also a socially-constructed system [18]. The spatial behavior of tourists results from their preferences and perceptions of tourism spaces [19].
The “tourist-sight marker system” is interrelated with scenic spots forming the “center for tourists” [18]. The issue of the marker or image of a site is an important factor for tourist destination selection; however, there is very little empirical research about the space within tourism destination areas [6]. Landscape images in Central Spain were categorized, and the degree of correspondence and spatial-distribution between the types of visitors was analyzed [20]. A cognitive map is the representation of the spatial cognitive structure of an attraction. Combined with space syntax, Lu identified a comparatively direct relevance between indicators such as spatial integration and the frequency of marks and nodes that appear in residents’ and tourists’ perception maps of historical street blocks [21].
Scholars have begun to utilize search engines [22,23], user-generated content (UGC) [24,25], user-generated photography [25], heat maps [16] and other Internet big data to study tourist preferences and spatial behavior [26,27], drawing from the rich data on geographical locations that are increasingly available. The studies based on big data mainly present opinions about landscape preference and posit that the majority of landscape users judge the value of the landscape based on their respective preferences. We aim to expand the research by developing visual maps based on a large sample representative of the cognitive structure of tourist preferences.
3. Research Case and Methods
3.1. Research Case
To study actual tourist behavior and related aspects of scenic spots, this paper selected the Mt. Sanqingshan Scenic Area (hereinafter referred to as “Mt. Sanqingshan”), a UNESCO World Natural Heritage Site and well-known Taoist mountain site located in Shangrao, Jiangxi, China. This case is a typical mountain in terms of spatial dimensions, topographical complexity and trail formation (Figure 2). Landscape attractions are the most important factors in attracting tourists. There are 153 scenic spots in the core tourism area of Mt. Sanqingshan, including the most well-known sites such as the Oriental Goddess and Emerging Serpent of Nanqing Garden, the gallery roads, the cloud sea and the sunset scenes of the West Seashore and Sunshine Seashore. In the east, south and north of the scenic area, there are two cableways at Jinsha and Waishuangxi that go up and down the mountain, respectively. Waishuangxi and Fenshui serve as the entrance and exit sites for tourists. Tourists can choose different cableways up and down the mountain at a uniform price. While the study was being conducted, the Yujing Mount Scenic Area was closed for ecological protection.
3.2. Data Collection
A tourist survey at the Mt. Sanqingshan Scenic Area was conducted from 10 June–12 June 2013. The questionnaires were distributed at the Jinsha Tourist Service Centre in the east and at the Waishuangxi Tourist Service Centre in the south. The actual investigation did not cover the northern entrance where traffic down the mountain was scarce during the pre-research phase. Apart from a small number of trekking adventure tourists (less than 5%), these two cableways (Figure 3a, A and B) are the only ways to go up and down the mountain, providing tourists with places to gather and rest. The research team was composed of four doctoral degree holders and six master’s degree holders with majors in tourism geography who were sufficiently familiar with the spatial structure of the mountain to be able to instruct tourists to recall and draw their visit routes at the Mt. Sanqingshan Scenic Area.
The questionnaires were distributed to tourists who had finished the scenic area tour and exited by cableway at Waishuangxi and Jinsha. The questionnaire included resort guide maps (Figure 3a), and the tourists were asked to draw their tour routes with the sequence of nodes visited. To choose the key visit nodes in the scenic area and the appropriate places to distribute the questionnaires, the research began with a pre-investigation in April 2013. A total of 600 questionnaires was distributed, and 589 were returned, for a return rate of 98.2%. Among these questionnaires, 510 were effective and provided a complete tour route, for an effectiveness rate of 86.6%. In the subsequent processing, the entrances, tourist trails and key spots were simplified and marked with the letters A through Z. The service spots were not included in the questionnaire because they were very small and integrated with the scenic spots, and the impact of these facilities was not considered in this study.
This study also obtained secondary data collecting three attribute values of 34 scenic spots within Mt. Sanqingshan from a novel data source: 1980 photos with 2260 comments and 29,930 sign-ins generated by website users on Mafengwo (www.mafengwo.cn), the largest self-service tourist information website in China. The data were uploaded by the users from March 2012 to January 2016; the number of sign-ins at scenic spots was important historical visit data, and the number of photos for each scenic spot was selected as an indicator of online attention reflecting the users’ preferences after their visit.
3.3. Analysis Method
Space syntax theory posits that when a person moves in a space, each decision is based on the visibility of the entire spatial structure rather than on an individual space. Based on this concept, Hiller et al. utilized graph theory to simplify large spaces into topology network systems composed of nodes and axes [13,28].
Based on the ArcGIS10.0 platform, the Axwoman 6.0 plug-in was adopted to conduct an axial division and to build topology connection diagrams for the Mt. Sanqingshan road network [29] and to extract the structural features of the entire space. The traditional calculation methodology of traditional space syntax has the drawback of confusing axial diagram definitions and difficulty in addressing circular roads [7]. The trails in the study area consist of four loops. Tourists use tourist-sight markers or forks as nodes for further path choices. Therefore, in determining how to describe the tourist trails, it is effective to use certain special locations, such as crossings and road bends, to build topology integration into the calculations with the principle of the longest and the fewest axial lines. According to multi-round optimization, the principle of breaking at crossings was used as a basis for processing the bending position of crosswise, zigzagging and long elevating gallery roads in two sections (Figure 3a, e.g., J, P) at any potential locations where tourists are likely to return after having visited the site.
The kernel density estimation method has been widely used by studies about spatial form distribution and network attention of scenic spots to estimate the probability density of random variables [30,31]. When the kernel density function is only used to estimate scenic spot distribution, it is not subject to weight; when it is used to estimate the distribution density of tourist attention and space visits, the weight factor covers the visits, uploaded photos and comments of different scenic spots listed by the website.
There is a mutual influence relationship among attraction, configuration and movement. Measurement using the space syntax variables related to other data has been widely adopted [7,16]. This paper adopts a multi-linear regression method to analyze how online attention and spatial integration are correlated with tourist flow on trails.
3.4. Research Questions
This study conducted a rare cross-validation for the hypothesis that analysis of the spatial integration of trail networks will provide a better understanding of tourist behavior and preference. Therefore, three research questions are proposed to fulfil our objectives:
- (1)
- First, how do we understand the general morphological structure of the trails and can space syntax analysis provide us with an accurate illustration of the morphological structure of the mountain?
- (2)
- Second, what are the spatial differences and correlations between the actual tourist routes and tourists’ impressions after travel?
- (3)
- Third, based on the questions above, how do we understand the effect of trail network integration and how might this network integration affect tourist preferences and behavior? Further, how might we begin to alleviate congestion and provide more visual guidance for tourists planning their ideal tour route?
4. Results
4.1. Space Distribution of Scenic Spots and Online Attention
The spatial distribution and concentration of scenic spots, online landscape attention and tourist flow can be analyzed and presented through kernel density. By analyzing the spatial structure of Mt. Sanqingshan’s scenic spots through the scenic spot distribution on the Mt. Sanqingshan guide map, the key sightseeing spots were selected as scenic positions (e.g., Python Rising, Oriental Goddess) that could be observed from different perspectives. The kernel density analysis of the overlapping road map and space syntax overview integrated with the scenic area map were divided into eight density levels, distinguished by the color of the space such that the deeper the color is, the denser the distribution of scenic spots (Figure 2b). The results showed that the internal attractions of Mt. Sanqingshan are distributed widely, with many scenic spots along the road. Scenic routes have been reasonably placed. Along with the high-density regions, such as C, E–F, K–O–L ring road, M–N trail and other roads, scenic spots are found to be widespread, and two kernel centers have been formed: the south of Nanqing Garden and Sanqing Temple Scenic Area (H). The Sunshine Seashore Gallery Road (G) and West Seashore Gallery Road (J) are not only key sightseeing gallery roads, but also passages connecting two kernel centers that play an important role in the region.
Sign-ins, comments and photos of 34 scenic spots were collected from the website as weighting factors. The comparison of the kernel density distribution figure (Figure 3b) shows that landscape attention (based on the number of photos) is concentrated at Entrance B, the north of Nanqing Garden, which primarily includes two of the top ten must-see scenes of Mt. Sanqingshan: Python Rising and Oriental Goddess. At the same time, historical visits form two cores in both the south and north of Nanqing Garden. The tourist traffic of Sanqing Temple Scenic Area (H) is low due to its long distance from the cableway, which indicates that spatial integration significantly affects scenic attention.
According to the daily cableway tourist flow data provided by the management committee, the number of tourists who went up the mountain by Waishuangxi Cableway (A) was slightly lower than the number of those who visited by Jinsha Cableway (B), which is aligned with the kernel density map based on historical visit data shown on the website. As a result, although A is a scenic spot kernel density center, the upper station area of Cableway A receives lower scenic attention (as shown by photos) than the upper station area of Cableway B (Figure 4a,c).
4.2. Analysis of Road Network Structure
4.2.1. General Integration
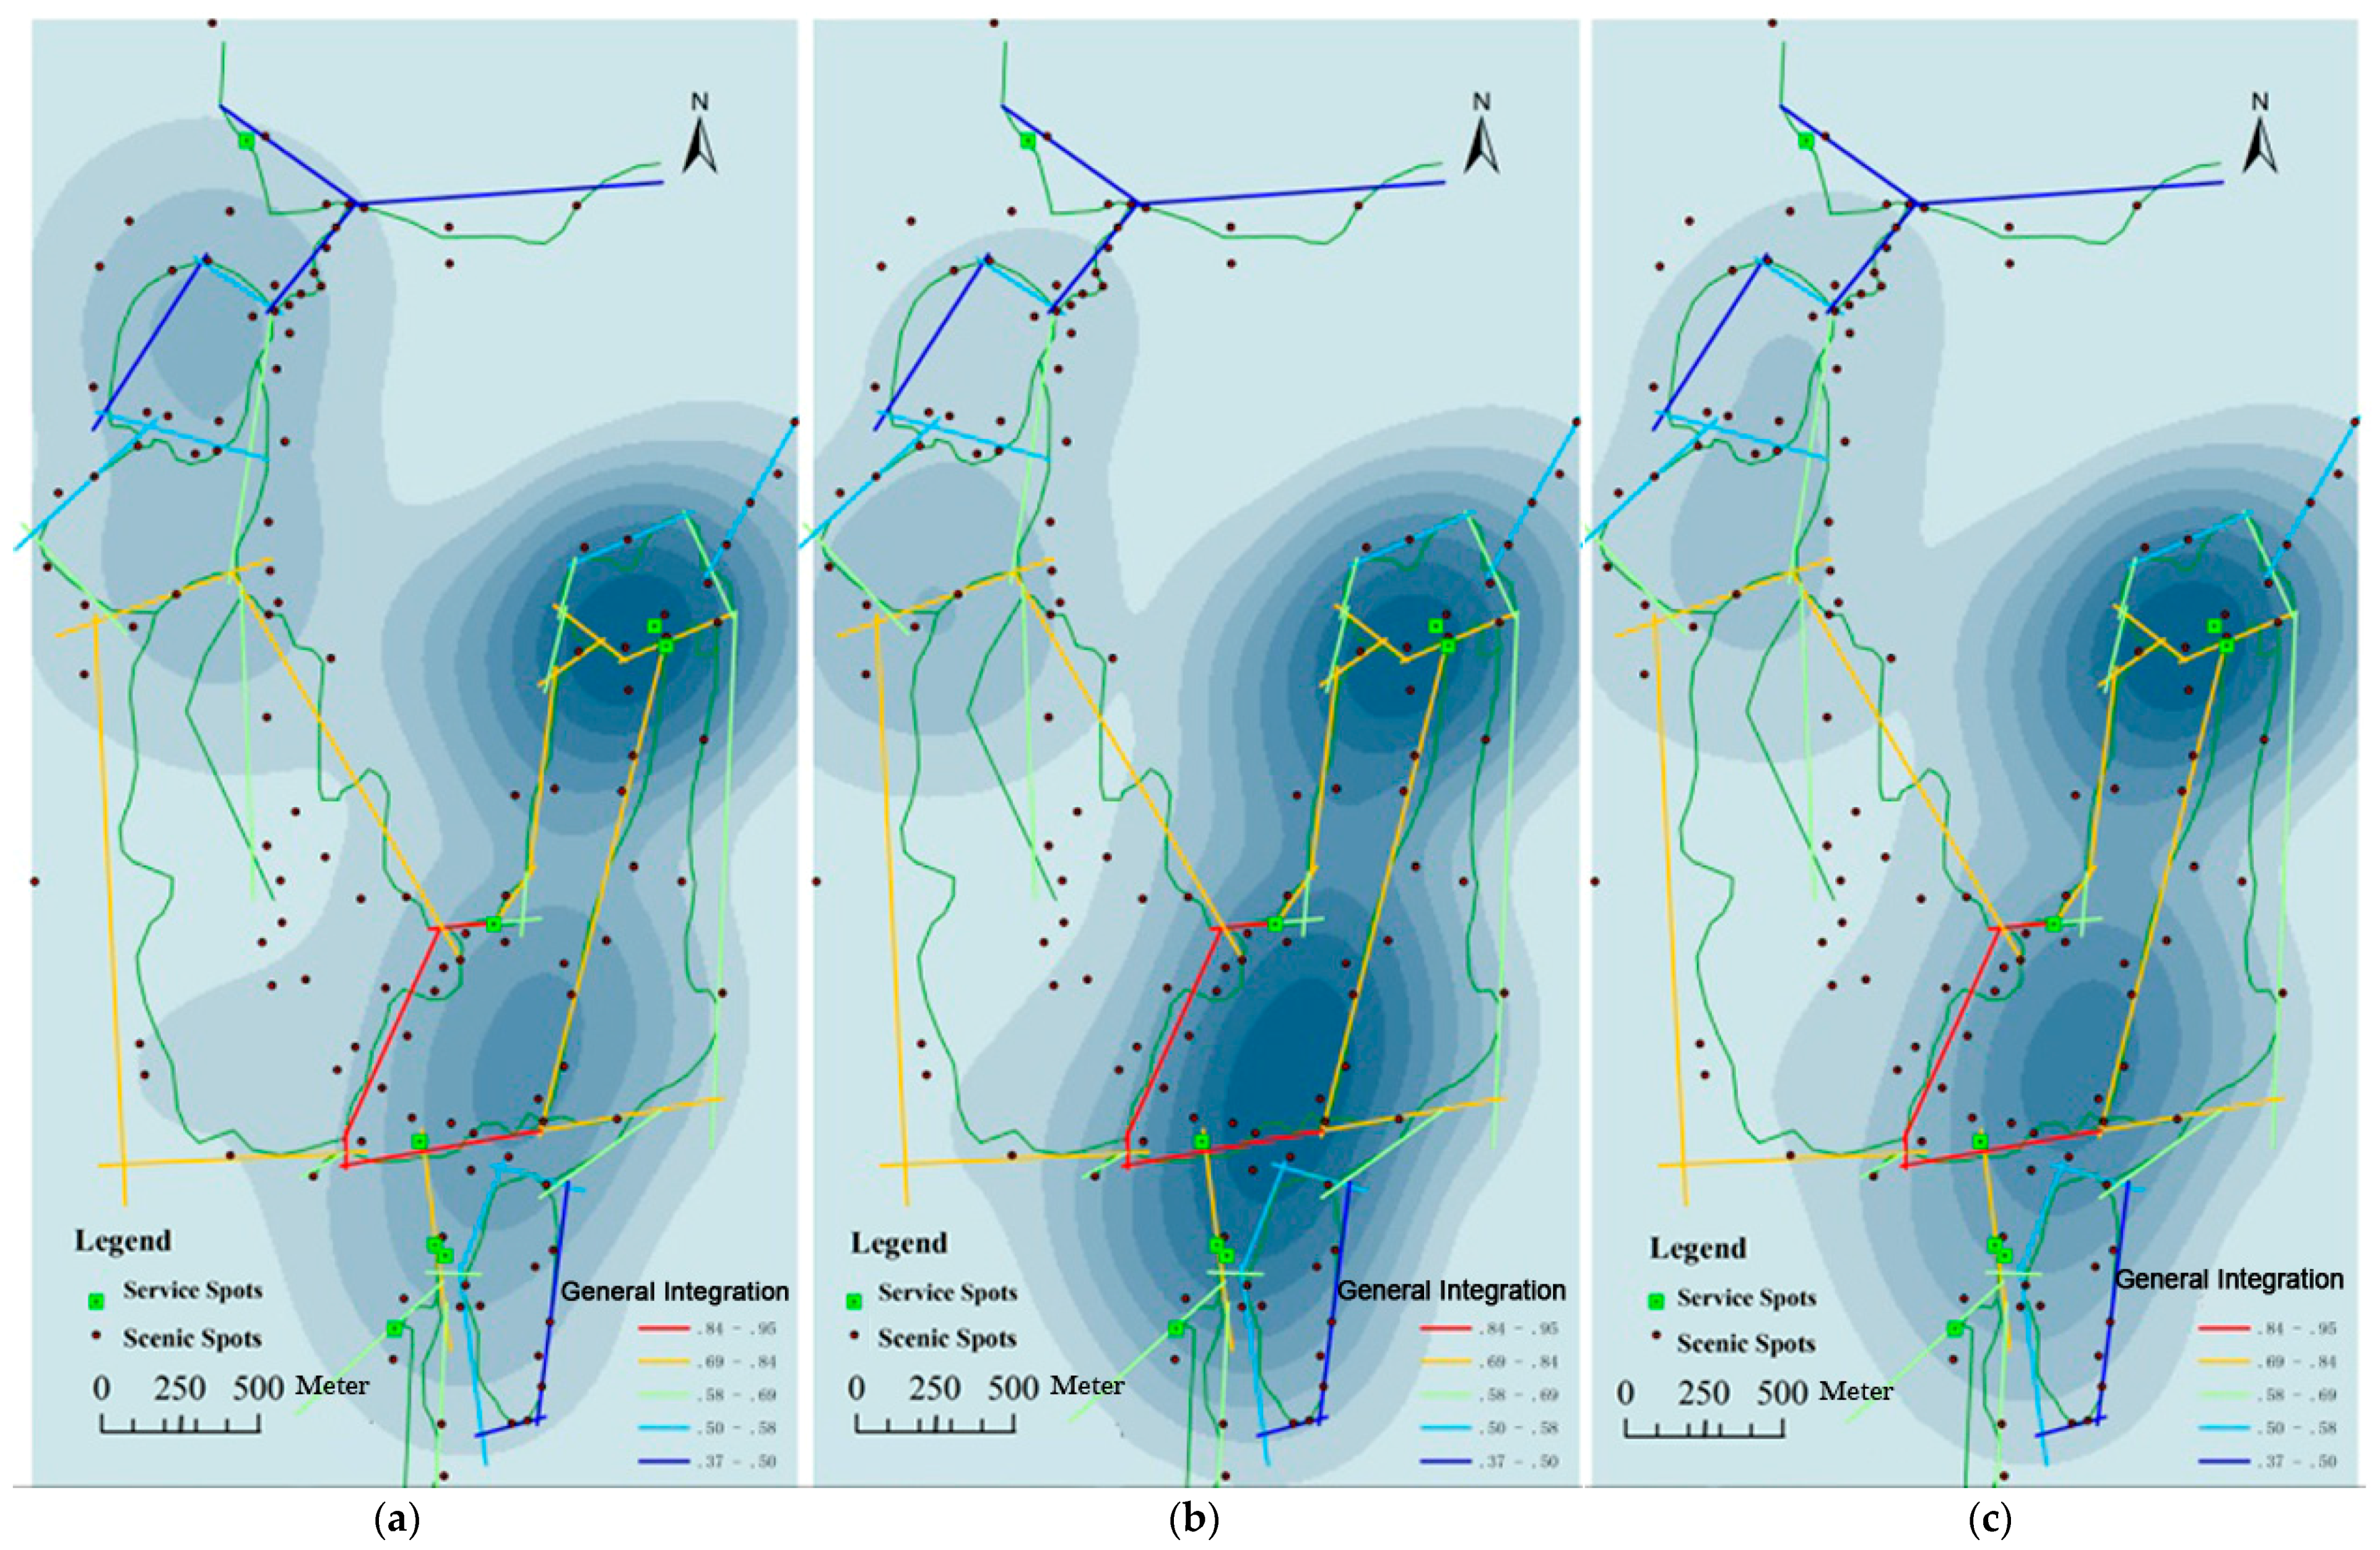
Space syntax has five key measurement variables: the connection value (the higher the value, the better the permeability in terms of nodes connected with Node i), control value (indicating the effect of one space on the neighborhood), depth value (the shortest distance between nodes), integration value (including general Rn and local R3) and intelligibility [32]. According to the correlation R2 (0–1) between the local variable connection values and the general variable, which measures the overall integration of the Mt. Sanqingshan trail network by space syntax analysis, the intelligibility is calculated as 0.324 (p = 0.001), which means that it is difficult for tourists to perceive the overall spatial structure. This difficulty arises because there are few differences in the environments of Mt. Sanqingshan and considerable differences in the rolling terrain and large gallery road bends, leading tourists who are unfamiliar with the environment to experience difficulty in making spatial and route choices.
The overall concentration of the trail road network of Mt. Sanqingshan can be divided into five levels (Figure 4a). The higher the degree of overall axial concentration (which indicates greater accessibility of the general road), the shallower the level it occupies within the entire space. Trail concentration kernels (refer to the axle indicated by the red line in Figure 3b) form a circle around the south of Nanqing Garden Scenic Spot, with lower levels towards the outside. This pattern is consistent with the scenic spot distribution kernel center and historical visit density center, which guarantees accessibility to each sightseeing resource within the entire Mt. Sanqingshan area. Overlapped kernel density analysis diagrams have been adopted to test scenic spot spatial distribution and demonstrate that the key axis of tourist trails of Mt. Sanqingshan forms a spatial axis concentration kernel around Nanqing Garden. This distribution is in line with the highly concentrated area of key scenic spots, which guarantees robust access to the core scenic area. However, since the overall intelligibility of the tourist trail system space is low, the peripheral scenic areas generally receive little attention and few visitors.
4.2.2. Local Integration
The local concentration of space syntax values is adopted to show the local integration of the three-step road areas. Trail I, Trails E–F, Trails D–P and other locations have the highest concentration (Figure 5b). These trails are necessary short-distance paths connecting the sub-scenic areas. In addition, the local concentration of gallery roads around the core is generally lower than that of the outer roads. The control value of the trail between the upper station of Cableway A and Node D is the highest (Figure 5c). The control value of the trail connecting the east and the west is relatively high, and the control value of the trail connecting the south and the north is lowest. The control value reflects the local integration of scenic spots. Therefore, the control value of the road connecting small scenic spots in the area is high. The overall and local integration to Longevity Garden (C) is low, and tourists may miss this scenic spot entirely. Sanqing Temple (H) has a strong attraction; however, its availability is low to tourists who take the cableway (A and B) as their main entrance, which results in a low visitation rate.
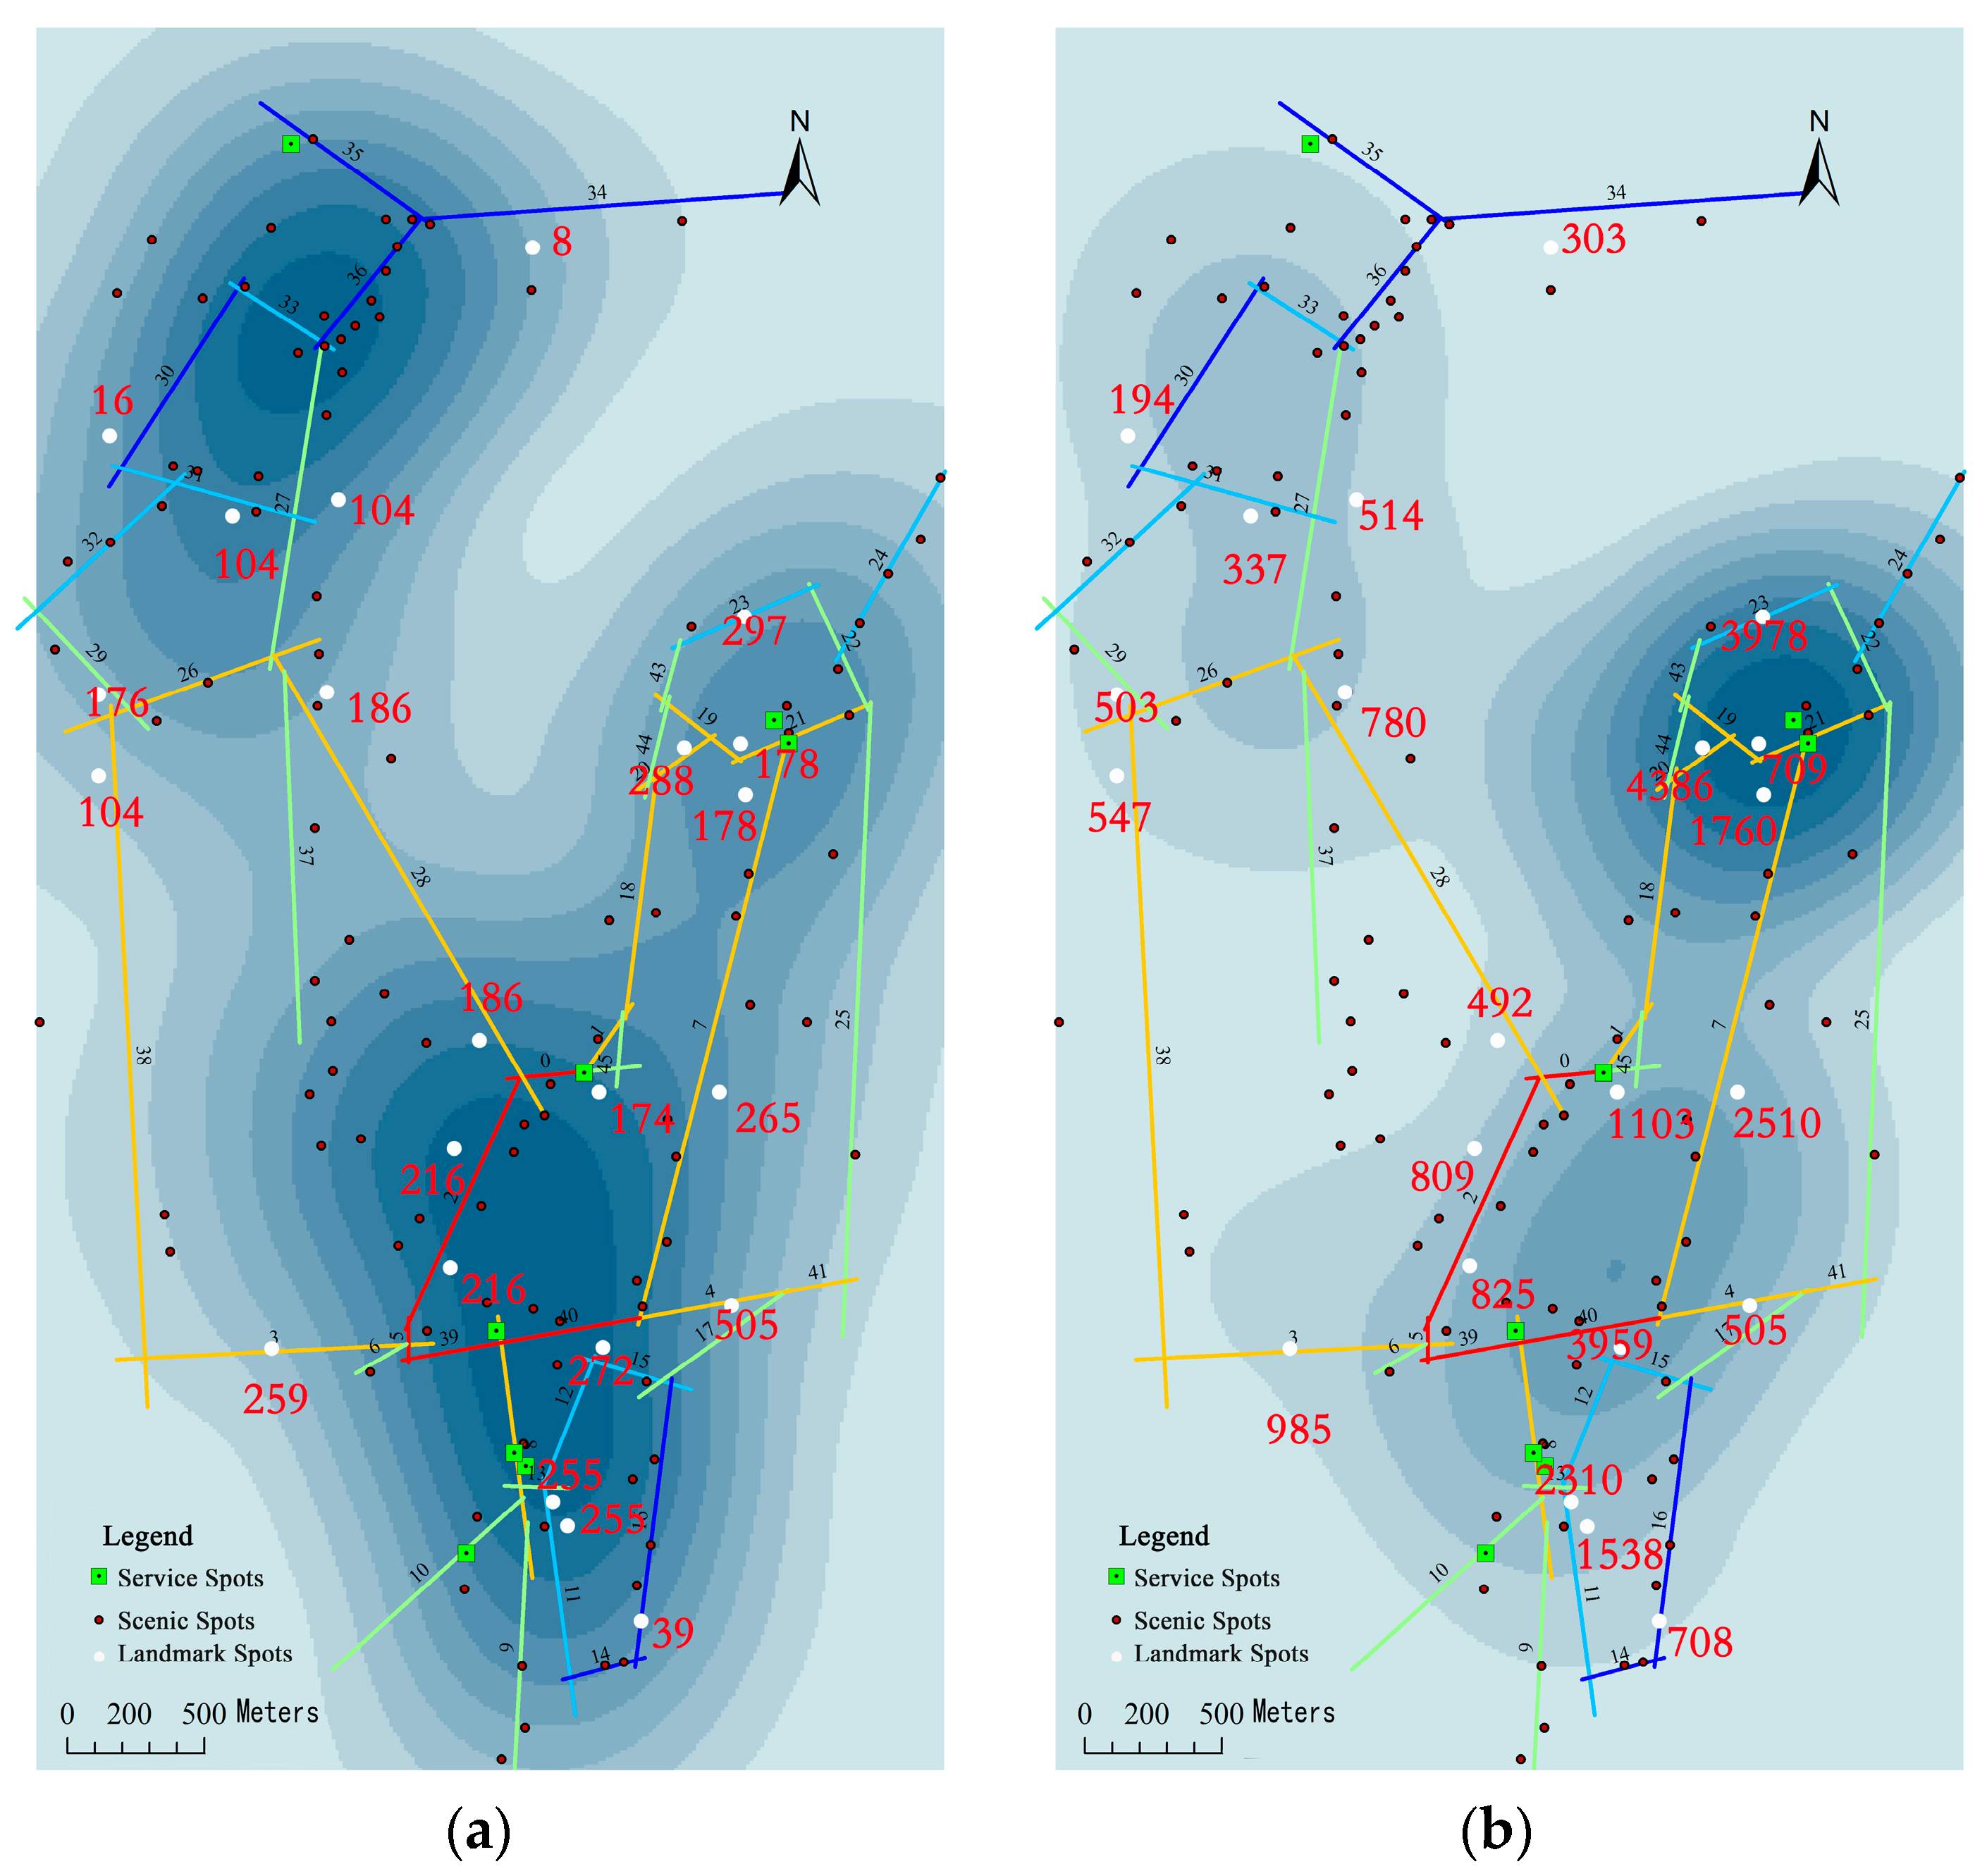
4.3. Correlation between Tourist Flow and Spatial Structure
Mt. Sanqingshan organizes lines around two cableway stations, forming three loops within the scenic spot. A small number of necessary roads overlap the round-trip tourist flow. The visitor traffic data of 19 key sections or nodes have been added to the overall integration map (Figure 6a) of the kernel density and road network of the resort, and the website data regarding historical visits have been added to the landscape attention kernel density map (Figure 6b). With the highest overall integration, the area where Node D is located has received the most visits (615). Gallery Road E and F of the integrated kernel received 328 and 308 visits, respectively, and there were 300 visits to the roads where M and N are located (visits to Nodes M and N are different as some visitors return after reaching Node M). Given the spatial distribution harmony within the attraction space, there are many scenic spots within the K–F–E–D–N–M–O loop of the Nanqing Garden Scenic Area, which is a scenic spot and landscape attention density kernel with high sightseeing value and high road accessibility. Therefore, this scenic area received the most visits. Although Gallery Road K is at Level 3 of overall integration, it ranks third of 19 in terms of visits to the entire node. This is due to scenic attraction and spatial connection issues. Gallery Road K not only provides a view of Python Rising in the Mountain, but it also provides necessary and rapid access to the Nanqing Garden Scenic Area. Gallery Roads G and J, which serve as characteristic high-rise gallery road attractions of Mt. Sanqingshan, connect Sanqing Temple (H) and Nanqing Garden. However, H serves as a scenic spot density kernel, and it ranks low in terms of visits due to its low overall access, long distance and low landscape attraction. The quantity of tourists on the trail depends more on the accessibility of the entire road. Even in areas with high overall integration, but without concentrated scenic spots, tourists visit frequently because they must pass these areas to reach other areas.
The space structure is not significantly related to the flow trend. If visitors at F choose Passage G or E where the density kernel is located, the choice possibility does not differ. Given that tourists mostly organize their tour routes using the loop, choosing G or E is a matter of sequence.
According to the analyses above, the utilization intensity of the trail network is mainly affected by road network patterns and spatial integration, the density of groups of scenic spots and landscape attention. The model takes five key kernel density values as the parameters, including space syntax measurement variables, the scenic spot distribution kernel density value and scenic spot attention (weight of photo numbers, Figure 4a). Based on the trail features of the mountain scenic area, tourist traffic and axial property indicators of 25 trails are summarized (in line with each other) through the questionnaire data. We combine the selection of typical paths to represent common traffic along several route sections and exclude the Yujing Peak section, where tourists are not allowed. The regression equation was generated with the backward method using SPSS21.0:
where S, L and G are the online scenic attention kernel density value, the local integration degree and the overall integration degree, respectively.
Y1 = −75.120 + 20.217 S − 191.678 L + 716.984 G
The adjusted R2 of GFI (goodness-of-fit index) is 0.727 and F is 22.321, with p = 0.001 indicating a significant regression effect at the level of 0.05 (Table 1). The P-P diagram of the regression standardization residual shows that the original data and normal distribution have no significant difference and the residual meets the prerequisite of the linear model. The standard regression coefficients, beta and the independent variables are 0.453, −0.768 and 0.998, respectively.
4.4. Correlation between Site Visits and Spatial Structure
Since a tour of Mt. Sanqingshan usually lasts between 3 and 8 h, service points in the core scenic area are scarce and small; restaurants are concentrated around Goddess Hotel (L) and Rishang Platform (D). As the convenience of service facilities has little effect on tourist visits (which mainly prioritize different scenic spots, the scenic value of the route and traffic convenience), the tourist visits are consistent with the effect of tourist trail flow. According to the above multi-element linear regression method, we conducted a correlation calculation of the historical visits to Mt. Sanqingshan. The results are as follows:
where C, L and S represent the control value, local integration degree and online scenic attention kernel density value, respectively.
Y2 = 1253.037 + 1287.307 C − 1567.360 L + 388.846 S
The adjusted R2 of the GFI is 0.331, F = 5.779 and p = 0.004, which is less than the significance level of 0.05; thus, the regression effect is significant (Table 1). All the variable coefficients are statistically significant. The standard regression coefficients of the independent beta variables are 0.570, −0.539 and 0.620, respectively. This finding demonstrates that the scenic attention density of the area has a significant effect on scenic spots’ visit, whereas the control degree (the weight received by the axle from other axles, indicating the effect of neighboring space) has a comparatively less significant effect. Tourists pay more attention to the continuity of the tourist route and to their choice of road to visit those spots that are most scenic.
5. Discussion
5.1. Discussion
Although it is likely that tourists’ within-destination movement patterns are guided by attractions when a tourist is a special type of pedestrian, many studies indicate that visitors are highly dependent on the road network [1,33], and sightseeing is a typical natural movement [7].
Theoretically, based on space syntax, spatial patterns determine human space behavior and influence flow. When hiking on a mountain, scenic spots are often out of tourist’ sight line. Whether the spatial syntax could be used for the abstract processing of street space can be applied to a complex terrain environment was a question that needed empirical verification. The first challenge was to draw the axial map of the mountain trail system as an irregular dendritic structure, which was more reasonable for delineating an axial map of trails in a mountainous scenic area based on the integrated connection of the crossings.
Some of the variables of space syntax in this study represent a special meaning (Table 1). The results of the tourist routes data reflected the significant effect of overall integration in tourist trail spatial structure. Local integration (R3) signifies attainability with a radius of three steps. Mountain trails are far and difficult to reach, thus local integration has a negative impact on tourist visits, and it was considered to be a complex indicator in the simplified axial map. This effect demonstrates the difference between the local integration of mountain trail systems and urban blocks or buildings [34]. Moreover, the control value should receive greater consideration in future research on mountain areas and road network, as tourists pay attention to continuity and multi-option tourist routes.
The number of online user sign-ins and uploaded photos shows which scenic spots and areas would be more likely to be photographed during the tour, more memorable and more willing to be shared online by tourists after travel. These spatial features in cyberspace are not consistent with actual tourist routes, and the density map shows the cores gathering at the two main entrances (Cableways A and B), highlighting the significant primacy effect of the first impression region [6,35]. From the map of the internal trail network (Figure 6), the two cableways are generally accessible; however, from the complete flow of tourist routes, they are the most accessible and controlling axes.
The spatial integration of Cableway A was higher, thus when choosing the actual tour route, there were more tourists passing through A. However, Cableway B has more “must-see” attractions; thus, there were more photos and sign-ins, and these attractions obtained higher landscape attention. In addition, the tourist routes from the entrance of B were more diverse and discrete compared with A, as there was not much difference among the three trails connecting with B. These results indicate that the spatial structure of the starting area was very important to the wayfinding behavior and movement pattern.
The scenic spots in Mt. Sanqingshan are mostly granite pictograph stones formed by geological processes. Many symbolic scenic spots and landscapes have little effect on sightseeing value; however, the attention and visits paid to these scenic spots may have significant differences in spatial structure. The proportion of online tourism information search and travel bookings in China has reached 40.9% [36]; therefore, the two processes of scenic spot attention and tourist visitation may mutually strengthen one another. Even for symbolic spots, attention is gradually increased through photographs or other promotional materials. Further analysis of the mechanisms of space-time evolution is required to determine whether “must-visit” [37] status is caused by the attraction of the scene or its spatial structure.
5.2. Limitations
This study aimed to explore tourist spatial behavior characteristics in a mountain scenic area, where the tree coverage rate is high and satellite positioning is not stable. Therefore, GPS data were not employed in this study, and we chose the commonly-used questionnaire investigation, which can obtain abundant demographic characteristics and perceived data simultaneously. Researchers may consider using more new trajectory equipment, such as GPS [38], smartphones and other wearable equipment and provide a high resolution of space-time data in additional empirical studies.
As space syntax can be used to analyze the correlation between spatial structure and behavior, more comprehensive case studies in other tourism areas and more quantitative approach are required that address the correlating effect between spatial structure and tourists’ social and economic features, as well as tourists’ invisible behavior variables (including motivation, spatial choice and perception) and wayfinding behavior. Further study should also consider 3D space syntax or angular segment analysis with a metric radius to take into account the factors of the deflection condition and distance [39].
6. Conclusions
Through the acquisition of preference and spatial behavior data through online big data and questionnaires at Mt. Sanqingshan, tourists’ spatial patterns were analyzed, and spatial differences and correlations were visually presented through overlapping multiple data. The correlations among the structure of the mountain scenic spots, the tourist trail system structure and tourist spatial behavior can be elucidated based on multi-element quantitative analysis. These findings highlight the value of UGC data in the tourist space behavior research and provide guidance to incorporate online data with conventional survey data to examine the spatial behavior of tourists. The primary conclusions are as follows.
This study shows that space syntax is applicable for the analysis of a mountain trail system, by reflecting the general spatial structure of tourism areas and tourist preferences. The result of tourist routes data reveals a significant effect of overall integration in tourist trail spatial structure. Local integration has a negative impact on tourist visits and has been considered a complex indicator in very simplified axial maps. The integration of the starting area was very important for the tourist movement pattern of the whole route.
The scenic spot distribution of the scenic area is not consistent with the kernel density of online sign-ins and attention, which suggests that the feature of tourists’ impressions after travel is focused on the representative landscape and the entrance region of the scenic area. Furthermore, tourists’ attention more significantly influences visitor volume to mountain scenic spots and the choice of an uphill entrance. Both of the cognitive maps of tourists and the accessibility of the space route affect tourist flow along trails and the volume of visits to scenic spots. This paper primarily demonstrates the correlation between landscape attention and the spatial structure of tour trails. It advances the understanding of the relationship between objective and subjective spatial distribution and behaviors, and it establishes a foundation for future studies and measures to reduce congestion in tourist attractions.
The results are of practical significance to enhance tourist preferences and optimize the tour routes in many large multi-route scenic spots. Specifically, the existing signage of the Sanqingshan is only focused on information that pertains to direction and the forward target name, lacking the distance and time required. Guidance should be improved to give tourists a clearer judgement on the integration of travel routes, and the provision of a list of the pros and cons of the main tour route would be a better operating strategy. According to the findings of this study about spatial configuration, online attention and tourist management, scenic area managers could build a new ropeway to improve the accessibility of the north part. Such a ropeway could help tourists to more quickly enter Sanqing Temple, the only cultural attraction that exemplifies the profound Taoist culture; this temple is avoided in the current trail network configuration. In addition, only a small number of must-see attractions are photographed by tourists and shared in the network. Managers should improve the introduction of and interaction with the cultural background and geological science of other scenic spots to enhance their appeal.
The outcome of this study also illustrates the spatial pattern of within-destination tourists’ behavior and provides operational suggestions for park managers to alleviate congestion and provide visual guidance for tourists to plan their ideal tour route; these study implications add to the existing literature and research on the spatial structure of trails in tourism areas.
Acknowledgments
This work was supported by the China National Tourism Administration (Grant No. 13TABK007), the Ministry of Education in China Project of Humanities and Social Sciences (Grant No. 13YJC790193) and the Visitor Management Planning for Mt. Sanqingshan National Park under UNESCO, and significant support was received from the Mt. Sanqingshan Scenic Spot Management Committee.
Author Contributions
All the authors have contributed to the idea of this paper. R.W. and J.Z. conceived of and designed the paper. R.W. contributed significantly to the methods. P.L. analyzed the data and wrote the paper. X.X. and H.Z. provided constructive advice to improve the manuscript.
Conflicts of Interest
The authors declare no conflicts of interest. The founding sponsors had no role in the design of the study; in the collection, analyses or interpretation of data; in the writing of the manuscript; nor in the decision to publish the results.
References
- Smallwood, C.B.; Beckley, L.E.; Moore, S.A. An analysis of visitor movement patterns using travel networks in a large marine park, North-Western Australia. Tour. Manag. 2012, 33, 517–528. [Google Scholar] [CrossRef]
- Orellana, D.; Bregt, A.K.; Ligtenberg, A.; Wachowicz, M. Exploring visitor movement patterns in natural recreational areas. Tour. Manag. 2012, 33, 672–682. [Google Scholar] [CrossRef]
- Lew, A.; Mckercher, B. Modeling Tourist Movements: A Local Destination Analysis. Ann. Tour. Res. 2006, 33, 403–423. [Google Scholar] [CrossRef]
- Golledge, R.G. Wayfinding Behavior: Cognitive Mapping and Other Spatial Processes; JHU Press: Baltimore, MD, USA, 1999. [Google Scholar]
- Nepal, S.K.; Chipeniuk, R. Mountain tourism: Toward a conceptual framework. Tour. Geogr. 2005, 7, 313–333. [Google Scholar] [CrossRef]
- Huang, X.; Wu, B. Intra-attraction Tourist Spatial-Temporal Behaviour Patterns. Tour. Geogr. 2012, 14, 625–645. [Google Scholar] [CrossRef]
- Hillier, B.; Penn, A.; Hanson, J.; Grajewski, T.; Xu, J. Natural movement: Or, configuration and attraction in urban pedestrian movement. Environ. Plan. B Plan. Des. 1993, 20, 29–66. [Google Scholar] [CrossRef]
- Tversky, B.; Lee, P.U. How Space Structures Language; Springer: Berlin/Heidelberg, Germany, 1998; pp. 157–175. [Google Scholar]
- Li, R.; Klippel, A. Wayfinding Behaviors in Complex Buildings The Impact of Environmental Legibility and Familiarity. Environ. Behav. 2016, 48, 482–510. [Google Scholar] [CrossRef]
- Xia, J.; Arrowsmith, C.; Jackson, M.; Cartwright, W. The wayfinding process relationships between decision-making and landmark utility. Tour. Manag. 2008, 29, 445–457. [Google Scholar] [CrossRef]
- Bafna, S. Space Syntax A Brief Introduction to Its Logic and Analytical Techniques. Environ. Behav. 2003, 35, 17–29. [Google Scholar] [CrossRef]
- Jiang, B.; Claramunt, C. Integration of Space Syntax into GIS: New Perspectives for Urban Morphology. Trans. GIS 2002, 6, 295–309. [Google Scholar] [CrossRef]
- Hillier, B. Space is the Machine; Cambridge University Press: Cambridge, UK, 1996; pp. 333–335. [Google Scholar]
- Landré, M. Analyzing yachting patterns in the Biesbosch National Park using GIS technology. Technovation 2009, 29, 602–610. [Google Scholar] [CrossRef]
- Maldonado, A.; Wachowicz, M.; Vaźquez-Hoehne, A. Movement surface: A multilevel approach for predicting visitor movement in nature areas. Environ. Plan. B Plan. Des. 2011, 38, 864–878. [Google Scholar] [CrossRef]
- Li, Y.; Xiao, L.; Ye, Y.; Xu, W.; Law, A. Understanding tourist space at a historic site through space syntax analysis: The case of Gulangyu, China. Tour. Manag. 2016, 52, 30–43. [Google Scholar] [CrossRef]
- Pearce, P.L. Analysing tourist attractions. J. Tour. Stud. 1991, 1, 46–55. [Google Scholar]
- Maccannell, D. The Tourist: A New Theory of the Leisure Class; Schocken Books: New York, NY, USA, 1976. [Google Scholar]
- Goličnik, B.; Ward Thompson, C. Emerging relationships between design and use of urban park spaces. Landsc. Urbanplan 2010, 94, 38–53. [Google Scholar] [CrossRef]
- Schmitz, M.F.; Aranzabal, I.D.; Pineda, F.D. Spatial analysis of visitor preferences in the outdoor recreational niche of Mediterranean cultural landscapes. Environ. Conserv. 2007. [Google Scholar] [CrossRef]
- Lu, Z. Spatial syntactic analysis of cognitive maps. Acta Geogr. Sin. 2013, 68, 1401–1410. (In Chinese) [Google Scholar] [CrossRef]
- Huang, X.; Zhang, L.; Ding, Y. The Baidu Index: Uses in predicting tourism flows—A case study of the Forbidden City. Tour. Manag. 2017, 58, 301–306. [Google Scholar] [CrossRef]
- Rivera, R. A dynamic linear model to forecast hotel registrations in Puerto Rico using Google Trends data. Tour. Manag. 2016. [Google Scholar] [CrossRef]
- Wang, S.; Guo, F.; Fu, X.; Li, R. A study of the spatial patterns of tourist Sightseeing based on volunteered geographic information: The case of the Jiuzhai Valley. Tour. Trib. 2014, 29, 84–92. (In Chinese) [Google Scholar] [CrossRef]
- Stepchenkova, S.; Zhan, F. Visual destination images of Peru: Comparative content analysis of DMO and user-generated photography. Tour. Manag. 2013, 36, 590–601. [Google Scholar] [CrossRef]
- Jiang, K.; Yin, H.; Wang, P.; Yu, N. Learning from contextual information of geo-tagged web photos to rank personalized tourism attractions. Neurocomputing 2013, 119, 17–25. [Google Scholar] [CrossRef]
- Fuchs, M.; Höpken, W.; Lexhagen, M. Big data analytics for knowledge generation in tourism destinations—A case from Sweden. J. Destin. Mark. Manag. 2014, 3, 198–209. [Google Scholar] [CrossRef]
- Hillier, B.; Vaughan, L. The city as one thing. Prog. Plan. 2007, 67, 205–230. [Google Scholar] [CrossRef]
- Turner, A.; Penn, A.; Hillier, B. An algorithmic definition of the axial map. Environ. Plan. B Plan. Des. 2005, 32, 425–444. [Google Scholar] [CrossRef]
- WU, R.; Zhang, H.; Zhang, J.; Chen, X.; Zhang, S.; Yan, B. Micro-scale spatial structure and spatial associations of urban historical and cultural tourism destinations: A case study of Confucius Temple, Nanjing. Geogr. Res. 2014, 33, 2427–2436. (In Chinese) [Google Scholar] [CrossRef]
- Bornmann, L.; Waltman, L. The detection of “hot regions” in the geography of science—A visualization approach by using density maps. J. Informetr. 2011, 5, 547–553. [Google Scholar] [CrossRef]
- Jiang, B.; Claramunt, C.; Klarqvist, B. Integration of Space Syntax into GIS for Modelling Urban Spaces. Int. J. Appl. Earth Obs. Geoinf. 2010, 2, 161–171. [Google Scholar] [CrossRef]
- Coombes, E.G.; Jones, A.P.; Bateman, I.J.; Tratalos, J.A.; Gill, J.A.; Showler, D.A.; Watkinson, A.R.; Sutherland, W.J. Spatial and temporal modeling of beach use: A case study of East Anglia, UK. Coast. Manag. 2009, 37, 94–115. [Google Scholar] [CrossRef]
- Ratti, C. Urban texture and space syntax: Some inconsistencies. Environ. Plan. B Plan. Des. 2004, 31, 487–499. [Google Scholar] [CrossRef]
- Jungé, J.A.; Scholl, B.J.; Chun, M.M. How is spatial context learning integrated over signal versus noise? A primacy effect in contextual cueing. Vis. Cogn. 2007, 15, 1–11. [Google Scholar] [CrossRef] [PubMed]
- China Internet Network Information Center. Statistical Report on Internet Development in China; China Internet Network Information Center: Beijing, China, 2015. [Google Scholar]
- Hsieh, Y.; You, P. An efficient encoding scheme for a new multiple-type museum visitor routing problem withmust-see and select-see exhibition rooms. Int. J. Comput. Intell. Syst. 2017, 10, 677–689. [Google Scholar] [CrossRef]
- Wolf, I.D.; Hagenloh, G.; Croft, D.B. Visitor monitoring along roads and hiking trails: How to determine usage levels in tourist sites. Tour. Manag. 2012, 33, 16–28. [Google Scholar] [CrossRef]
- Turner, A. From Axial to Road-Centre Lines: A New Representation for Space Syntax and a New Model of Route Choice for Transport Network Analysis. Environ. Plan. B Plan. Des. 2016, 34, 539–555. [Google Scholar] [CrossRef]
Figure 1.
Triadic relation among attraction, configuration and movement (source: Hillier et al. [7]). A is attraction; C is configuration; M is movement.
Figure 1.
Triadic relation among attraction, configuration and movement (source: Hillier et al. [7]). A is attraction; C is configuration; M is movement.
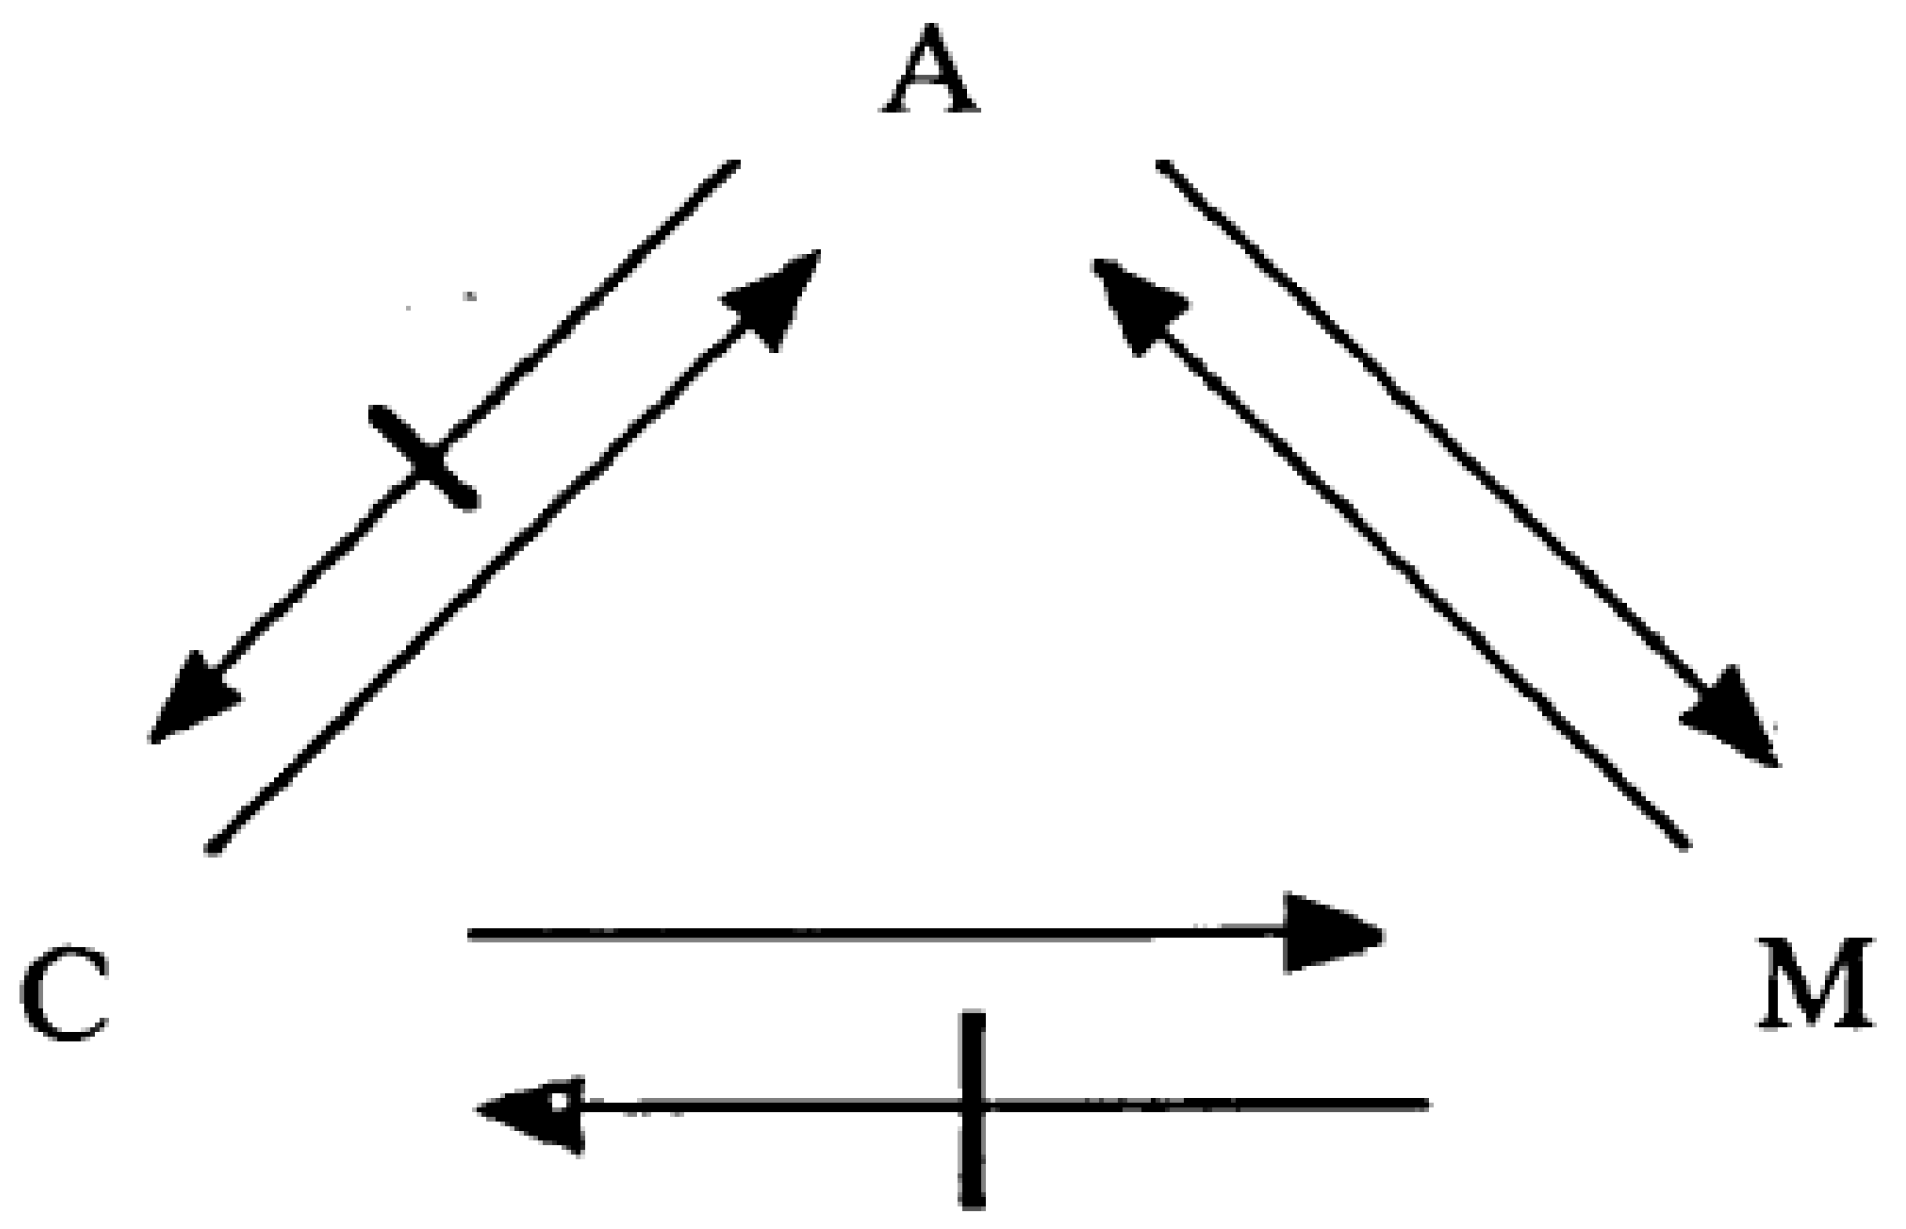
Figure 2.
Location map of the study area (a); cableway and trail in Mt. Sanqingshan (b).
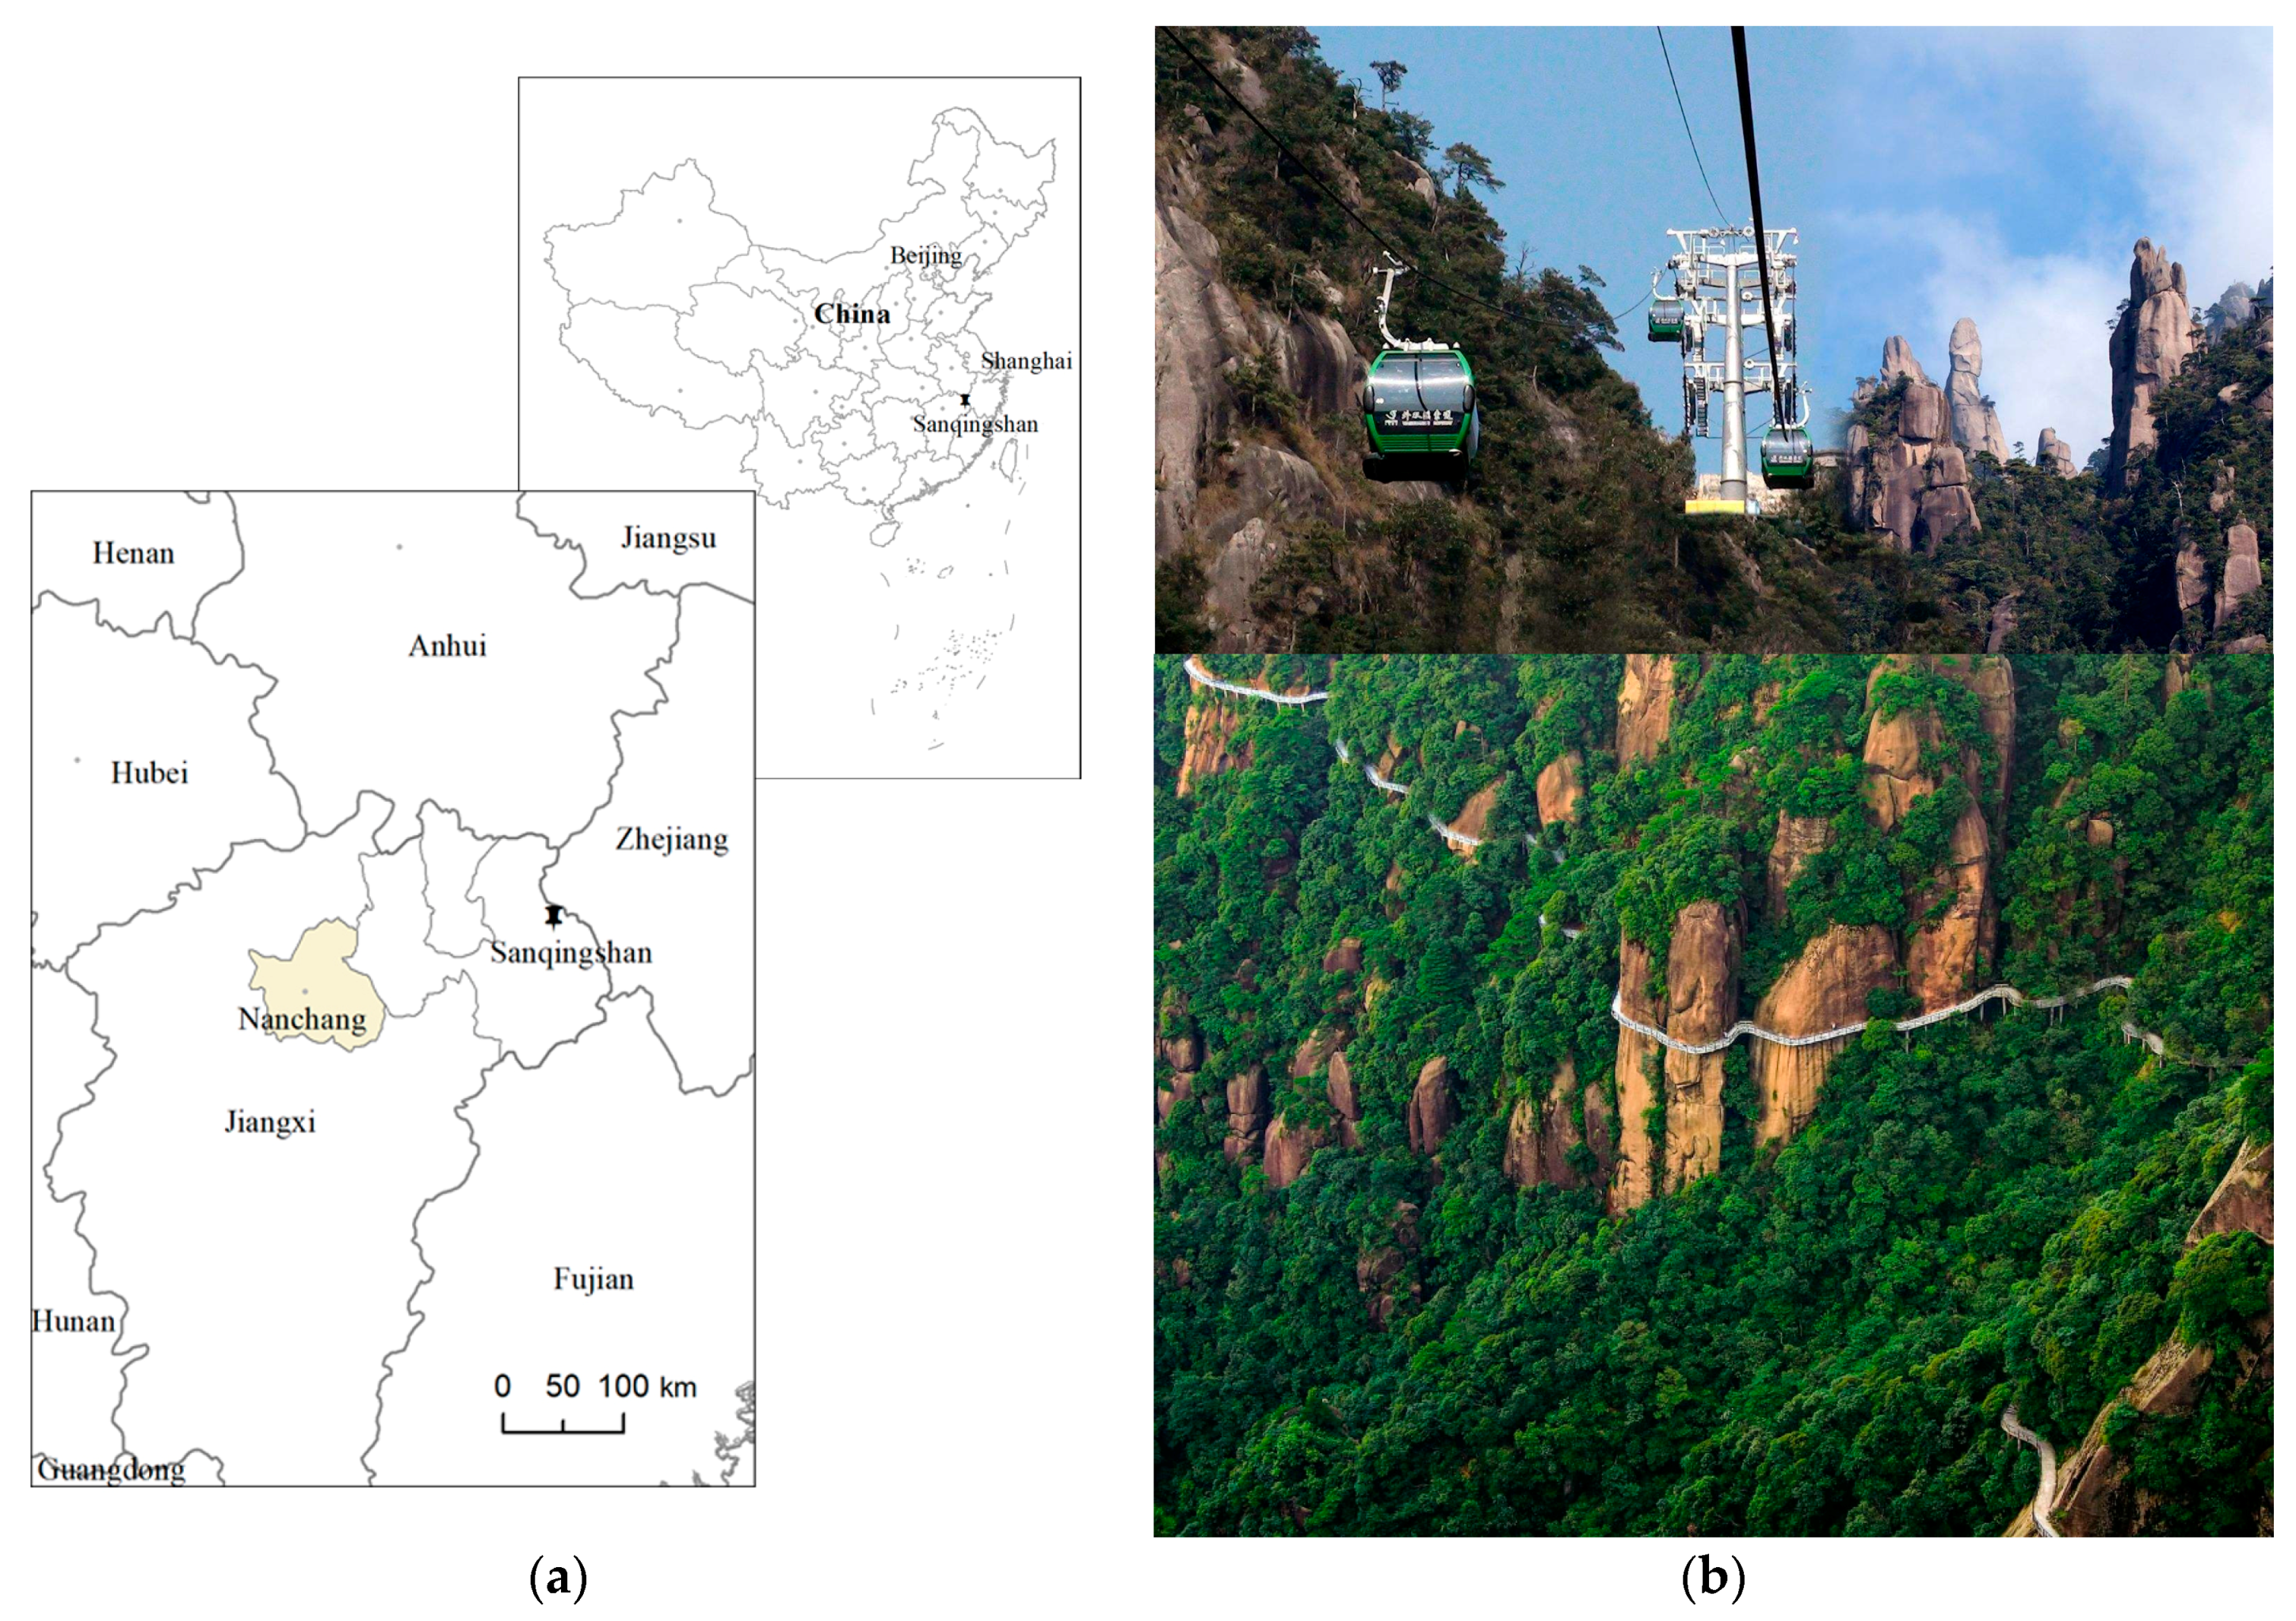
Figure 3.
Tourist trail system of Mt. Sanqingshan (a) and scenic spot distribution kernel density (b).
Figure 3.
Tourist trail system of Mt. Sanqingshan (a) and scenic spot distribution kernel density (b).
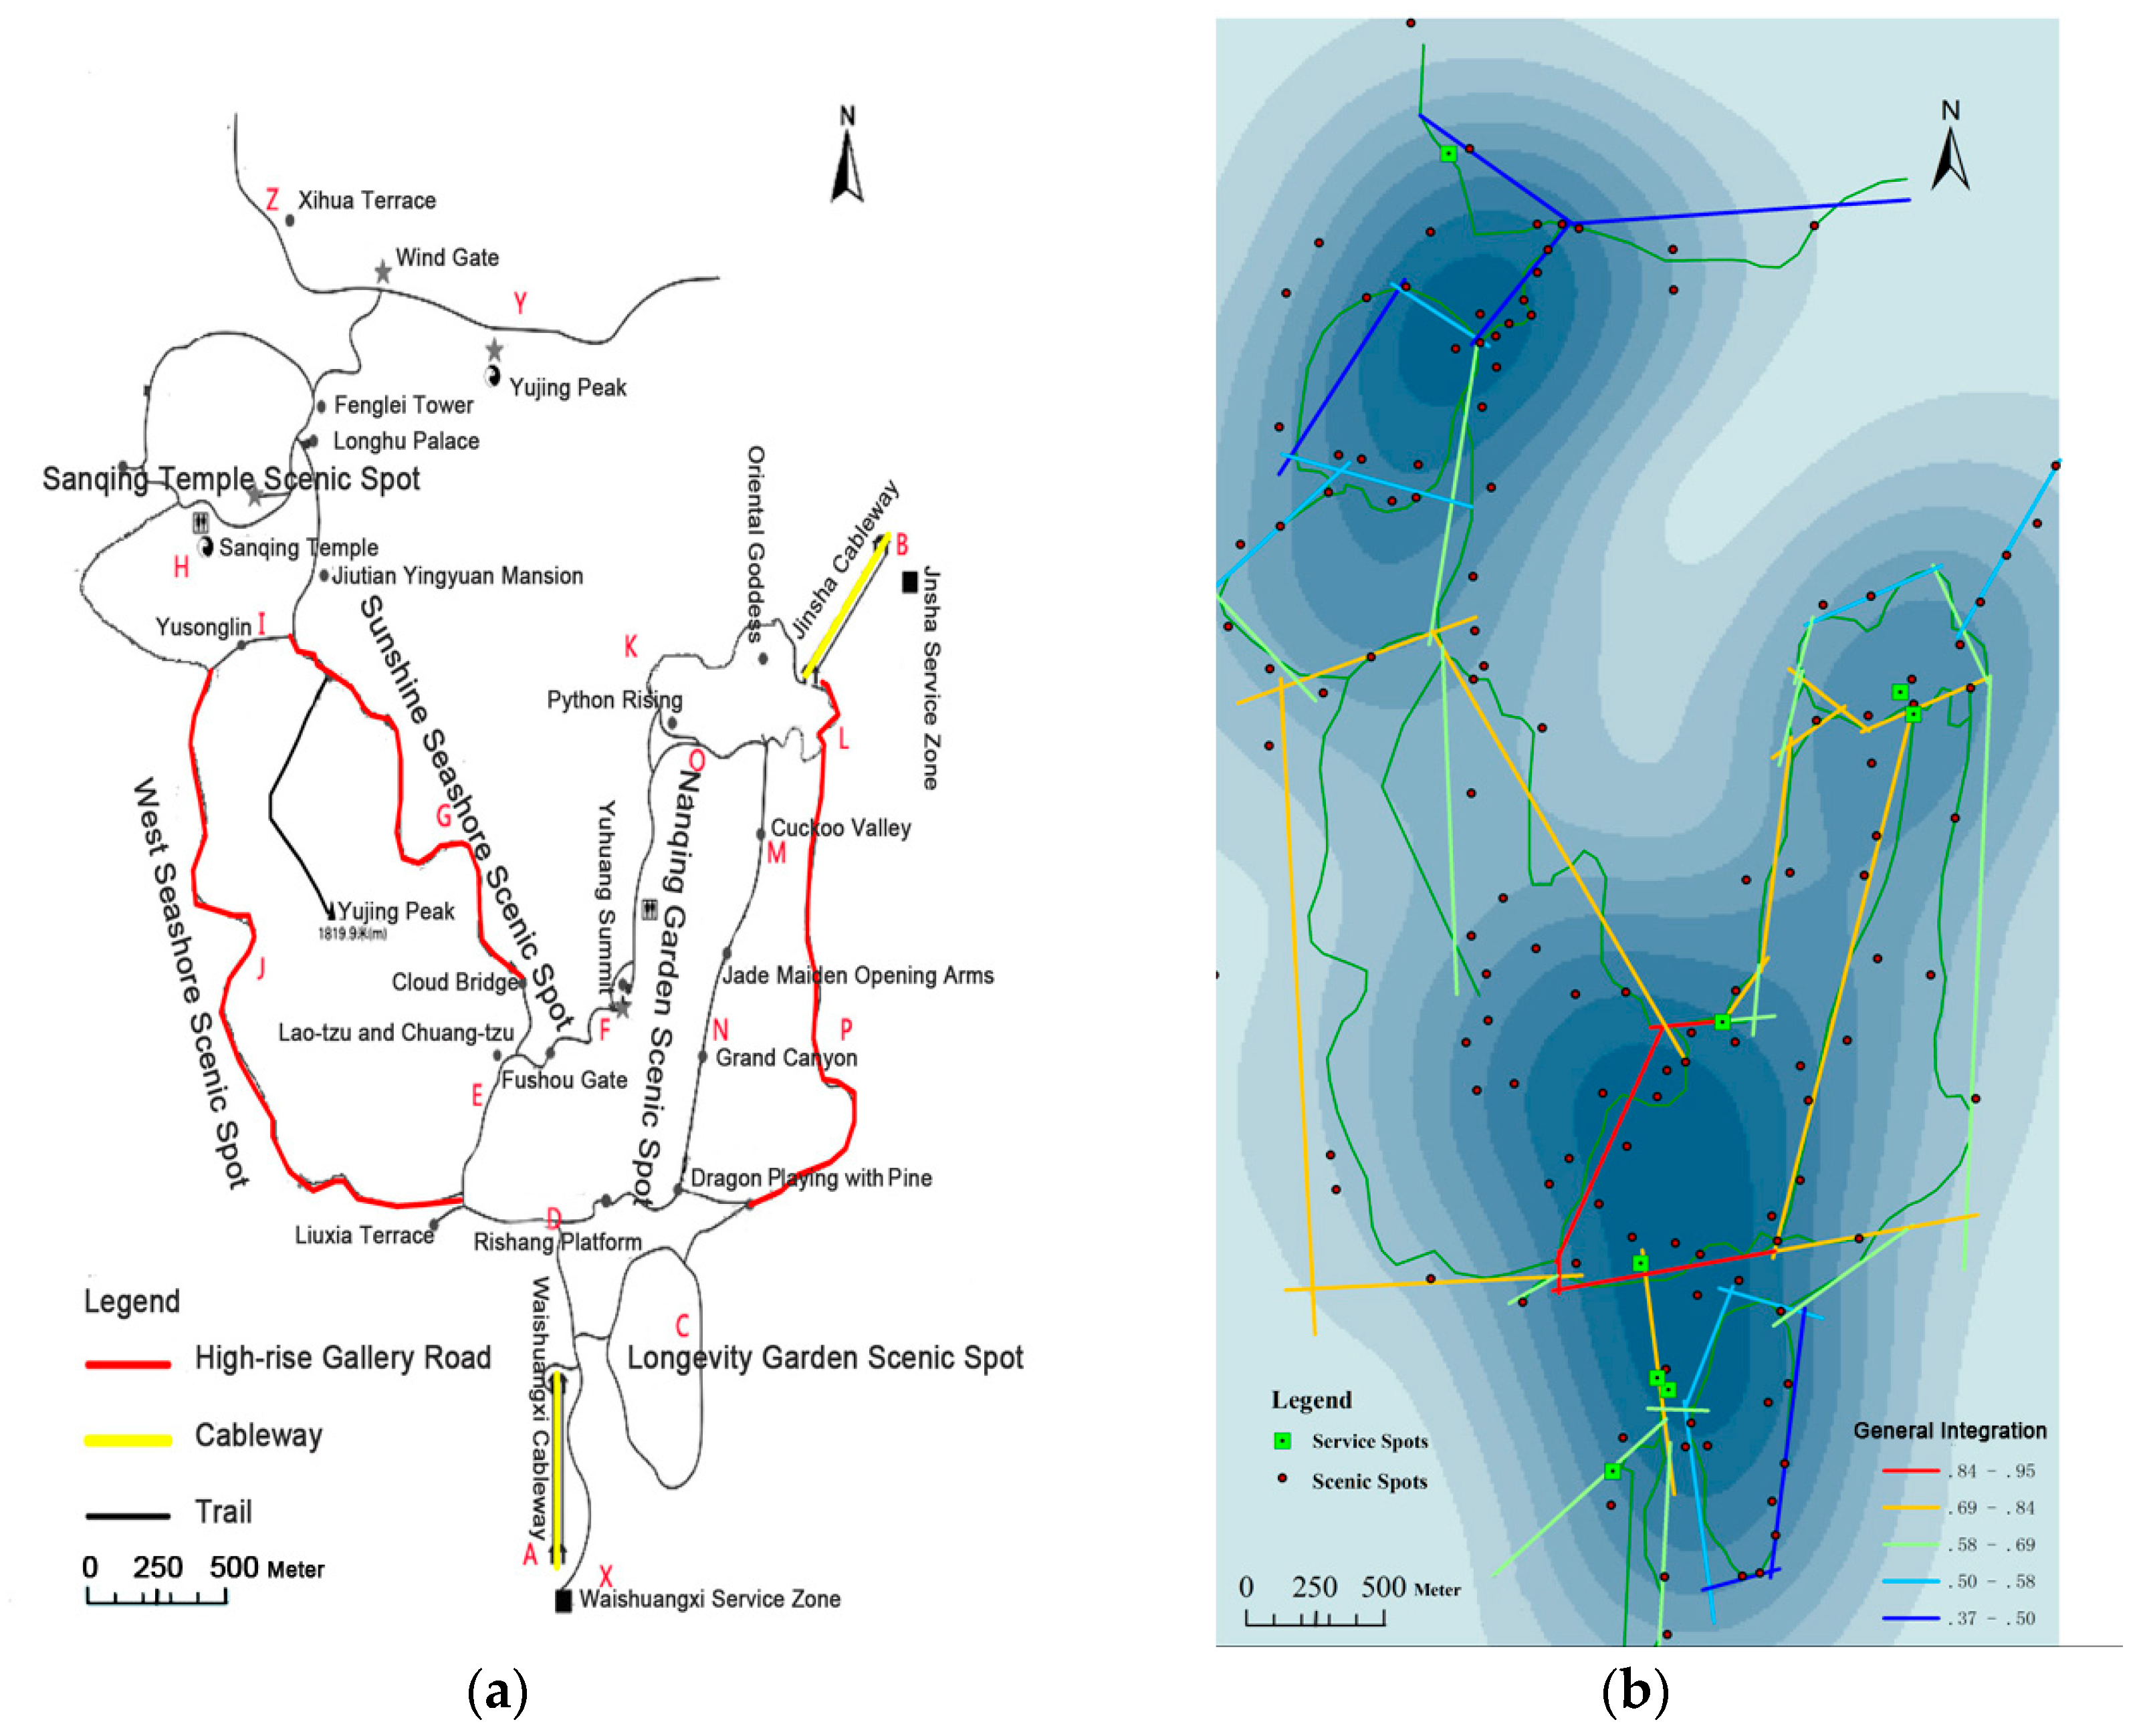
Figure 4.
Kernel density of different weights of scenic spots of Mt. Sanqingshan. (a) weight: number of photos; (b) weight: number of online sign-ins; (c) weight: number of comments.
Figure 4.
Kernel density of different weights of scenic spots of Mt. Sanqingshan. (a) weight: number of photos; (b) weight: number of online sign-ins; (c) weight: number of comments.

Figure 5.
Analysis of the resort road network structure space syntax. (a) General integration; (b) local integration; (c) control value.
Figure 5.
Analysis of the resort road network structure space syntax. (a) General integration; (b) local integration; (c) control value.
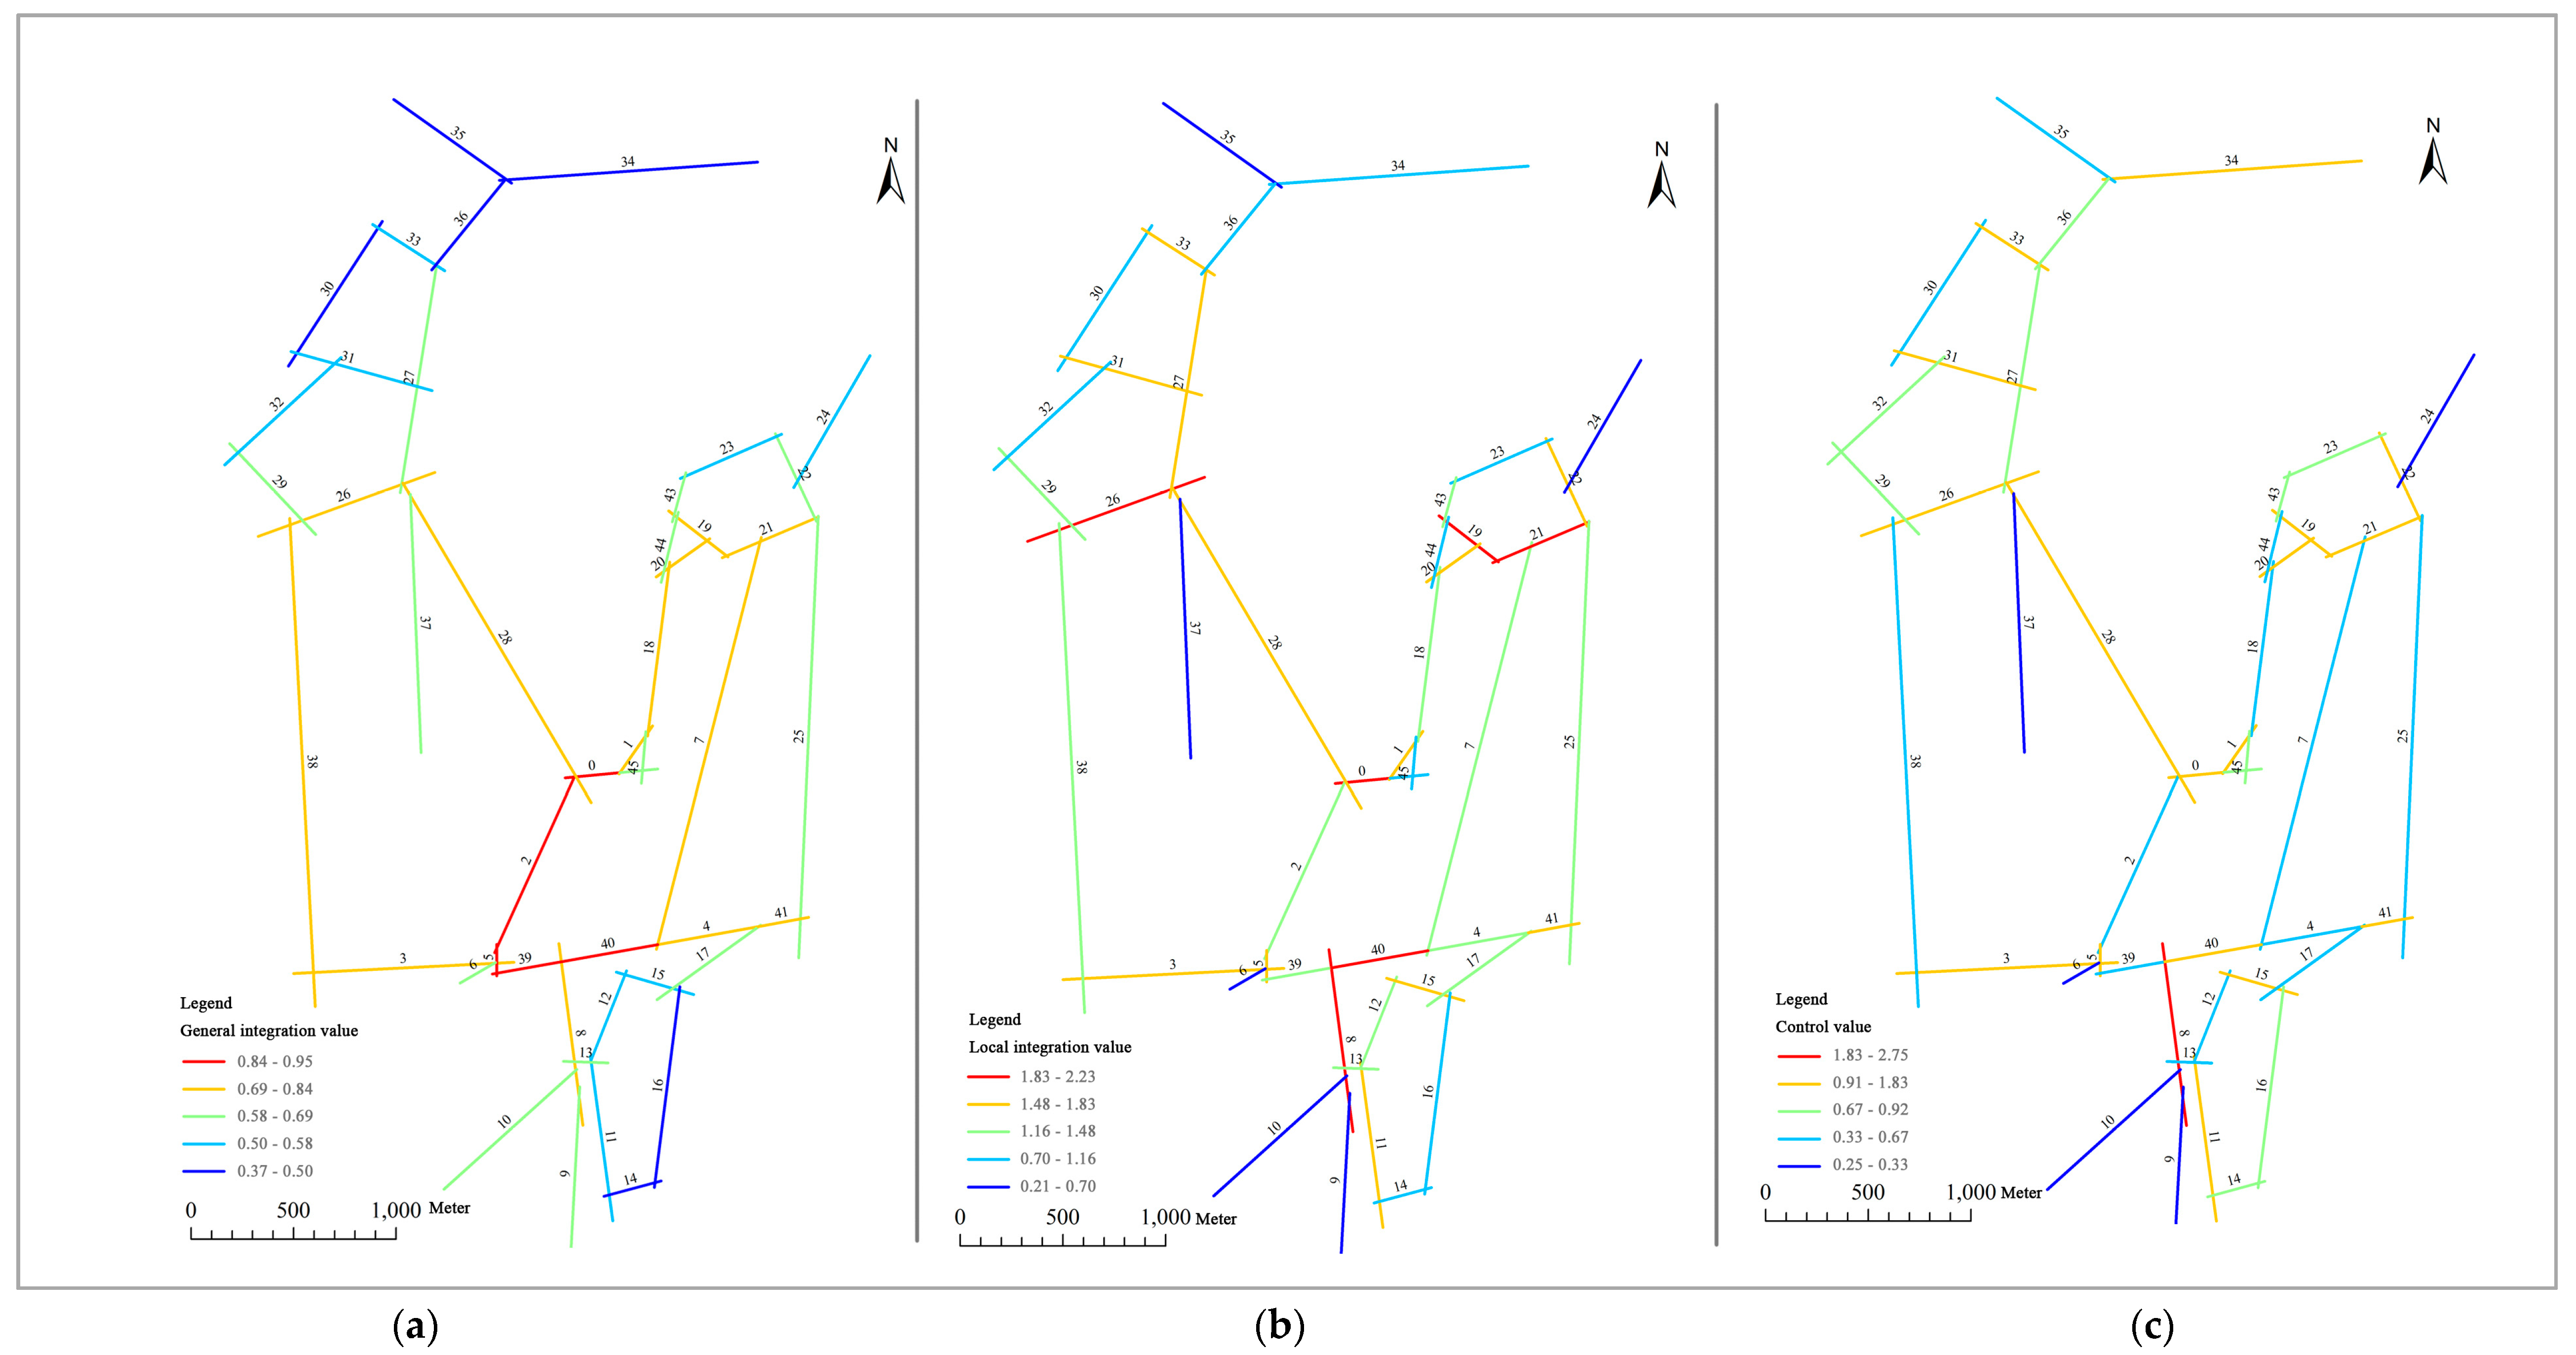
Figure 6.
Relationship between tourist flow and spatial structure. (a) Visitor times of questionnaire (overlapping Figure 3b); (b) number of online users sign-ins (overlapping Figure 4a).

Table 1.
Analysis of the correlations between tourist trail flow, scenic spot visits and spatial structure.
Table 1.
Analysis of the correlations between tourist trail flow, scenic spot visits and spatial structure.
| Model | Non-Standard Coefficient | Standard Coefficient | t | Sig. | ||
|---|---|---|---|---|---|---|
| B | Standard Error | Beta | ||||
| Model (1) n = 25 | (Constant) | −75.120 | 59.829 | −1.256 | 0.224 | |
| Scenic attention kernel density values | 20.217 | 5.914 | 0.453 | 3.418 | 0.003 | |
| Local integration | −191.678 | 39.193 | −0.768 | −4.891 | 0.000 | |
| Overall integration | 716.984 | 97.906 | 0.998 | 7.323 | 0.000 | |
| Model (2) n = 34 | (Constant) | 1253.037 | 724.563 | 1.729 | 0.096 | |
| Control value | 1287.307 | 506.496 | 0.570 | 2.542 | 0.017 | |
| Local integration | −1567.360 | 701.811 | −0.539 | −2.233 | 0.034 | |
| Scenic attention kernel density values | 388.846 | 106.100 | 0.620 | 3.665 | 0.001 | |
© 2018 by the authors. Licensee MDPI, Basel, Switzerland. This article is an open access article distributed under the terms and conditions of the Creative Commons Attribution (CC BY) license (http://creativecommons.org/licenses/by/4.0/).
Share and Cite
MDPI and ACS Style
Liu, P.; Xiao, X.; Zhang, J.; Wu, R.; Zhang, H. Spatial Configuration and Online Attention: A Space Syntax Perspective. Sustainability 2018, 10, 221. https://doi.org/10.3390/su10010221
AMA Style
Liu P, Xiao X, Zhang J, Wu R, Zhang H. Spatial Configuration and Online Attention: A Space Syntax Perspective. Sustainability. 2018; 10(1):221. https://doi.org/10.3390/su10010221
Chicago/Turabian StyleLiu, Peixue, Xiao Xiao, Jie Zhang, Ronghua Wu, and Honglei Zhang. 2018. "Spatial Configuration and Online Attention: A Space Syntax Perspective" Sustainability 10, no. 1: 221. https://doi.org/10.3390/su10010221
Note that from the first issue of 2016, this journal uses article numbers instead of page numbers. See further details here.