Impact of Land-Use and Land-Cover Change on Meteorology in the Beijing–Tianjin–Hebei Region from 1990 to 2010


1
School of Information Engineering, China University of Geosciences, Beijing 100083, China
2
Key Laboratory of Geological Information Technology, Ministry of Land and Resources, Beijing 100037, China
3
The College of Environment and Planning of Henan University, Kaifeng 475004, China
*
Author to whom correspondence should be addressed.
Sustainability 2018, 10(1), 176; https://doi.org/10.3390/su10010176
Submission received: 1 December 2017
/
Revised: 7 January 2018
/
Accepted: 9 January 2018
/
Published: 12 January 2018
Abstract
:Land use and land cover (LULC) in the Beijing–Tianjin–Hebei region has changed significantly since 1990. To comprehensively understand its impact on meteorology, this paper uses an LULC transfer matrix to discuss changes 10 years before the millennium (BM) and 10 years after the millennium (AM). The Weather Research and Forecasting (WRF) model is used to simulate air temperature, precipitation, and wind speed in January and July using 1990, 2000, and 2010 LULC data. The temperature increase in the AM period (0.118 °C) was greater than that in the BM period (0.042 °C) and increased by 0.36 °C in response to the transformation from croplands to urban and built-up lands (UBL). The change in precipitation showed an obvious seasonal difference, where the trend decreased in winter and increased in summer. There was a small band of precipitation change that extended from Beijing to Shijiazhuang. The wind speed at 10 m decreased by 0.04 m/s in winter and 0.017 m/s in summer. Simultaneously, the impact on meteorology from different classification transformations was quantified. The region where land was transformed into UBL had the largest reduction in wind speed, and was later transformed into woodlands. A comprehensive discussion on the impact of LULC changes on climate should support the future development of more environmentally compatible and sustainable land planning.
1. Introduction
Land use and land cover (LULC) not only reflects human activity, it but also impacts climate [1,2,3,4]. LULC alters a significant part of Earth’s surface. It is estimated that over 45% of the Earth’s surface is affected by artificial changes in LULC from its natural state [5]. With the major change in climate, many researchers have extensively explored this issue. The fifth report of the Intergovernmental Panel on Climate Change (IPCC) also notes that since the industrial revolution, urban expansion has become one of the main causes of global warming, while sea level rise and frequent extreme weather events have a certain relationship with forest and grassland degradation [6], which influenced people’s lives [7]. In recent decades, LULC has undergone substantial changes in China during its shift from an agricultural to an industrialized country, which was accompanied by the process of urbanization [8,9]. This is especially true in the Beijing–Tianjin–Hebei (BTH) region, which is one of the largest city agglomerations in China. The BTH has already attracted considerable focus regarding this issue [10,11], and the establishment of a new area of development (i.e., the Xiong’an New Area) in April 2017 makes studies regarding the impact of LULC on climate in this area significant.
There are many studies on the change in LULC in this region and its impact on climate change. However, given rapid urbanization in the BTH region, scholars have focused their research on specific cities [12,13,14]. There are many articles on the study of the urban heat island (UHI) effect caused by the transition from natural land to urban land; for example, Wang and Yan [15] noted that one impact from the urbanization of cropland is a rise of 1–2 °C in annual surface temperature. Wind speed and the water vapor mixing ratio (annual averages) have both declined in the north BTH region. Moving beyond the UHI, Wang and Feng [16] simulated precipitation in one non-urbanized and two urbanized scenarios in the BTH region and found that rainfall is sensitive to urban land. This has led to an initial increase in precipitation in the region downwind of Beijing City. However, when the city has become large enough, the expansion of water-impervious urban surfaces will decrease humidity and offset the increase in rainfall.
In terms of methods, three methods are widely used to analyze the effect of LULC changes on meteorology. The first method is based on meteorological station data and uses statistical methods for analysis. It is realistic and reliable that statistical data records meteorological changes directly [17,18]; therefore, statistical data are typically used to verify results produced from other methods. Therefore, statistical data is used to validate simulation results in this study. However, the statistical method is restricted by the station density and station locations, which make data non-continuous. The second method is based directly on remote sensing data because the infrared band (and other bands) can record surface data, which are then subjected to inversion to provide surface temperature data and other information [19]. This method of remote sensing inversion develops rapidly with the abundance of remote sensing data, but the data are greatly influenced by changes in the environment (e.g., human activities). The third method utilizes numerical simulation with models that are able to simulate different physical factors affecting the climate to obtain meteorological values that are similar to the real value [20,21]. Although there are problems, such as values in a grid that are the same as those from remote sensing inversion and biases from parameterization scheme selections, most of the parameterizations can be set appropriately to simulate results that are close to reality. The experiment variables can be controlled to exclude irrelevant interference. To accurately obtain the impacts of LULC changes on climate and avoid the effects of anthropogenic and environmental changes on the experiment, the numerical simulation method is used in this study.
The expansion of urban construction land in the study area leads to regional meteorology changes, as mentioned before. In addition, LULC changes involve not only urban expansion, but also transformations from natural LULC in recent decades [22,23], which also impact the climate in the study area. For this paper, changes in LULC were explored comprehensively using an LULC transfer matrix for the BTH region. This study focuses on two decades (from 1990 to 2000 and from 2000 to 2010), when the BTH region developed from hypotheticals to reality. LULC data for 1990, 2000, and 2010 were provided as underlying data for simulations, which were coordinated with atmospheric conditions to reveal changes in LULC and their impacts on climate. This study provides an evaluation of the impact of LULC changes on climate in the BTH region and provides a scientific reference for the sustainable use of land resources. This is expected to contribute to better planning in the BTH region in the future.
2. Study Area and Materials
2.1. Study Area
BTH is the most economically dynamic region in northern China [12]. According to the data from National Bureau of the People’s Republic of China, the permanent resident population in the Beijing, Tianjin, Hebei region increased by 23 million in 1990–2010 [24,25] and more than 100 million people lived in this region. In addition, a study noted the pressure of population growth on the environment during 1990–2010. Sun, Sun [26] pointed out that Beijing–Tianjin–Hebei fell in one of the largest environmental pressure classifications due to population growth. As one of the fastest growing urban agglomerations in China, BTH has been subjected to a very rapid urbanization process since the 1990s. Beijing, Tianjin and Shijiazhuang (the capital city of the Hebei Province) expanded from 801 km2, 795 km2, 682 km2 to 2452 km2, 3343 km2 and 1699 km2, respectively, since 30 years ago, which also led a significant LULC change [27]. BTH is located in northern China (36°05′ to 42°40′ N and 113°27′ to 119°50′ E), as shown in Figure 1a. Figure 1b shows the topography of this area; in the west and the north, there are mountains, and in the southeast, there are plains, basin, and plateau terrain features. This region has an area of 215,249 km2 and contains 13 cities, including the capital of China (Beijing, BJ), as well as other cities such as Tianjin (TJ), Shijiazhuang (SJZ), Baoding (BD), Cangzhou (CZ), Chengde (CD), Handan (HD), Langfang (LF), Hengshui (HS), Qinghuangdao (QHD), Tangshan (TS), Xingtai (XT), and Zhangjiakou (ZJK). The climate types in this area include temperate monsoon and semi-humid/semi-arid continental monsoon regions. This region is characterized by cold and dry (i.e., rain and snow scarce) features in winter, but hot and rainy features in summer, when the majority of rainfall occurs.
2.2. Model Description
The Weather Research and Forecasting (WRF) model has been used in many relevant studies in China [28], northern China [29], and even part of the study area [30] with the research WRF (ARW) dynamics solver [31]; it is also been used for simulation in this research. WRF is a next-generation mesoscale numerical weather prediction system with two parts: the WRF preprocessing system (WPS), which is made up of three parts, and the WRF section (details shown in Figure 2). The part of Geogrid program was to interpolate LULC data and set the model grids for different domains. Firstly, the land use and land cover data categories (details in Section 2.3.1) was reclassified from the Data Center for Resources and Environmental Sciences, Chinese Academy of Sciences (RESDC) classification to U.S. Geological Survey (USGS) classification, which could be recognized by the model, as Table 1 shown. Using the Geogrid program, the preprocessed land use and land cover data were interpolated in each domain by the nearest neighbor method. On the other hand, Ungrib program extracted meteorological fields form GRIB-formatted files (details in Section 2.3.2). The meteorological fields extracted by Ungrib were horizontally interpolated to the model grids with surface data processed by Geogrid, which was accomplished in Metgrid program. The replaced land use data would impact the Noah land surface scheme that would adjust the parameters of the vaporization, albedo, vegetation fraction and so on of each grid in each grid in each domain. These parameters acted in the WRF-ARW to simulate the meteorology results affected by underlying surface land use and land cover. The purpose of this research was to find the impact on meteorology by different land use and land cover change, so the land use and land cover data in Geogrid part is the only variable (1990, 2000, 2010 land use and land cover data) in the simulation.
2.3. Data
2.3.1. Land Use and Land Cover Data
LULC data, as the only variable used in these simulations, were provided by RESDC [32]. LULC data for 1990, 2000, and 2010 were included in the data set. The LULC data based on Landsat TM/ETM remote sensing images generated by visual interpretation were applied in the national land resources survey [33], as well as in hydrological and ecological research [34]. These BTH LULC data sets have a spatial resolution of 1 km × 1 km and are classified as croplands (CPL), woodlands (WDL), grasslands (GSL), waters (WRT), urban and built-up lands (UBL), and unused lands (UUL); a total of 6 first-level types and 25 secondary types were discerned. The data accuracy of 1990, 2000, 2010 were 92.9% [33], 97.6% [35], 91.2% [9] respectively. To ensure the quality and consistency of the interpretation of data, a unified quality check and data integration for each set of data sets were conducted before published by RESDC. The comprehensive evaluation accuracy of the first-level type of land use exceeded 94.3%, and the comprehensive accuracy of the second-level type classification exceeded 91.2% [9]. Because of the different classification standards for RESDC and USGS, the second level land use categories were used to transform the USGS classification. To obtain more accurate WDL reclassification data, we used data on Chinese vegetation zonation from the Data Center for Resources and Environmental Sciences at the Chinese Academy of Sciences (RESDC) [32], which finely divided the current WDL category. Table 1 shows the comparison between the land use data classification and the USGS 24-class classification used in this experiment. Figure 1a shows the 2010 LULC classification maps according to the first-level RESDC classification.
2.3.2. Reanalysis Data
The reanalysis data used in this research are the latest ERA-Interim data from the global atmospheric reanalysis [36] produced by the European Centre for Medium-Range Weather Forecasts (ECMWF) [37]. Initial and boundary conditions are provided in this dataset with intervals of six hours (including 00:00, 06:00, 12:00, and 18:00) for the WRF simulation. The ERA-Interim product is simulated with a single version of the assimilation system, which is not affected by changes in the methods and could be of great value for atmospheric research. Reanalysis data for January and July 2010 are only used in this study to control the global climate-change-affecting experiments, which allows the LULC change to be the only variable. January and July are typical months of winter and summer, respectively, and are used to represent the features in winter and summer, respectively.
2.3.3. Observational Data
The accuracy of the experimental design of the WRF simulation was verified by observational data from the Meteorological Data Center at the China Meteorological Administration [38]. The data were based on a meteorological data construction project (archived 1951–2010 daily data from China National Ground Stations) and were corrected before publication. To ensure that the simulation time was consistent with the validated time, only January and July 2010 observational data in the BTH region were extracted.
3. Methods
The goal of this study was to explore meteorological changes caused by LULC changes in the BTH region. The LULC change in the BTH area was analyzed; first, six cases were designed to simulate the climate status using the WRF model. Model analysis and geographic information system (GIS) analysis methods were both applied in this study.
3.1. LULC Transfer Matrix Analysis
To determine the rate of LULC change in BTH, an LULC transfer matrix was used to analyze the land-use transformations in 1990–2000 and 2000–2010 using the data mentioned in Section 2.3.1. The LULC change matrix reflects the dynamic change information on the mutual transformation of a specific region at the beginning and the end of a certain period. It not only includes static area information of a land type at a particular time in the region, but it also contains information on the types of land changes to other LULC types or the transformation of original LULC types to new LULC types. The formula for the land use transfer matrix can be expressed as:
Here, S represents the area, n refers to the number of LULC types transferred, and i and j refer to the type of LULC types at the beginning and at the end of the study period, respectively. The first row indicates the area of the first type transformed to all other types, including itself, and the other rows have the same meaning for their specific types. The first column indicates the area of all the other types, including the first type that is transformed into the first type, and the other columns indicates the same for their specific types. The terms on the diagonal in the matrix indicate a static value that does not change. The classification criteria included only six classes of the RESDC first-level classification. This is because the use of too many categories is not conducive for an analysis of the experimental results. To facilitate the analysis and highlight the experimental results, the LULC transfer matrix and other sections in this paper were based on the first-level classification of the RESDC.
3.2. WRF Simulation Scheme
All experiments for this study were simulated using WRF3.6.1 (ARW) with three domains in the Lambert projection. The outermost domain resolution was 27 km with 45 × 50 grids, and the outer domain was 9 km with 91 × 109 grids. The innermost domain was 3 km with 199 × 262 grids. Only the simulation output of the innermost domain was analyzed. The ERA-Interim reanalysis data were used for the initial and boundary conditions (as mentioned in Section 2.3.2). The WRF has a wide variety of available physical parameterizations. Furthermore, the selection of the parameterization scheme directly affected the simulation results of the WRF model. Jin, Miller [39] compared the effects of four land surface parameterization schemes on temperature and precipitation simulations and noted that the Noah land parameterization was more accurate for winter temperature simulations in China. Moreover, Jianjun, Ye [40] used the Noah land surface model to simulate conditions in China and achieved reliable results. The Yonsei University counter-gradient boundary layer turbulence transfer scheme was found to be better than other schemes [41]; therefore, it was used to estimate the effects of cropland expansion in eastern China [42]. Based on previous studies, the physical parameterizations we used are shown in Table 2.
The LULC raster data for 1990, 2000, and 2010 were converted into the USGS categories from the RESDC classification, and the conversion rules are shown in Table 1. The outdated geogrid data in the WRF were replaced by the processed LULC data, which was used as the underlying basis for the simulation. Due to the cost of calculation, the simulation time was restricted to 1–31 January and 1–31 July 2010 to represent winter and summer, respectively, with LULC data from each year (i.e., 1990, 2000, 2010). There were six experimental cases in this study (JAN1990, JAN2000, JAN2010, JUL1990, JUL2000, and JUL2010). The years 1990, 2000, and 2010 refer to the different LULC data sets. The first day of each experiment was spun-up. To avoid typically inaccurate results at the beginning of the simulation, the first-day results were not used in the analysis. Thus, the remaining 30 days that were output provided the experimental data. The only variable factor was the change in LULC, and the remaining parameters were kept the same to clearly explore the impact of LULC change on climate.
4. Results
4.1. LULC Change from 1990 to 2010
The changes from 1990 to 2010 were divided into two phases for comparison: before the new millennium (1990–2000; BM) and after the new millennium (2000–2010; AM). The LULC transfer matrix for the periods 1990 to 2000 and 2000 to 2010 was calculated and is presented in Table 3 and Table 4. Overall, the LULC changes in the AM period were significantly greater than those in the BM period; this is in line with China’s history of economic development.
Cropland (CPL) was the most important LULC type in BTH, as it occupied more than 50% of the whole study area (during this study). It was mainly distributed in the southeastern and northwestern regions of the study area, which encompasses the North China Plain. During these 20 years, croplands decreased by 4619 km2. In 1990–2000, the transformation of cropland to urban and built-up land (UBL) had the most significant change, reaching 2501 km2 and accounting for 76.67% of the cropland change and 48.18% of all land-type transformations. In 2000–2010, the cropland area also decreased by 2196 km2, where the area transformation from croplands to built-up land was the main type of loss (up to 4442 km2).
Woodlands (WDL) were mainly distributed along the western and northern mountains of BTH, and its area was only slightly less than that of croplands. The area of built-up land increased by 4344 km2, which was mainly due to the transformation from grasslands (GSL). The main period of transformation was in 2000-2010, when 4913 km2 of grasslands were transformed into woodlands, meanwhile, 1259 km2 woodland transformed to grassland.
Urban and built-up land was the land-use type that grew the most over the past 20 years; the growth rate increased significantly from 2639 km2 in 1990–2000 to 4054 km2 in 2000–2010, i.e., a growth rate of 53.62%. In 1990–2000, Beijing’s urban expansion caused the main growth area for built-up land, and there were decentralized areas of growth in southeastern Hebei. In 2000–2010, Beijing’s urban areas continued to expand, as shown in Figure 3b, with the exception of the western mountains. In addition, there was a significant expansion of urban lands in Tianjin, especially southeast of the Binhai New Area. New urban areas in Hebei were mainly due to the expansion of the old city, but the intensity of growth, relative to that in Beijing and Tianjin, was relatively small.
The reduction in grassland was also one of the major changes in this region. Grassland was mainly distributed in the west and the north; therefore, the reduction of grassland mainly occurred in these areas. In the 10 years during 2000–2010, grasslands were reduced by 5366 km2, which was the largest change out of all the LULC transformations. For this region, water (WTR) and unused land (UUL) were two types that experienced almost no transformations. Areas of WTR in the region maintained a basic balance over the entire 20 years. UUL was gradually being used and was mainly transformed into CPL, which accounted for 72.09% of its change (reduction) over 20 years.
4.2. Validation of the WRF Simulation
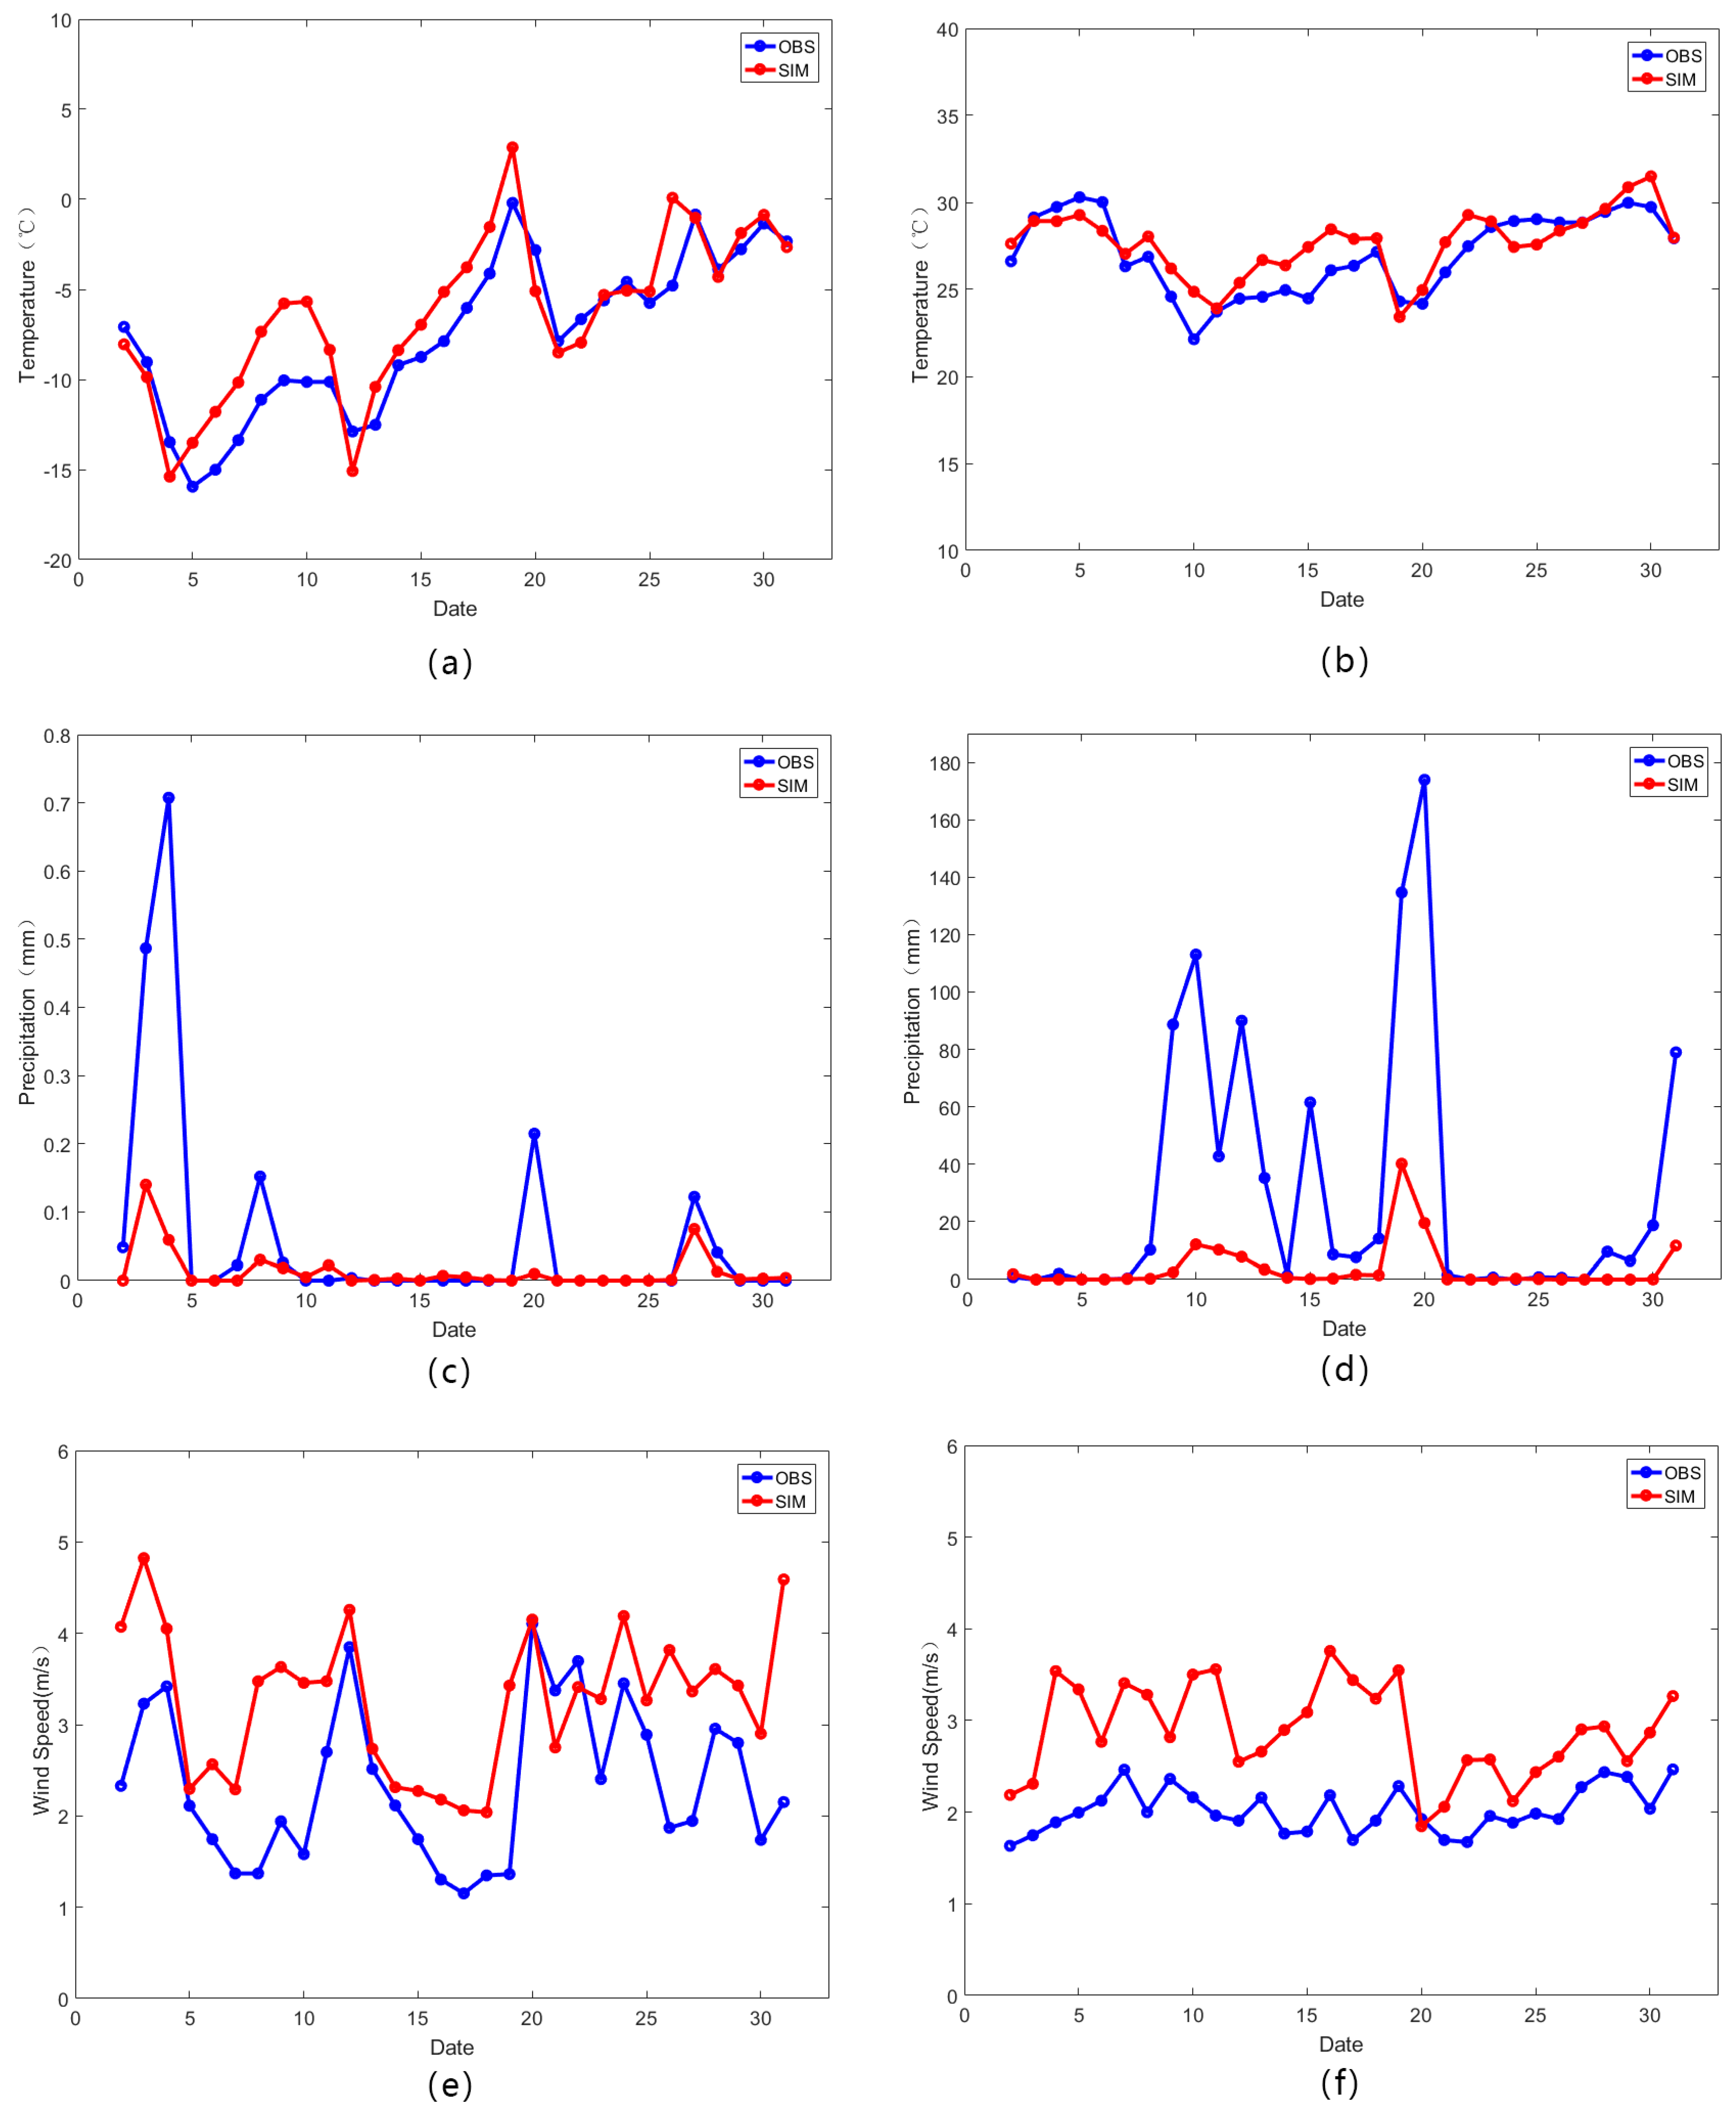
Comparing with 27 stations’ data in this area, the experiments simulated 2 m air temperature accurately in winter and summer (shown in Figure 4a,b). Most daily average biases were less than 1 °C, but large deviations did occur occasionally, especially in the middle of January. Overall, the simulation results in July were more precise than those in January. The monthly average error in January was 1.138 °C, but in July it was 0.737 °C. This is because the temperature changed significantly in winter, and it is difficult to sensitively simulate all dramatic changes. The correlation coefficient (CC) between the simulated and observed results was 0.89 in January and 0.85 in July, which indicated that the simulated values were closely correlated with the observed values. Similar experiments with a 1 km resolution (Wang, Feng [29]) simulated the meteorology conditions of three urban agglomerations in China for 36 months, including Beijing-Tianjin-Hebei, which resulted in a temperature bias of approximately 2 °C. The temperature and the wind speed were simulated for part of the Beijing-Tianjin-Hebei area, and the 1.5 °C root mean square error (RMSE) for July appeared in Wang, Huang [12]; however, the RMSE in this research was 1.043 °C in January and 1.313 °C in July.
Figure 4c,d show the comparison results for daily precipitation in January and July, individually. Although there was a large bias in the observed and simulated results, the trend for change was captured in the simulation. The CC of the observational and simulated daily precipitation in January was 0.76 and 0.8 in July, which meant that the simulation reflected various features well. In terms of the bias, the results from the observed values were higher than those from the simulation, which also appeared in Wang, Feng [16], who also noted why it was difficult to accurately simulate rainfall. This study focused on the difference in underlying surface changes affecting regional meteorology, and some model systematic errors can ultimately be offset by subtraction.
In Figure 4e–f, 10 m wind-speed comparisons (observed and simulated) are provided. As shown in this figure, the model simulated surface wind speed variations daily well. The magnitude was slightly greater than the observed values because the height parameters for the LULC types in this model were lower than in reality, which caused the resistance of the wind to be reduced in the simulation [12]. The CC between the observed and simulated results in January was 0.58 (0.38 in July), which was similar to some results from previous studies.
In general, experiments could well simulate the climate in the study area from temperature, precipitation and near-surface wind speed in winter and summer.
4.3. Impacts of LULC on Air Temperature
Air temperature, which is a result of radiation and atmospheric interaction, is one of the most intuitive and most easily perceived meteorological elements. To explore changes in the spatial distribution of temperature, we present Figure 5. Figure 5a,b show the January mean temperature differences between 1990–2000 and 2000–2010, respectively. Figure 5c,d show the same as Figure 5a,b, but for July. The average temperature in 1990–2000 increased by 0.059 °C in January (BM-JAN) and by 0.025 °C in July (BM-JUL). In 2000–2010, the temperature rose by 0.085 °C in January (AM-JAN) and by 0.151 °C in July (AM-JUL). These results are similar to those of Cui, Liu [50] for the Beijing-Tianjin-Tangshan area. They found that a majority of their study area increased by 0.05 °C in January and by 0.15 °C in July from 1980 to 2008. Generally, the figure shows that the LULC impacts on the 2000–2010 temperature change were obviously greater than in 1990–2000, which is consistent with the extent of the LULC change. The change in northwest part of the BTH region may be affected by changes outside the study area, and resulted in the temperature rise in Zhangjiakou (ZJK).
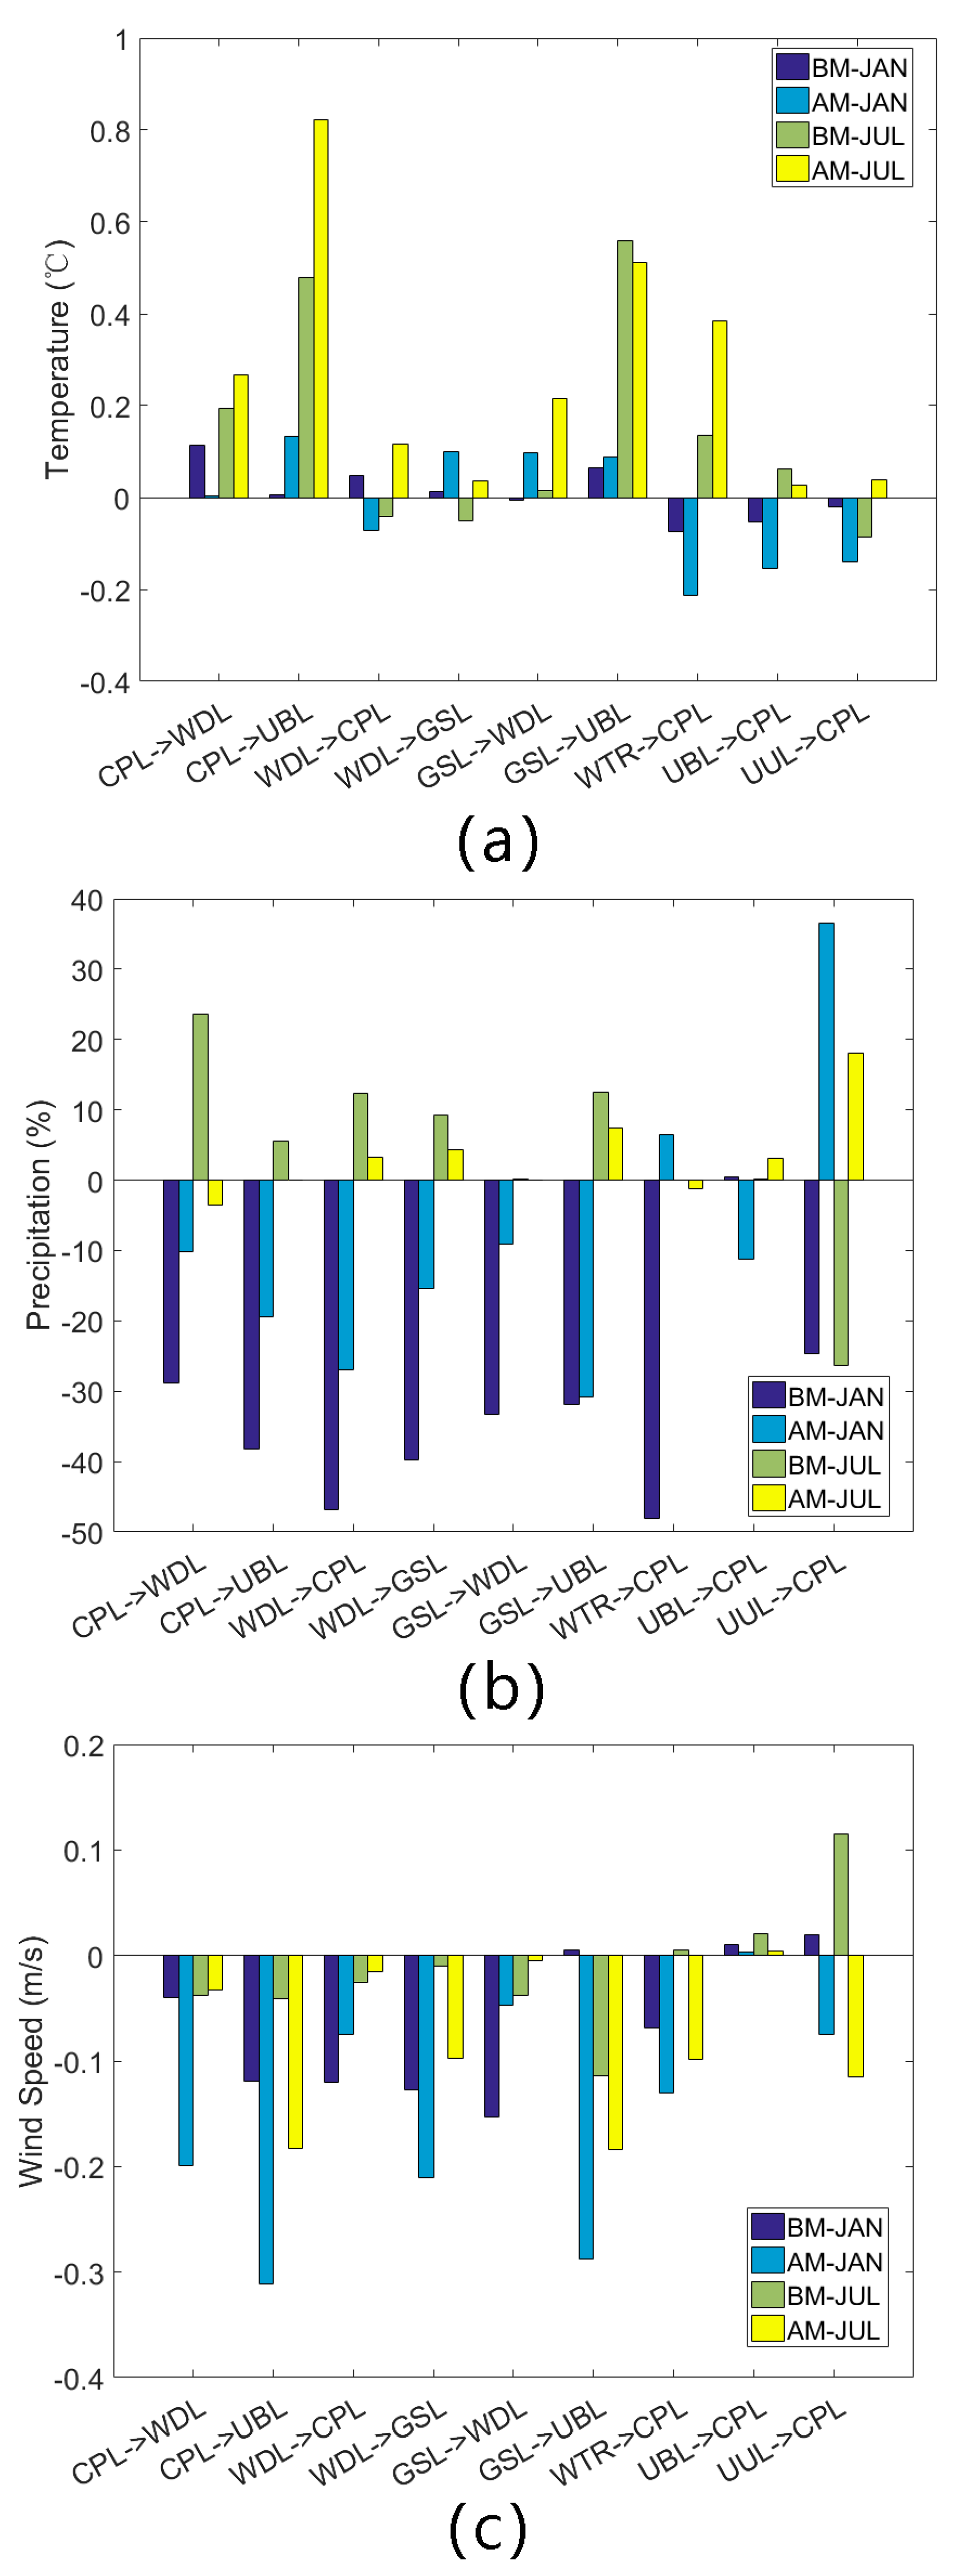
To explore the impact of different LULC changes on temperature, we conducted a statistical analysis on the changing grid, and the statistical results are shown in Figure 6a. It can be seen that the BTH area has been getting warmer over the past two decades, which is the same result we attained from Figure 5. The most obvious areas with increased temperature were those that experienced a transformation to built-up land. The area of cropland that was transformed to built-up land in BM-JUL, and the area of grassland that was transformed to built-up land in BM-JAN, were linked to temperature increases of 0.822 °C and 0.558 °C, respectively. These increases were obviously higher than the average increase in temperature for the entire region. The transformation of water bodies into croplands was also linked to a temperature increase, which is because the heat capacity of water is much greater than that of croplands. However, the change (temperature increase) from built-up land to croplands was the same as that from croplands to built-up land in July; this was probably because those transformations were mostly dispersed and adjacent to the built-up land expansion area (as shown in Figure 3), where the main form of LULC variations in the region were significant temperature increases in summer that also affected surrounding areas. Because a majority of the urban expansion occupied the surrounding croplands, the two types of LULC were usually adjacent to each other, which led to interactions between them. To reduce this effect, future research will change the LULC transformations in an ideal environment for each experiment to explore the impacts on climate change.
Regarding seasonal changes, the range of winter variations was obviously smaller than that of summer variations. This is because in winter, the total amount of radiation received on the surface was less than that in summer, resulting in a corresponding reduction in the amount of change. On the other hand, compared with 1990–2000, the range of variations in 2000–2010 increased significantly. This was related to the intensity of the LULC change after the year 2000. According to the analysis on the correlation between the change in temperature and the change in LULC, the correlation coefficient in 1990–2000 was 0.23, and the correlation coefficient in 2000–2010 was 0.50. This suggests that the LULC change had impacts on air temperature, and the degree of the impacts increased.
4.4. Changes in Precipitation
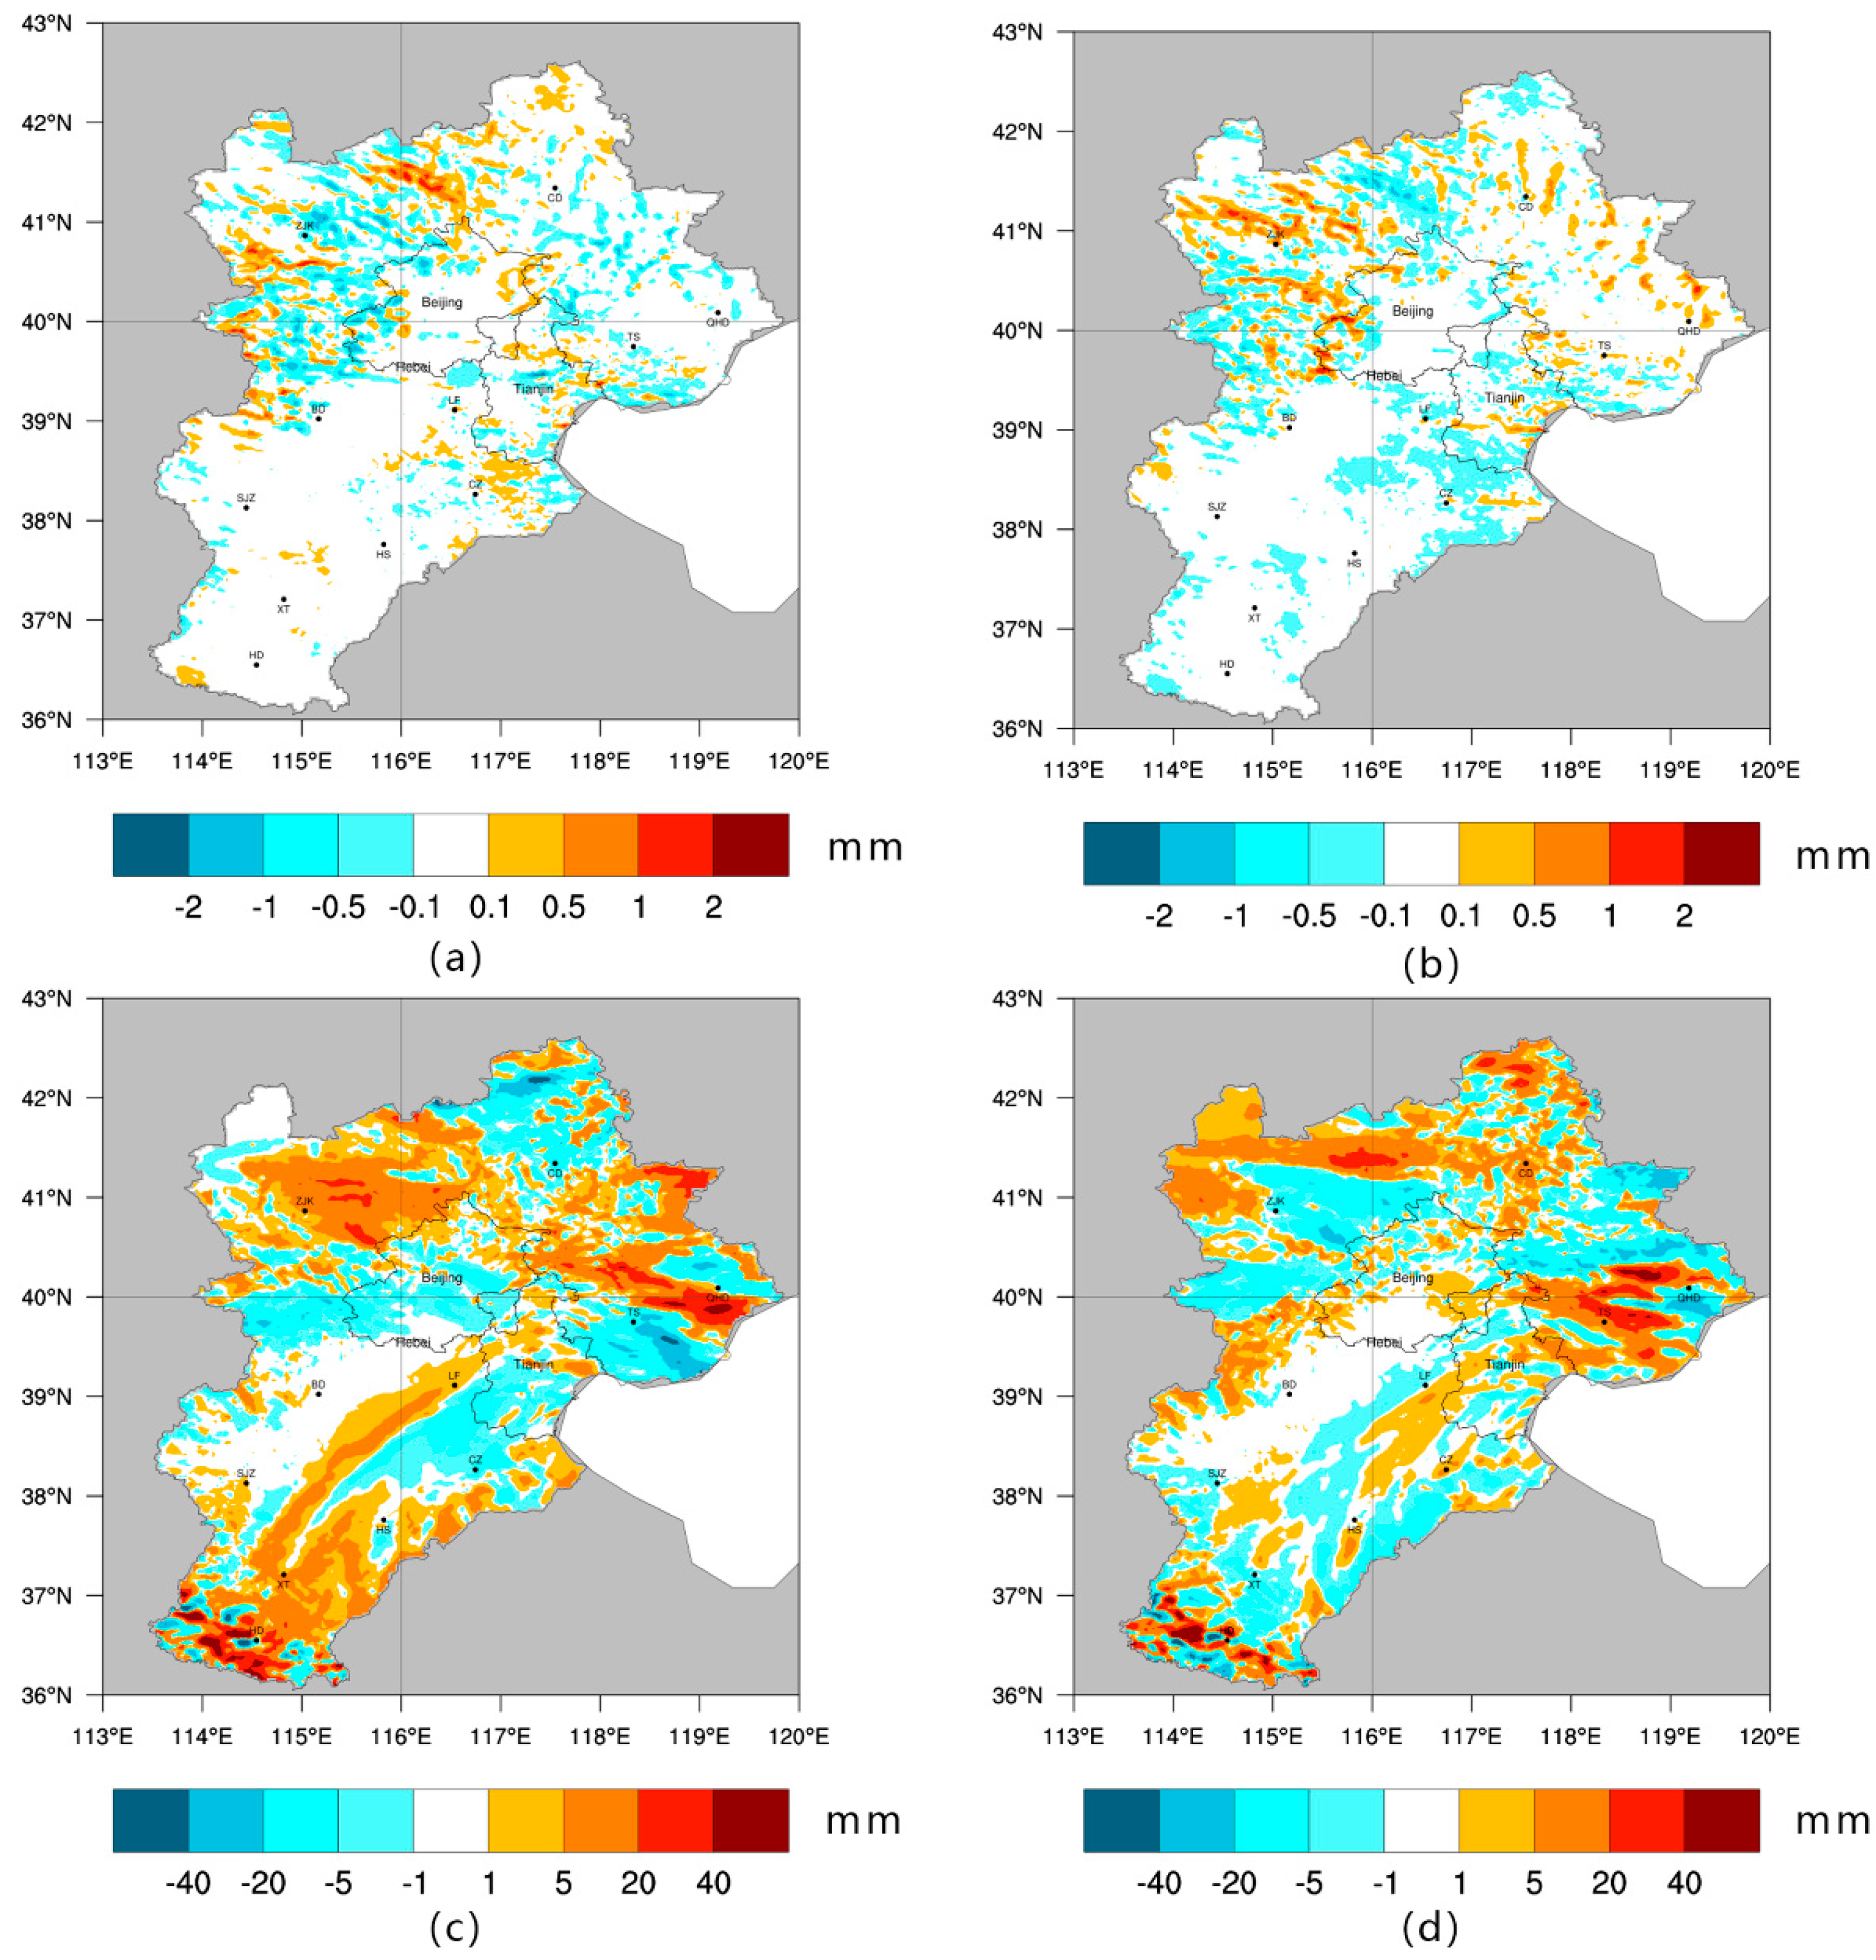
The BTH area was obviously affected by the East Asian monsoon, as it shows a seasonal pattern of heavy rainfall in summer and scarce precipitation in winter. Based on varying characteristics, precipitation in January and July was analyzed individually, and the results are shown in Figure 7. Because summer precipitation was adequate, the magnitude of the change in summer was relatively obvious. At the same time, changes in precipitation also showed seasonal differences. Over the two decades, LULC changes resulted in an increase in precipitation in summer and a decrease in winter. BM-JAN and AM-JAN showed reductions in average daily precipitation of 0.035 and 0.043 mm, respectively; BM-JULY and AM-JULY showed increases of 1.38 and 0.388 mm, respectively, in the study area.
Based on the spatial distribution, an interesting phenomenon was observed: the Beijing, Baoding and Shijiazhuang areas connected to a band where few precipitation changes occurred. This band extended from the southwest to the northeast, which coincided with a trend in the mountains of North China. These areas near the mountains may block the water cycle and cause the region to be precipitation scarce (proven in Figure 9). We also found that the region of change in precipitation is large, not confined to a small pixel area of land use change, but a region around it.
Therefore, LULC changes caused by precipitation are different, which is shown in Figure 6b by the percentages of the simulation results (i.e., the change rates for 1990–2000 based on 1990 precipitation and for 2000–2010 based on 2000 precipitation). This suggests that although winter precipitation is much less than that in summer, the proportion of change is greater in winter than in summer. The drop ratio for the 2000–2010 winter is less than that for the 1990–2000 winter, and the ratio change in summer is the same as that in winter. Precipitation in areas transformed into croplands decreased significantly in winter, nearly 50%, and the drop ratio was more than of areas from cropland to built-up land (38.13%) and from woodland to grassland (39.72%). In summer, precipitation increased of the area from cropland to woodland the most (23.65%), followed by increases in the area from grassland to built-up land in 1990–2000 (12.45%) or in the area from unused land to cropland in 2000–2010 (17.99%).
4.5. LULC Influence on Wind
Regional air circulation is part of the global atmospheric circulation and is one of the major forms of global material cycling, which has significant effects on temperature, air quality, and precipitation. In this study, we only discuss near-ground air circulation, as it shows the difference in wind speed at a 10-m height in 1990–2000 and 2000–2010 (Figure 8). The wind speed in urban and urban expansion areas decreased because the height of the urban buildings was usually higher than that of other natural vegetation, which increased the roughness of the surface, hindering air circulation and lowering wind speed. The effect of the woodland expansion in 2000–2010 on wind speed was different; it slowed down obviously in the Zhangjiakou and Chengde areas, but the reductions in the Handan, Shijiazhuang, and Baoding areas were weak, which may be due to the impact of altitude. As Figure 1b shows, Zhangjiakou and Chengde are located at the northwest and northern regions of the BTH area, which has high altitudes; the wind speed here is significantly greater than that in the southeast area, as shown in Figure 9. Therefore, the same change in roughness has a greater impact on near-surface wind speed.
The average decrease in wind speed in 2000–2010 was greater than that in 1990–2000, as can be seen on Figure 8. This is mainly due to the large expansion of built-up land and woodlands during 2000–2010. Based on different seasons, the average wind speed for the whole BTH area reduced the daily average wind speed by 0.039 m/s and 0.041 m/s in BM-JAN and AM-JAN, respectively. This was higher than the 0.0159 m/s reduction in BM-JUL and the 0.018 m/s reduction in AM-JUL. These reductions in winter were more than twice those in summer.
The area transformed into built-up lands were the main contribution to the reduction in wind speed as can be seen on Figure 6c The maximum change in wind speed related to the change from croplands to built-up land was >0.3 m/s. Changes from croplands to woodlands and from grasslands to woodlands were also major factors in the change in lower air circulation speed related to the LULC change. The change in latter areas was scattered, as shown in Figure 3; therefore, these grids were affected by surrounding changes. Otherwise, the surface roughness should have been reduced. On the other hand, the area transformed into croplands from built-up land, which contained rural settlements, had a positive impact on wind speed. The transformation of unused land into croplands in 1990–2000 also contributed to this change.
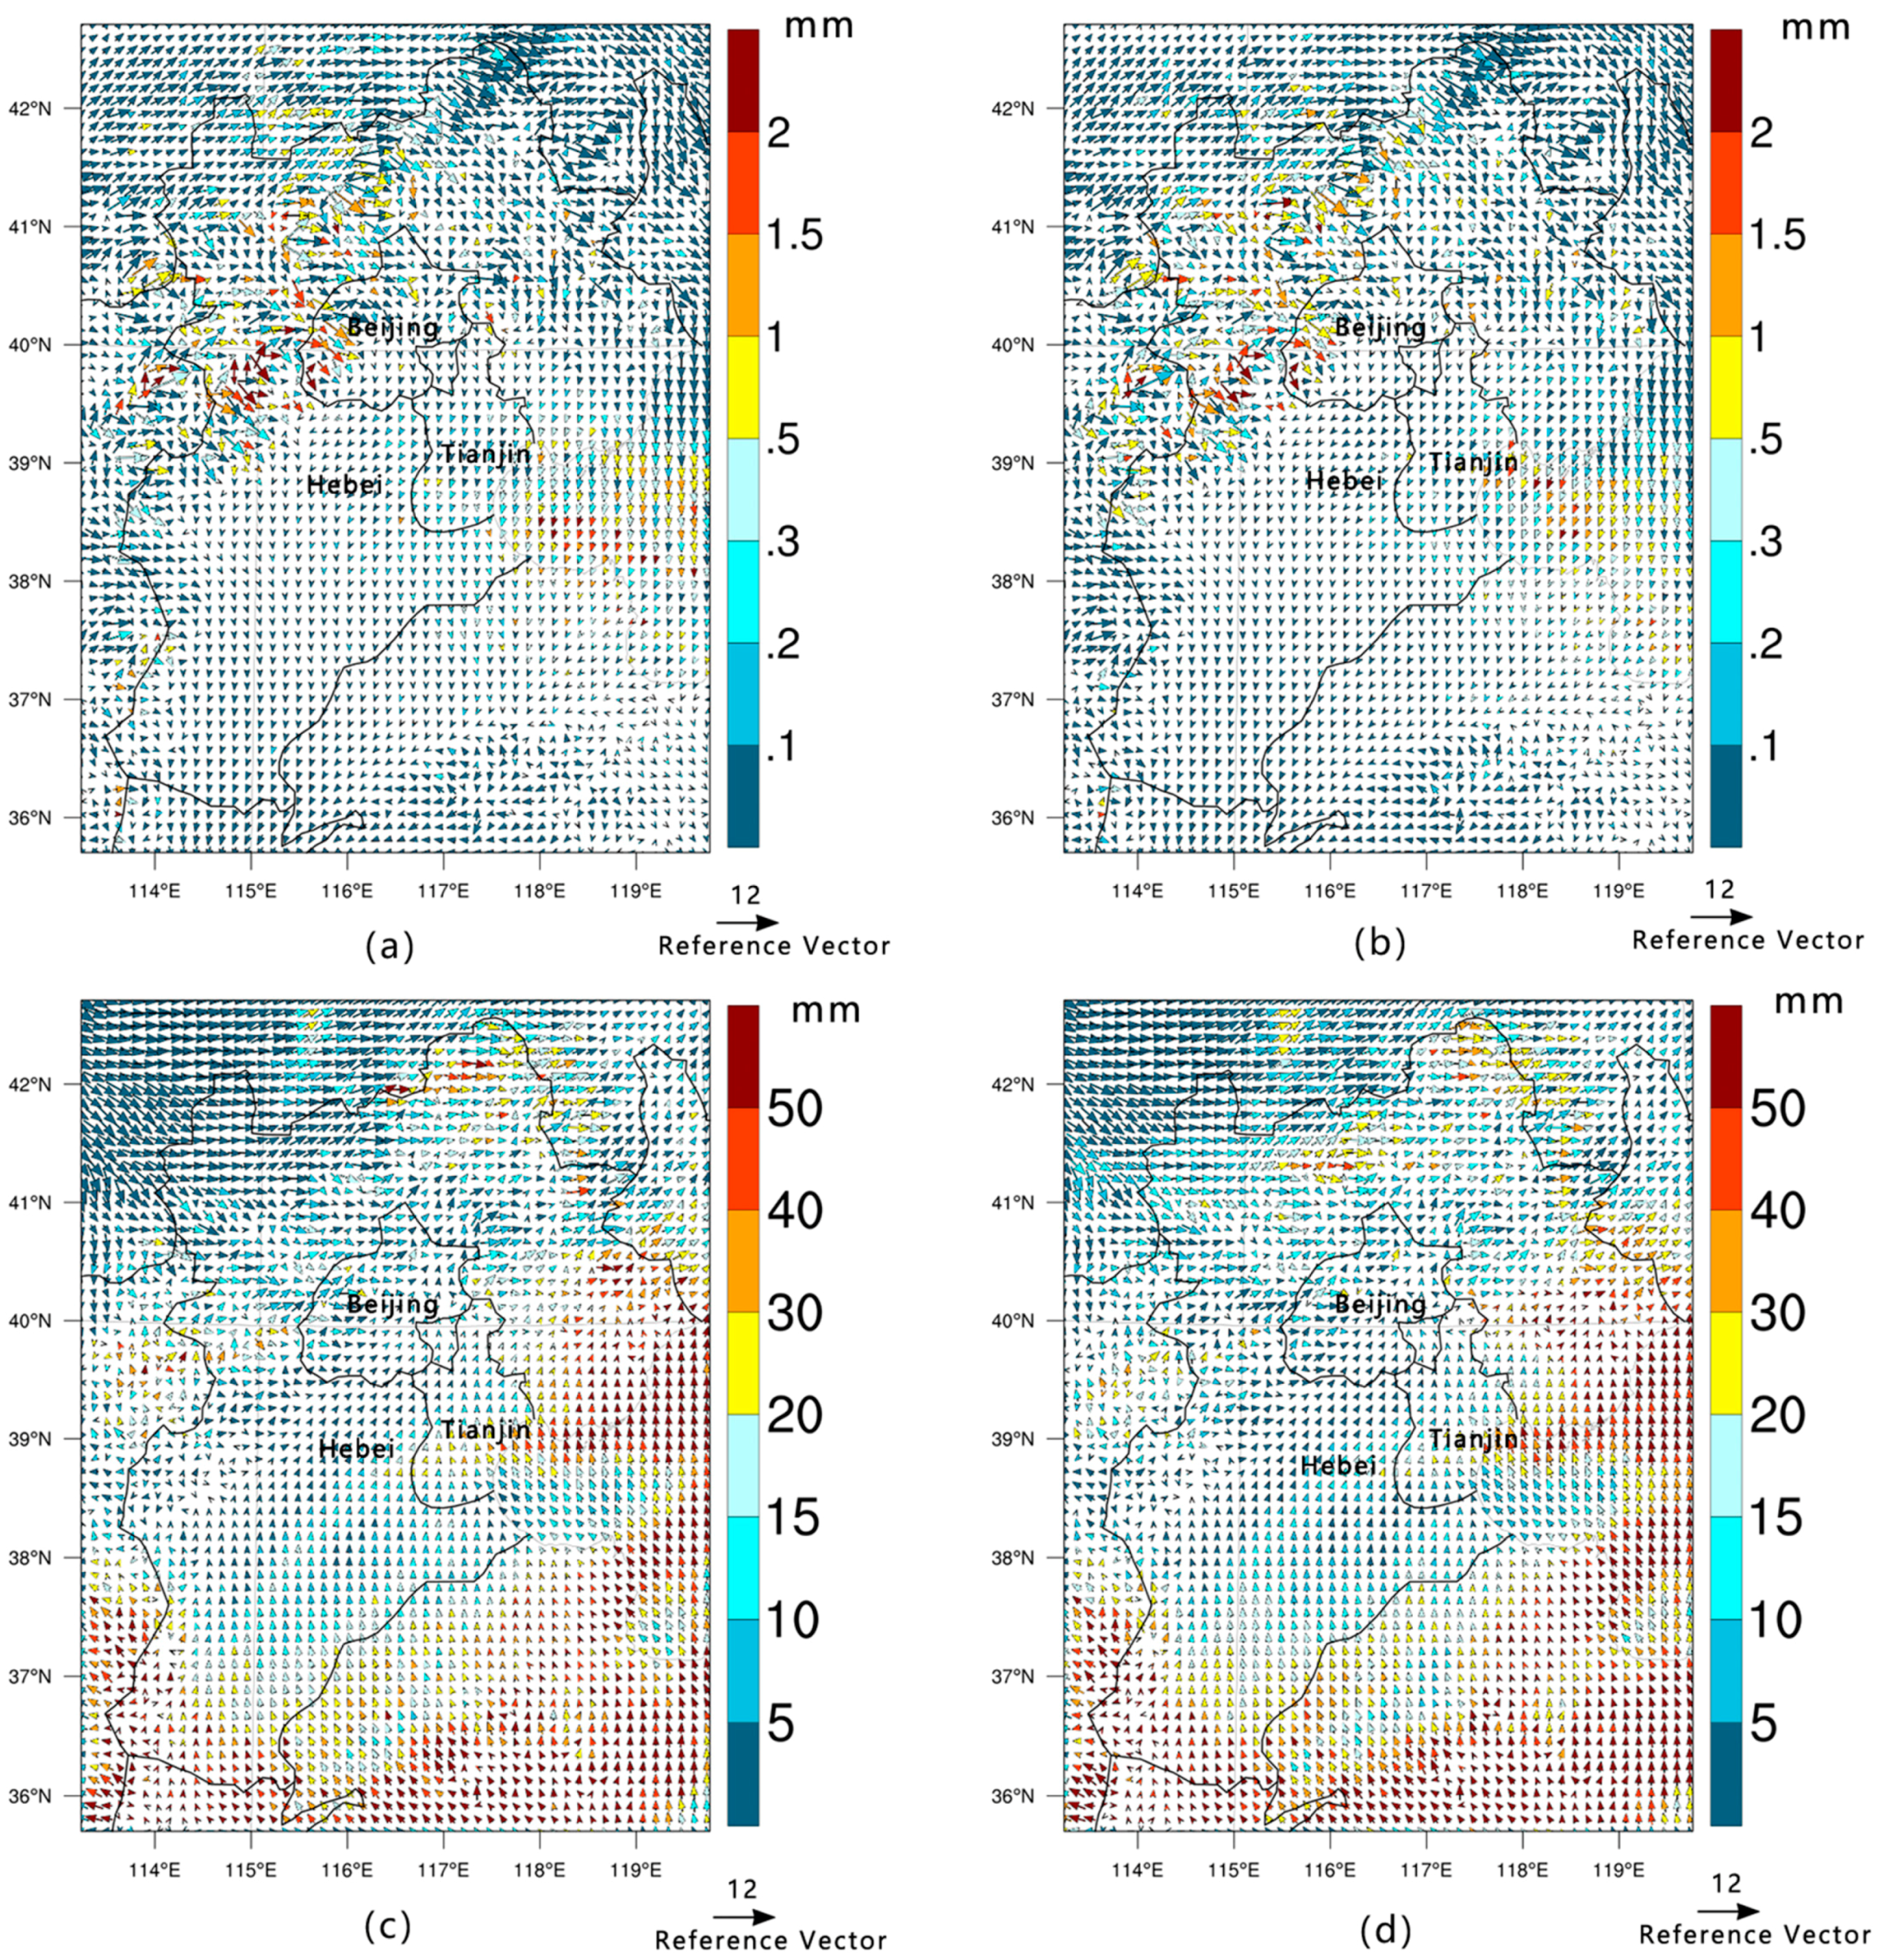
To get a clearer understanding of the influence of LULC change on low-level air circulation, the wind direction patterns at 10 m for 1990 and 2010 are shown in Figure 9. The figure suggests that the BTH region was strongly affected by the northwest monsoon in the winter. The large number of areas transformed from grasslands to woodlands in the western and northern mountains make these areas relatively warmer and more humid in winter than they were previously. The warm and cold air flows meet at the mountain and form precipitation, but the mountain causes these air flows to move eastward, which is why the area to the southeast is drier than the area to the northeast in winter. In summer, two airflows, the northwest wind and southeast monsoon, affect the region and flow to the north after colliding. Comparing Figure 9c,d, it can be seen that the precipitation area is close to the northwest and the southeast, but it obviously increases in the northwest, which is likely due to area transformations from grasslands to woodlands in the region.
On the other hand, LULC changes also effected the direction of the air circulation. Due to the roughness of the underlying surface, the air circulation was blocked in some places, which changed the direction and flow of the wind field into the channel. As shown in Figure 9, areas covered by trees (i.e., the western and northern regions of the study area) and large cities (i.e., Beijing and Tianjin) significantly impeded the air flow and changed the wind direction, which was the same result as that in Fei and Peng [51].
5. Discussion
Before 2000, development in BTH mainly relied on development in the capital city of Beijing, and the Beijing-Tianjin-Hebei collaboration showed no substantial progress. After 2000, the Beijing-Tianjin-Hebei regional cooperation began and developed in the new period, which led to a greater development of the study area. In addition, the establishment of the Binhai New Area, as well as changes in environmental protection and farmland policies, led to drastic LULC transformations. Figure 3 shows the spatial distribution of several significantly changed LULC classes. These results are similar to those in Wu, Zhao [27], in that the development of Beijing and Tianjin was faster than that in Shijiazhuang, and the Binhai New Area was the main area of growth (especially in 2005–2010). As urbanization process accelerated, the Chinese government paid more attention to environmental problems, and more environmentally favorable policies were implemented. The area of woodland expansion in 2000–2010 was mainly due to the policy that returned farmlands to forests. Liu, Kuang [9] analyzed the LULC change in China since the 1980s and found that the woodlands area increased in 2000–2010, while the impact of policies such as “Grain for Green”, “Western Development” and “Revitalization of Northeast” on LULC was illustrated. LULC as the underlying surface of the climate system changed greatly in this period and caused climate changes that are simulated and analyzed in this research.
The BTH area warmed over the past two decades, which was mainly due to urban expansion. Bornstein [52] discovered the heat island effect in the 1960s after researching New York City observational data. Similar results was made after the study of Shijiazhuang urban development by Bian, Ren [53]. Compared with previous research results by observational data, the urban expansion area has a smaller temperature increase, which is mainly because LULC is one of factors contributed to warm, on the other hand, factors such as human activity and aerosol emissions all increased urban temperature more than that in non-urban areas. The LULC change in 1990–2000 was mainly built-up land expansion, and previous studies proved that the warming effect of urban areas was higher in summer than that in winter. This is because the heat flux in summer was greater, and much of it transformed into sensible heat in urban areas [29,54]. We achieved a similar result for the 2000–2010 data, while the BM-JAN warming rate was higher than that in BM-JUL. It was also found in Cui, Liu [50] that the spatial distribution or magnitude of warming caused the range of July variations to be greater than that of January variations. During the two study decades, the woodlands increased by 4434 km2 and were mainly located in the mountains of the western and northern BTH region, which eased the warming trend in these areas of change, as shown in Figure 5b,d.
Precipitation is an important meteorological factor and is a key link in global and regional water cycles. Wang, Feng [29] concluded that increasing surface roughness during urbanization would weaken low-level air circulation, which would also cause instability in the boundary layer, resulting in a precipitation reduction. Li, Chen [55] noted that a reduced vegetation cover would reduce latent heat and evaporation in the area. With an albedo reduction, the decrease in leaf area index would reduce evaporation, which would be the immediate reason for the decrease in local precipitation. They observed a band area with little precipitation change, which, probably due to the urban area, divided the convective weather [56,57] and oriented this band in the vertical direction of the wind, reduced precipitation. There was one more possibility: that urbanization lowers precipitation in this area, which would cause the range of precipitation change to be limited [29,58]. The impact of the LULC change on precipitation would be different in different seasons. Convective precipitation in summer was the main source of precipitation in this area; however, the energy exchange between the underlying surface and atmospheric air was influenced by LULC change, which may have influenced the horizontal gradient force and impacted the air circulation. This could also be a reason why LULC changes have greater impacts on summer precipitation. Based on the area transformations from croplands to built-up land and from woodlands to grasslands, evapotranspiration weakened the water vapor exchange between the surface and the atmosphere, which further weakened the turbulence of water vapor. In the horizontal direction, there were changes in the transmission of energy not only between the Earth’s surface and the atmosphere, but there were also changes in the local air circulation. Because the vertical and horizontal air circulation were impacted, the precipitation decreased in this area. Because precipitation is a complex process, it is difficult to simulate its exact value [16]; however, LULC change is a factor that affects its trend.
Regardless of urban expansion or afforestation, roughness increased and wind speed decreased in this area. Meanwhile, different seasons had different degrees of influence. Our results for seasonal change coincided with Li, Yan [59], who stated that wind speed in Beijing in 1960–2008 with the largest decreasing magnitude was in winter, the followed by spring, autumn, and summer. However, their results of −0.22 m/s per 10 years was larger than our results, which was mainly because the changes in large-scale circulation were accounted for. The change of surface roughness leads to the decrease of wind speed, which is one of reasons why the BTH region has recently been subjected to stronger and longer periods of hazy weather in winter [60]. The expansion of built-up land and woodlands led to a decrease in regional air metabolism, which should be paid attention to by the government to determine how to protect air quality during the process of urbanization.
To confirm the accuracy of the simulation results in this area, observational data were used from January 2010 and July 2010. The compared experimental cases were JAN2010 and JUL2010. We hypothesize that the bias of these results may be caused by the following factors. First, the observed values were obtained at metrological station points, but the simulated results were interpolated by grids. Second, the default parameters in the land surface scheme, such as the height of the object, were different from the actual conditions in the study area, which may have caused errors in the simulation [12]. Finally, the classification of the remote sensing images could not be exactly the same as the actual ground change. The error of the underlying surface data could influenced the accuracy of the climate change results. However, based on the accuracy of the comparative analysis, it was found that the model well simulated the climate conditions in the study area. As we focus on the differences in each simulation, the bias can be considered as a systematic error that does not affect the reliability of the conclusions.
Based on the study of the effects of LULC change on the atmosphere, the changes in LULC altered the properties of the underlying surface (e.g., albedo, sensible heat, latent heat, and roughness). Different land use and land cover changes have different effects on various climatic factors, as hypothesized previously. These results are intended to assist the government in formulating land policies that are more ecologically compatible and sustainable. Through previous experiments, we have obtained the impact of various major land-use changes on climatic factors. However, the interaction between adjacent LULC changes are in the results. Therefore, clarifying the impact of adjacent changes and the establishment of a climate change model influenced by LULC change will be the focus in the future. The error of LULC data should be controlled in the future experiment, which also needs to be paid more attention to. In addition, long time simulations will also be considered in our next experiment.
6. Conclusions
LULC in the BTH region has undergone significant changes over the past 20 years (1990 to 2010). Urbanization is the main feature of development in the region, and a large area of cropland has been transformed into built-up land, which accounts for half of the 1990–2000 LULC changes. BTH is a region with a concentrated population, where LULC constantly changes in ways that are beneficial to mankind. Land mainly uses this shift to built-up land, woodlands, and croplands, which are the three LULC types that provide space for humans to live, as a means to improve natural environmental services and to provide food resources for people. However, 6942 km2 of croplands were replaced by built-up land, which caused croplands to show a significantly declining trend. The changes in LULC in BTH were diverse, but previous studies on the effects of LULC change on climate change in this region mainly focused on urban areas. We conducted a comprehensive analysis on the various LULC changes in this region and studied the mutual influence on climate change between 1990–2000 and 2000–2010. The effects of various major LULC changes on temperature, precipitation and wind speed were spatially and quantitatively analyzed.
The change in LULC in this area led to a temperature change. Air temperature increased by 0.042 °C/10a in 1990–2000 and by 0.118 °C/10a in 2000–2010, which indicated a rising trend. The increasing area from croplands to built-up land caused the largest temperature increase of 0.36 °C/10a, followed by the area that transformed from grasslands to built-up land (0.306 °C/10a). The remaining LULC changes made the BTH warmer than before, excluding the area changes from built-up land to croplands and unused land to croplands (−0.029 °C/10a and −0.068 °C/10a, respectively), which played cooling roles.
Precipitation was also significantly affected by LULC change. The amount of precipitation in winter was significantly reduced, while in summer, the trend increased. Summer rainfall accounted for the majority of annual rainfall, and total precipitation showed an upward trend. In January, precipitation reduced in the area of transformation from other land types to croplands, but areas that transformed to woodlands and built-up land showed an obvious increasing trend in summer. In addition, precipitation and air circulation had a close relationship. In summer, the area was strongly affected by the southeast monsoon, which caused an increase in rainfall in the southeast compared to that in the northwest. In this research, there was a small precipitation change band, which included Beijing, Baoding, and Shijiazhuang, which may have been caused by the terrain of the region and the expansion of urban land.
The change in low-level wind speed was mainly affected by surface roughness, which was related to the change in LULC. Whether it was due to the expansion of built-up land or forests, surface roughness increased and slowed down the wind speed at 10 m. The average wind speed reduced by 0.153 m/s per decade in the region transformed into built-up land, followed by a 0.06 m/s per decade reduction in the region transformed into woodlands. The seasonal change in wind speed was also relevant. In winter, the BTH was affected by the northwest monsoon, while in summer, the BTH was also affected by the southeast wind. This caused different magnitude changes in different seasons. In general, the wind speed change was larger in winter than in summer.
Acknowledgments
This study was supported by the National Natural Science Foundation of China (grant number 41601432), the Beijing Natural Science Foundation (grant number 8174074), the Fundamental Research Funds for the Central Universities (grant number 2652015339) and the Chinese National Major Programs of International Cooperation and Exchanges of China (grant number 2015DFA01370).
Author Contributions
Xinqi Zheng and Chunxiao Zhang conceived the research and revised the article; Jiayang Li and Chunxiao Zhang designed the research; Jiayang Li performed the simulations and wrote the article; Youmin Chen provided and analyzed data. All authors read and approved the final manuscript.
Conflicts of Interest
The authors declare no conflict of interests.
References
- Henderson-Sellers, A.; Dickinson, R.E.; Durbidge, T.B.; Kennedy, P.J.; Mcguffie, K.; Pitman, A.J. Tropical deforestation: Modeling local- to regional-scale climate change. J. Geophys. Res. Atmos. 1993, 98, 7289–7315. [Google Scholar] [CrossRef]
- Bonan, G.B. Forests and climate change: Forcings, feedbacks, and the climate benefits of forests. Science 2008, 320, 1444–1449. [Google Scholar] [CrossRef] [PubMed]
- Ryoji, Y.; Kumiko, T.; Jun, M.; Tetsuzo, Y. Numerical study of the impacts of land use/cover changes between 1700 and 1850 on the seasonal hydroclimate in monsoon Asia. J. Meteorol. Soc. Jpn. 2011, 89A, 291–298. [Google Scholar]
- Pathirana, A.; Denekew, H.B.; Veerbeek, W.; Zevenbergen, C.; Banda, A.T. Impact of urban growth-driven landuse change on microclimate and extreme precipitation & mdash; a sensitivity study. Atmos. Res. 2014, 138, 59–72. [Google Scholar]
- Vitousek, P.M.; Mooney, H.A.; Lubchenco, J.; Melillo, J.M. Human domination of earth’s ecosystems. Science 1997, 277, 494–499. [Google Scholar] [CrossRef]
- Stocker, T.F.; Qin, D.; Plattner, G.K.; Alexander, L.V.; Allen, S.K.; Bindoff, N.L.; Bréon, F.M.; Church, J.A.; Cubasch, U.; Emori, S. IPCC, 2013: Technical summary. In Climate Change 2013: The Physical Science Basis. Contribution of Working Group I to the Fifth Assessment Report of the Intergovernmental Panel on Climate Change; Stocker, T.F., Qin, D., Plattner, G.-K., Tignor, M., Allen, S.K., Boschung, J., Nauels, A., Xia, Y., Bex, V., Midgley, P.M., Eds.; IPCC: Geneva, Switzerland, 2007. [Google Scholar]
- Vasseur, L.; Thornbush, M.; Plante, S. Climatic and environmental changes affecting communities in Atlantic Canada. Sustainability 2017, 9, 1293. [Google Scholar] [CrossRef]
- Deng, J.S.; Ke, W.; Hong, Y.; Qi, J.G. Spatio-temporal dynamics and evolution of land use change and landscape pattern in response to rapid urbanization. Landsc. Urban Plan. 2009, 92, 187–198. [Google Scholar] [CrossRef]
- Liu, J.; Kuang, W.; Zhang, Z.; Xu, X.; Qin, Y.; Jia, N.; Zhou, W.; Zhang, S.; Li, R.; Yan, C. Spatiotemporal characteristics, patterns, and causes of land-use changes in China since the late 1980s. J. Geogr. Sci. 2014, 24, 195–210. [Google Scholar] [CrossRef]
- Xie, H.; Kung, C.C.; Zhao, Y. Spatial disparities of regional forest land change based on ESDA and GIS at the county level in Beijing-Tianjin-Hebei area. Front. Earth Sci. 2012, 6, 445–452. [Google Scholar] [CrossRef]
- Kuang, W. Simulating dynamic urban expansion at regional scale in Beijing-Tianjin-Tangshan metropolitan area. J. Geogr. Sci. 2011, 21, 317–330. [Google Scholar] [CrossRef]
- Wang, J.; Huang, B.; Fu, D.; Atkinson, P.M.; Zhang, X. Response of urban heat island to future urban expansion over the Beijing–Tianjin–Hebei metropolitan area. Appl. Geogr. 2016, 70, 26–36. [Google Scholar] [CrossRef]
- Li, M.; Wang, T.; Xie, M.; Zhuang, B.; Li, S.; Han, Y.; Cheng, N. Modeling of urban heat island and its impacts on thermal circulations in the Beijing–Tianjin–Hebei region, China. Theor. Appl. Climatol. 2017, 128, 999–1013. [Google Scholar] [CrossRef]
- Kawamoto, Y.; Kawamoto, Y.; Kawamoto, Y. Effect of land-use change on the urban heat island in the Fukuoka–Kitakyushu metropolitan area, Japan. Sustainability 2017, 9, 1521. [Google Scholar] [CrossRef]
- Wang, M.; Yan, X. A comparison of two methods on the climatic effects of urbanization in the Beijing-Tianjin-Hebei metropolitan area. Adv. Meteorol. 2015, 2015, 352360. [Google Scholar] [CrossRef]
- Wang, J.; Feng, J.; Yan, Z. Potential sensitivity of warm season precipitation to urbanization extents: Modeling study in Beijing-Tianjin-Hebei urban agglomeration in China. J. Geophys. Res. Atmos. 2015, 120, 9408–9425. [Google Scholar] [CrossRef]
- He, Y.; Jia, G.; Hu, Y.; Zhou, Z. Detecting urban warming signals in climate records. Adv. Atmos. Sci. 2013, 30, 1143–1153. [Google Scholar] [CrossRef]
- Shen, X.; Liu, B.; Li, G.; Yu, P.; Zhou, D. Impacts of grassland types and vegetation cover changes on surface air temperature in the regions of temperate grassland of China. Theor. Appl. Climatol. 2016, 126, 141–150. [Google Scholar] [CrossRef]
- Hu, Y.; Jia, G.; Hou, M.; Zhang, X.; Zheng, F.; Liu, Y. The cumulative effects of urban expansion on land surface temperatures in metropolitan Jingjintang, China. J. Geophys. Res. Atmos. 2015, 120, 9932–9943. [Google Scholar] [CrossRef]
- Halder, S.; Saha, S.K.; Dirmeyer, P.A.; Chase, T.N.; Goswami, B.N. Investigating the impact of land-use land-cover change on indian summer monsoon daily rainfall and temperature during 1951–2005 using a regional climate model. Hydrol. Earth Syst. Sci. Discuss. 2015, 12, 6575–6633. [Google Scholar] [CrossRef]
- Chase, T.N.; Pielke, R.A., Sr.; Kittel, T.G.F.; Nemani, R.R.; Running, S.W. Simulated impacts of historical land cover changes on global climate in northern winter. Clim. Dyn. 2000, 16, 93–105. [Google Scholar] [CrossRef]
- Wang, T.; Chang, L. Quantitative structural analysis on land use change in Beijing-Tianjin-Hebei region. J. Shanxi Univ. 2010, 33, 473–478. [Google Scholar]
- Zhao, X.L.; Zhang, Z.X.; Zou, Y.R.; Zhou, Q.B. An analysis of characteristics of land use dynamic change in North China. Remote Sens. Land Resour. 2002, 14, 23–28. [Google Scholar]
- Yao, X.; Yin, H. Basic data of Chinas population. China Popul. Today 1994, 4, 25. [Google Scholar]
- Sumita, M. Communiqué of the national bureau of statistics of people’s republic of china on major figures of the 2010 population census (No. 1). China Popul. Today 2011, 6, 19–23. [Google Scholar]
- Sun, F.; Sun, D.; Hu, Y.; Li, S.; Xu, J. Changing patterns of Chinese population pressure on the ecological environment: 1990–2010. Popul. Res. 2013, 37, 103–113. [Google Scholar]
- Wu, W.; Zhao, S.; Zhu, C.; Jiang, J. A comparative study of urban expansion in Beijing, Tianjin and Shijiazhuang over the past three decades. Landsc. Urban Plan. 2015, 134, 93–106. [Google Scholar] [CrossRef]
- Chen, G.; Zhao, L.; Mochida, A. Urban heat island simulations in Guangzhou, China, using the coupled wrf/ucm model with a land use map extracted from remote sensing data. Sustainability 2016, 8, 628. [Google Scholar] [CrossRef]
- Wang, J.; Feng, J.; Yan, Z.; Hu, Y.; Jia, G. Nested high-resolution modeling of the impact of urbanization on regional climate in three vast urban agglomerations in China. J. Geophys. Res. Atmos. 2012, 117, 21103. [Google Scholar] [CrossRef]
- Wang, M.; Yan, X.; Liu, J.; Zhang, X. The contribution of urbanization to recent extreme heat events and a potential mitigation strategy in the Beijing–Tianjin–Hebei metropolitan area. Theor. Appl. Climatol. 2013, 114, 407–416. [Google Scholar] [CrossRef]
- Skamarock, W.C.; Klemp, J.B.; Dudhia, J.; Gill, D.O.; Barker, D.M.; Duda, M.G.; Huang, X.-Y.; Wang, W.; Powers, J.G. A Description of the Advanced Research WRF Version 3; NCAR Technical Note NCAR/TN-475+STR; National Center for Atmospheric Research: Boulder, CO, USA, 2008. [Google Scholar]
- The Data Center for Resources and Environmental Sciences, the Chinese Academy of Sciences. Available online: http://www.resdc.cn (accessed on 12 December 2017).
- Liu, J.; Liu, M.; Tian, H.; Zhuang, D.; Zhang, Z.; Zhang, W.; Tang, X.; Deng, X. Spatial and temporal patterns of China’s cropland during 1990–2000: An analysis based on landsat TM data. Remote Sens. Environ. 2005, 98, 442–456. [Google Scholar] [CrossRef]
- Liu, J. Study on national resources & environment survey and dynamic monitoring using remote sensing. J. Remote Sens. 2005, 98, 442–456. [Google Scholar]
- Liu, J.; Liu, M.; Zhuang, D.; Zhang, Z.; Deng, X. Study on spatial pattern of land-use change in China during 1995–2000. Sci. China Ser. D 2003, 46, 373–384. [Google Scholar]
- Dee, D.P.; Uppala, S.M.; Simmons, A.J.; Berrisford, P.; Poli, P.; Kobayashi, S.; Andrae, U.; Balmaseda, M.A.; Balsamo, G.; Bauer, P. The ERA-interim reanalysis: Configuration and performance of the data assimilation system. Q. J. R. Meteorol. Soc. 2011, 137, 553–597. [Google Scholar] [CrossRef]
- The European Centre for Medium-Range Weather Forecasts. Available online: http://apps.ecmwf.int/datasets/data/interim-full-daily/levtype=sfc/ (accessed on 11 December 2017).
- The China Meteorological Administration. Available online: http://data.cma.cn/data/cdcdetail/dataCode/SURF_CLI_CHN_MUL_DAY.html (accessed on 1 December 2017).
- Jin, J.; Miller, N.L.; Schlegel, N. Sensitivity study of four land surface schemes in the WRF model. Adv. Meteorol. 2010, 2010, 185–194. [Google Scholar] [CrossRef]
- Jianjun, H.E.; Ye, Y.U.; Na, L.; Zhao, S.; Chen, J. Impact of land surface information on WRF’S performance in complex terrain area. Chin. J. Atmos. Sci. 2014, 38, 484–498. [Google Scholar]
- Zhang, B.H.; Liu, S.H.; Liu, H.P.; Ma, Y.J. The effect of MYJ and YSU schemes on the simulation of boundary layer meteorological factors of WRF. Chin. J. Geophys. Chin. Ed. 2012, 55, 2239–2248. [Google Scholar]
- Ge, Q.; Zheng, J.; Zhang, X.; He, F. Simulated effects of cropland expansion on summer climate in eastern china in the last three centuries. Adv. Meteorol. 2013, 65, 93–100. [Google Scholar] [CrossRef]
- Hong, S.Y.; Lim, J.O.J. The WRF single-moment 6-class microphysics scheme (WSM6). Asia-Pac. J. Atmos. Sci. 2006, 42, 129–151. [Google Scholar]
- Mlawer, E.J.; Taubman, S.J.; Brown, P.D.; Iacono, M.J.; Clough, S.A. Radiative transfer for inhomogeneous atmospheres: RRTM, a validated correlated-k model for the longwave. J. Geophys. Res. Atmos. 1997, 102, 16663–16682. [Google Scholar] [CrossRef]
- Dudhia, J. Numerical study of convection observed during the winter monsoon experiment using a mesoscale two-dimensional model. J. Atmos. Sci. 1989, 46, 3077–3107. [Google Scholar] [CrossRef]
- Fairall, C.W.; Bradley, E.F.; Hare, J.E.; Grachev, A.A.; Edson, J.B. Bulk parameterization of air sea fluxes: Updates and verification for the coare algorithm. J. Clim. 2003, 16, 571–591. [Google Scholar] [CrossRef]
- Chen, F.; Dudhia, J. Coupling an advanced land surface hydrology model with the penn state NCAR MM5 modeling system. Part I: Model implementation and sensitivity. Mon. Weather Rev. 2001, 129, 587–604. [Google Scholar] [CrossRef]
- Hong, S.Y.; Noh, Y.; Dudhia, J. A new vertical diffusion package with an explicit treatment of entrainment processes. Mon. Weather Rev. 2006, 134, 2318. [Google Scholar] [CrossRef]
- Kain, J.S. The kain fritsch convective parameterization: An update. J. Appl. Meteorol. 2004, 43, 170–181. [Google Scholar] [CrossRef]
- Cui, Y.P.; Liu, J.Y.; Zhang, X.Z.; Qin, Y.C.; Dong, J.W. Modeling urban sprawl effects on regional warming in Beijing-Tianjing-Tangshan urban agglomeration. Acta Ecol. Sin. 2015, 35, 993–1003. [Google Scholar]
- Fei, H.U.; Peng, Z. A study of the influence of urbanization of Beijing on the boundary wind structure. Chin. J. Geophys. 2006, 49, 1467–1474. [Google Scholar]
- Bornstein, R.D. Observations of the urban heat island effect in New York city. J. Appl. Meteorol. 1968, 7, 575–582. [Google Scholar] [CrossRef]
- Bian, T.; Ren, G.; Zhang, B.; Zhang, L.; Yue, Y. Urbanization effect on long-term trends of extreme temperature indices at Shijiazhuang station, North China. Theor. Appl. Climatol. 2015, 119, 407–418. [Google Scholar] [CrossRef]
- Guo, X.; Fu, D.; Wang, J. Mesoscale convective precipitation system modified by urbanization in Beijing city. Atmos. Res. 2006, 82, 112–126. [Google Scholar] [CrossRef]
- Li, J.; Chen, J.; Li, H.; Qu, S.; Liao, H.U.; Troops, C. The sensitivity test on potential impacts of the land use variation in Northern China on summer climate of China. Meteorol. Disaster Reduct. Res. 2013, 1, 10–17. [Google Scholar]
- Yang, L.; Tian, F.; Smith, J.A.; Hu, H. Urban signatures in the spatial clustering of summer heavy rainfall events over the Beijing metropolitan region. J. Geophys. Res. Atmos. 2014, 119, 1203–1217. [Google Scholar] [CrossRef]
- Niyogi, D.; Pyle, P.; Lei, M.; Arya, S.P.; Kishtawal, C.M.; Shepherd, M.; Chen, F.; Wolfe, B. Urban modification of thunderstorms: An observational storm climatology and model case study for the indianapolis urban region. J. Appl. Meteorol. Climatol. 2011, 50, 285–286. [Google Scholar] [CrossRef]
- Kaufmann, R.K.; Seto, K.C.; Schneider, A.; Liu, Z.; Zhou, L.; Wang, W. Climate response to rapid urban growth: Evidence of a human-induced precipitation deficit. J. Clim. 2007, 20, 2299–2306. [Google Scholar] [CrossRef]
- Li, Z.; Yan, Z.; Tu, K.; Liu, W.; Wang, Y. Changes in Wind Speed and Wind Speed Extremes in Beijing during 1960–2008 Based on Homogenized Observations. Abstracts of International Workshop on Urban Weather and Climate: Observation and Modeling. Adv. Atmos. Sci. 2011, 28, 408–420. [Google Scholar] [CrossRef]
- Che, H.Z.; Zhang, X.Y.; Yang, Y.; Zhou, Z.J.; Qu, J.J.; Hao, X.J. Haze trends over the capital cities of 31 provinces in China, 1981–2005. Theor. Appl. Climatol. 2009, 97, 235–242. [Google Scholar] [CrossRef]
Figure 1.
Spatial information of the study area. (a) The location of the study area in China and domain 1 (d01), domain 2 (d02) and domain 3 (d03) of the Weather Research and Forecasting (WRF) simulation. More detailed information of the land use and land cover data is in the “Section 2.3.1 Land Use and Land Cover Data”; (b) The topography of the study area.
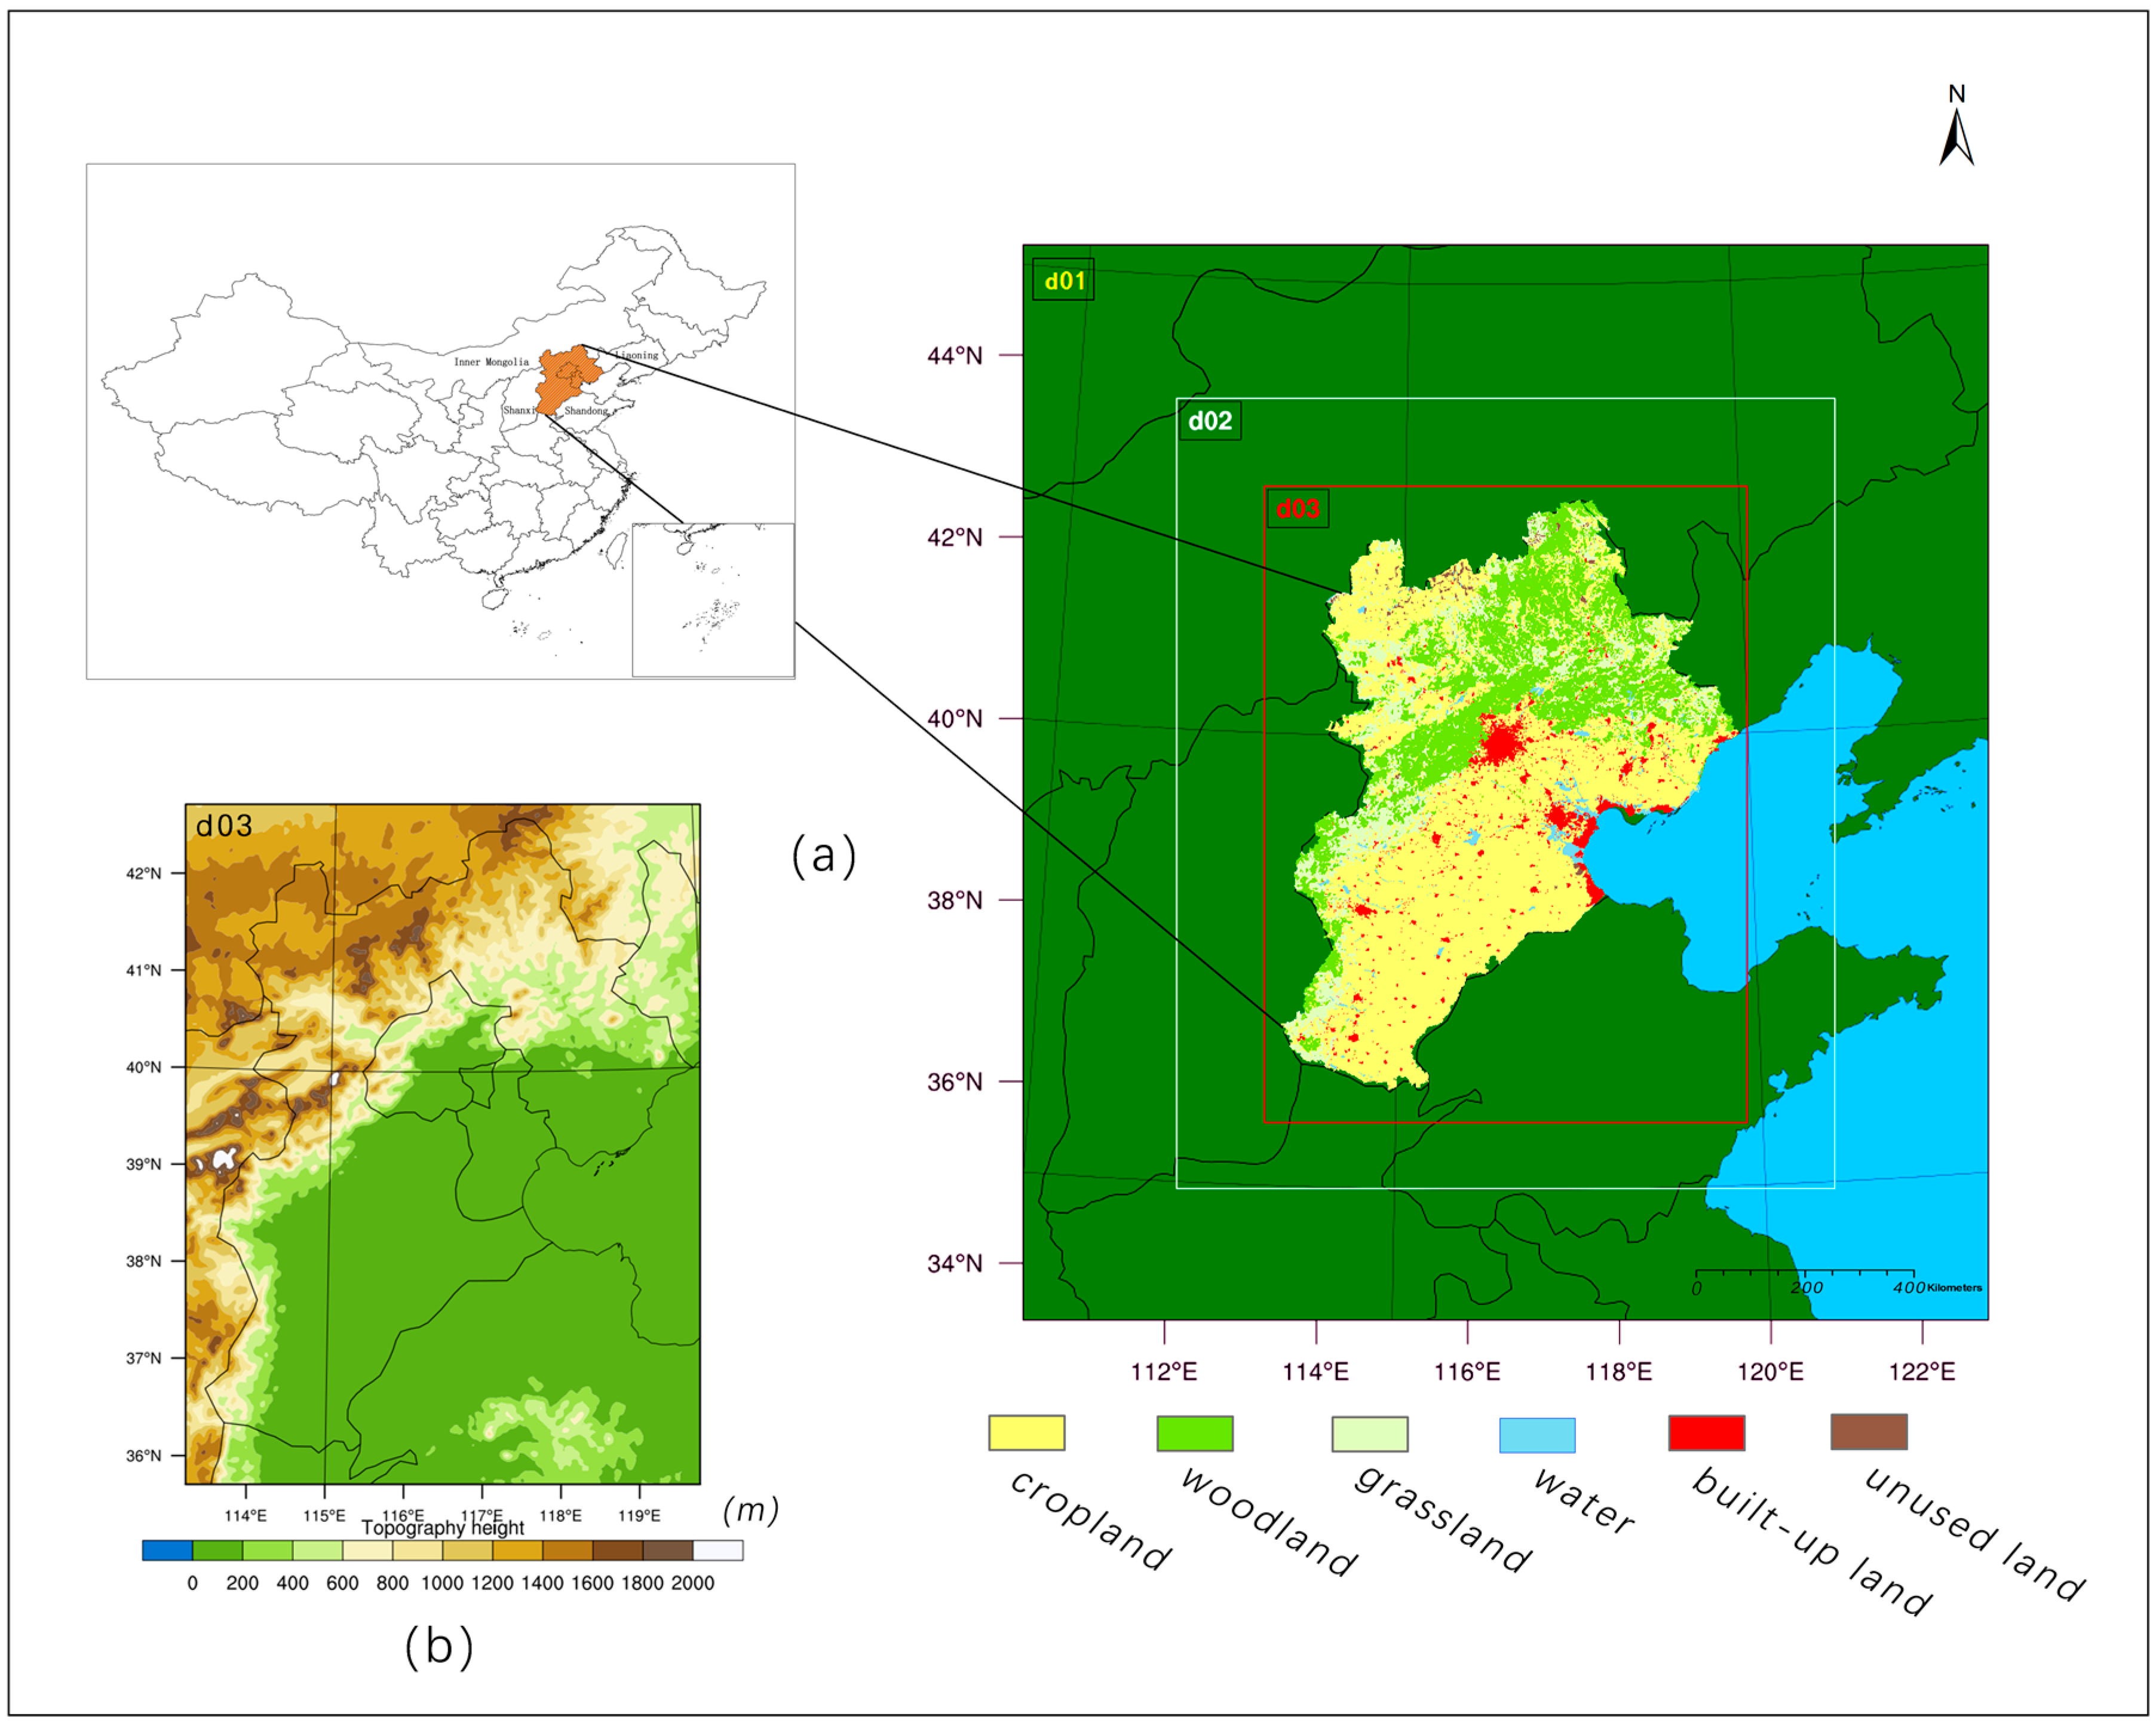
Figure 2.
The WRF model framework used in this paper.
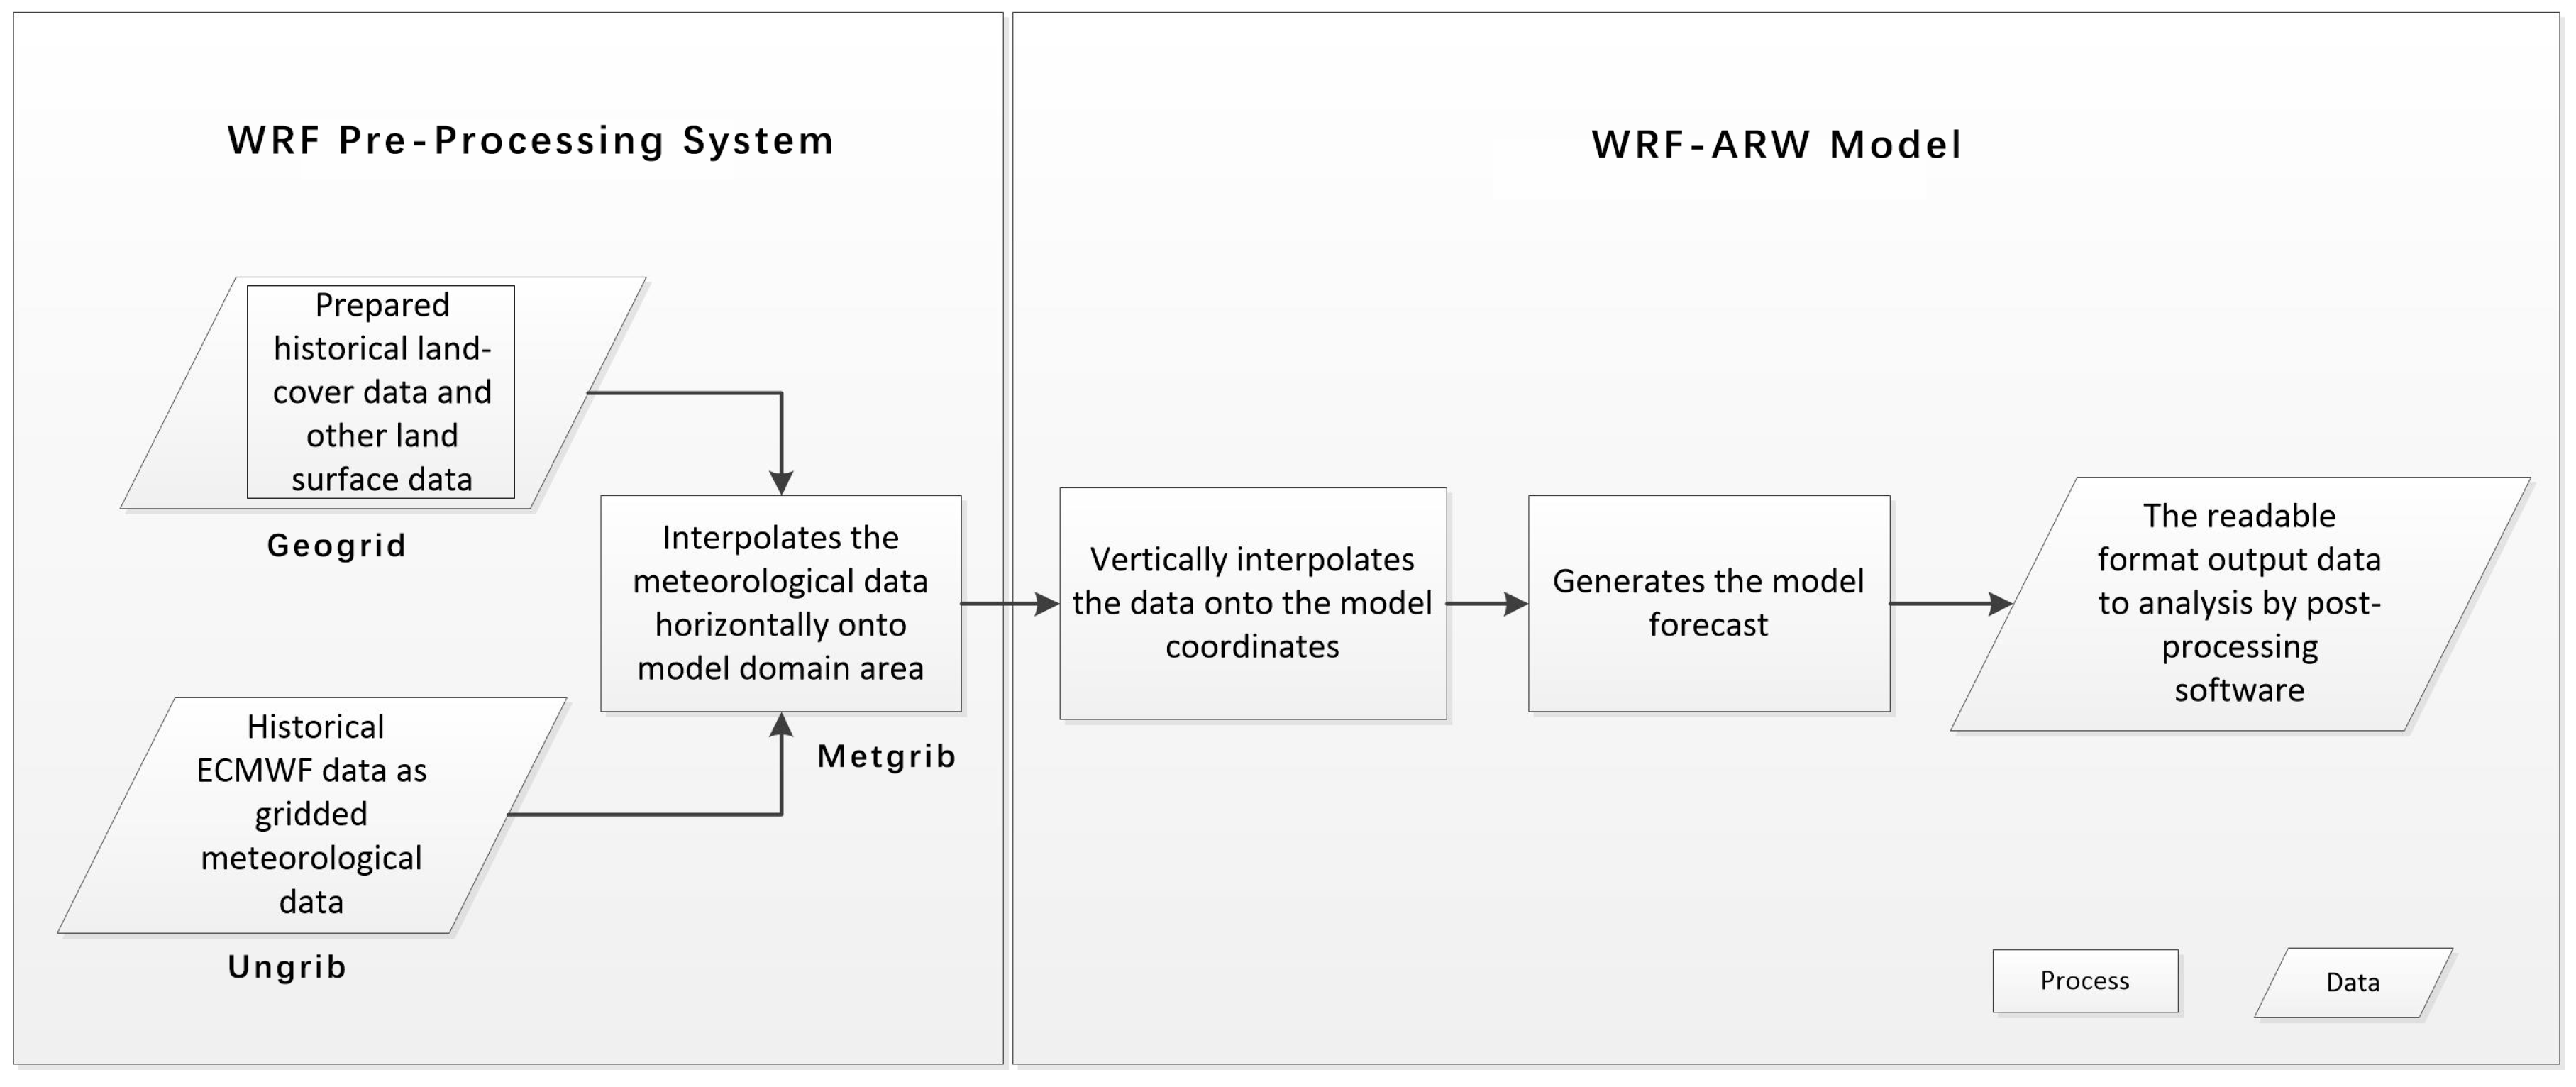
Figure 3.
Major LULC changes from 1990 to 2000 (a) and from 2000 to 2010 (b). Woodland (WDL)->Cropland (CPL) refers to the transformation from woodland to cropland, Water (WTR)->CPL refers to the transformation from water bodies to woodland, Built-up and urban land (UBL)->CPL refers to the transformation from urban and built-up land to cropland, Unused land (UUL)->CPL refers to the transformation from unused-land to cropland, CPL->WDL refers to the transformation from cropland to woodland, Grassland (GSL)->WDL refers to the transformation from grassland to woodland, WDL->GSL refers to the transformation from woodland to grassland, CPL->UBL refers to the transformation from cropland to urban and built-up land, and GSL->UBL refers to the transformation from grassland to urban and built-up land.
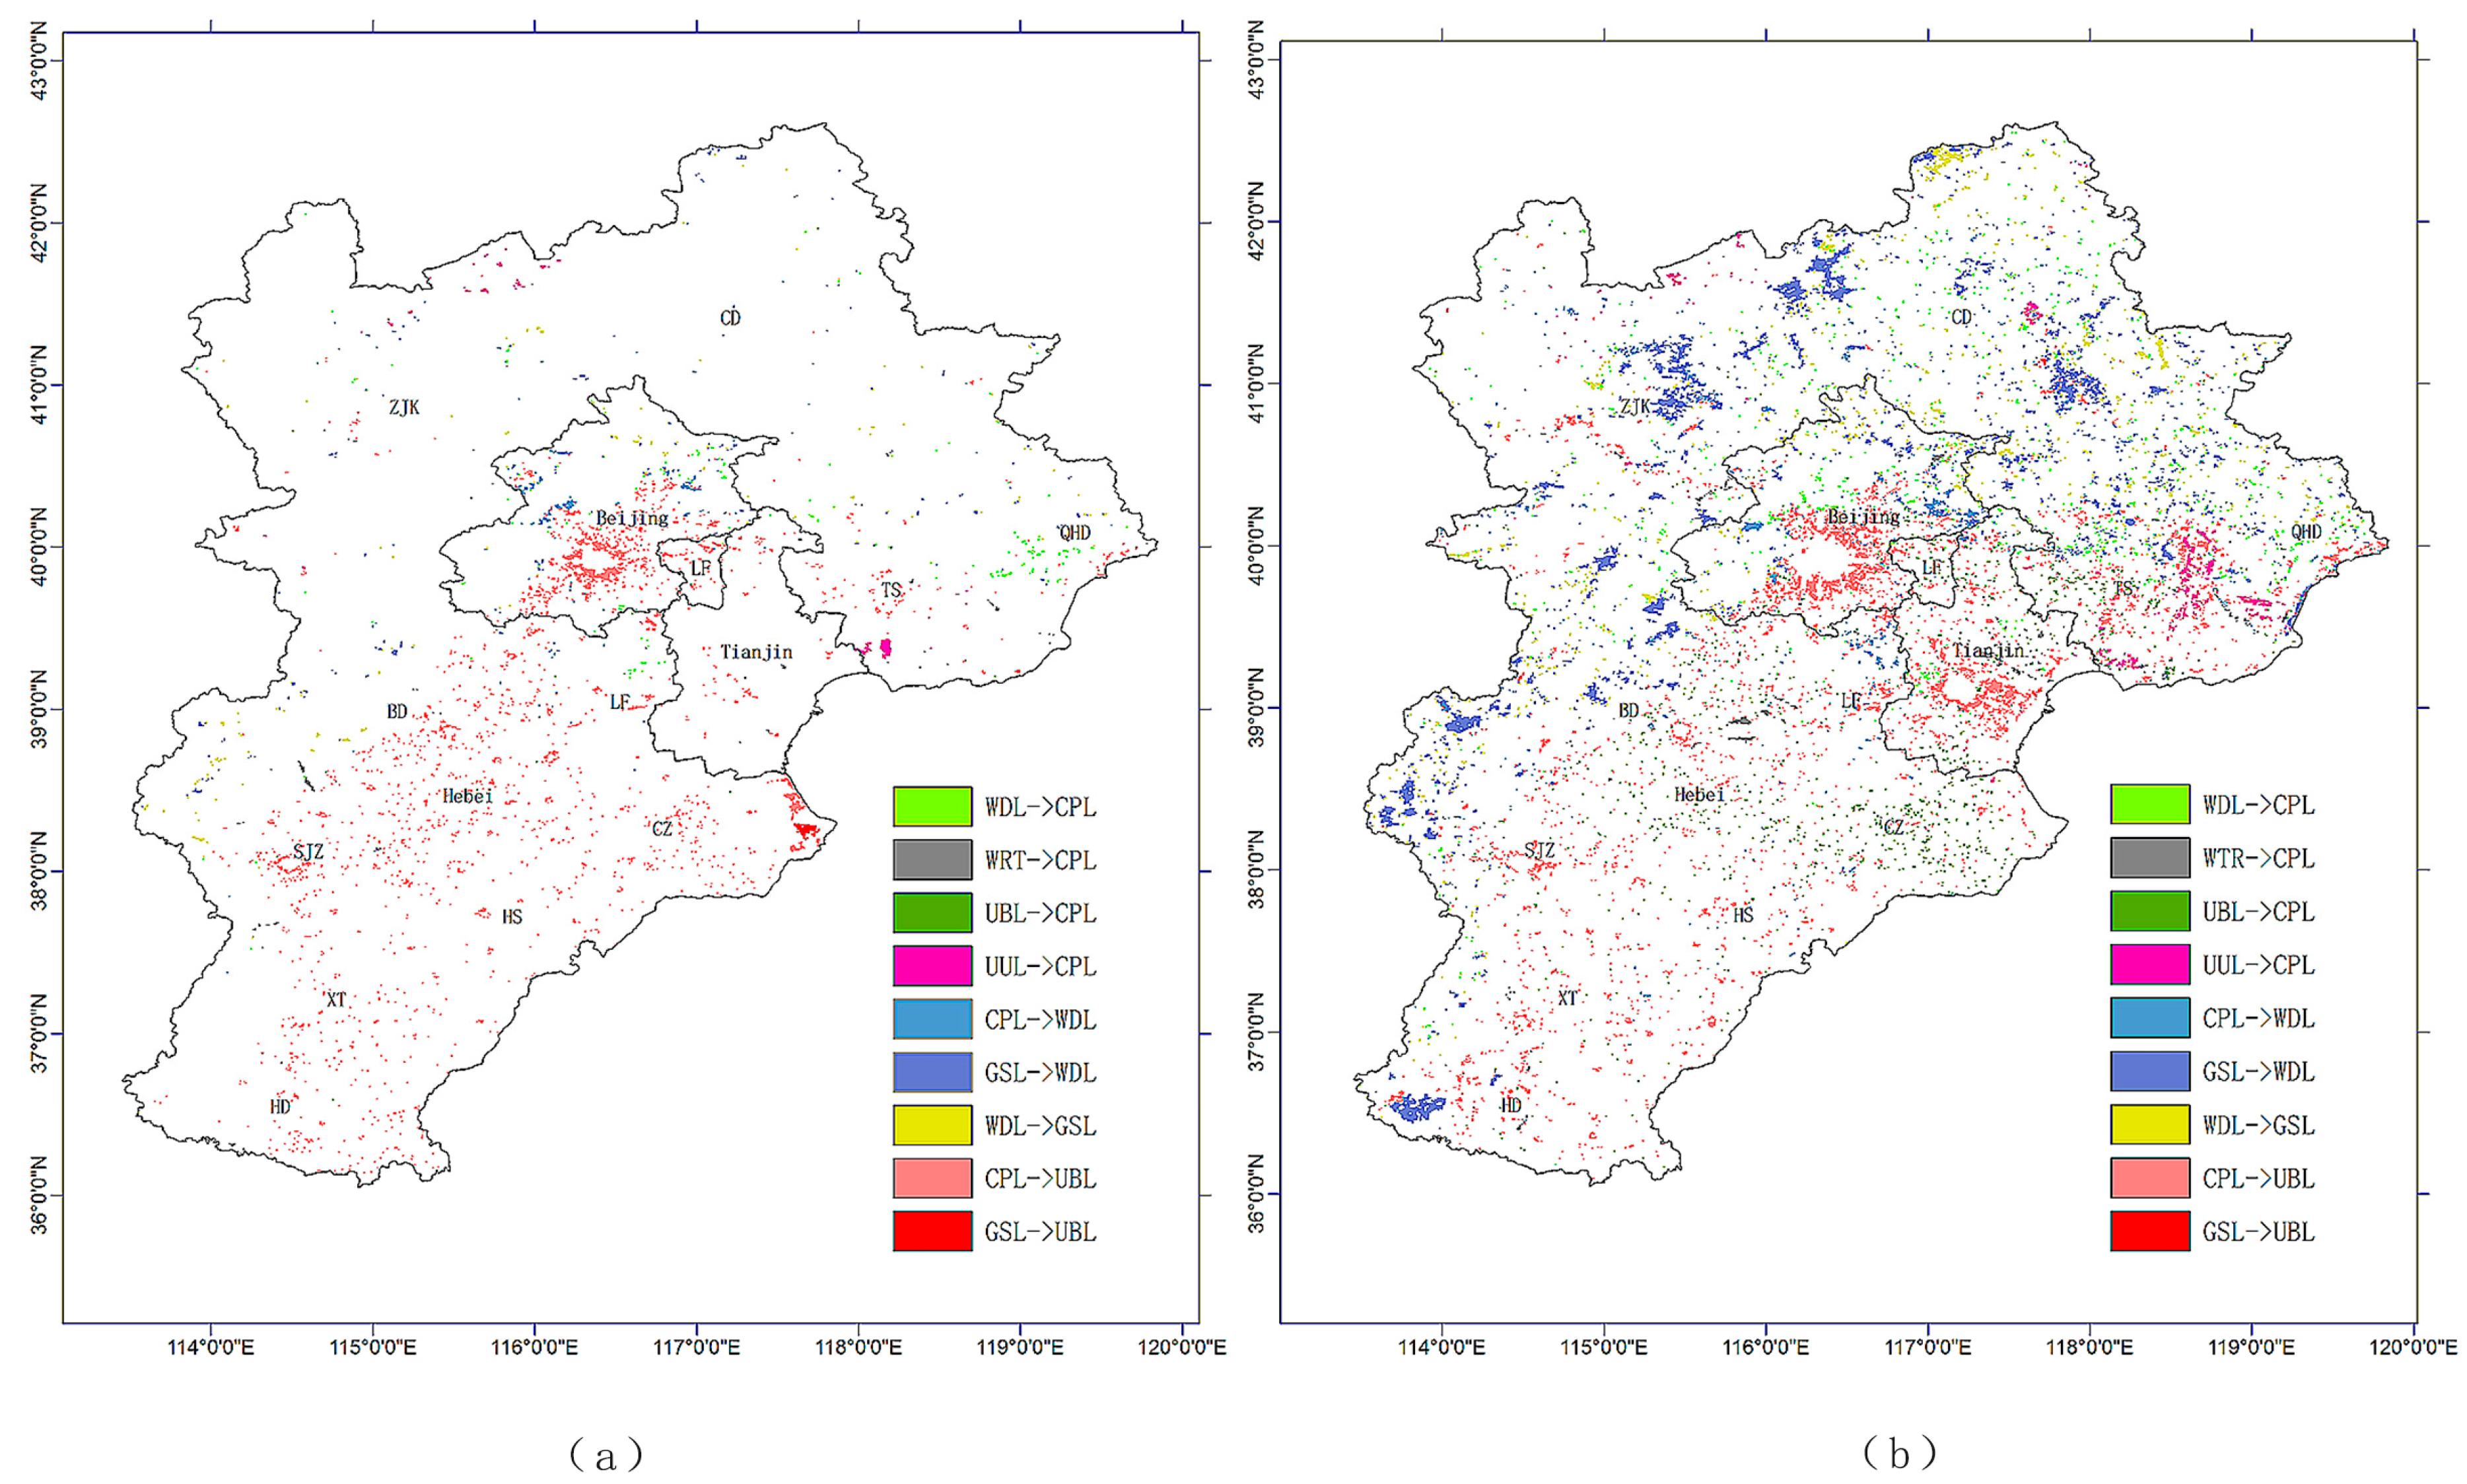
Figure 4.
Comparisons of observed and simulated results in January and July, daily. Comparisons in temperature between January (a) and July (b); (c,d) are the same as (a,b), but for precipitation; (e,f) show wind speed.
Figure 4.
Comparisons of observed and simulated results in January and July, daily. Comparisons in temperature between January (a) and July (b); (c,d) are the same as (a,b), but for precipitation; (e,f) show wind speed.

Figure 5.
Air temperature differences in January before the millennium (BM) and after the millennium (AM), shown in (a,b), respectively; and for July BM and AM, shown in (c,d), respectively.
Figure 5.
Air temperature differences in January before the millennium (BM) and after the millennium (AM), shown in (a,b), respectively; and for July BM and AM, shown in (c,d), respectively.
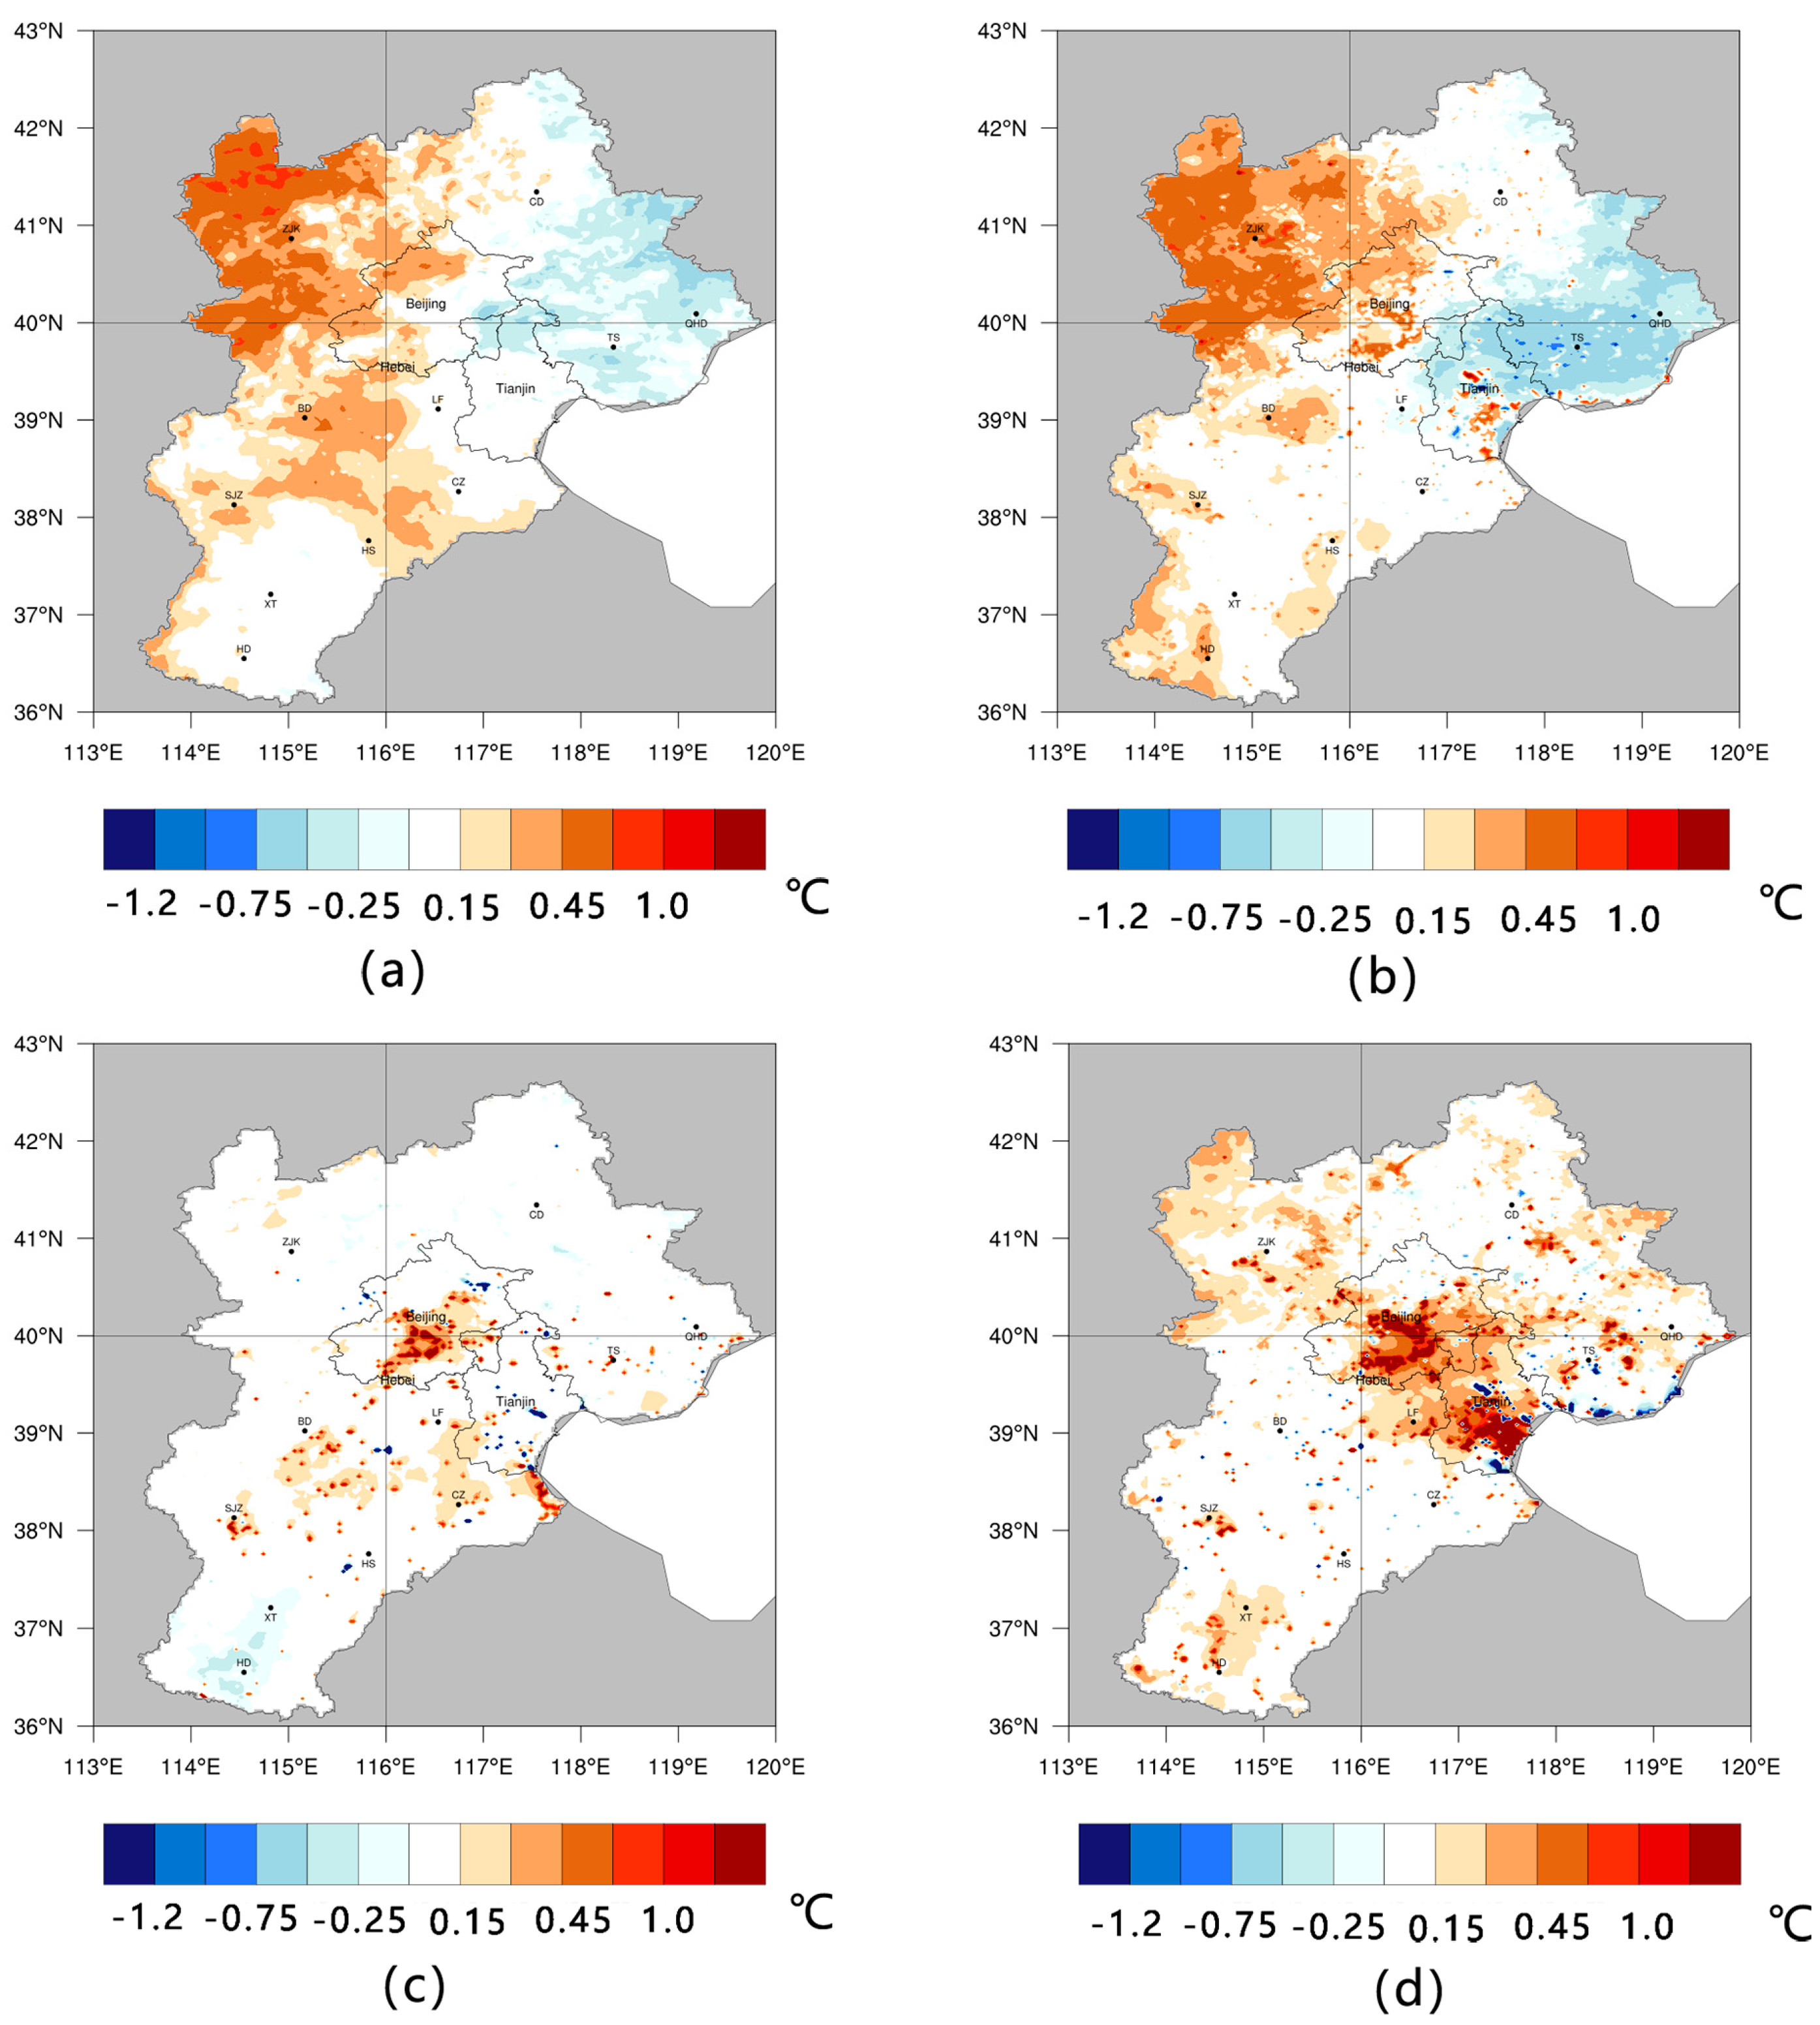
Figure 6.
Change in air temperature due to different LULC changes in the BM period and the AM period, as shown in (a); changes in precipitation are shown in (b); and 10 m-high wind speed changes are shown in (c).
Figure 6.
Change in air temperature due to different LULC changes in the BM period and the AM period, as shown in (a); changes in precipitation are shown in (b); and 10 m-high wind speed changes are shown in (c).

Figure 7.
Precipitation differences for the January BM period and the AM period, shown in (a,b), respectively; and for the July BM period and the AM period, shown in (c,d), respectively.
Figure 7.
Precipitation differences for the January BM period and the AM period, shown in (a,b), respectively; and for the July BM period and the AM period, shown in (c,d), respectively.

Figure 8.
Wind speed differences for the January BM period and the AM period, shown in (a,b), respectively; and for the July BM period and the AM period in (c,d), respectively.
Figure 8.
Wind speed differences for the January BM period and the AM period, shown in (a,b), respectively; and for the July BM period and the AM period in (c,d), respectively.
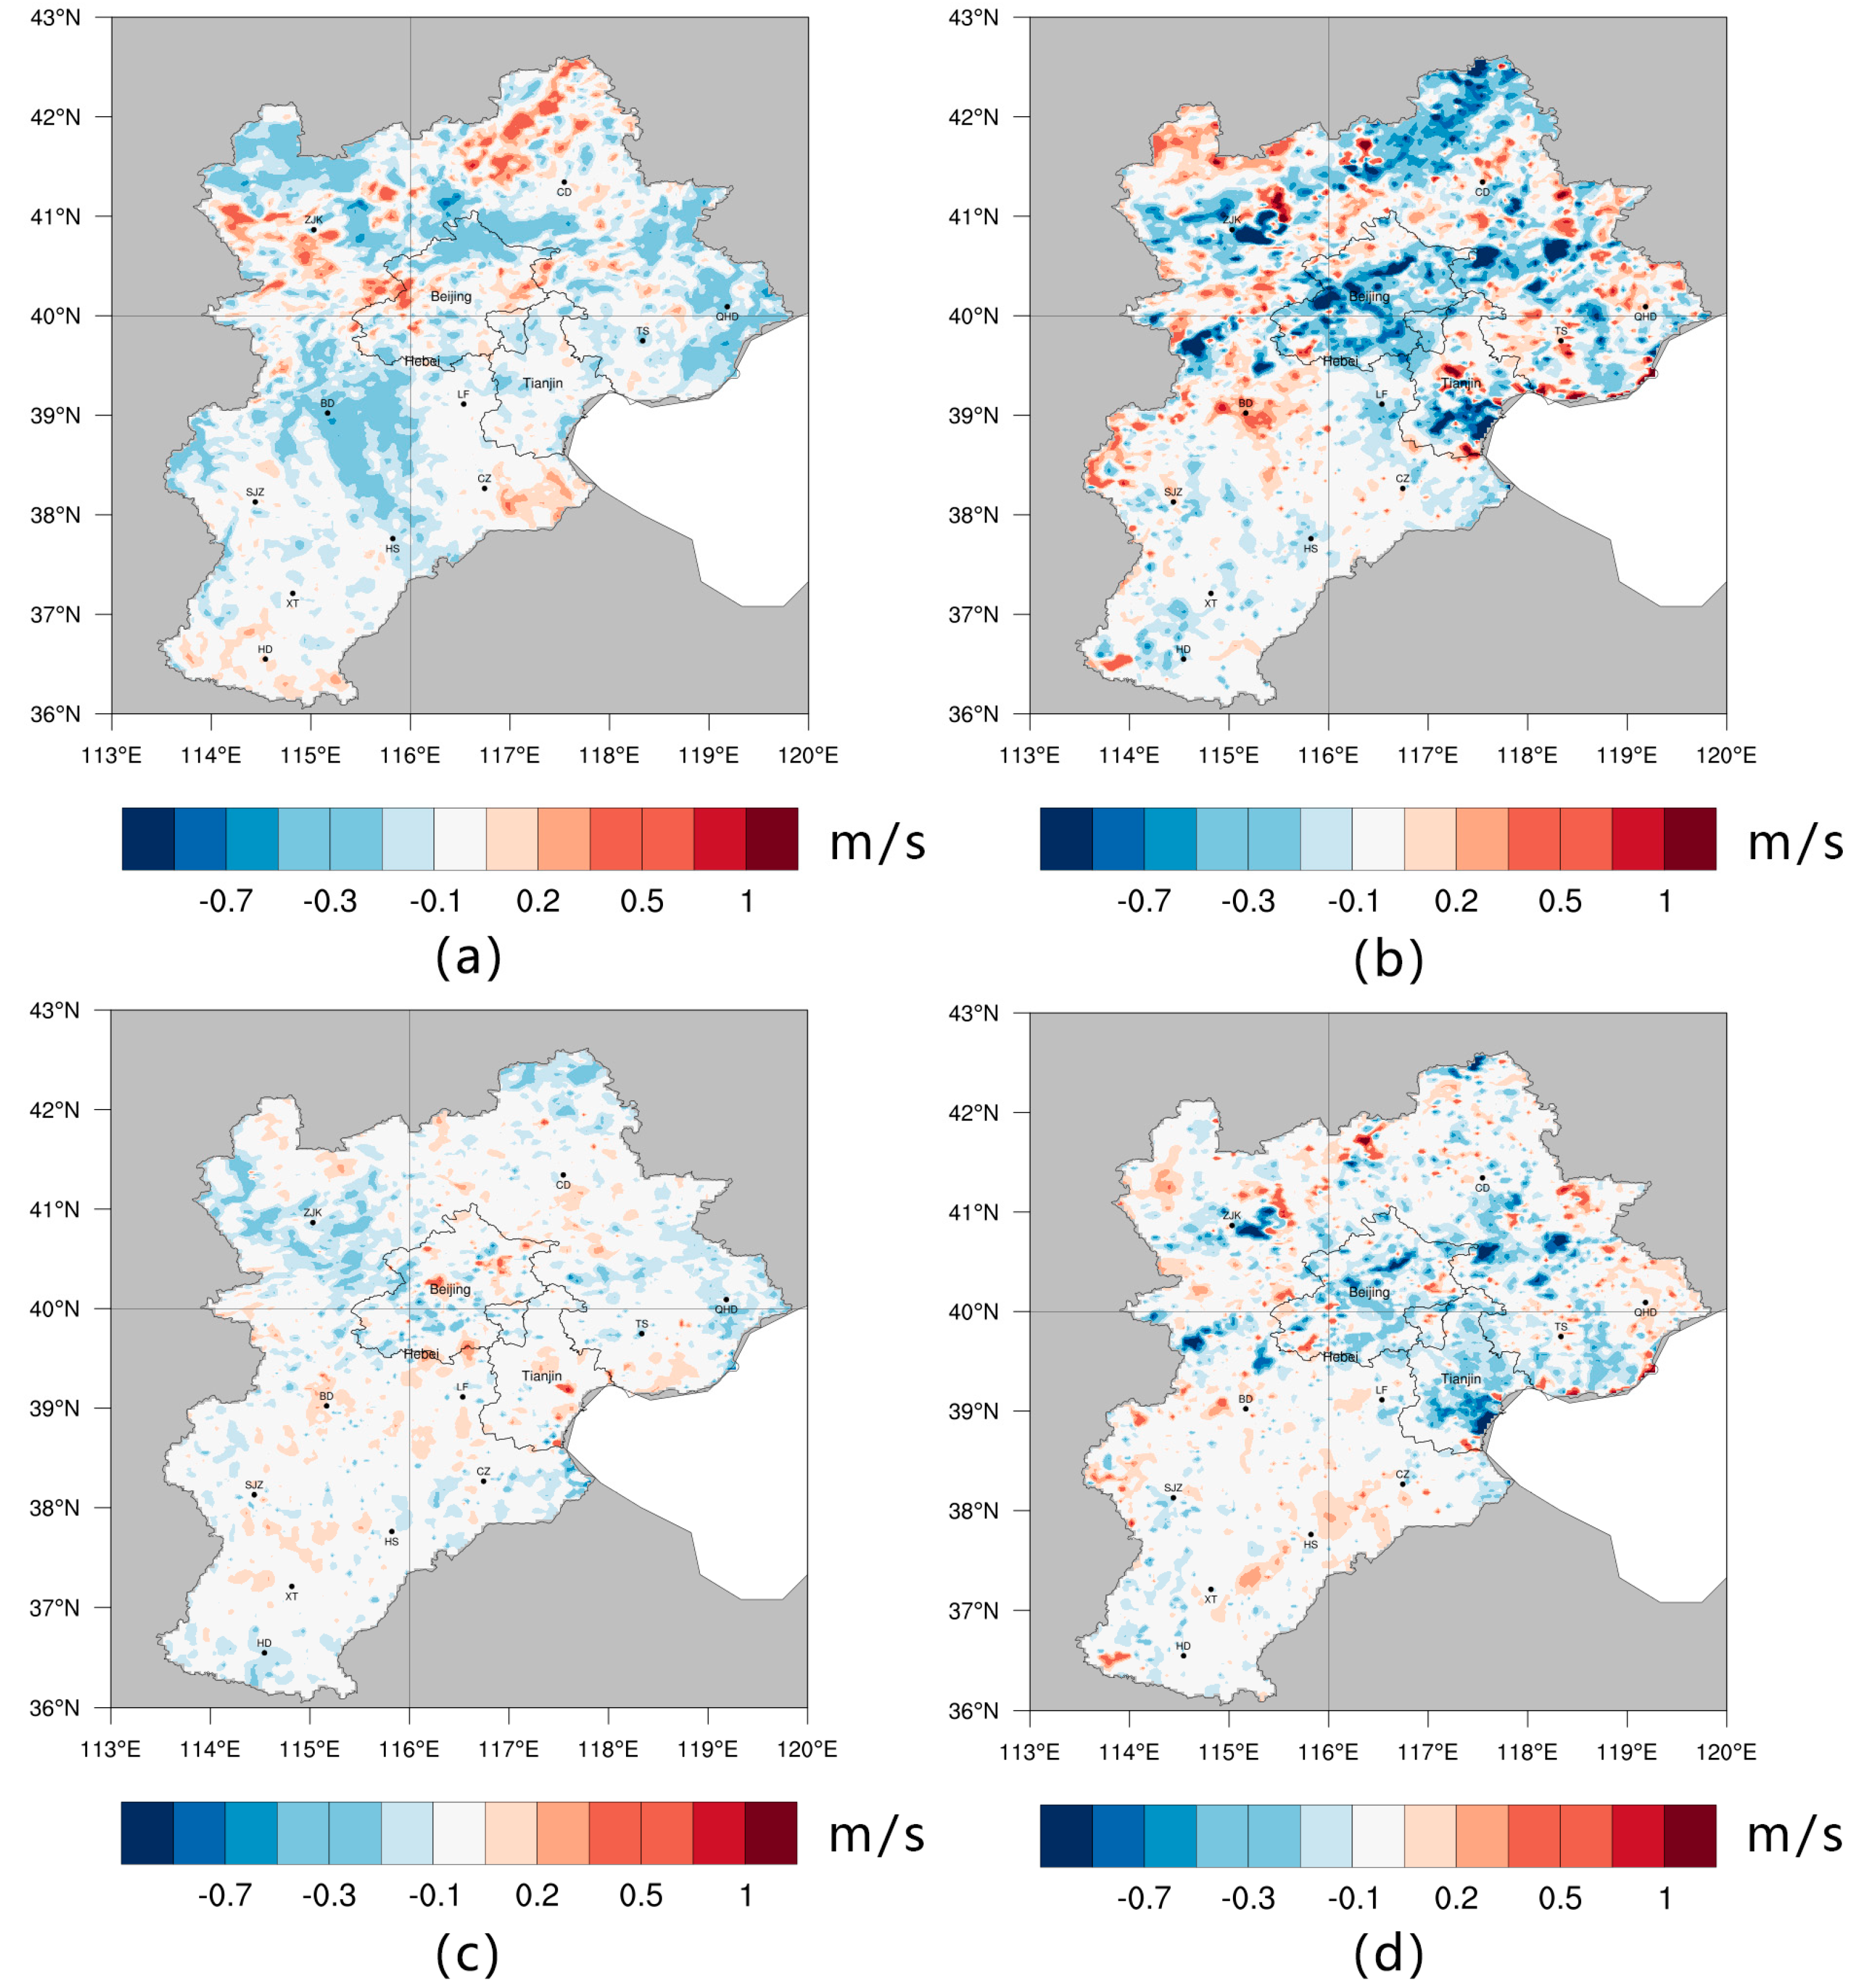
Figure 9.
Monthly average wind direction at 10 m and precipitation for January 1990 are shown in (a); the same for January 2010 are shown in (b); for July 1990 in (c); and for July 2010 in (d).
Figure 9.
Monthly average wind direction at 10 m and precipitation for January 1990 are shown in (a); the same for January 2010 are shown in (b); for July 1990 in (c); and for July 2010 in (d).


Table 1.
Conversion table from the Data Center for Resources and Environmental Sciences at the Chinese Academy of Sciences (RESDC) classification to the U.S. Geology Survey (USGS) classification.
Table 1.
Conversion table from the Data Center for Resources and Environmental Sciences at the Chinese Academy of Sciences (RESDC) classification to the U.S. Geology Survey (USGS) classification.
| USGS | USGS CODE | RESDC | RESDC CODE |
|---|---|---|---|
| Urban and built-up land | 1 | Urban built-up (UBL) | 51 |
| Rural residential land (UBL) | 52 | ||
| Other construction land (UBL) | 53 | ||
| Dry cropland and pasture | 2 | Dryland (CPL) | 12 |
| Irrigated cropland and pasture | 3 | Paddy land (CPL) | 11 |
| Grassland | 7 | Dense grass (GSL) | 31 |
| Moderate grass (GSL) | 32 | ||
| Sparse grass (GSL) | 33 | ||
| Shrubland | 8 | Shrub (WDL) | 22 |
| Mixed grassland/shrubland | 9 | Other woodland (WDL) | 24 |
| Deciduous broadleaf forest | 11 | Forest (WDL) | 21 |
| Deciduous needleleaf forest | 12 | ||
| Evergreen broadleaf forest | 13 | ||
| Evergreen needleleaf forest | 14 | ||
| Mixed forest | 15 | ||
| Water bodies | 16 | Streams and rivers (WRT) | 41 |
| Lakes (WRT) | 42 | ||
| Reservoirs and ponds (WRT) | 43 | ||
| Oceans (WRT) | 99 | ||
| Herbaceous wetland | 17 | Swampland (UUL) | 64 |
| Barren or sparsely vegetated | 19 | Sandy land (UUL) | 61 |
| Gobi (UUL) | 62 | ||
| Salina (UUL) | 63 | ||
| Woods (WDL) | 23 | ||
| Bare soil (UUL) | 65 | ||
| Bare rock (UUL) | 66 | ||
| Bare ground tundra | 23 | Beaches and shores (WRT) | 45 |
| Bottomland (WRT) | 46 | ||
| Other unused land (UUL) | 67 | ||
| Snow or ice | 24 | Permanent ice and snow (WRT) | 44 |
Table 2.
WRF model physics and dynamic options.
| Options | Schemes | Parameter Value |
|---|---|---|
| Microphysics | WSM6 (WRF Single-Moment 6-class) [43] | 6 |
| Longwave radiation | RRTM scheme [44] | 1 |
| Shortwave radiation | Dudhia scheme [45] | 1 |
| Surface-layer option | Revised MM5 Monin-Obukhov scheme [46] | 1 |
| Land-surface option | Noah land surface model [47] | 2 |
| Boundary-layer option | YSU scheme [48] | 1 |
| Cumulus option | Kain-Fritsch scheme [49] | 1 |
Table 3.
Land use and land cover (LULC) transfer matrix from 1990 to 2000 (km2).
| 2000 | ||||||||
|---|---|---|---|---|---|---|---|---|
| CPL | WDL | GSL | WTR | UBL | UUL | Total | ||
| 1990 | CPL | 121,173 | 281 | 202 | 319 | 2501 | 92 | 124,567 |
| WDL | 157 | 45,524 | 159 | 16 | 34 | 2 | 45,893 | |
| GSL | 368 | 221 | 33,726 | 49 | 121 | 7 | 34,491 | |
| WRT | 153 | 17 | 17 | 3354 | 54 | 6 | 3601 | |
| UBL | 123 | 6 | 2 | 17 | 4659 | 2 | 4809 | |
| UUL | 171 | 1 | 9 | 6 | 79 | 1622 | 1888 | |
| Total | 122,144 | 46,049 | 34,115 | 3762 | 7448 | 1731 | 215,249 | |
Table 4.
LULC transfer matrix from 2000 to 2010 (km2).
| 2010 | ||||||||
|---|---|---|---|---|---|---|---|---|
| CPL | WDL | GSL | WTR | UBL | UUL | Total | ||
| 2000 | CPL | 114,269 | 1489 | 1200 | 639 | 4442 | 105 | 122,144 |
| WDL | 854 | 43,690 | 1249 | 31 | 187 | 39 | 46,049 | |
| GSL | 2532 | 4913 | 26,166 | 160 | 222 | 122 | 34,115 | |
| WRT | 622 | 87 | 52 | 2490 | 475 | 35 | 3762 | |
| UBL | 1067 | 41 | 12 | 208 | 6113 | 8 | 7448 | |
| UUL | 604 | 17 | 70 | 54 | 63 | 922 | 1731 | |
| Total | 119,948 | 50,237 | 28,749 | 3582 | 11,501 | 1231 | 215,249 | |
© 2018 by the authors. Licensee MDPI, Basel, Switzerland. This article is an open access article distributed under the terms and conditions of the Creative Commons Attribution (CC BY) license (http://creativecommons.org/licenses/by/4.0/).
Share and Cite
MDPI and ACS Style
Li, J.; Zheng, X.; Zhang, C.; Chen, Y. Impact of Land-Use and Land-Cover Change on Meteorology in the Beijing–Tianjin–Hebei Region from 1990 to 2010. Sustainability 2018, 10, 176. https://doi.org/10.3390/su10010176
AMA Style
Li J, Zheng X, Zhang C, Chen Y. Impact of Land-Use and Land-Cover Change on Meteorology in the Beijing–Tianjin–Hebei Region from 1990 to 2010. Sustainability. 2018; 10(1):176. https://doi.org/10.3390/su10010176
Chicago/Turabian StyleLi, Jiayang, Xinqi Zheng, Chunxiao Zhang, and Youmin Chen. 2018. "Impact of Land-Use and Land-Cover Change on Meteorology in the Beijing–Tianjin–Hebei Region from 1990 to 2010" Sustainability 10, no. 1: 176. https://doi.org/10.3390/su10010176
Note that from the first issue of 2016, this journal uses article numbers instead of page numbers. See further details here.