Article

Estimation of Rural Households’ Willingness to Accept Two PES Programs and Their Service Valuation in the Miyun Reservoir Catchment, China

1
School of Soil and Water Conservation, Beijing Forestry University, Beijing 100083, China
2
Institute of Desertification Studies, Chinese Academy of Forestry, Beijing 100091, China
*
Author to whom correspondence should be addressed.
Sustainability 2018, 10(1), 170; https://doi.org/10.3390/su10010170
Submission received: 15 November 2017 / Revised: 9 January 2018 / Accepted: 10 January 2018 / Published: 11 January 2018

Abstract

:
As the only surface water source for Beijing, the Miyun Reservoir and its catchment (MRC) are a focus for concern about the degradation of ecosystem services (ES) unless appropriate payments for ecosystem services (PES) are in place. This study used the contingent valuation method (CVM) to estimate the costs of two new PES programs, for agriculture and forestry, and to further calculate the economic value of ES in the MRC from the perspective of local rural households’ willingness to accept (WTA). The results of Logit model including WTA and the variables of household and village indicate that the local socio-economic context has complex effects on the WTA of rural households. In particular, the bid amount, location and proportion of off-farm employment would have significant positive effects on the local WTA. In contrast, the insignificance of the PES participation variable suggests that previous PES program experiences may negatively impact subsequent program participation. The mean WTA payments for agriculture and forestry PES programs were estimated as 8531 and 8187 yuan/ha/year, respectively. These results consistently explain the differentiated opportunity costs on both farmland and forestry land. Meanwhile, the differentiated WTA values in Beijing vs. the surrounding Hebei Province follow the interest differences and development gaps between jurisdictions. Finally, the total economic value of ES in the MRC area was estimated at 11.1 billion yuan/year). The rational economic value of ES for the restoration priority areas reaches 515.2 million yuan/year. For the existing budget gap (299 million yuan/year), the study proposed that decision makers increase the water tariff by 0.08 yuan to raise the funds needed. The study also concluded that these results are not only financially and politically feasible but also cost-effective. This study has policy implications for improving the implementation efficiency and providing quantified supports for PES programs in megacity source water area.

1. Introduction

Ecosystem Services (ES) are the benefits people obtain from ecosystems [1,2,3]. Ecosystem values are not only the monetary values of ES provided, but the marginal cost of services production by providers [4]. As such, ES valuation refers to the process that measures the value of ecosystem services in monetary units [5]. The ES valuation would be undoubtedly an important foundation and tool for the decision-making of ecosystem management [5,6,7,8,9]. Thus, to make effective tradeoffs between different management strategies, the decision makers first need to value ES to understand their economic effects [9,10].
Traditionally, the valuation of a good or service mainly relied on its market price or production cost. However, in most cases, that information cannot be estimated or obtained accurately, as there are no well-functioning markets and clearly known production costs for ES. As such, those conventional market approaches, including change in productivity approach and cost-based approaches, are not applicable to the ES valuation, especially for aspects of passive use and non-use value [3,11]. Therefore, the ES valuation is particularly challenging and controversial and different methodologies and concepts are needed [1,3,12]. A number of non-market valuation methods, including Revealed Preference (RP) and State Preference (SP) methods, have been developed [9,13]. Studies using these non-market valuation methods have assessed global and regional ES and their contribution to human well-being [1,7,14,15,16,17]. Compared to the RP methods (e.g., production-oriented valuation, replace cost method, hedonic prices method), the SP methods use hypothetical scenarios involving ES to elicit individuals’ responses to ES improvements and observe their behavior of interest [9,18]. Based on the estimated average values per unit area, the total ES values can be further calculated. Thus, the SP methods are particularly effective, when there is no explicit criterion or reference to measure the passive use and non-use value of ES [3].
One of SP methods, Contingent Valuation Method (CVM) uses a questionnaire-interview to create a realistic but hypothetical market or referendum in order to simulate respondents’ buying or selling behaviors [19]. As such, for the ES valuation, decision makers can readily obtain respondents’ valuations to ecosystem improvements via a referendum method and can then estimate the total ES value. Specifically, these respondents’ valuations related to welfare change represent their Willingness to Pay (WTP) or Willingness to Accept (WTA) compensation for changes in their level of use of a particular good or bundle of goods [20,21]. WTP represents the maximum monetary value that a consumer would like to pay for the ecosystem goods or services received, while WTA is defined here as the minimum payment that a provider would request to supply a given amount of ES [22]. Hence, either WTP or WTA can be employed to value ES from the perspective of the buyer’s or seller’s bidding price. There has been a wide range of application of WTP estimation in ES or environment goods valuation [12,23,24,25,26,27,28], however, there have been few studies to value ES from the perspective of ES provider’s WTA.
Payment for Ecosystem Services (PES) is an effective policy mechanism that can leverage more external resources to sustain and improve ES via the conversion of non-market values of ES into individual economic incentives [29,30]. Over the last decades, PES programs aimed at improving ES and alleviating poverty are becoming important and thus are undergoing rapid development in both developed and developing countries [31,32,33]. China is now a global leader in PES development [34]. Nonetheless, most Chinese PES programs being mainly funded by governments appear to be campaign-style and top-down programs caused by government decision-making mechanisms inherited from central planning policies [35,36]. These programs lack evidence-based scientific baseline survey, rather the payment criteria are decided by government officials without consideration of scientific valuation (e.g., CVM). The accuracy of setting initial payment criteria will result in insufficient program participation, low cost-effectiveness, unsustainable program benefits and other challenges [35,36,37].
As the capital of China and a flourishing international mega-city, Beijing is facing an unparalleled challenge in water resources [38,39,40]. The Miyun Reservoir, Beijing’s only surface water source for domestic water supply, is playing an increasingly crucial role for the urban water supply [41,42]. To protect this water source for Beijing, the Beijing Municipal Government has initiated a number of PES programs, including the Jing-Ji Afforestation Program for Ecological and Water Protection (JAPEWP) (“Jing-Ji” from the Chinese name abbreviations of Beijing and Hebei) and the Paddy Land to Dry Land (PLDL) Program, in the Miyun Reservoir Catchment (MRC) since 2003 [43]. These programs aim to convert the land use system in the MRC area and conserve more water for Beijing city while improving livelihoods for local rural households. However, as noted above, these programs are meeting with the similar challenge with other Chinese PES programs, that is, it is not known how to formulate scientific and cost-effective payment criteria to effectively achieve the program goals. In fact, the participants’ real WTAs to these programs being implemented could be an important reference for the formulation of payment criteria, though they are elusive in most cases.
This study used the technique of CVM to measure the economic values of ES in the MRC area from the perspective of WTA of local rural households to the two PES programs. Based on these ES values, rational payment criteria for these two PES programs can be inferred. The study results provide valuable and unique policy insights into designing rational and effective payment criteria to induce effective willingness to participate, improve program cost-effectiveness as well as achieve sustainable program benefits.

2. Materials and Methods
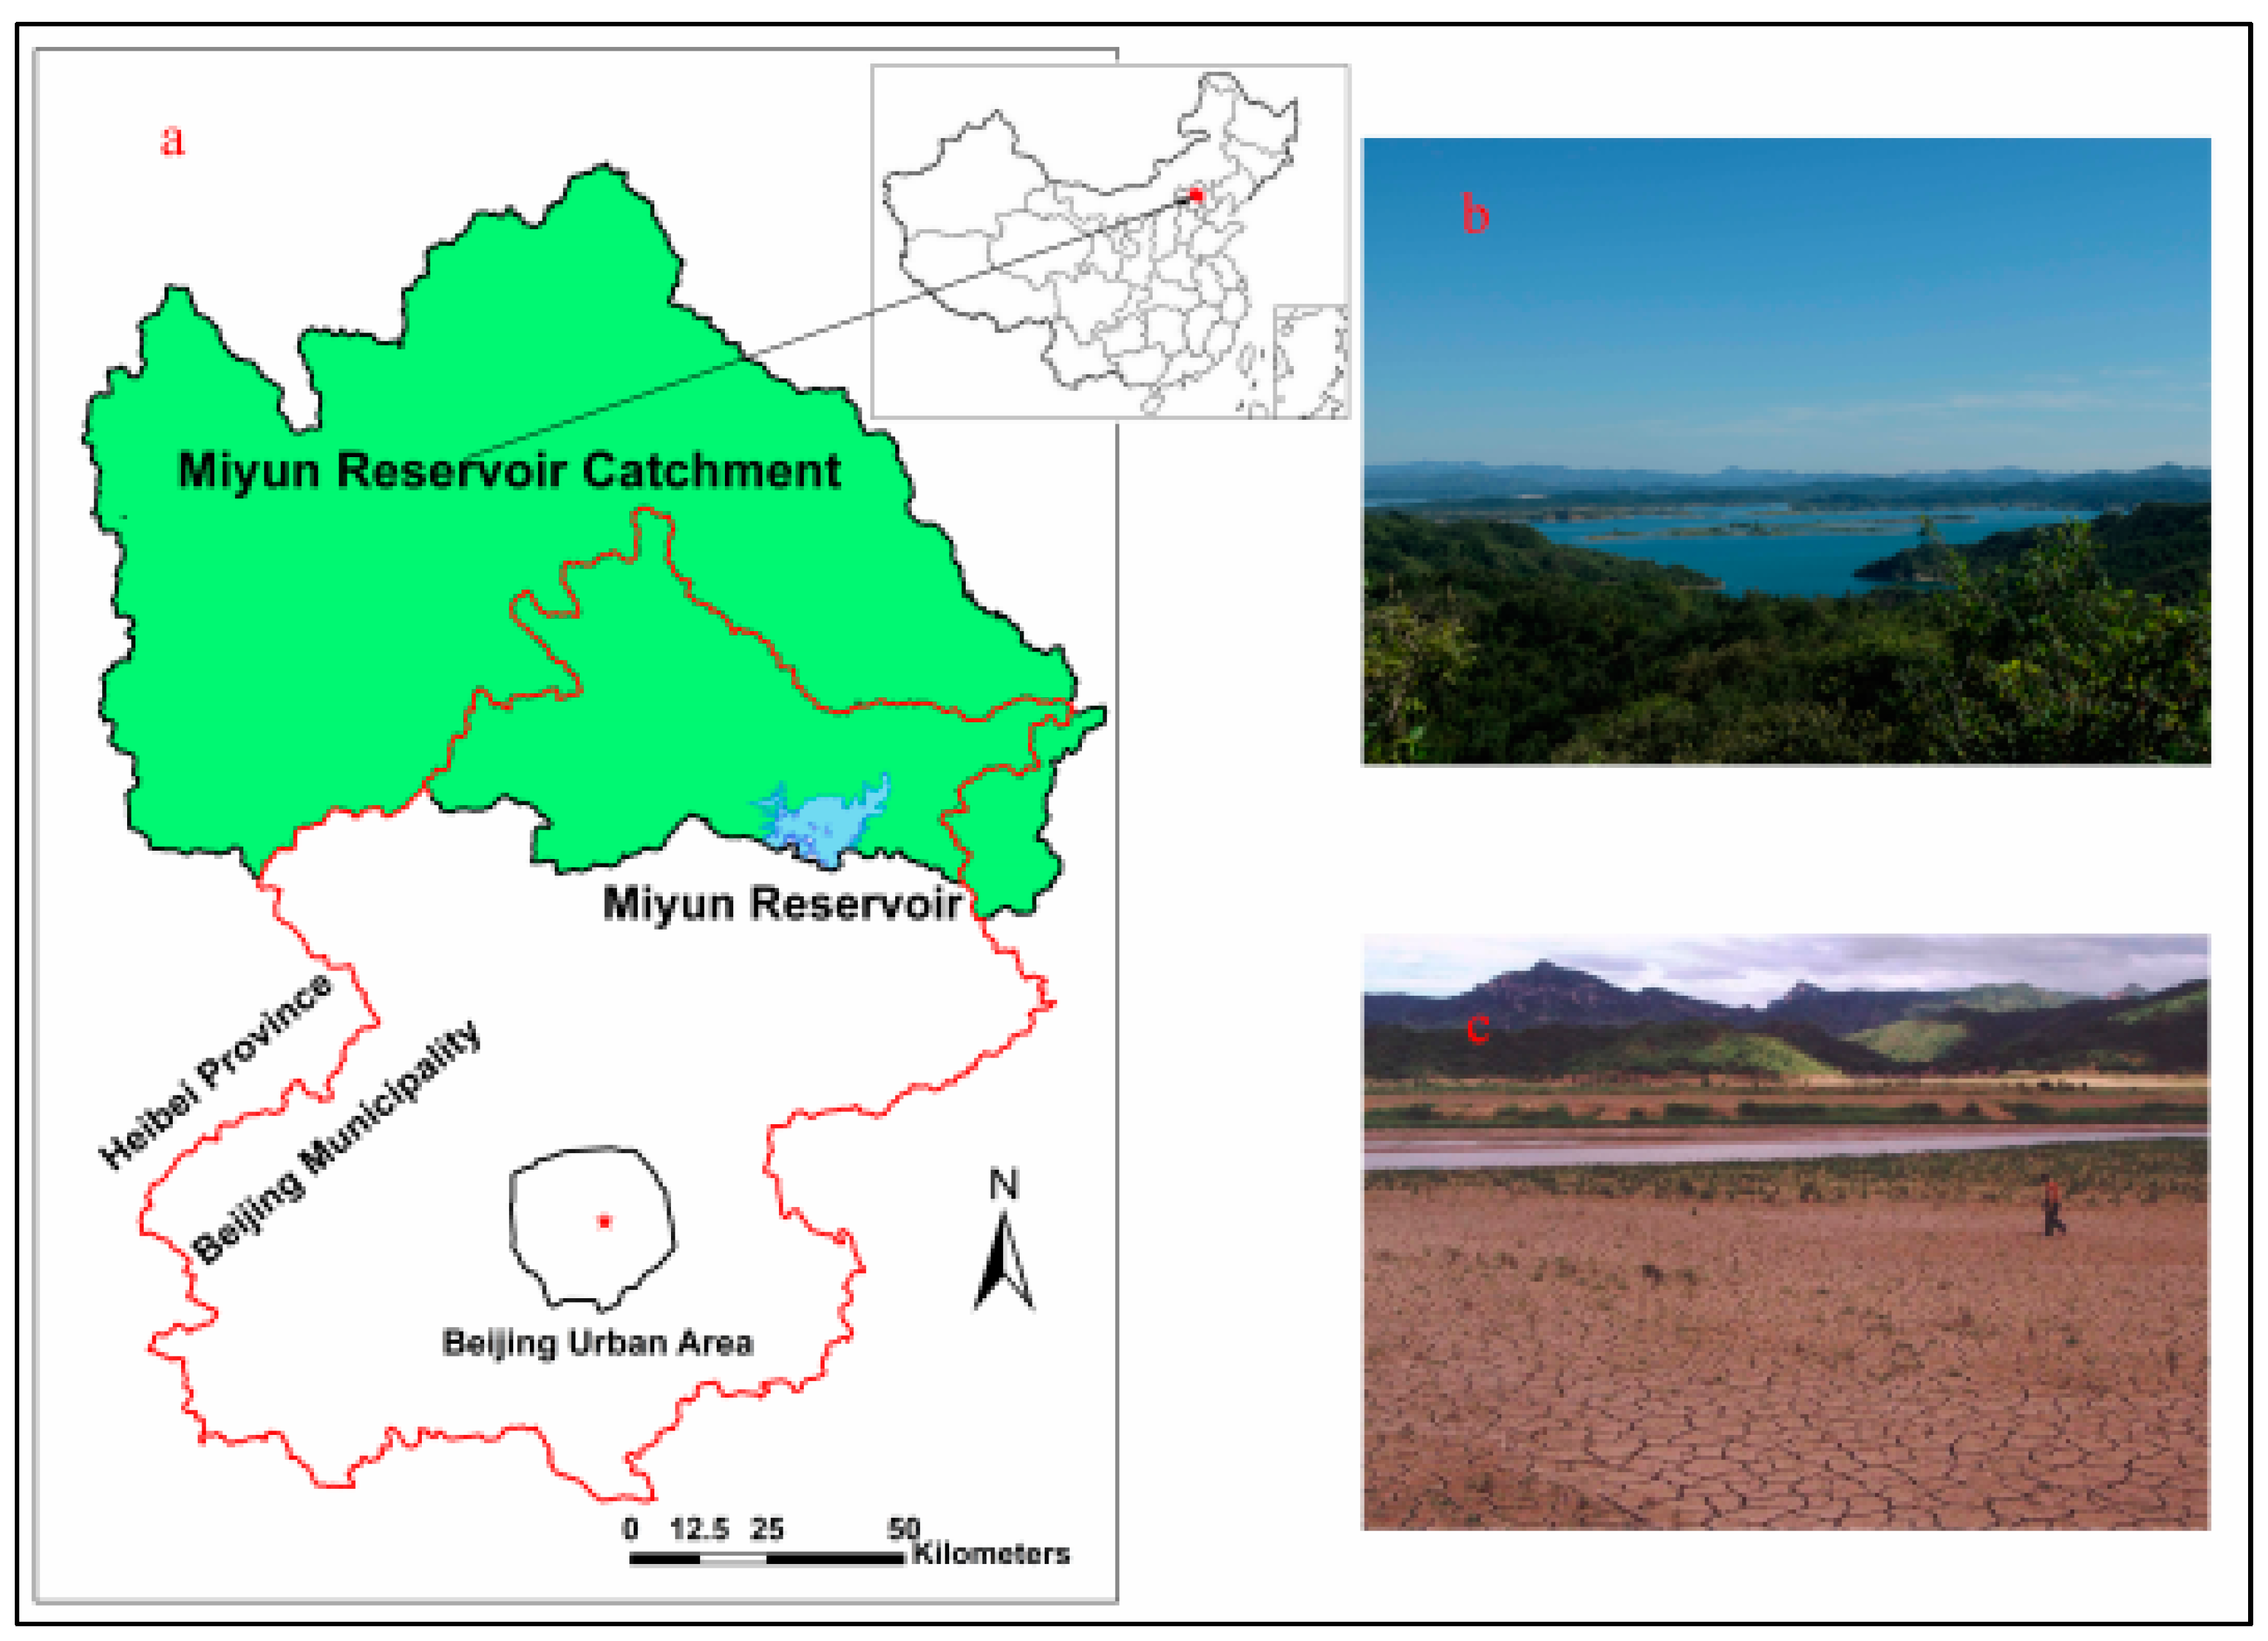
2.1. Study Area

The Miyun Reservoir, built in the 1960s in northeast Beijing, is approximately 100 km away from the city center (Figure 1a). The reservoir originally had a surface area of 188 km2 and a maximum water storage capacity of 4.375 billion m3 and is the largest reservoir in North China. It receives water principally from the Chao and Bai Rivers [44,45] and supplies approximately 800 million m3 per year accounting for 25% of total water use in Beijing [41]. The MRC has an area of 15,788 km2, 80% of which is located in the separately governed province of Hebei (Figure 1a). Not only does this cross-jurisdictional characteristic increase the difficulties in administration, but also it complicates development interests for both upstream and downstream stakeholders [46].
The PLDL program initiated in 2003 is intended to improve water quantity and quality by converting paddy land into less water intensive crop land mainly consisting of maize, although other economic plants such as vegetables or fruit trees may be included. The Beijing Municipal Government paid an average of 6750–8250 yuan/ha/year (1 yuan = 0.15 US$) to compensate profit losses of rural households due to land conversion. By 2010, households upstream of the Miyun Reservoir had converted all 6867 ha of rice fields to dryland crops [46]. In addition the JAPEWP program initiated in 2009 is restoring forest landscapes in key source water areas to sustain and improve ES related to water yield and purification, as moderate forest cover can have positive effects on these [3,47]. A total of 1.1 billion yuan has been invested to build 66,666 ha of water protection forest within the key areas of Miyun and Guanting Reservoir Catchment of Hebei Province [48]. A missing component in these programs is the valuation of the ES provided in the MRC in order to quantify support for the further efforts.

2.2. Study Methods

2.2.1. Choice of Willingness to Accept

Since the ESs in the MRC area are neither privately owned nor traded in a well-governed market, it is impossible to observe the actual market choices or behaviors of users or providers. Also, surrogate market values related to ES (e.g., tourism market) are difficult to estimate due to a similar lack of data. The technique of CVM based on hypothetical market behaviors is thus appropriate.
WTP and WTA, which are often the core of CVM studies, are measures of welfare gains and losses, respectively [19,49,50]. Theoretically, the values of WTP and WTA should not differ greatly [51], however, in practice, large divergences between WTP and WTA can be observed due to factors such as substitutability, income effect and transaction costs) [20,50,52,53]. In most cases, WTP estimates are used, as they are more conservative [3,49]. Nonetheless, a number of empirical studies in a variety of circumstances have found that WTA is more reliable, especially for environment or ecosystem management [52,53]. In particular, an ecosystem or landscape restoration programs are designed to restore degrading ecosystems to prior healthy levels and thereby address perceived welfare losses. Within this context, the choice of a WTP measure to value the losses will lead to an underestimate of ES degradation and unduly encourage those activities with negative ecosystem impacts [53]. There, WTA is a good approach when property owners have the right to provide the ES resource or welfare levels are being reduced, otherwise, WTP could be appropriate [3].
In this study, both PLDL and JAPEWP programs aim to mitigate the ES degradation within the MRC area and can be classified as ecosystem or landscape restoration programs. The rural households of the MRC who are ES providers own right to use the land. Furthermore, the great majority of PES programs in China are classified as government-financed rather than user-financed, in which the ES buyers are not the actual users [31]. Instead, the service buyers are usually the central or provincial government and so the WTP survey to service users (e.g., urban residents) might not have strong policy implications. Therefore, the WTA elicited from the rural households in the MRC should potentially be a feasible choice.

2.2.2. Elicitation Format

Broadly speaking, different contingent valuation elicitation formats, including continuous (e.g., payment card (PC), open-ended (OE)) and discrete (e.g., dichotomous choice (DC), multiple bounded discrete choice (MBDC)) formats, can result in systematic and significant differences [54]. Among them, either the PC or MBDC format, which presents all of possible WTA values to respondents, would produce an unnecessary hypothetical bias due to the fact that people always have an incentive to choose a value that is more than he or she actually accepts [28,55]. With respect to the OE format, respondents should have the ability to estimate services or goods they provided, otherwise they have to leave the question blank or provide inaccurate answers resulting in information bias [56]. In this case, the local rural households with lower educational levels are unable to answer the question accurately. Therefore, in this study, the DC format is used to elicit the WTA of rural households.

2.2.3. Statistical Model

Based on the theory of statistical modeling of discrete CV data, a Logit model could be applied to estimate the probability that the respondents would accept a given monetary value [57,58]. The underlying model is:
Probablity ( Yes ) = 1 { 1 + exp [ A 0 A 1 ( X ) ] } 1
where A0 and A1 are the coefficients to be estimated and X is the WTA monetary value the respondent is asked to accept. In terms of the A1 coefficient, it not only refers to the bid amount the respondent is asked to accept but also includes the respondent’s demographic information, such as age, education, revenue, etc.
As such, according to Hanemann [59], given that WTA is a random variable, the expected value of WTA can be calculated by the following formula.
Mean   WTA = B 0 B 1
where B1 is the coefficient on the bid amount and B0 is the grand constant calculated as the sum of the estimated constant plus the product of the other independent variables times their respective means [12].

2.2.4. Measures of Bias Control

Various specific control measures have to be taken into account to eliminate potential sample estimation bias. As mentioned above, there are likely to be disparities or so-called hypothetical bias between eliciting and real WTA [55]. In order to minimize the bias and to fully simulate the real market, the study team conducted a pre-survey of 30 households in the area and talked with stakeholder-focus groups (e.g., government officials, village head). The questionnaire was then revised based on these findings. In particular, the WTA criteria were reset to reveal the respondent’s true willingness as accurately as possible [19,60]. Further, a lack of understanding on the part of rural households as to what the study intends and the general PES policy in the MRC is likely to result in information bias [60]. To help them improve comprehension, the researcher designed a narrative wording to introduce the study background and goals, and two diagrams illustrating the landscape transformation of before and after programs were inserted into the questionnaire [12].

2.2.5. Likelihood Ratio Test

The Likelihood Ratio (LLR) was used to determine if the valuation behavior across the two jurisdictions was similar [26]. The LLR test compares the coefficients estimated for individual jurisdictions with those from a single maximum likelihood regression estimated by the pooled data (i.e., the total sample). As the equation below shows, the model follows the Chi-square (χ2) distribution.
LLR = 2 [ LLR P ( LLR BJ + LLR HB ) ] ~ χ 2 ( k )
where LLRp is the log likelihood for the pooled data and LLRBJ and LLRHB are the log likelihoods of the Beijing and Hebei samples. K is the degrees of freedom for the χ2 distribution (i.e., the number of coefficient equality restrictions). All the calculations and statistical analysis above were completed with Stata 13.1 software [61].

2.3. Household Survey

Since the levels of economic development and social welfare in Beijing are much higher than in Hebei province [62], the study team decided to sample in both jurisdictions to determine whether there is disparity with respect to the household WTA. The survey was implemented in catchments in Huairou District of Beijing and Fengning County of Hebei, in August 2016. During the survey, the enumerators used an in-person interview approach in 5 and 4 villages in Huairou and Fengning, respectively. When an enumerator led by local village head visited the sample households, he or she would read through the following narrative wording for the respondent.
“As the sole surface water source, the Miyun Reservoir is playing an increasingly crucial role for the Beijing water supply. The MRC is thus extremely important for providing water to the reservoir. The local water resource status, however, is becoming increasingly severe due to the fact that the inflow from the upstream is decreasing yearly. Thus, the Beijing Municipal Government recently has initiated a number of cross-jurisdictional PES programs, such as the JAPEWP and PLDL Program, to restore the ES in the MRC. If these programs are to be pushed forward continually, the status of the Miyun Reservoir is likely to be as Figure 1b. Otherwise, the reservoir might further degrade as Figure 1c.”
“Therefore, in order to safeguard the water security for Beijing city, the Beijing Municipal Government is likely to take a further number of specific measures to protect and restore more MRC area, including: (1) the agriculture PES program, like PLDL program, to adjust planting structure from water-consuming crops (e.g., vegetable, fruit tree) to water-saving crops (e.g., maize) while presenting specific regulations with respect to irrigation, fertilizer and pesticide use supported by strict inspections; (2) the forestry PES program, like Sloping Land Conversion Program (SLCP) [35], is to restore forests on private farmland through rural household-involvement re-afforestation and agro-forestry management activities after adjusting parts or all of on-farm use. Here, we want to make sense your true idea with respect to these two types of PES programs in order to help the government make rational decisions. Please try to answer our questions objectively while considering of your families actual situation.”
The respondent would be asked the following questions.
Do you have interest in becoming involved in these programs?
A. Yes; B. No (if B is chosen, the following questions will be omitted.)
(1)
If an agriculture PES program is planned to be implemented here, the Beijing Municipal Government will pay  yuan/ha/year for you. Would you be willing to participate in the program?
A. Yes; B. No.
(2)
If a forestry PES program is planned to be implemented here, the Beijing Municipal Government will pay  yuan/ha/year for you. Would you be willing to participate in the program?
A. Yes; B. No.
One of 13-yuan amounts (1500; 3000; 4500; 6000; 7500; 9000; 10,500; 11,250; 12,000; 12,750; 13,500; 14,250; 15,000 yuan) was used to randomly fill in  yuan. The 13-Yuan amounts were determined based on the findings of pre-survey and discussion with the focus groups. Afterwards, the household and village’s demographic information (e.g., population, education and revenue) was requested. In the end, a total of 296 households (147 and 149 households in Beijing and Hebei, respectively) were sampled in the study area.

3. Results and Discussion

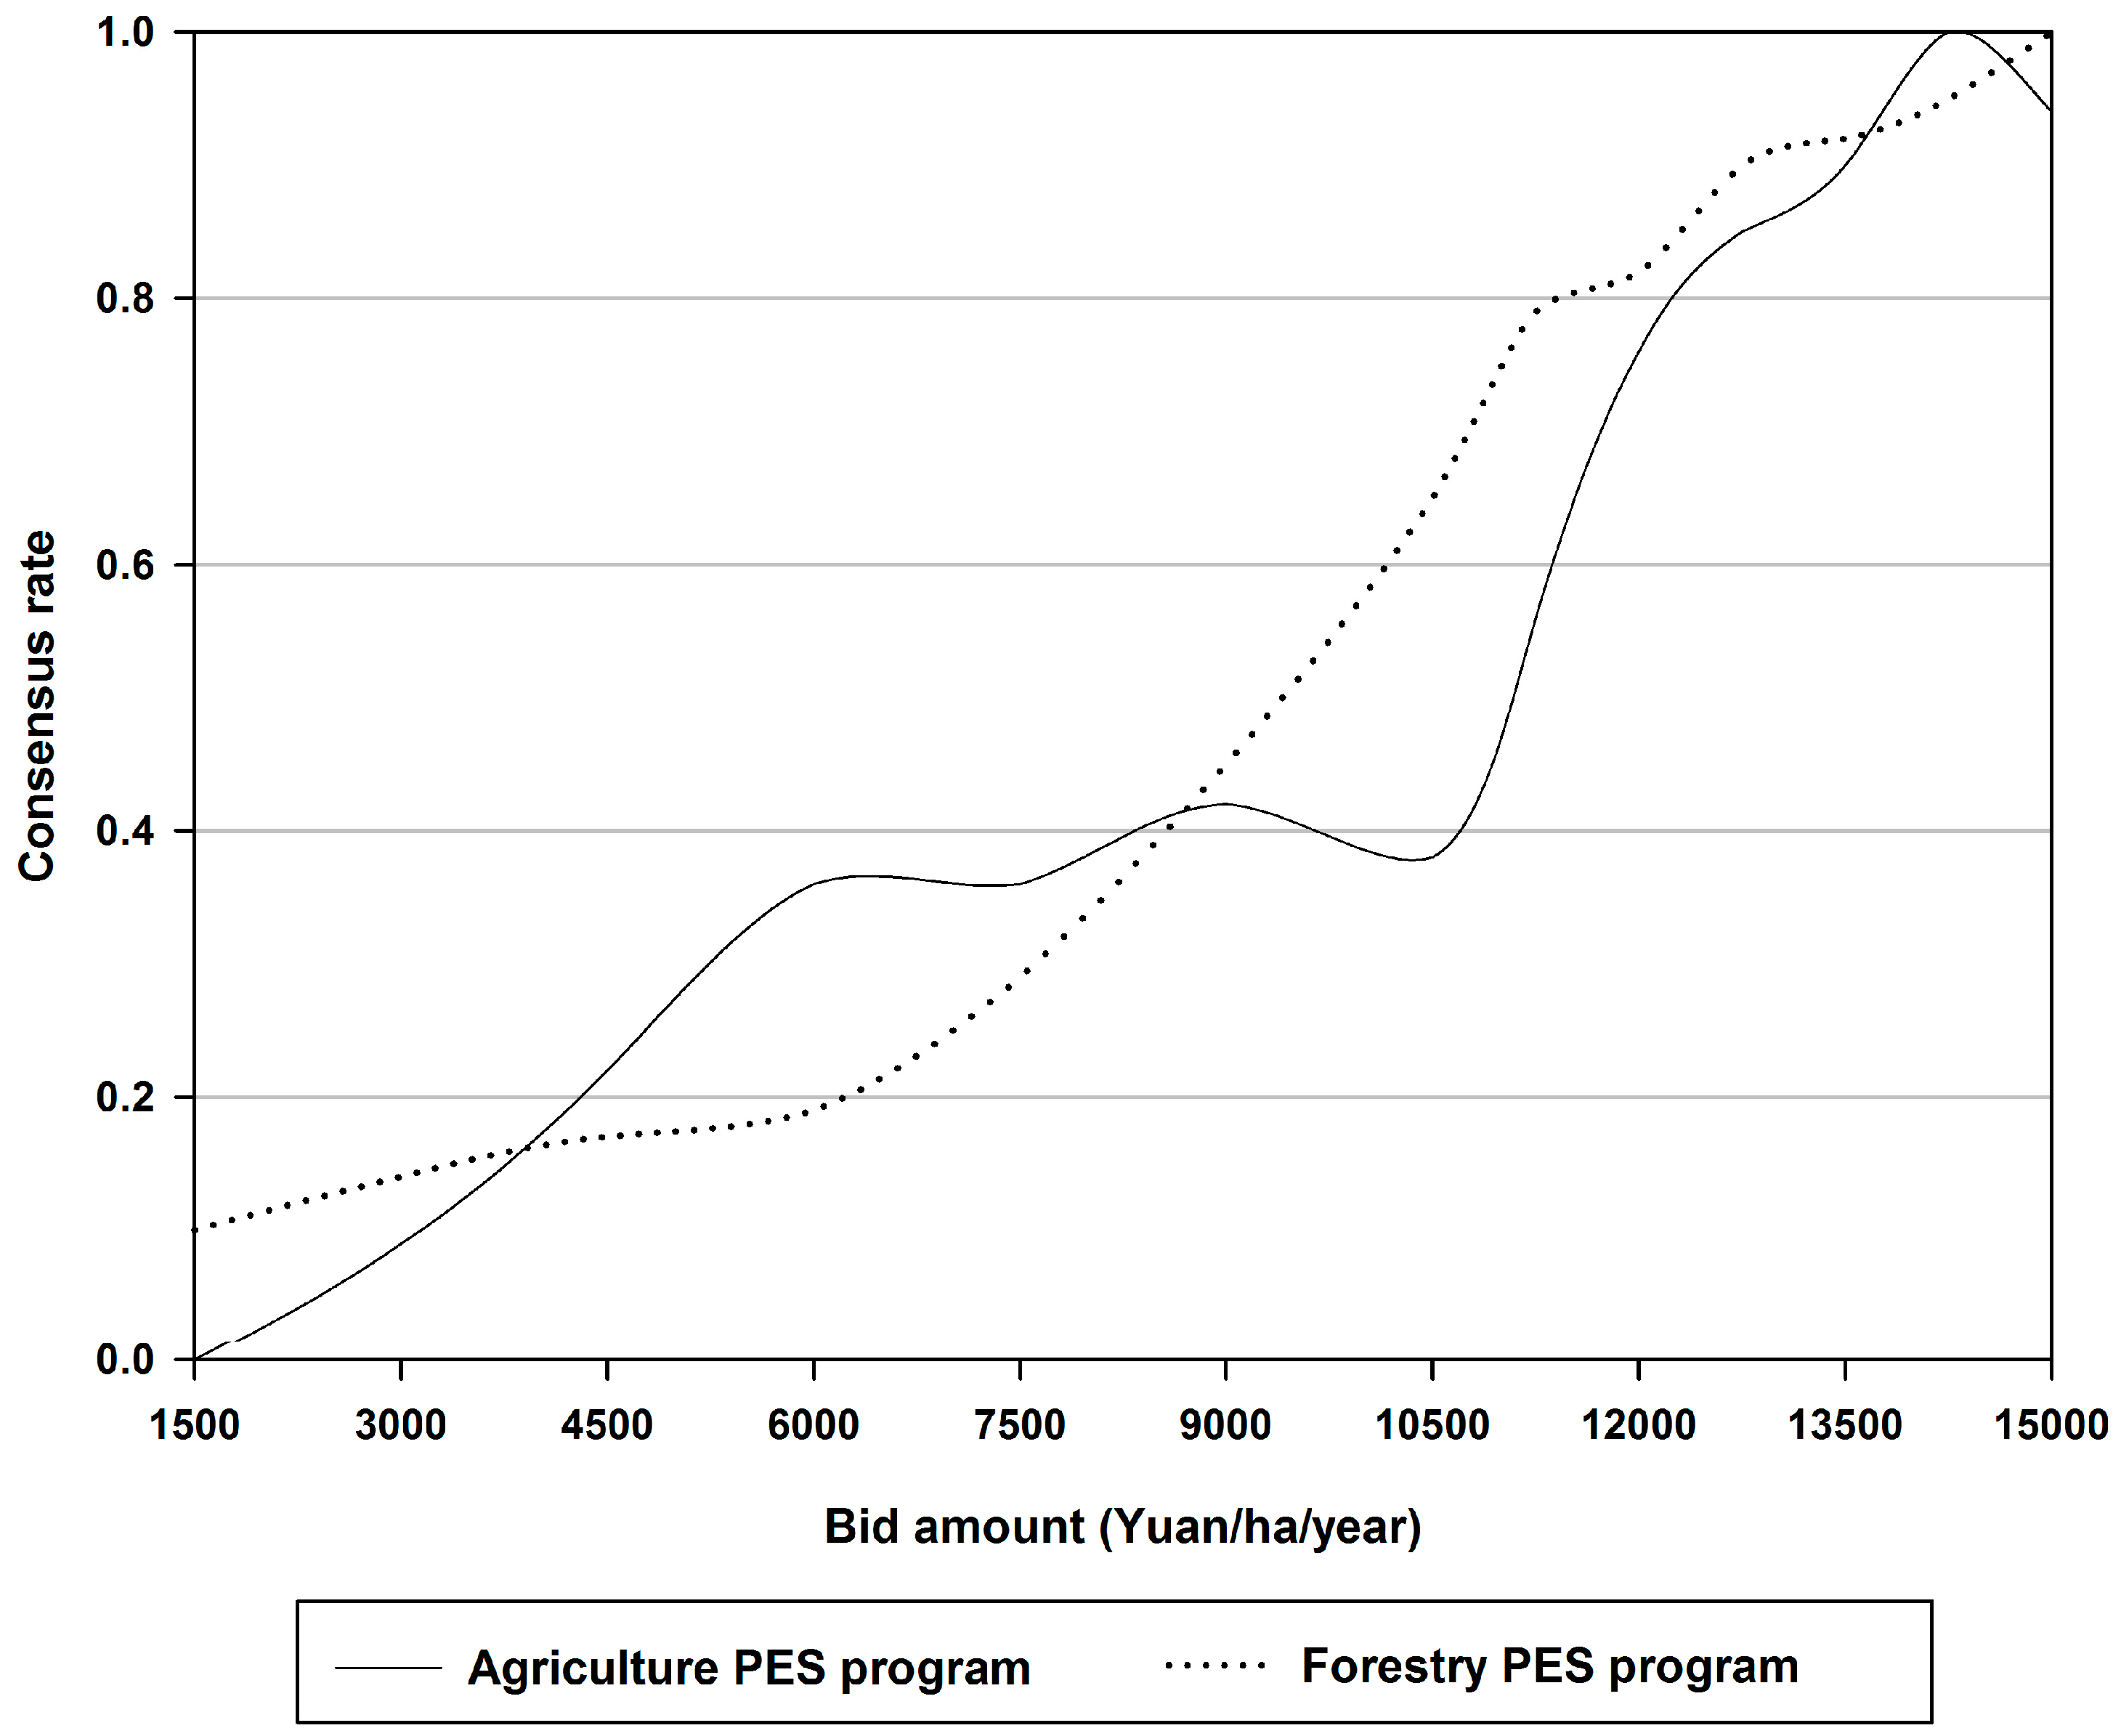
3.1. Responses and Consensus Rate at Each Bid Amount

With the exception of 13 households (i.e., 7 in Beijing and 6 in Hebei) who are not interested in these programs, the rest of 283 households responded. The 96% response rate implies that there is a great potential to further push forward the PES programs focusing on water source protection in the MRC. Table 1 presents the response disposition and consensus rate at each bid amount to both agriculture and forestry PES program.
Further, according to Figure 2, the distributions of the consensus rate follow the preliminary perception that the WTA would rise associated with the increasing of bid amount, though it is not perfectly monotonic. Notably, for the agriculture PES program, the consensus rate decreases or remains the same as bid amount rise to 7500, 10,500 and 15,000 yuan. It is more than likely due to the smaller sample size that is unable to reveal the real WTA distribution at the larger scale. In addition, the different distributions of consensus rate for both programs suggest that the differential WTA may exist.

3.2. Effects of Variables on WTA

The relevant demographic variables and their descriptive information at the village and household level included in the model are reported in Table 2.
Generally, these household and village variables were used to examine the complex effects of various socio-economic factors on WTA. At the household level, firstly, age and education years of household head were included into the model, as most of economic decisions are mainly made by the household head, especially the husband, in Chinese rural areas [63]. Meanwhile, decision-making is an activity dependent on human capital variables such as age and education, which can significantly impact the PES participation decision [64]; Household Size represents labour availability, which is often found to be important in determining PES program participation [65]. Household Income as a proxy of knowledge and experience was concluded as a significant determinant of PES participation though dependent on specific income level and program contexts [29,40]. Land, as the principal productive asset for rural households, has been commonly identified as a determinant of participation [66,67]. Also, Location variable indicates whether the willingness to participate in different provinces reflects consistently the differences in interest between upstream and downstream stakeholders within the MRC [46]. Finally, we inferred that the respondents’ previous experience of PES program is likely to determine the willingness to participate, thus the variable of PES Participation was included into the model.
The Village Population variable suggests labor availability at the village level. A proportion of off-farm employment demonstrates the development of local off-farm economy. In some sense, a higher population proportion of off-farm employment, resulting from a more advanced off-farm economy, might cause less reliance on traditional land-intensive agriculture [40,68]. Hence, local rural households might be more willing to participate in PES programs. The results of regression analysis with respect to the WTA for both different programs and jurisdictions, based on Equation (1), are presented in Table 3.

3.2.1. Household Variables

• Bid Amount
Incentive payments often can impact positively the decision to participate in PES program [64,69,70]. In this case, as we expected, the Bid Amount variable has positive effects on WTA at the 0.01 significance level for both programs and jurisdictions. The higher the yuan amount paid for the respondent, the higher the probability that the respondent is willing to vote for restoration of ES in the MRC.
• Location
The Location where the respondent lives also positively correlates with WTA at the 0.01 significance level. Specifically, the respondents in Hebei have stronger interests in these two PES programs compared to the Beijing respondents. The initial finding reflects consistently the welfare gap and the interest differences between Beijing and Hebei. The Hebei households are seeking to find the opportunities of livelihood improvement, while there are no such urgent demands in Beijing due to its location advantages and more local governmental compensation opportunities [62].
• PES Participation
The variable is statically insignificant or negatively significant at the 0.01 level for both programs. Both insignificant and negative effects on program participation suggest that the previous PES program (PLDL program) may not be successful as expected. During the survey, we heard of complaints regarding the program, such as low subsidy levels and irregular subsidy payments. These findings not only reflect administrative problems associated with the program implementation, but also the sustainability risk underlying the program like other Chinese PES programs such as the Sin fullLCP program) [35]. Essentially, the risk may be due to institution and market imperfections, including insecure land tenure and a lack of off-farm employment opportunities [35,36,71]. As such, the previous participants would have no strong interest in following PES programs.
• Age
As noted earlier, the effects of household head characteristics, such as age and education, on PES program participation have been confirmed. However, the effect of Age is generally less significant, because age as a proxy for experience may be offset by a greater reluctance to try new things, including new PES programs [64]. On the other hand, the variable’s positive statistical significance of all and Beijing samples at the 0.05 level for the forestry PES program suggests that the interest differences of stakeholders appears to be not only in jurisdictions but also in program types.
• Education
Education of the household head represents his or her ability to obtain and process knowledge. More importantly, the variable, coupled with the leading role of household head on family economic decisions, is also conducive to implementing knowledge-intensive restoration and conservation programs. Ideally, more effective participation in PES program requires a higher level of knowledge [64]. The overall insignificance of Education variable implies that knowledge level cannot be a determinant for PES program participation within the MRC area. In addition, the statistical significant results at the 0.05 level reveal similar effects of geographical location and program type on the participation decisions to Age variable.
• Household Size
Although the variable of Household Size has been perceived as an important determinant to program participation decisions, its effect (positive or negative) depends more on specific program type and context [64]. Here, the overall insignificant regression results indicate that family labor availability has not been associated with the PES program participation as expected, as the supply of labor in Chinese rural areas is generally abundant [72,73]. Consequently, the rural households would not take the factor into consideration for program participation. Nonetheless, the variable is significant at the 0.01 and 0.05 levels for the agriculture PES program of the total and Beijing sample. These results suggest that the Beijing respondents perceived the labor availability as a decision criterion, as they experience a lack of young and qualified labors. Especially for the rural areas around mega-cities like Beijing, along with the growing urbanization, an increasing number of rural labors have moved into cities to work as migrants so a majority of stay-at-home labors are often elderly and infirm [40,74]. In addition, the traditional cropping activities would cost more for labor relative to the forestry activities while not earning equal incomes [71]. Therefore, the release of an over-supply of laborers from these activities, for larger families will likely result in their favoring the agriculture PES program compared to the forestry PES program.
• Household Income
Like Age and Education, the variable of Household Income also reflects rural household’s management knowledge and capacities. Rural households with higher income often have greater management capacities [64]. As such, they are typically more aware of the cost-effectiveness for programs proposed, that is, the specific cost and returns for each of contractual alternatives, and they can thus identify and become involved in more profitable programs. In this case, the insignificant and small effect of Household Income on participation decision for all programs and jurisdictions may be because the incentive payments received are too small compared to the households’ average annual income (Table 2).
• Land Area
Land size is thought to be positively correlated with program participation, because rural households with more land are more likely to contract-out some of their lands while not jeopardizing their income-generating potential [64,66]. However, the statistical insignificant results for Land Area variable may be caused by two reasons. On one hand, land area per capita within the MRC, cropland area (0.14 ha/person) in particular, is relatively large compared to the national level (0.08 ha/person) [40]. On the other hand, due to the hilly topography, the land often has a lower productivity so that local rural households cannot earn desirable income. Hence, the local rural households would care less about the effects of land re-allocation on their livelihoods.

3.2.2. Village Variables

• Village population
Overall, the negative impact of the Village Population variable denotes that the respondents in relatively large villages are less likely to accept these programs. However, due to the differences in labor force allocation, the results vary across jurisdictions. In Hebei, the larger villages, where more laborers are willing to work as migrants in cities rather than staying at home, actually have an insufficient local surplus of laborers to implement the future programs. The variable is significant at the 0.01 and 0.05 levels for agriculture and forestry PES program, respectively.
• Proportion of Off-farm Employment
The variable of Proportion of Off-farm Employment is significantly positively correlated with WTA for both jurisdictions and program types. This is consistent with the conclusions drawn by previous studies [64,68,75]. Since the opportunity costs of off-farm employment are far more than traditional agriculture activities [71], those villages in which there is a higher proportion of off-farm employment are more willing to participate in PES programs for incentive payments rather than cultivate on their own lands.

3.3. Estimation of WTA

Based on Equation (2), the mean WTA values with respect to the different programs and samples have been estimated as Table 4.
As shown in Table 4, the mean WTA values of an agriculture program (8531 yuan/ha/year) approximate the ongoing PLDL payment criterion 8250 yuan/ha/year [46], while the mean WTA values of the forestry program (8187 yuan/ha/year) are far more than the mean subsidy of the SLCP (2250 yuan/ha/year) derived from the survey. For the forestry program, the greater difference between estimated WTA and ongoing payment criterion consistently reflects the progress of regional socio-economic development. The ongoing payment criterion found in 2008 has fallen far behind the increases in local price levels. For example, during the household survey, we noted that the daily wage paid for an adult male labor had reached 150 yuan. Complaints about low SLCP subsidy levels by respondents also testified to our findings. More importantly, as noted earlier, the forestry program requires local household to participate in various program activities (e.g., re-afforestation, agro-forestry management) rather than only receive subsidy [40]. Thus, the respondents would have to take account of the opportunity costs lost due to program participation when they determined WTA.
Also, as noted in Section 3.1, there are differences with regard to the mean WTA value across different program types. As we expected, the mean WTA of the agriculture program is higher than that of the forestry program (8531 vs. 8187 yuan). It may be that farmland usually has higher opportunity costs comparing to forestland. The total and Beijing household sample follow this finding. In Hebei, however, the situation is totally opposite to the above, namely, the WTA value on forestland is somewhat (or slightly) higher than on farmland. This is because the farmland of Hebei upstream is relative infertile compared to that of Beijing downstream, while cropping activity is more labor intensive than forestry activity. For these reasons, the local rural households appear to perceive that their farmlands have equal or even lower opportunity costs relative to their forestlands.
From the perspective of the different jurisdictions, the mean WTA values of Beijing are substantially higher than that of Hebei in terms of either agriculture or forestry programs (i.e., agriculture: 10,607 vs. 6808; forestry: 10,363 vs. 6848). This is actually consistent with the above analysis results and the welfare disparities across the two jurisdictions. The higher the economic development and socio-welfare, the higher WTA values the local residents have.
The concept of Purchase Power Parity (PPP) was used here to assess the financial feasibility of WTA. PPP indicates that the real exchange rate between domestic and foreign goods is equal to one. That is to say that identical items in different countries should have the same real prices in another [77]. Based on the calculation method [78], the PPP value of one yuan would be 0.167 US$, if the exchange rate between yuan and US$ as well as the inflation rate could be 0.154 and 0.085 in 2018, respectively. As such, the PPP values of mean WTA for agriculture and forestry PES programs would be equal to 1425 and 1367 US$/ha/year, respectively. A similar set-aside program in US, namely the Conservation Reserve Program (CRP), had the average rental payment of 112.73 US$/ha/year [79]. The subsidies paid by either agriculture or forestry PES program are far more than the CRP. Therefore, the estimated criteria of incentive payment would be financially feasible.

3.4. LLR Test

The estimation results suggest that the assumption of behaving similarly on valuation with respect to either the agriculture or forestry program should be rejected at the 0.05 significance level. It may be partly due to different economic development and social welfare levels as well as development interests resulting in the different views on the use of water, land and other natural resources [46,80]. Therefore, the economic valuation of restoring ES in the MRC area could be best estimated by the use of the two separate equations for Beijing and Hebei area rather than one pooled equation.

3.5. Valuation of Restoring ES

Table 4 also presents the ES valuation results (column 4 and 7) based on the mean WTA values and the area of farmland and forestland (column 3 and 6). The economic values of restoring ES on the farmland and forestland amount to 2.0 billion and 9.1 billion yuan, respectively. As such, the total economic value of restoring ES in the MRC area reaches 11.1 billion yuan. In fact, due to different protection priorities and budget constraints [76], it is not necessary or feasible to invest such a huge amount of money for the restoration of ES in the MRC area in one year.
From 2010 to 2019, the JAPEWP program is to be implemented over a total area of 66,667 ha forestland (6667 ha per year). Thus, this forestland area is assumed to be the top priority for the water protection in the MRC area. As for the local farmland, the PLDL program has converted 8413 ha of paddy land (Beijing: 387 ha; Hebei: 8026 ha) into corn land since 2003 [43]. Certainly, the farmland area would still have great significance for water conservation. In particular, we found from the survey that payment of the land set aside program in Beijing has been terminated for many years. Taking these data as reference, the researcher can further calculate the rational restoring values in the MRC area as Table 4.
The economic values of ES on farmland and forestland reach 58.7 million and 456.5 million yuan in one year, respectively. Therefore, the Beijing Municipal Government should pay 515.2 million yuan for the rural households to restore ES in the MRC each year. Following the ongoing investment criteria, namely the PLDL program 8250 yuan/ha/year and the SLCP program 2250 yuan/ha/year, the total investment for the MRC restoration is 216.2 million yuan per year. There is a big gap of 299 million yuan per year between theoretical and practical restoration costs. It is of course unreasonable that the cost gap should be filled by the Beijing Municipal Government. Thus, the approach of water tariff reform to leverage more resources for MRC restoration should be taken into consideration.
In a functioning market, the price for a public good or resource reflects its scarcity in the balance supply and demand. To represent full costs and increase use efficiency, governments often adjust prices of public good or resource, such as a public transportation system [81,82], fossil fuels [83] and power [84]. Thus, associated with water price reforms in China [85], water tariffs were thought to be an effective tool to align water demand with supply and provide funding for the MRC restoration. Now, the water tariff in Beijing often has three components, payment for water used, a water resource fee, and a waste water treatment fee. The specific rates vary across different types of consumer, among which the recent rate for residential consumption is 5 yuan/m3. Meanwhile, the total water consumption in 2016 amounted to 3.88 billion m3 [86]. As such, to raise the missing funds needed for the two PES programs, the government could increase the water resource fee. The suggested amount can be calculated as 2.99/38.8 = 0.08 (yuan). In other words, the remaining funds other than government investment can be raised from urban water users via increasing by water tariff 0.08 yuan. The increase should be feasible and acceptable since it is a relative small amount for most users compared to the ongoing water tariff. More importantly, the approach truly achieves the goal of which beneficiaries pay for ES received as the concept of PES initially defined.

3.6. Cost-Effectiveness Analysis

From the perspective of ES beneficiaries (i.e., urban water users), the re-afforestation and management activities of the forestry PES program are aimed to conserve water from rainfall interception, soil water storage and fresh water provision. In Beijing, one hectare of well-managed forest can conserve 1080 m3 water per year [15,87]. As such, according to the mean WTA of the forestry program noted earlier, the unit cost for conserving 1 m3 water can be calculated as 8187/1080 = 7.58 (yuan/m3). The estimation result is a little more than the ongoing water tariff (5 yuan/m3), which indirectly measures the program benefit by treatment costs of domestic water to some extent. However, considering that the ongoing tariffs should double if they are to reflect the full financial cost [88], the unit cost paid by forestry program should be rational and cost-effective. On the other hand, the agriculture PES program is designed to diminish irrigation water and non-point pollution by fertilizer uses. Taking the PLDL program as reference, the benefit of water saving can be estimated as 12,341 yuan/ha, while the reduced cost for the diminishing of Total Nitrogen and Total Phosphorus could be 46 yuan/ha [46]. The program benefits (12,387 yuan/ha) explicitly exceed the program costs (8531 yuan/ha).
For the ES providers (i.e., local farmer households), the economic benefit earned from the forestry program is 8187 yuan/ha, while the opportunity cost including forest product income and forestry subsidy is 1119 yuan/ha according the survey data. The benefit is about 7 times the opportunity cost. With regard to the agriculture program, the opportunity cost of land conversion is 7101 yuan/ha based on the study results drawn by Zheng et al. [46]. The program subsidy paid by the government is 8531 yuan/ha, about 1.2 times the program opportunity cost. Therefore, from the perspective of either ES beneficiary or provider, these two programs are both cost-effective.

4. Conclusions

As the only surface water source for Beijing, the Miyun Reservoir has an increasingly important strategic significance for the city’s water security and safety. In this study, two new PES programs (agriculture and forestry) designed to improve ecosystem services (ES) in the Miyun Reservoir Catchment (MRC) are evaluated. To provide quantified supports and improve implementation efficiency for these two programs, this study used the contingent valuation method (CVM) to estimate the costs of these programs and to further calculate the economic value of ES in the MRC area in the perspective of local rural households’ willingness to accept (WTA). A number of unique conclusions and policy implications have been drawn as follows.
The local socio-economic contexts have complex effects on the WTA of rural households. Logit regression results including WTA and the variables of household and village indicate that the Bid Amount, Location and Proportion of Off-farm Employment would have significant positive effects on the local WTA. In particular, the significant results of the Location variable show that Hebei households express stronger interest in the PES programs compared to Beijing households and that this consistently reflects the development and welfare gaps between them. The finding also has been statistically confirmed via the likelihood ratio test. In contrast, the insignificance of the PES Participation variable suggests that the previous PES program may not be totally successful as designed, so that the following participation interests of rural households may be negatively impacted. These findings can help decision makers to not only effectively target participating households, but establish a sound and flexible policy mechanism including a set of differentiated payment criterions that takes account of regional heterogeneity and other factors for the designed PES programs.
The mean WTA to agriculture and forestry PES programs were estimated as 8531 and 8187 yuan/ha/year, respectively, which explains the differentiated opportunity costs on both farmland and forestry land. The WTA value of agriculture program is similar to the costs of the ongoing Paddy Land to Dry Land (PLDL) program (8250 yuan/ha/year), while the forestry program is far more than the ongoing Slope Land Conversion Program (SLCP) (2250 yuan/ha/year). The greater differences may be due to the changes of local socio-economic contexts and the households’ consideration to losses of opportunity costs. On the other hand, those WTA values in Beijing and Hebei underline the differentiated WTA following the development gaps between jurisdictions. Based on these above results, we calculated Purchase Power Parity (PPP) values of mean WTA in US dollars for these two programs and then compared these values with the payment criterion of Conservation Reserve Program (CRP) in US. The result indicates their financial feasibility.
Mean WTA values were generalized to the whole MRC area. The total economic value of ES in the MRC area reaches 11.1 billion yuan/year (agriculture program: 2.0 billion yuan/year; forestry program: 9.1 billion yuan/year). Further, based on the mean WTA and priority area, the rational economic value of ES in one year was estimated as 515.2 million yuan. Following the ongoing program costs, a budget gap (299 million yuan per year) will have to be filled. The study explored how to use the leverage of water tariffs to raise the remaining funds need for these programs. The estimation result indicates that the remaining funds can be obtained from urban water users via increasing by water tariff 0.08 yuan. Considering the small share of 0.08 yuan accounting for the whole tariff, the result can be thought to be sound and feasible. More importantly, the approach truly achieves the goal of which beneficiaries pay for ES received as the concept of PES initially defined. Finally, the results of cost-effectiveness analysis suggest that either agriculture or forestry program is cost-effective and highly feasible.
In sum, the study provides a valuable and unique policy insight into the assessment to ongoing PES policy, the calculation to precise restoration costs of degraded ES as well as the designing of program fundraising mechanism. These results could provide a rationale and quantitative base for the designing and planning of PES program activities in mega-city source water area.

Acknowledgments

This research was supported by the National Key Research and Development Program of China (2016YFC0500801; 2016YFC0500804) and Beijing Municipal Science and Technology Commission (Z141100006014031 and Z141100006014037). We thank Bruce Pendrel for his patient revisions and valuable suggestions. We are also grateful to the students of Beijing Forestry University, who worked as enumerators, and all of the survey respondents. We would also like to thank the editor and four anonymous reviewers for their suggestions that significantly improved the quality of the paper.

Author Contributions

Hao Li, Xiaohui Yang and Kebin Zhang conceived and designed the study plan; Hao Li, Yuyan Liu and Xiao Zhang performed the rural household survey; Yuyan Liu processed the survey data; Hao Li analyzed the survey data; Xiao Zhang provided research funds and coordinated logistical issues; Hao Li and Xiaohui Yang wrote the paper.

Conflicts of Interest

The authors declare no conflict of interest.

References

  1. Costanza, R.; D’Arge, R.; de Groot, R.; Farber, S.; Grasso, M.; Hannon, B.; Limburg, K.; Naeem, S.; O’Neill, R.V.; Paruelo, J.; et al. The value of the world’s ecosystem services and natural capital. Nature 1997, 387, 253–260. [Google Scholar] [CrossRef]
  2. Groot, R.S.D.; Wilson, M.A.; Boumans, R.M.J. A typology for the classification, description and valuation of ecosystem functions, goods and services. Ecol. Econ. 2002, 41, 393–408. [Google Scholar] [CrossRef]
  3. Millennium Ecosystem Assessment. Ecosystems and Human Well-Being—A Framework for Assessment; Island Press: Washington, DC, USA, 2003. [Google Scholar]
  4. Balmford, A.; Bruner, A.; Cooper, P.; Costanza, R.; Farber, S.; Green, R.E.; Jenkins, M.; Jefferiss, P.; Jessamy, V.; Madden, J. Economic reasons for conserving wild nature. Science 2002, 297, 950–953. [Google Scholar] [CrossRef] [PubMed]
  5. Groot, R.S.D.; Brander, L.; van der Ploeg, S.; Costanza, R.; Bernard, F.; Braat, L.; Christie, M.; Crossman, N.; Ghermandi, A.; Hein, L.; et al. Global estimates of the value of ecosystems and their services in monetary units. Ecosyst. Serv. 2012, 1, 50–61. [Google Scholar] [CrossRef]
  6. Turner, R.K.; van den Bergh, J.C.J.M.; Söderqvist, T.; Barendregt, A.; Straaten, J.V.D.; Maltby, E.; Ierland, E.C.V.; Söderqvist, T.; Mitsch, W.J.; Turner, R.K. Ecological-economic analysis of wetlands: Scientific integration for management and policy. Ecol. Econ. 2000, 35, 7–23. [Google Scholar] [CrossRef]
  7. D’Amato, D.; Rekola, M.; Li, N.; Toppinen, A. Monetary valuation of forest ecosystem services in China: A literature review and identification of future research needs. Ecol. Econ. 2016, 121, 75–84. [Google Scholar] [CrossRef]
  8. Ouyang, Z.; Zheng, H.; Xiao, Y.; Polasky, S.; Liu, J.; Xu, W.; Wang, Q.; Zhang, L.; Rao, E.; Jiang, L. Improvements in ecosystem services from investments in natural capital. Science 2016, 352, 1455–1459. [Google Scholar] [CrossRef] [PubMed]
  9. Costanza, R.; Groot, R.D.; Braat, L.; Kubiszewski, I.; Fioramonti, L.; Sutton, P.; Farber, S.; Grasso, M. Twenty years of ecosystem services: How far have we come and how far do we still need to go? Ecosyst. Serv. 2017, 28, 1–16. [Google Scholar] [CrossRef]
  10. Toman, M.A. Special section: Forum on valuation of ecosystem services: Why not to calculate the value of the world’s ecosystem services and natural capital. Ecol. Econ. 1998, 25, 57–60. [Google Scholar] [CrossRef]
  11. Edwardsjones, G.; Davies, B.; Hussain, S. Ecological Economics: An Introduction; Blackwell Science Ltd.: Hoboken, NJ, USA, 2000. [Google Scholar]
  12. Loomis, J.B.; Kent, P.; Strange, L.; Fausch, K.; Covich, A. Measuring the total economic value of restoring ecosystem services in an impaired river basin: Results from a contingent valuation survey. Ecol. Econ. 2000, 33, 103–117. [Google Scholar] [CrossRef]
  13. Adamowicz, W.L.; Boxall, P.C.; Williams, M.; Louviere, J.J. Stated preference approaches for measuring passive use values: Choice experiments and contingent valuation. Am. J. Agric. Econ. 1998, 80, 64–75. [Google Scholar] [CrossRef]
  14. Seidl, A.; Moraes, A.S. Global valuation of ecosystem services: Application to the pantanal da nhecolandia, brazil. Ecol. Econ. 2000, 33, 1–6. [Google Scholar] [CrossRef]
  15. Zhang, B.; Li, W.; Xie, G.; Xiao, Y. Water conservation of forest ecosystem in beijing and its value. Ecol. Econ. 2010, 69, 1416–1426. [Google Scholar]
  16. Bernard, F.; de Groot, R.S.; Campos, J.J. Valuation of tropical forest services and mechanisms to finance their conservation and sustainable use: A case study of tapantí national park, costa rica. For. Policy Econ. 2009, 11, 174–183. [Google Scholar] [CrossRef]
  17. Jadhav, A.; Anderson, S.; Dyer, M.J.B.; Sutton, P.C. Revisiting ecosystem services: Assessment and valuation as starting points for environmental politics. Sustainability 2017, 9, 1755. [Google Scholar] [CrossRef]
  18. Adamowicz, W.; Louviere, J.; Swait, J. An Introduction to Attribute-Based Stated Choice Methods; The National Oceanic and Atmospheric Administration, US Department of Commerce: Silver Spring, MD, USA, 1998.
  19. Mitchell, T.R.; Carson, C.R. Using Surveys to Value Public Goods: The Contingent Valuation Method; Resources for the Future: Washington, DC, USA, 1989. [Google Scholar]
  20. Hanemann, W.M. Willingness to pay and willingness to accept: How much can they differ? Am. Econ. Rev. 1991, 81, 635–647. [Google Scholar] [CrossRef]
  21. Shogren, J.F.; Hayes, D.J. Resolving differences in willingness to pay and willingness to accept: Reply. Am. Econ. Rev. 1997, 84, 255–270. [Google Scholar]
  22. Dupraz, P.; Vermersch, D.; Frahan, B.H.D.; Delvaux, L. The environmental supply of farm households: A flexible willingness to accept model. Environ. Resour. Econ. 2003, 25, 171–189. [Google Scholar] [CrossRef]
  23. Hanley, N.; Ruffell, R.J. The contingent valuation of forest characteristics: Two experiments. J. Agric. Econ. 1993, 44, 218–229. [Google Scholar] [CrossRef]
  24. Shechter, M.; Reiser, B.; Zaitsev, N. Measuring passive use value: Pledges, donations and cv responses in connection with an important natural resource. Environ. Resour. Econ. 1998, 12, 457–478. [Google Scholar] [CrossRef]
  25. Jorgensen, B.S.; Wilson, M.A.; Heberlein, T.A. Fairness in the contingent valuation of environmental public goods: Attitude toward paying for environmental improvements at two levels of scope. Ecol. Econ. 2001, 36, 133–148. [Google Scholar] [CrossRef]
  26. Xu, Z.; Cheng, G.; Zhang, Z.; Su, Z.; Loomis, B.J. Applying contingent valuation in China to measure the total economic value of restoring ecosystem services in ejina region. Ecol. Econ. 2003, 44, 345–358. [Google Scholar]
  27. Zhai, G.; Suzuki, T. Public willingness to pay for environmental management, risk reduction and economic development: Evidence from tianjin, China. China Econ. Rev. 2008, 19, 551–566. [Google Scholar] [CrossRef]
  28. Zhen, L.; Li, F.; Yan, H.M.; Liu, G.H.; Liu, J.Y.; Zhang, H.Y.; Du, B.Z.; Wu, R.Z.; Sun, C.Z.; Wang, C. Herders’ willingness to accept versus the public sector’s willingness to pay for grassland restoration in the xilingol league of inner mongolia, China. Environ. Res. Lett. 2014, 9, 045003. [Google Scholar] [CrossRef]
  29. Li, J.; Feldman, M.W.; Li, S.; Daily, G.C. Rural household income and inequality under the sloping land conversion program in western China. Proc. Natl. Acad. Sci. USA 2011, 108, 7721–7726. [Google Scholar] [CrossRef] [PubMed]
  30. Wunder, S. Revisiting the concept of payments for environmental services. Ecol. Econ. 2015, 117, 234–243. [Google Scholar] [CrossRef]
  31. Wunder, S.; Engel, S.; Pagiola, S. Taking stock: A comparative analysis of payments for environmental services programs in developed and developing countries. Ecol. Econ. 2008, 65, 834–852. [Google Scholar] [CrossRef]
  32. Farley, J.; Costanza, R. Payments for ecosystem services: From local to global. Ecol. Econ. 2010, 69, 2060–2068. [Google Scholar] [CrossRef]
  33. Ingram, J.C.; Wilkie, D.; Clements, T.; McNab, R.B.; Nelson, F.; Baur, E.H.; Sachedina, H.T.; Peterson, D.D.; Foley, C.A.H. Evidence of payments for ecosystem services as a mechanism for supporting biodiversity conservation and rural livelihoods. Ecosyst. Serv. 2014, 7, 10–21. [Google Scholar] [CrossRef]
  34. Bennett, G.; Nathaniel, C. Gaining Depth: State of Watershed Investment 2014; Forest Trends: Washington, DC, USA, 2014. [Google Scholar]
  35. Bennett, M.T. China’s sloping land conversion program: Institutional innovation or business as usual? Ecol. Econ. 2008, 65, 699–711. [Google Scholar] [CrossRef]
  36. Grosjean, P.; Kontoleon, A. How sustainable are sustainable development programs? The case of the sloping land conversion program in China. World Dev. 2009, 37, 268–285. [Google Scholar] [CrossRef]
  37. Gauvin, C.; Uchida, E.; Rozelle, S.; Xu, J.; Zhan, J. Cost-effectiveness of payments for ecosystem services with dual goals of environment and poverty alleviation. Environ. Manag. 2010, 45, 488–501. [Google Scholar] [CrossRef] [PubMed]
  38. Zhou, Y.; Zhang, Y.; Abbaspour, K.C.; Mosler, H.-J.; Yang, H. Economic impacts on farm households due to water reallocation in China’s chaobai watershed. Agric. Water Manag. 2009, 96, 883–891. [Google Scholar] [CrossRef]
  39. Zhang, Y.; Min, C.; Zhou, W.; Zhuang, C.; Ouyang, Z. Evaluating Beijing’s human carrying capacity from the perspective of water resource constraints. J. Environ. Sci. 2010, 22, 1297–1304. [Google Scholar] [CrossRef]
  40. Li, H.; Bennett, M.T.; Jiang, X.; Zhang, K.; Yang, X. Rural household preferences for active participation in “payment for ecosystem service” programs: A case in the miyun reservoir catchment, China. PLoS ONE 2017, 12, e0169483. [Google Scholar] [CrossRef] [PubMed]
  41. Peisert, C.; Sternfeld, E. Quenching Beijing’s thirst: The need for integrated management for the endangered miyun reservoir. China Environ. Ser. 2005, 7, 33–45. [Google Scholar]
  42. Zheng, H.; Li, Y.; Robinson, B.E.; Liu, G.; Ma, D.; Wang, F.; Lu, F.; Ouyang, Z.; Daily, G.C. Using ecosystem service trade-offs to inform water conservation policies and management practices. Front. Ecol. Environ. 2016, 14, 527–532. [Google Scholar] [CrossRef]
  43. Beijing Water Authority; Beijing Municipal Finance Bureau. Benefits Evaluation Report of the Paddy Land to Dry Land Program between Beijing Municipality and Hebei Province; Beijing Water Authority Publisher: Beijing, China, 2010.
  44. Bao, Z.; Fu, G.; Wang, G.; Jin, J.; He, R.; Yan, X.; Liu, C. Hydrological projection for the miyun reservoir basin with the impact of climate change and human activity. Quat. Int. 2012, 282, 96–103. [Google Scholar] [CrossRef]
  45. Li, D.; Ji, L.; Di, Y.; Gong, H.; Guo, X. The spatial-temporal variations of water quality in controlling points of the main rivers flowing into the miyun reservoir from 1991 to 2011. Environ. Monit. Assess. 2016, 188, 1–12. [Google Scholar] [CrossRef] [PubMed]
  46. Zheng, H.; Robinson, B.E.; Liang, Y.C.; Polasky, S.; Ma, D.C.; Wang, F.C.; Ruckelshaus, M.; Ouyang, Z.Y.; Daily, G.C. Benefits, costs, and livelihood implications of a regional payment for ecosystem service program. Proc. Natl. Acad. Sci. USA 2013, 110, 16681–16686. [Google Scholar] [CrossRef] [PubMed]
  47. Wang, Y.; Xiong, W.; Gampe, S.; Coles, N.A.; Yu, P.; Xu, L.; Zuo, H.; Wang, Y. A water yield-oriented practical approach for multifunctional forest management and its application in dryland regions of China. J. Am. Water Resour. Assoc. 2015, 51, 689–703. [Google Scholar] [CrossRef]
  48. Xue, J. Beijing and Hebei Will Work Together to Build 53 Thousand Ha Water Protection Forest Until 2015. Available online: http://he.people.com.cn/GB/197039/15532780.html (accessed on 16 May 2017).
  49. Lienhoop, N.; MacMillan, D. Valuing wilderness in iceland: Estimation of wta and wtp using the market stall approach to contingent valuation. Land Use Policy 2007, 24, 289–295. [Google Scholar] [CrossRef]
  50. Kim, Y.; Kling, C.L.; Zhao, J. Understanding behavioral explanations of the wtp-wta divergence through a neoclassical lens: Implications for environmental policy. Annu. Rev. Resour. Econ. 2015, 7, 169–187. [Google Scholar] [CrossRef]
  51. Randall, A.; Stoll, J.R. Consumer’s surplus in commodity space. Am. Econ. Rev. 1980, 70, 449–455. [Google Scholar]
  52. Guria, J.; Leung, J.; Jones-Lee, M.; Loomes, G. The willingness to accept value of statistical life relative to the willingness to pay value: Evidence and policy implications. Environ. Resour. Econ. 2005, 32, 113–127. [Google Scholar] [CrossRef]
  53. Brown, T.C.; Gregory, R. Why the wta–wtp disparity matters. Ecol. Econ. 1999, 28, 323–335. [Google Scholar] [CrossRef]
  54. Welsh, M.P.; Poe, G.L. Elicitation effects in contingent valuation: Comparisons to a multiple bounded discrete choice approach. J. Environ. Econ. Manag. 1998, 36, 170–185. [Google Scholar] [CrossRef]
  55. Murphy, J.J.; Stevens, T.H.; Yadav, L. A comparison of induced value and home-grown value experiments to test for hypothetical bias in contingent valuation. Environ. Resour. Econ. 2010, 47, 111–123. [Google Scholar] [CrossRef]
  56. Loomis, J.B.; Walsh, R.G. Recreation Economic Decisions: Comparing Benefits and Costs, 2nd ed.; Venture Publishing Inc.: State College, PA, USA, 1997. [Google Scholar]
  57. Hanemann, W.M.; Kanninen, B. The statistical analysis of discrete-response cv data. In Valuing Environmental Preferences: Theory and Practice of the Contingent Valuation Method in the US, EU, and Developing Countries; Bateman, I.J., Willis, K.G., Eds.; Oxford University Press: Oxford, UK, 1999; pp. 302–442. [Google Scholar]
  58. Hanemann, W.M. Welfare evaluations in contingent valuation experiments with discrete responses. Am. J. Agric. Econ. 1984, 66, 332–341. [Google Scholar] [CrossRef]
  59. Hanemann, W.M. Welfare evaluations in contingent valuation experiments with discrete response data: Reply. Am. J. Agric. Econ. 1989, 71, 1057–1061. [Google Scholar] [CrossRef]
  60. Bonato, D.; Nocera, S.; Telser, H. The Contingent Valuation Method in Health Care. An Economic Evaluation of Alzheimer’s Disease; Universität Bern: Bern, Switzerland, 2001. [Google Scholar]
  61. StataCorp. Stata Statistical Software 13.1; StataCorp: Station, TX, USA, 2013. [Google Scholar]
  62. Chreod Ltd.; Shanghai Development Research Centre. Hebei Provincial Development Strategy Volume 2-En: Strategic Considerations from An International Perspective; Asian Development Bank, Hebei Provincial Finance Bureau: Beijing, China, 2004; p. 59. [Google Scholar]
  63. Carlsson, F.; He, H.; Martinsson, P.; Qin, P.; Sutter, M. Household decision making in rural China: Using experiments to estimate the influences of spouses. J. Econ. Behav. Organ. 2012, 84, 525–536. [Google Scholar] [CrossRef]
  64. Zbinden, S.; Lee, D.R. Paying for environmental services: An analysis of participation in costa rica’s psa program. World Dev. 2005, 33, 255–272. [Google Scholar] [CrossRef]
  65. Neupane, R.P.; Sharma, K.R.; Thapa, G.B. Adoption of agroforestry in the hills of nepal: A logistic regression analysis. Agric. Syst. 2002, 72, 177–196. [Google Scholar] [CrossRef]
  66. Kosoy, N.; Corbera, E.; Brown, K. Participation in payments for ecosystem services: Case studies from the lacandon rainforest, mexico. Geoforum 2008, 39, 2073–2083. [Google Scholar] [CrossRef]
  67. Gintis, H. Beyond homo economicus: Evidence from experimental economics. Ecol. Econ. 2000, 35, 311–322. [Google Scholar] [CrossRef]
  68. Uchida, E.; Rozelle, S.; Xu, J.T. Conservation payments, liquidity constraints, and off-farm labor: Impact of the grain-for-green program on rural households in China. Am. J. Agric. Econ. 2009, 91, 70–86. [Google Scholar] [CrossRef]
  69. Pagiola, S.; Arcenas, A.; Platais, G. Can payments for environmental services help reduce poverty? An exploration of the issues and the evidence to date from latin america. World Dev. 2005, 33, 237–253. [Google Scholar] [CrossRef]
  70. Fisher, J. No pay, no care? A case study exploring motivations for participation in payments for ecosystem services in uganda. Oryx 2012, 46, 45–54. [Google Scholar] [CrossRef]
  71. Groom, B.; Grosjean, P.; Kontoleon, A.; Swanson, T.; Zhang, S. Relaxing rural constraints: A ‘win-win’ policy for poverty and environment in China? Oxf. Econ. Pap. 2010, 62, 132–156. [Google Scholar] [CrossRef]
  72. Chan, K.W. A China paradox: Migrant labor shortage amidst rural labor supply abundance. Eur. Geogr. Econ. 2010, 51, 513–530. [Google Scholar] [CrossRef]
  73. Bowlus, A.J.; Sicular, T. Moving toward markets? Labor allocation in rural China. J. Dev. Econ. 2003, 71, 561–583. [Google Scholar] [CrossRef]
  74. Whalley, J.; Zhang, S. A numerical simulation analysis of (hukou) labour mobility restrictions in China. J. Dev. Econ. 2007, 83, 392–410. [Google Scholar] [CrossRef]
  75. Uchida, E.; Xu, J.; Xu, Z.; Rozelle, S. Are the poor benefiting from China’s land conservation program? Environ. Dev. Econ. 2007, 12, 593. [Google Scholar] [CrossRef]
  76. Wang, Y. A Spatiotemporal Analysis of Land Use Change and Zoning of Landscape Restoration and Protraction in Miyun Reservoir Watershed; Chinese Academy of Forestry: Beijing, China, 2010. [Google Scholar]
  77. Moffatt, M. A Guide to Purchasing Power Parity Theory. Available online: https://www.thoughtco.com/guide-to-purchasing-power-parity-theory-1146305 (accessed on 4 January 2018).
  78. Rogoff, K. The purchasing power parity puzzle. J. Econ. Lit. 1996, 34, 647–668. [Google Scholar]
  79. Uchida, E.; Xu, J.; Rozelle, S. Grain for green: Cost-effectiveness and sustainability of China’s conservation set-aside program. Land Econ. 2005, 81, 247–264. [Google Scholar] [CrossRef]
  80. Yuan, Y.; Liu, Y.; Hu, Y.N.; Chen, X.; Peng, J. Identification of non-economic influencing factors affecting farmer’s participation in the paddy land to dry land program in chicheng county, China. Sustainability 2017, 9, 366. [Google Scholar] [CrossRef]
  81. Grange, L.D.; González, F.; Muñoz, J.C.; Troncoso, R. Aggregate estimation of the price elasticity of demand for public transport in integrated fare systems: The case of transantiago. Transp. Policy 2013, 29, 178–185. [Google Scholar] [CrossRef]
  82. Zhang, J.; Yan, X.; An, M.; Sun, L. The impact of beijing subway’s new fare policy on riders’ attitude, travel pattern and demand. Sustainability 2017, 9, 689. [Google Scholar] [CrossRef]
  83. Sumaila, U.R.; Teh, L.; Watson, R.; Tyedmers, P.; Pauly, D. Fuel price increase, subsidies, overcapacity, and resource sustainability. ICES J. Mar. Sci. 2008, 65, 832–840. [Google Scholar] [CrossRef]
  84. Aggarwal, S.K.; Saini, L.M.; Kumar, A. Electricity price forecasting in deregulated markets: A review and evaluation. Int. J. Electr. Power Energy Syst. 2009, 31, 13–22. [Google Scholar] [CrossRef]
  85. Zhong, L.J.; Mol, A.P.J. Water price reforms in China: Policy-making and implementation. Water Resour. Manag. 2010, 24, 377–396. [Google Scholar] [CrossRef]
  86. Beijing Water Authority. Beijing Water Resources Bulletin (2016); Beijing Water Authority: Beijing, China, 2017.
  87. Zhao, Y. Runoff Evolution of Small Basins in the Miyun Reservoir Watershed under Changing Environment; Beijing Forestry University: Beijing, China, 2014. [Google Scholar]
  88. Groom, B.; Liu, X.; Swanson, T.; Zhang, S. Resource Pricing and Poverty Alleviation: The Case of Block Tariffs for Water in Beijing. In Coping with Water Deficiency; Springer: Dordrecht, The Netherlands, 2008; pp. 213–237. [Google Scholar]
Figure 1. (a) Miyun Reservoir Catchment; (b) Miyun Reservoir with ample water; (c) Miyun Reservoir suffering from severe drought.
Sustainability 10 00170 g001
Figure 2. Distributions of consensus rate for agriculture and forestry PES program.
Sustainability 10 00170 g002
Table 1. Responses to the agriculture and Forestry payments for ecosystem services (PES) programs at each bid amount.
Bid Amount (yuan)Program Type
Agriculture PES ProgramForestry PES Program
YesNoConsensus Rate (%)YesNoConsensus Rate (%)
1500017021910
3000221931914
45005182241917
60009163652119
75009163671729
9000101442101245
10,5009153815865
11,25014115615479
12,0001967618482
12,7501738518290
13,5001829022292
14,25016010019195
15,00015194170100
Table 2. Summary of the variables included in the final model.
VariableVariable DescriptionMeanStd. Dev.
Household variables
Bid AmountThe cash subsidy amount that respondents are willing to accept for the proposed PES programs. (yuan/ha/year)91014130
LocationRespondent lives in Hebei or Beijing (Hebei, 1; Beijing, 0)0.50.5
PES ParticipationWhether respondent has participated in PES programs for MRS protection (e.g., PLDL) before or not. (Yes, 1; No, 0)0.20.4
AgeAge of household head (years)6011
EducationEducation years of household head (years)73
Household SizeHousehold size (persons/household)31.5
Household IncomeThe average annual income of household, including cropping, forestry, livestock, and off-farm (yuan/househod/year)38,01649,687
Land AreaLand area of per household (ha/household)1.56
Village variables
Village PopulationVillage population (persons/village)955734
Proportion of Off-farm EmploymentThe proportion of which off-farm employment population accounts for village population (%)0.340.14
Table 3. Results of logit model regression for the different PES programs and jurisdictions.
VariableAgriculture PES ProgramForestry PES Program
AllBeijingHebeiAllBeijingHebei
Constant−7.939 ***−9.897 ***−4.45−13.307 ***−15.993 ***−8.796 ***
−1.699−2.778−2.523−2.331−3.666−3.203
Household variables
Bid Amount0.0005 ***0.0005 ***0.0005 ***0.0007 ***0.0007 ***0.0007 ***
000000
Location3.491 ***--2.322 ***--
−0.826−0.869
PES Participation−0.5110.413-−0.966 *−0.49-
−0.534−0.816−0.599−0.846
Age0.006−0.0010.0220.048 **0.063 **0.033
−0.018−0.027−0.028−0.02−0.029−0.03
Education0.031−0.0160.0650.125**0.202 **0.044
−0.057−0.084−0.085−0.062−0.091−0.088
Household Size0.221 *0.427 **0.010.0830.229−0.016
−0.128−0.198−0.195−0.132−0.212−0.191
Household Income3.12 × 10−6−9.31 × 10−70.00002 *6.39 × 10−74.64 × 10−7−2.25 × 10⁻⁶
000000
Land Area0.1010.3570.0740.0650.1430.075
−0.087−0.477−0.081−0.061−0.57−0.063
Village variables
Village Population−0.002 ***−0.003−0.002 ***−0.001 *−0.003−0.001 *
0−0.002−0.001−0.001−0.002−0.001
Proportion of Off-farm Employment7.147 ***14.430 ***4.204 *10.110 ***13.765 ***9.348 ***
−1.806−4.731−2.189−2.108−4.629−2.642
Observations283140143283140143
Bid amount mean910988079404909390009184
LR chi2(8–10)191.2479.3394.5221.38107.02106.11
Prob > chi2000000
Notes: Standard errors are in parentheses. *** Significance at 0.01; ** significance at 0.05; * significance at 0.1. The households surveyed in Hebei have not been enrolled into any PES programs for MRC protection.
Table 4. Mean willingness to accept (WTA) and total economic values of agriculture and forestry PES program in the different jurisdictions.
JurisdictionAgriculture PES ProgramForestry PES Program
Mean WTA (yuan/ha/year)Area (ha) *Value of Restoring ES (Million yuan/year)Priority Area (ha)Rational Value of Restoring ES (Million yuan/year)Mean WTA (yuan/ha/year)Area (ha) *Value of Restoring ES (Million yuan/year)Priority Area (ha)Rational Value of Restoring ES (Million yuan/year)
All8531233,2961990841358.781871,106,298905766,667456.5
Beijing10,60711,4031213874.110,363319,749331400
Hebei6808221,8931511802654.66848786,549538666,667456.5
Note: * the data are cited from the results of MRC landscape zoning [76].

