Next Article in Journal
Estimation of Rural Households’ Willingness to Accept Two PES Programs and Their Service Valuation in the Miyun Reservoir Catchment, China
Next Article in Special Issue
The Influencing Factors, Regional Difference and Temporal Variation of Industrial Technology Innovation: Evidence with the FOA-GRNN Model
Previous Article in Journal
Improving Eco-Efficiency through Waste Reduction beyond the Boundaries of a Firm: Evidence from a Multiplant Case in the Ceramic Industry
Previous Article in Special Issue
Mobile e-Commerce Recommendation System Based on Multi-Source Information Fusion for Sustainable e-Business
 
 
Comment published on 19 December 2018, see Sustainability 2018, 10(12), 4851.
Article

A Bibliometric Analysis and Visualization of Medical Big Data Research

1
Business School, Sichuan University, Chengdu 610064, China
2
Medical Insurance Office,West China School of Medicine, Sichuan University, Chengdu 610041, China
3
Centre for Computational Intelligence, Faculty of Technology, De Montfort University, Leicester LE1 9BH, UK
4
School of Computer Science, University of Manchester, Manchester M13 9PL, UK
*
Author to whom correspondence should be addressed.
Sustainability 2018, 10(1), 166; https://doi.org/10.3390/su10010166
Submission received: 13 December 2017 / Revised: 1 January 2018 / Accepted: 9 January 2018 / Published: 11 January 2018
(This article belongs to the Special Issue Big Data and Predictive Analytics for Sustainability)

Abstract

:
With the rapid development of “Internet plus”, medical care has entered the era of big data. However, there is little research on medical big data (MBD) from the perspectives of bibliometrics and visualization. The substantive research on the basic aspects of MBD itself is also rare. This study aims to explore the current status of medical big data through visualization analysis on the journal papers related to MBD. We analyze a total of 988 references which were downloaded from the Science Citation Index Expanded and the Social Science Citation Index databases from Web of Science and the time span was defined as “all years”. The GraphPad Prism 5, VOSviewer and CiteSpace softwares are used for analysis. Many results concerning the annual trends, the top players in terms of journal and institute levels, the citations and H-index in terms of country level, the keywords distribution, the highly cited papers, the co-authorship status and the most influential journals and authors are presented in this paper. This study points out the development status and trends on MBD. It can help people in the medical profession to get comprehensive understanding on the state of the art of MBD. It also has reference values for the research and application of the MBD visualization methods.

1. Introduction

With the rapid development of “Internet plus”, almost all industry and business data shows explosive growth in recent years [1]. Big data is a common buzzword in business and research community, referring to great mass of digital data collected from various sources [2]. Big data has the characteristics of the “5V” [3]:
Variety: the data is from a variety of sources, and the types and formats of data are becoming richer. It has broken through the category of structured data previously defined, including semi-structured and unstructured data.
Volume: the volume of data is huge, including the amount of data that is collected, stored and calculated.
Velocity: it requires fast processing and fast access to high value information for different types of data, which is fundamentally different from those traditional data mining techniques.
Value: due to the huge amount of data generated with very fast speed and the inevitable formation of various valid and invalid data, the data density is greatly reduced. However, the rational use of big data will bring a very high value in return.
Variability: with the increasing use of social media, data load becomes challenging, which usually results in peak load of data for certain events.
Big data has received wide attention from the academia, the economic community and even the government [4]. In May 2011, McKinsey Global Research Institute (MGI) issued a report-Big data: The next frontier for innovation, competition, and productivity [5]. This study estimated that all companies stored 7.4EB newly generated data in 2010. It was also the first time for professional organization to introduce and look into big data. In January 2012, Davos, Switzerland, at the World Economic Forum, big data was one of the main themes. The report Big Data, Big Impact stated that big date has become a new category of economic assets [6]. In March 2012, the Obama Administration announced a “Big Data Research and Development Initiative” [7], which proposed to use big data to break through the technologies in the fields of scientific research, environmental protection, biological medicine research, education and national security.
Big data has attracted researchers in all fields, especially in the field of medicine [8]. In 2009, the Google Corporation analyzed billions of distinctive digital models with billions of search messages and developed the Google Flu Trends. When the outbreak of influenza A (H1N1) virus occurred in the United States, the source of influenza was identified in time. Chawla and Davis [9] presented a big-data-driven approach towards the personalized healthcare. The American Heart Association, through the investigation of cardiovascular data, proposed a future digital ecosystem for cardiovascular disease and stroke [10].
Bibliometrics is the cross-disciplinary science of quantitative analysis of all knowledge carriers by mathematical and statistical methods [11]. It is a commonly used method to identify the development of a certain field [12,13]. The earliest bibliometrics started in the early twentieth Century. In 1917, Cole and Eales respectively studied the growth of literature in comparative anatomy through bibliographical citations [14]. In 1969, the famous British scientist, Allen Richard, first proposed the term “Bibliometrics” instead of “statistical bibliography”. The emergence of this term marks the formal birth of bibliometrics. At present, more and more attention has been given to this research. The most obvious advantage of the bibliometrics is that it allows scholars to study specific research area by analyzing citations, co-citations, geographical distribution and word frequency, and draw very useful conclusions. Up to now, the bibliometrics has been widely used in hotspot research [15], co-authorship analysis [16], co-citation analysis [17], and the development of the whole subject fields [18].
The concept of medical big data (MBD) has been mentioned by more and more people, and has been widely used in all walks of life. However, the related work mainly concentrates on the engineering application, specifically on the data collection and storage. However, there is little research on MBD from the perspectives of bibliometrics and visualization. The visualization not only uses data mining technology to excavate useful information from data, but also displays the information obtained by data mining technology to users intuitively. In addition, it is also very important to conduct a systematic literature review especially at the initial phase of the study about MBD to ensure good quality results. Therefore, it is necessary for us to make a comprehensive overview on this research direction and find out some basic patterns of MBD-related research. Motivated by this idea, this paper aims to adopt the bibliometric analysis and visualization on MBD to explore the characteristics of this area.
The rest of this paper is organized as follows: In Section 2, we introduce the data source and methods used in this study. Section 3 illustrates the results in detail, including the current status of MBD study, the analysis of research hotspots, the co-authorship analysis and the co-citation analysis. Section 4 summarizes the whole paper and significant results are discussed in this section.

2. Data and Methods

The literature data used in this study were downloaded from the Science Citation Index Expanded (SCIE) and the Social Science Citation Index (SSCI) databases in Web of Science. SCIE and SSCI are the most frequently-used databases in bibliometric analysis [19,20,21]. These two databases cover more scientific and authoritative publications than other databases. What is more, SCIE and SSCI provide citation information, keywords and references. We took “medical big data” as topical retrieval and the time span was defined as “all years” (However, according to the returned results, we know that the first publication in MBD was appeared in 1991). The literature type was defined as “all types”. In total, 988 documents met the selection criteria. Ten document types were found in these 988 publications. The most frequent document type is article (807), accounting for 81.7% of total publications. At the second position is review (98), with a proportion of 10.7%. Other document types including editorial material (36), proceedings paper (25), meeting abstract (12), book chapter (5), letter (2), book review (1), correction (1), news item (1). Table 1 lists the numbers and proportions of various document types. All documents were downloaded on 7 October 2017 in tab separator format.
Science mapping is an essential procedure of bibliometrics [22]. It can represent the discipline situation and development status [23]. There are many softwares for bibliometrics analysis. VOSviewer (Centre for Science and Technology Studies, Leiden University, Leiden, The Netherlands) and CiteSpace (Chaomei Chen, China) were used to make visualization mapping in this paper. CiteSpace [24] is effective in information visualization. It is used to obtain the quantitative and visual information in specific fields [25]. In this paper, we use CiteSpace to make keywords timeline picture. VOSviewer is a free software developed by Eck and Waltman [26]. It has a powerful function in co-occurrence analysis and co-citation analysis. GraphPad Prism 5 (GraphPad Prism Software Inc., San Diego, CA, USA) was used to make histograms and line charts. There are other kinds of bibliometrics softwares. Each software has advantages in one or several specific functions. For example, VOSViewer has a friendly graphical user interface that allows us to view the generated maps easily; Citespace is capable of visualizing the networks utilizing various layouts [27]. In this paper, we use VOSviewer to make co-authorship networks and co-citation networks, and then use Citespace to make keywords timeline view.

3. Results

In this section, we present the results of this paper in details in terms of four parts. The current status of MBD study is presented in Section 3.1. Section 3.2 introduces the keywords analysis of the research hotspots on MBD. The co-authorship analysis and the co-citation analysis are displayed in Section 3.3 and Section 3.4, respectively.

3.1. The Current Status of MBD Study

In this part, we discuss the annual trends of MBD-related publications, the distribution of MBD-related publications in perspectives of institutes and journals, and the citation and H-index analysis.

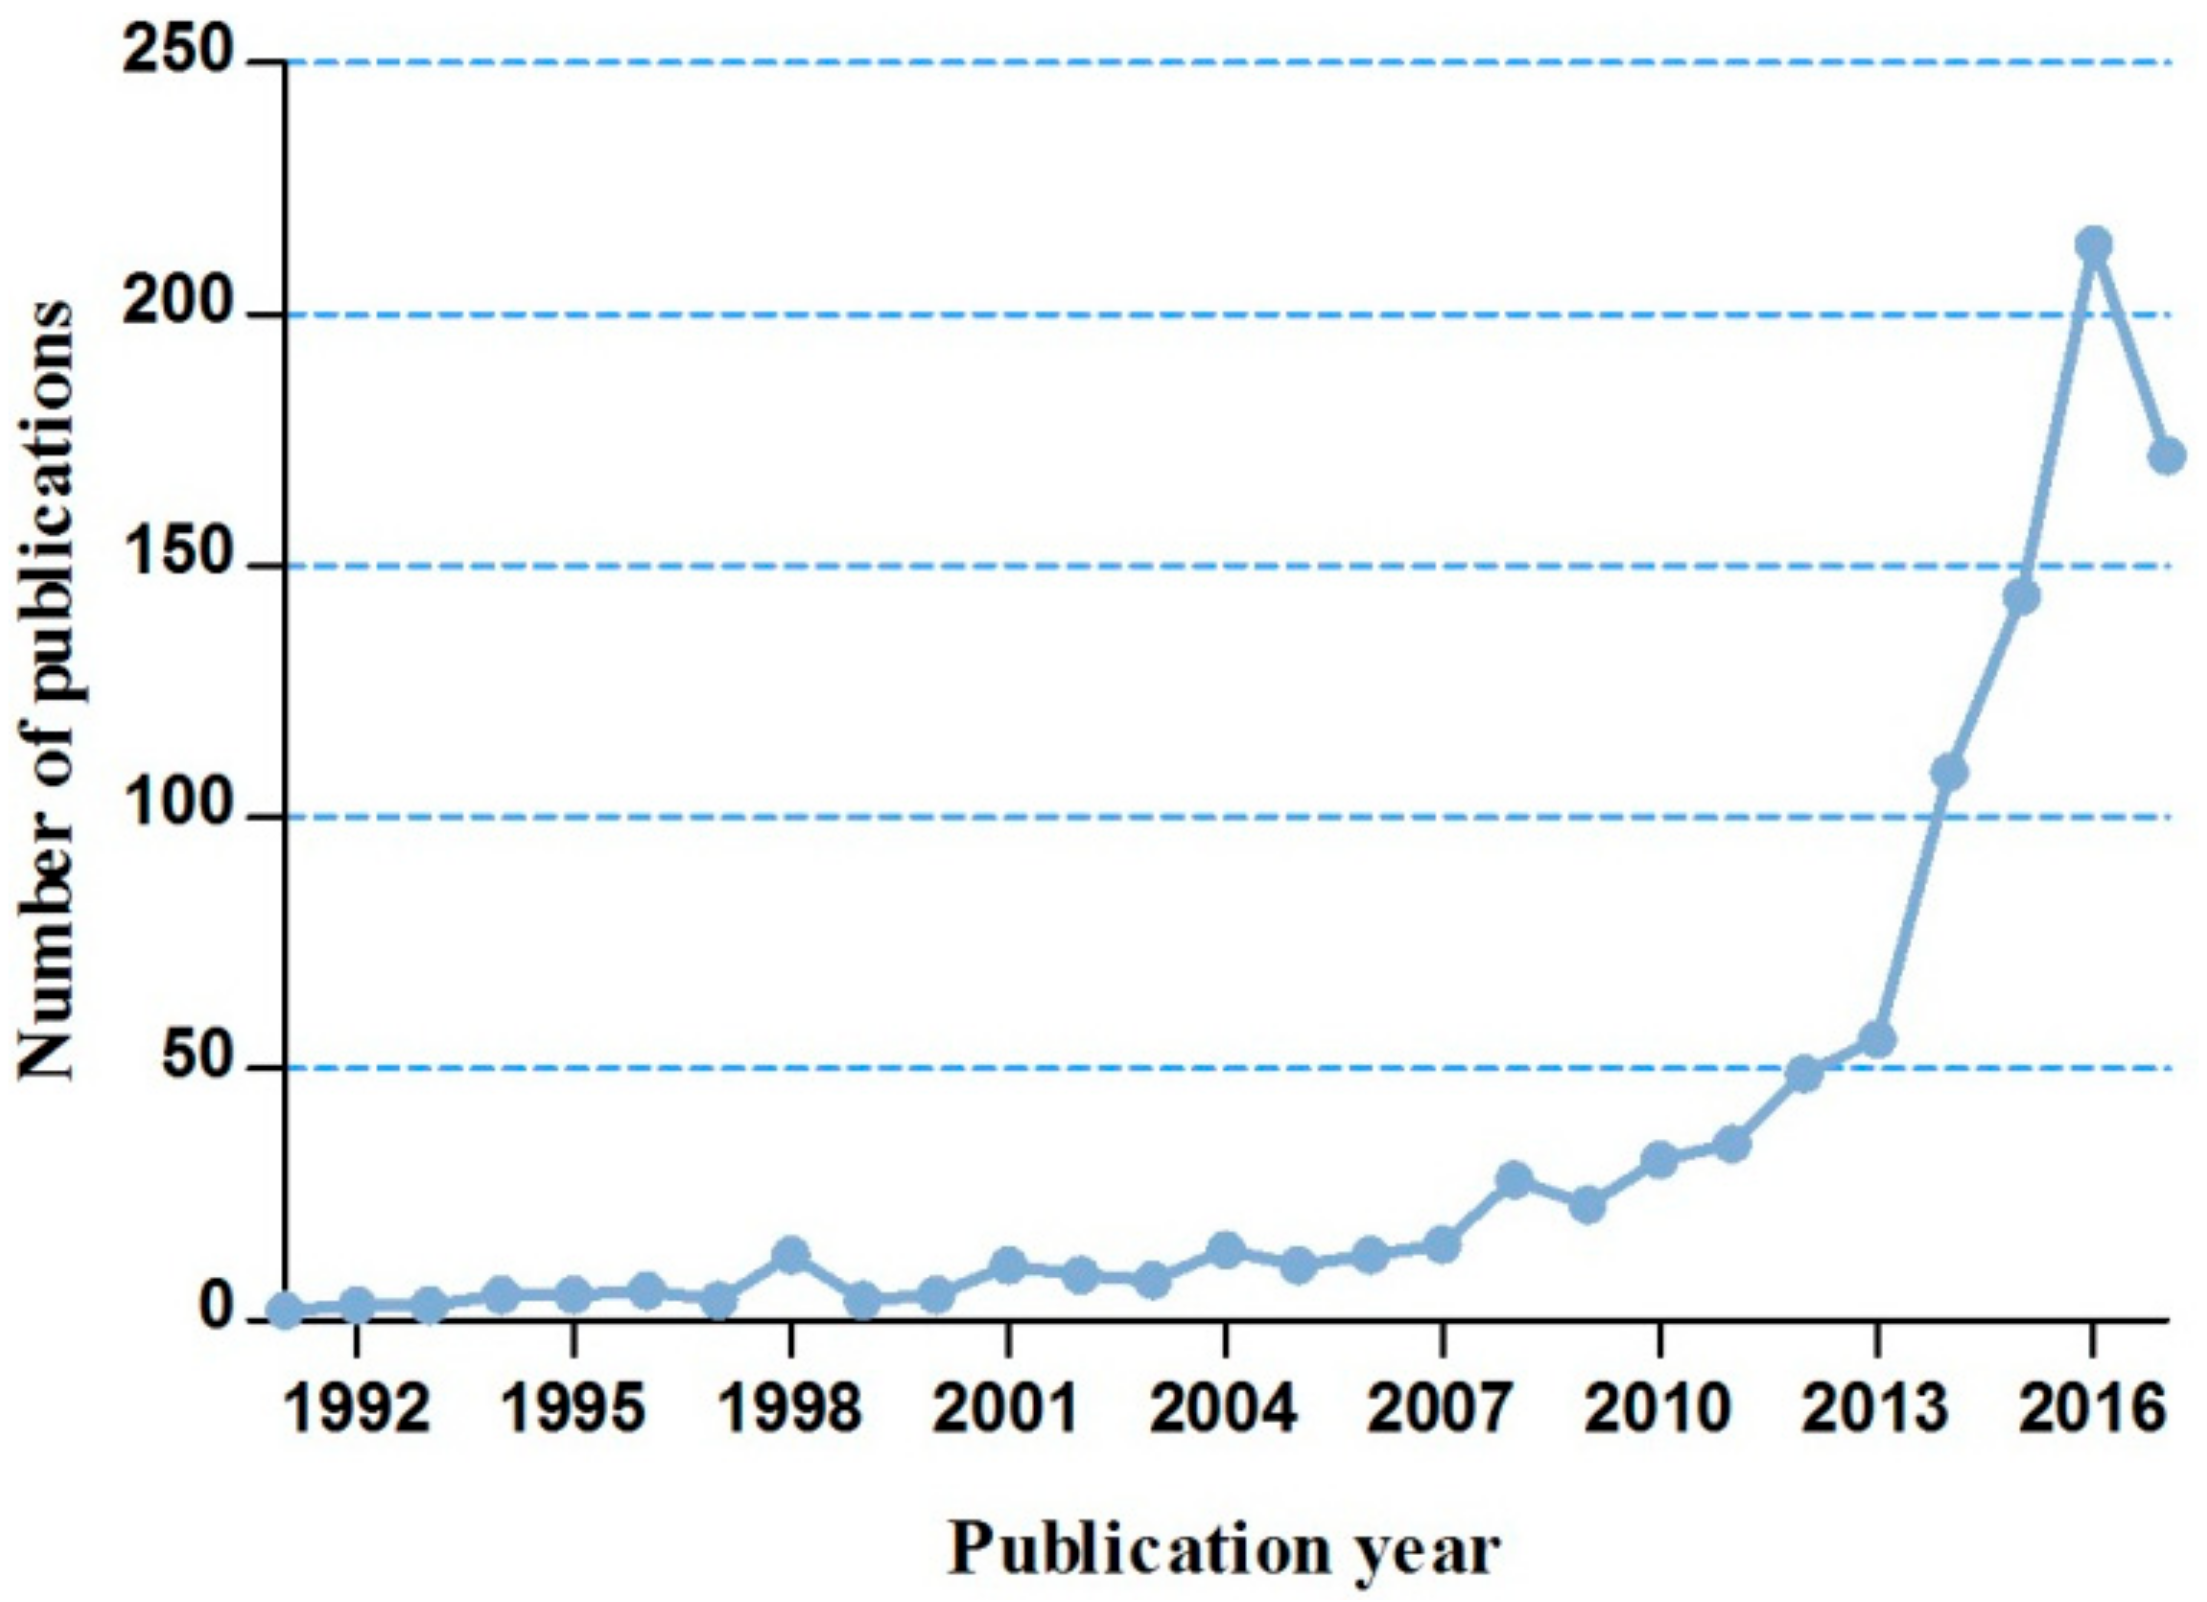
3.1.1. The Annual Trends of MBD-Related Publications

Figure 1 plots the annual trends of MBD-related publications. Since the first article was published in 1991, the MBD-related research obtained very slow increase in the following 20 years. Until 2011, especially after 2013, more and more scholars started to research in this field. This led to a jump in the number of publications. There are many reasons for the rapid growth. Firstly, with the rapid development of internet technology, people were more likely to obtain massive medical data. Furthermore, in March 2012, the Obama Administration officially launched the Big Data Research and Development Initiative with an investment of more than US $200 million [7]. The study of big data has attracted people from all walks of life. More and more countries begun to devote themselves to the researches and applications of MBD.

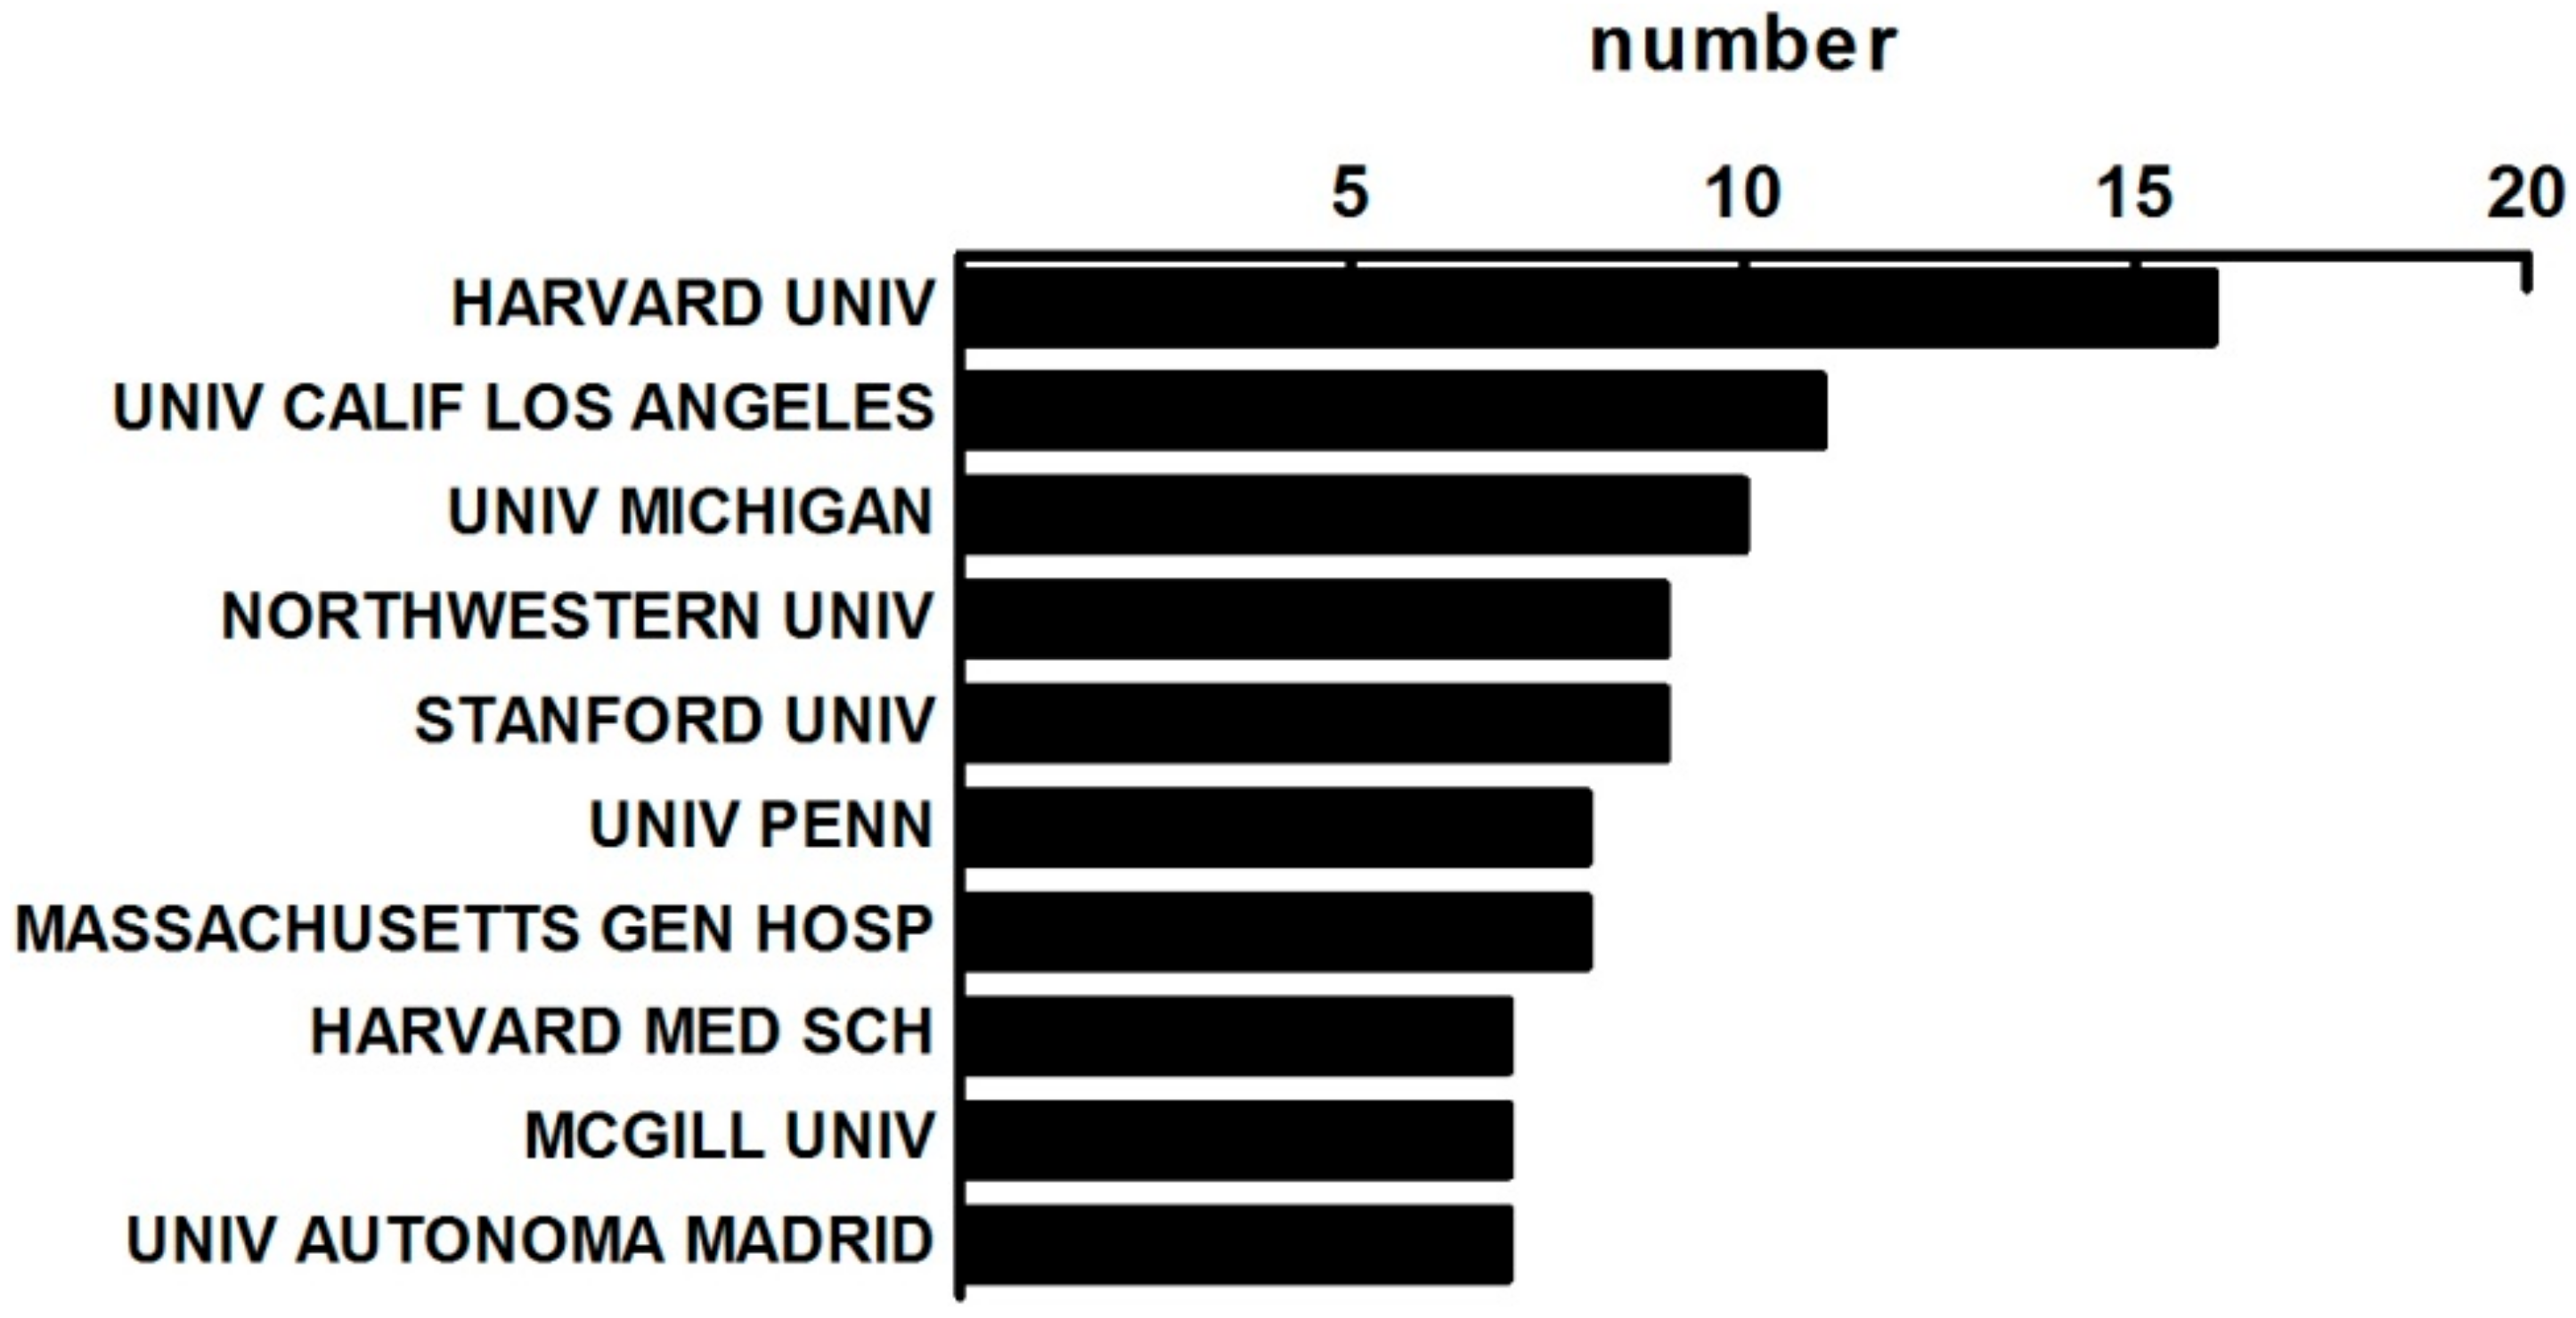
3.1.2. The Distribution of Institutes on MBD Study

Harvard University has the greatest number of publications with a total of 16 papers, accounting for 1.62% of all publications in this field. Bates et al. [28] from the Harvard University presented six cases to reduce the costs of healthcare through the use of MBD. Their findings have the policy implications for regulatory oversight, the way to address privacy concerns, and the assist of research on analytics. At the second position is the University California Los Angeles with 11 publications followed by the University Michigan, the Northwestern University, and the Stanford University. There are 8 American institutes in the top 10 institutes with 1 Canadian institute and 1 Spanish institute. The top 10 institutes are listed in Figure 2. From Figure 2, we can find that there are less than 100 papers from the top 10 institutes related to MBD, which implies that MBD is a very new research topic.

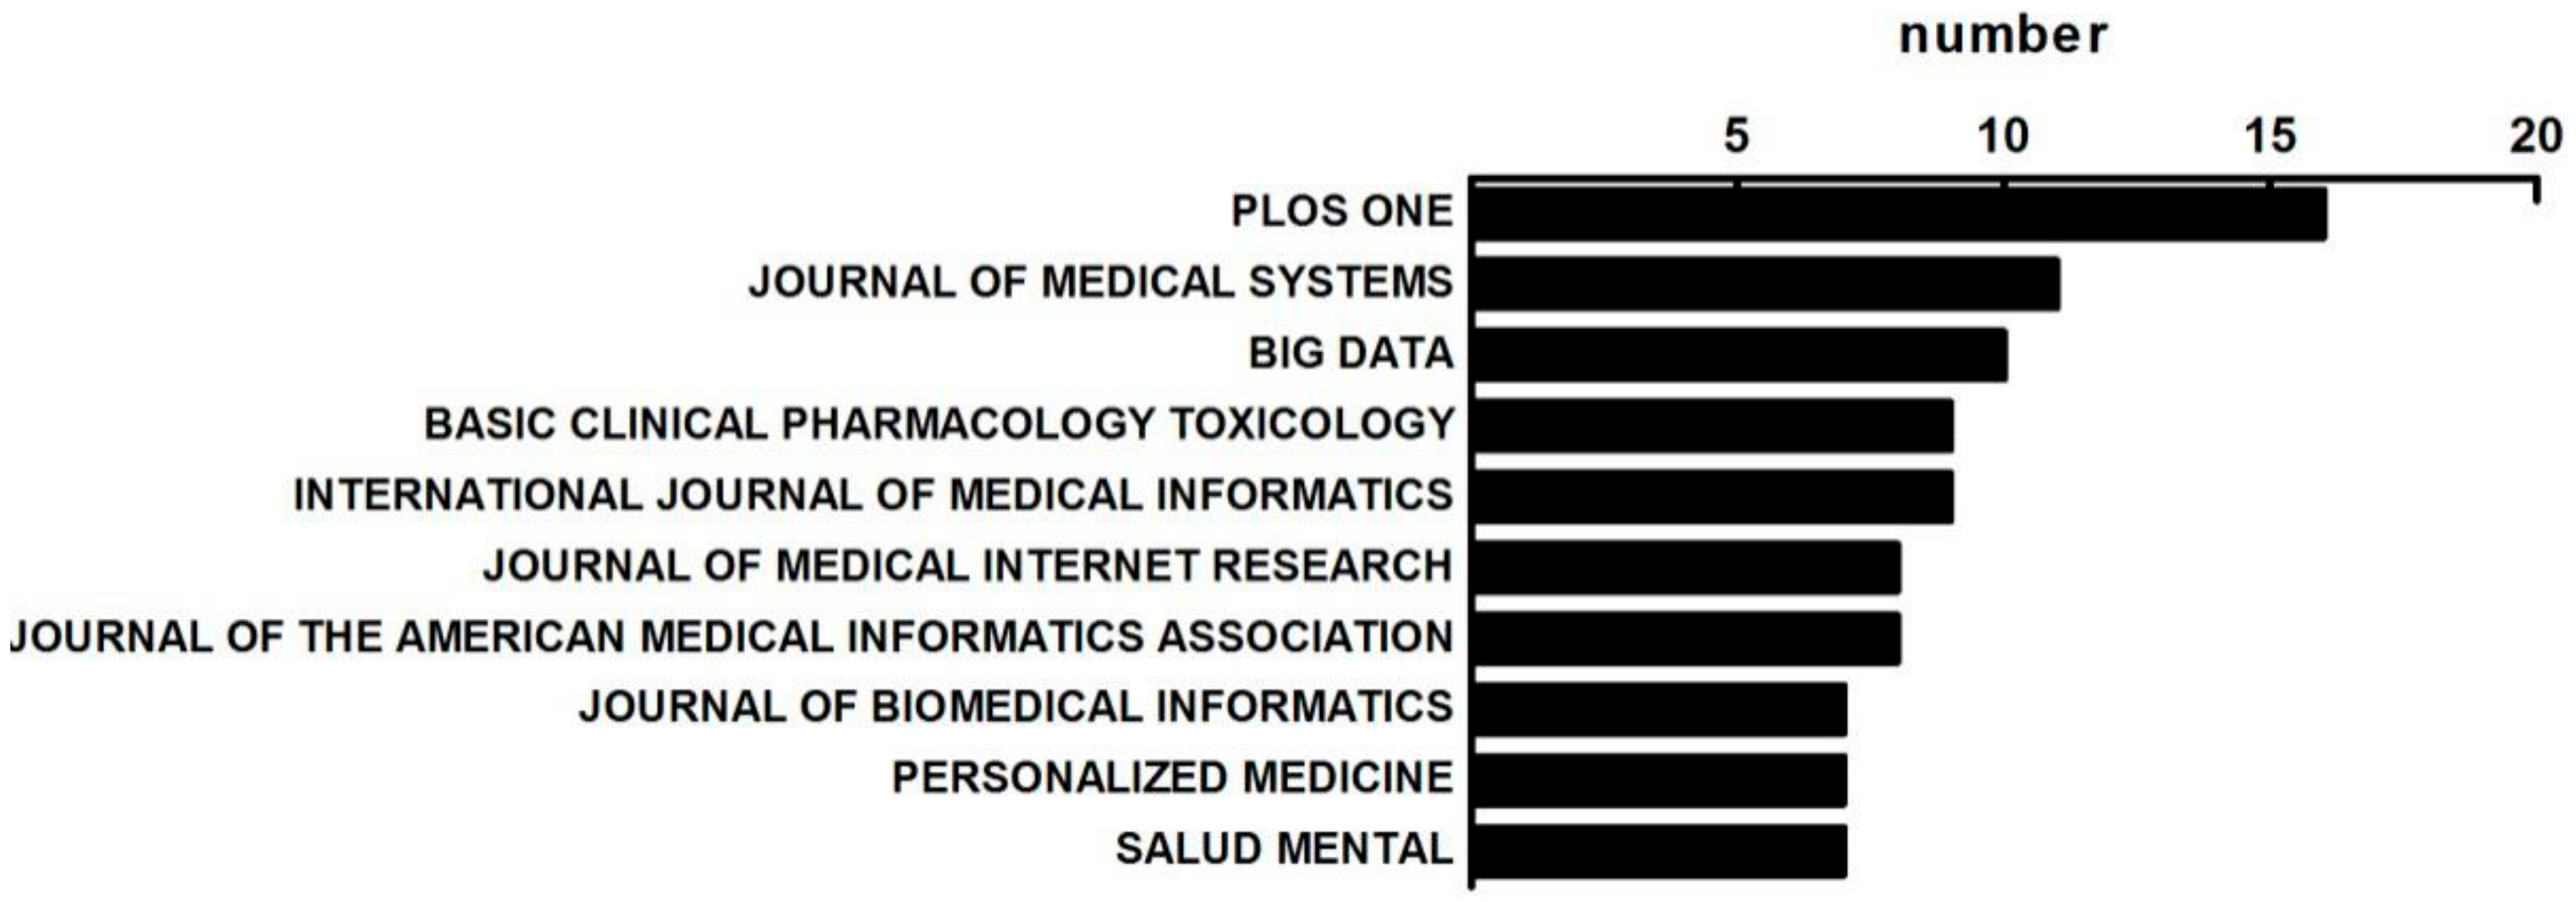
3.1.3. The Distribution of Published Journals on MBD Study

All these 988 publications were published in 212 journals. In addition, 155 (73.1%) journals published no more than 2 papers. It is observed that 9.3% of the publications (92 papers) were published in the top 10 journals. The articles are scattered in MBD-related fields. This phenomenon is mainly because MBD is a new research direction and the study on MBD has not yet formed a systematic hierarchy. The journal with the greatest number of publications is PLoS ONE, with a total of 16 papers. Only 2 journals have published more than 10 papers. The top 10 journals that published the most papers are showed in Figure 3.

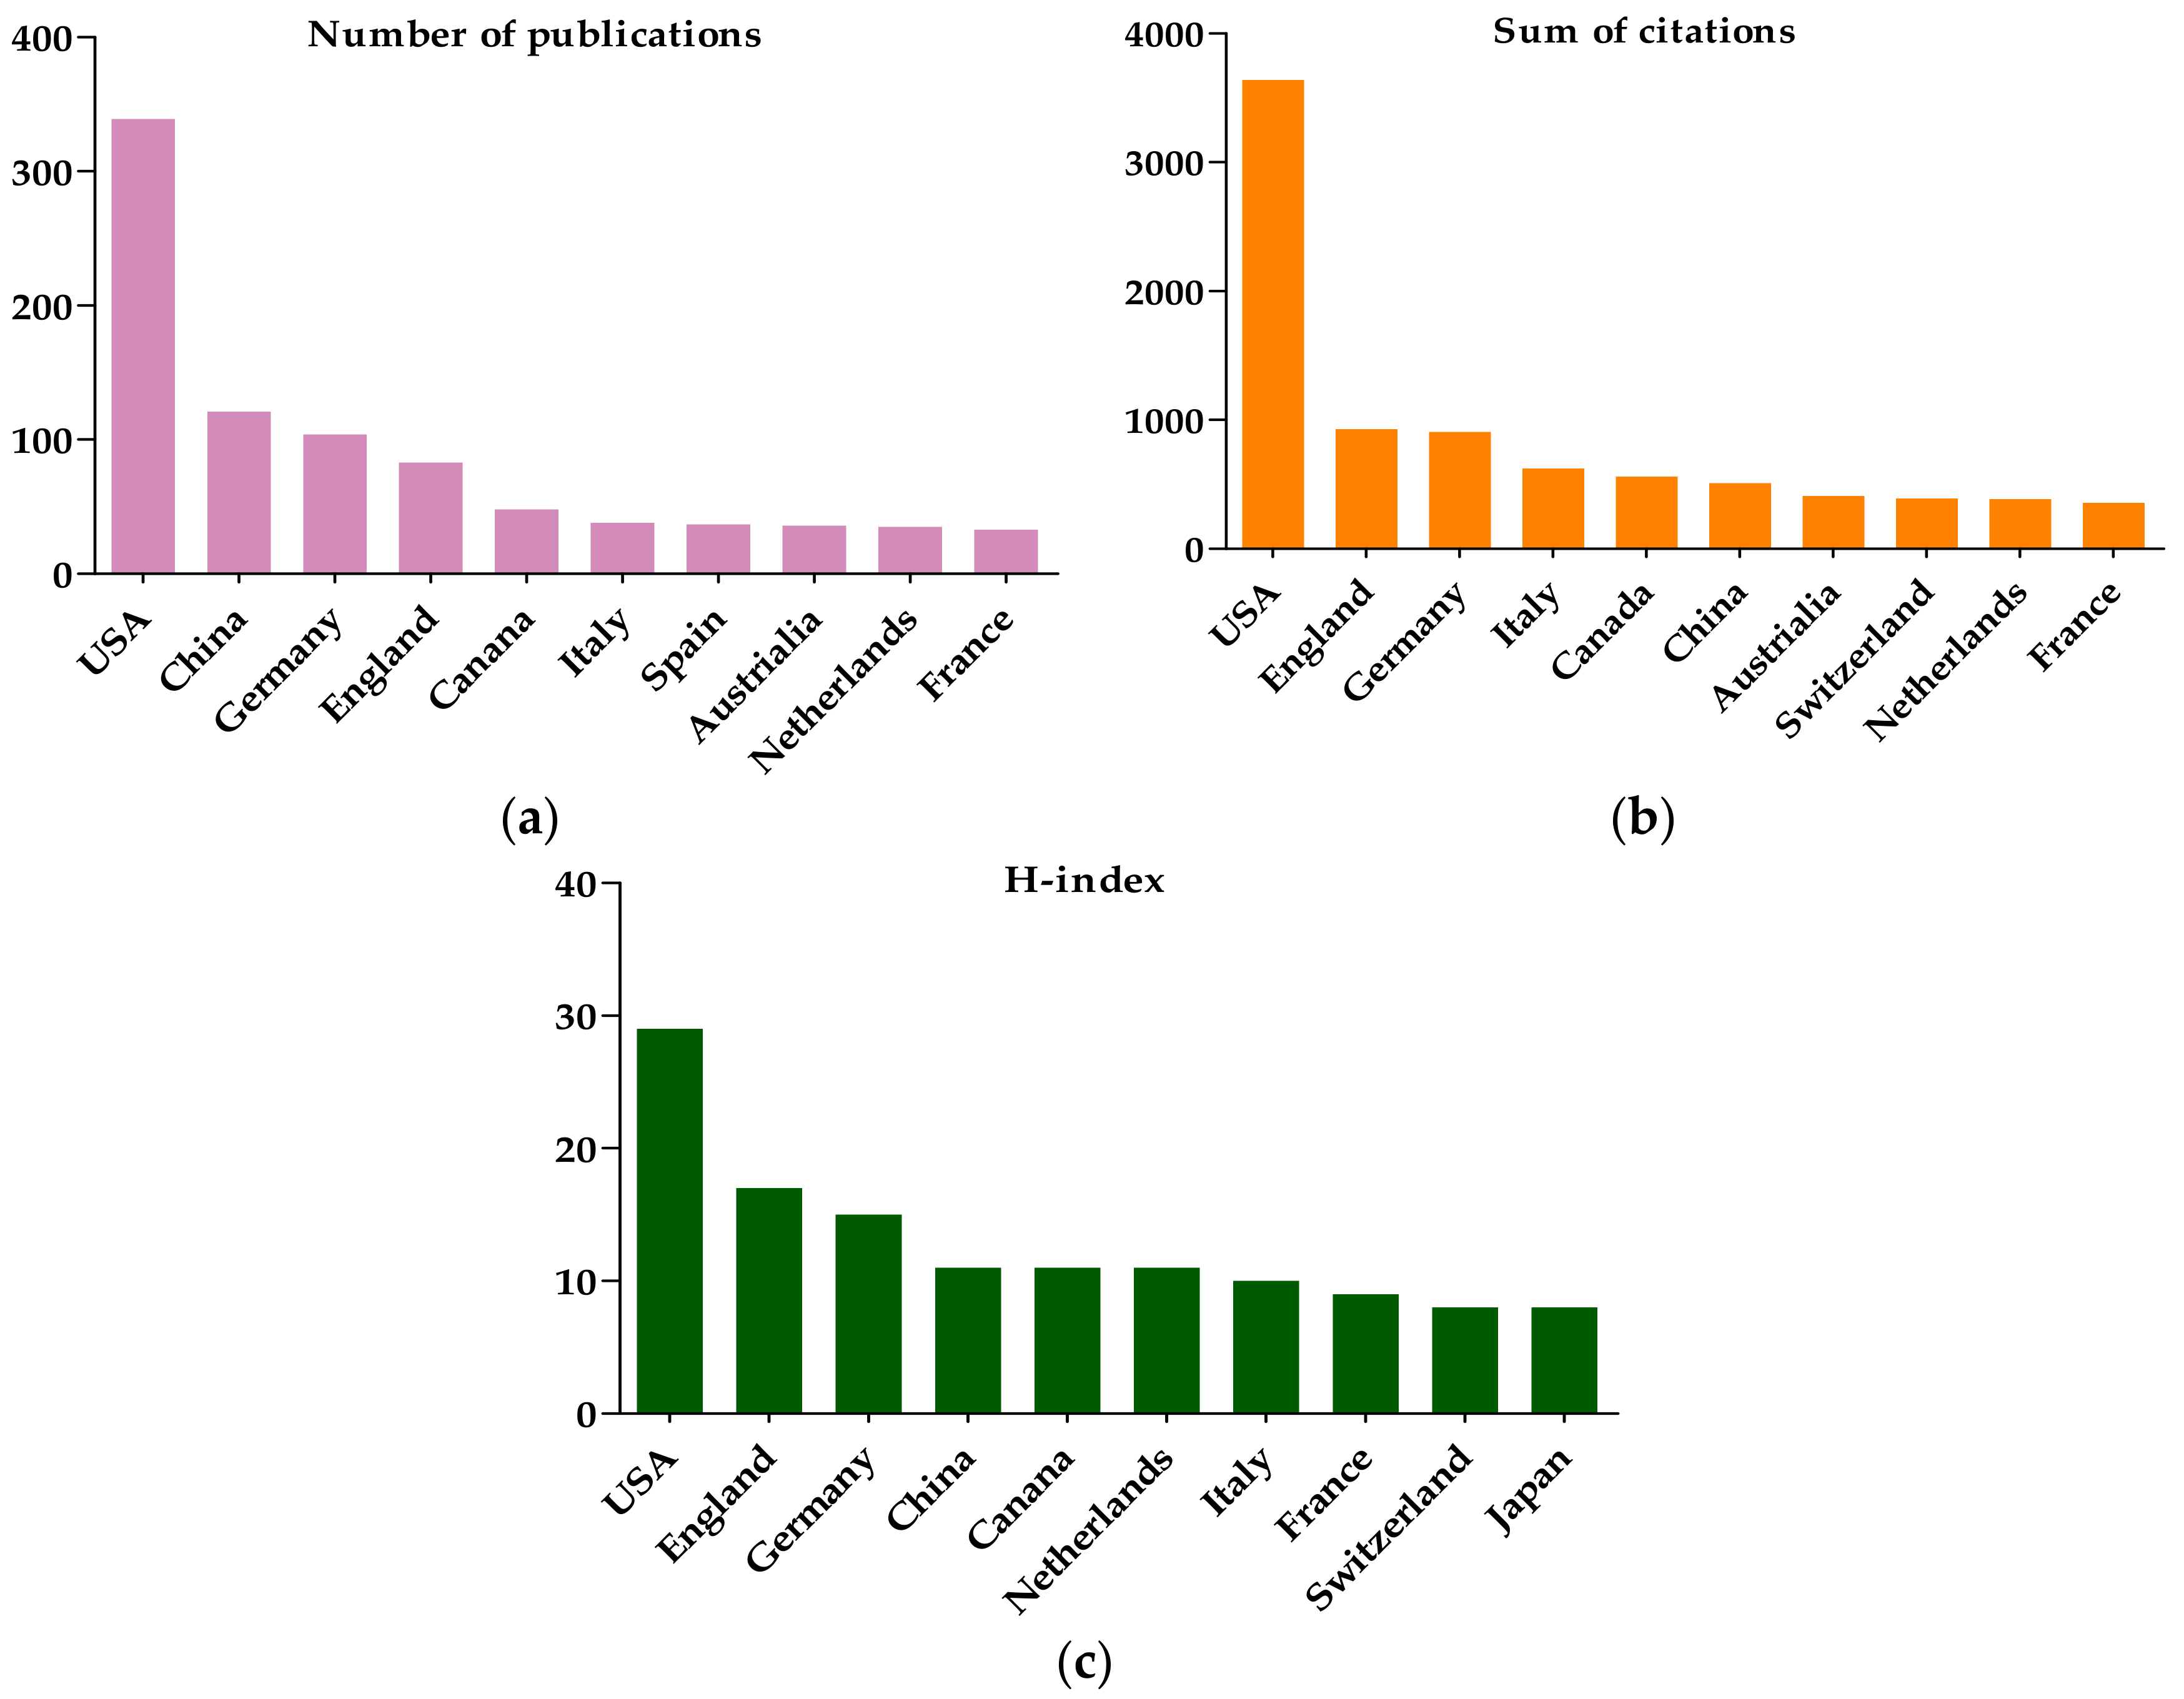
3.1.4. The Citation and H-Index Analysis

The number of citations is the main factor to reflect the quality of a paper [29]. According to the analysis of the data from Web of Science, all MBD-related publications were cited 8023 times. The number of citations from USA was 3644, accounting for 45.4% of the total citations. At the second position is England with 930 citations.
H-index, also known as H index or H factor (H-factor), stands for “high citations”. In 2005, an American scientist, Hirsch, proposed to use H-index to evaluate the core scientists for academic evaluation [30]. A researcher’s H-index means that he/she has at most H papers that were cited at least H times [31]. H-index was widely deemed as a reliable and authentic parameter to quantify an individual’s scientific achievements [32]. The USA ranks first with the highest H-index of 29. Germany’s H-index is 15. China ranks second in the number of articles published (121), but the citation frequency (510) and the H-index (11) rank sixth and forth, respectively. This implies that the quality of the publications in China needs to improve, comparing to those top tier countries (Please refer to Figure 4 for details).

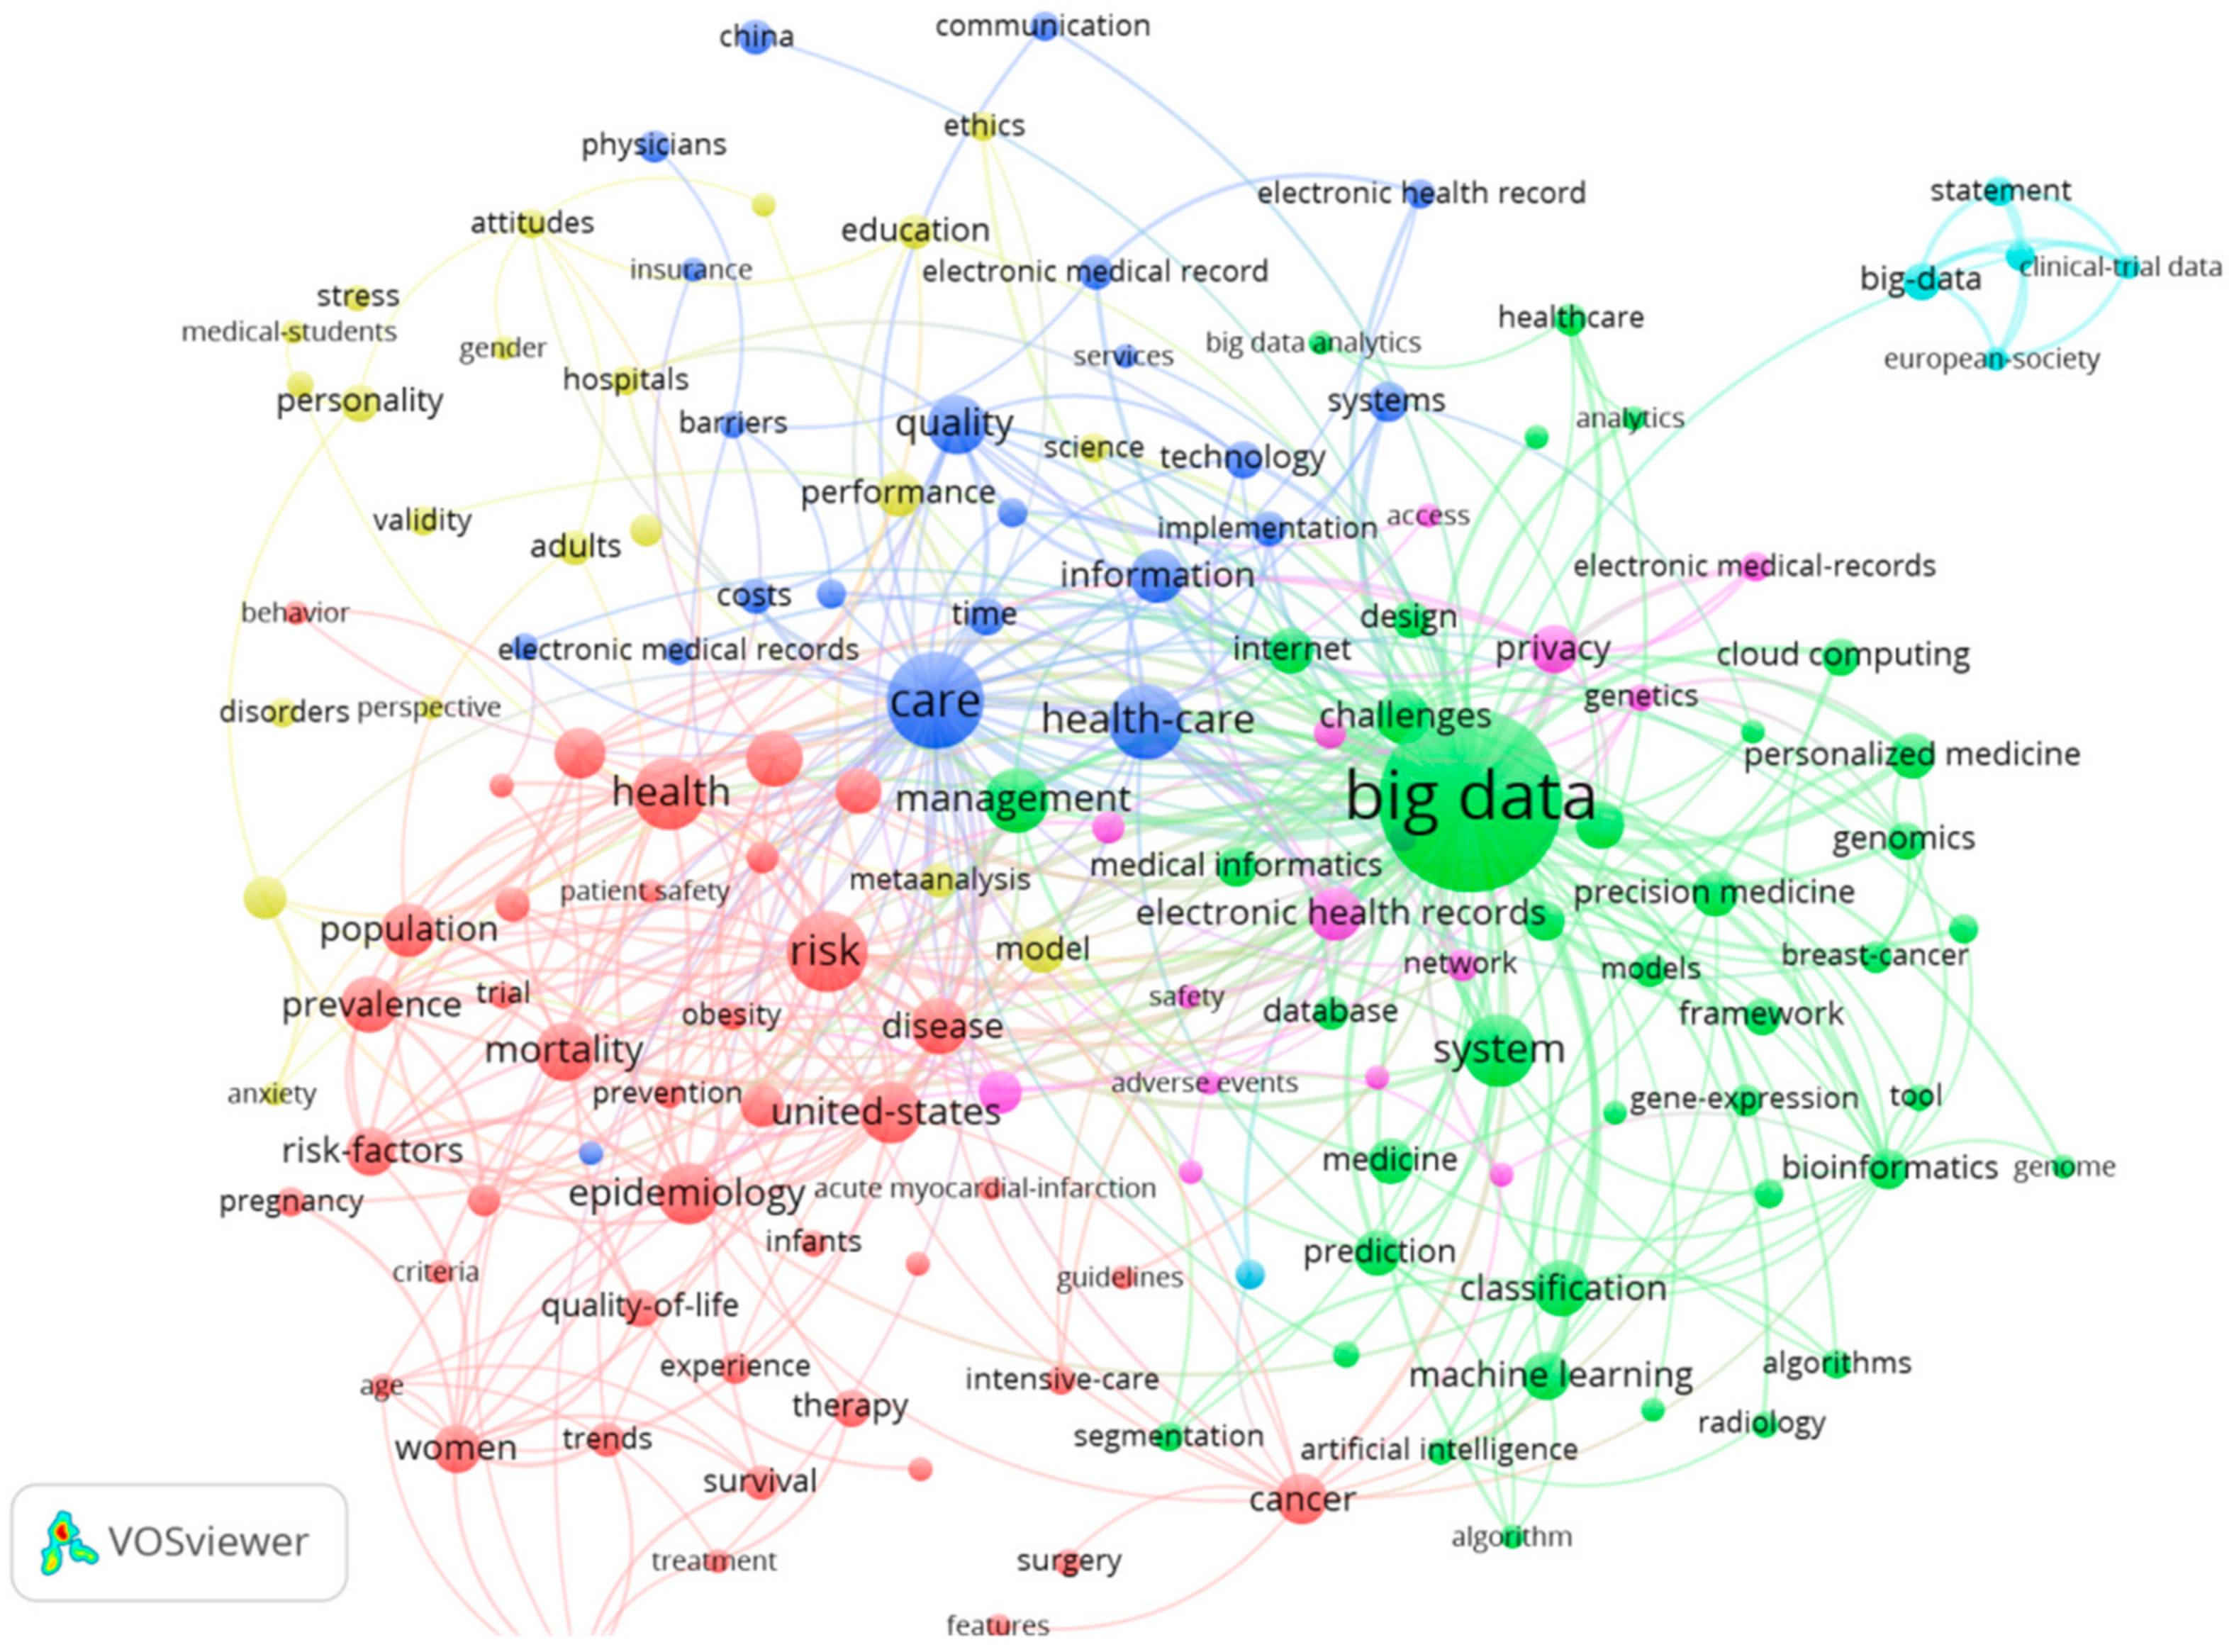
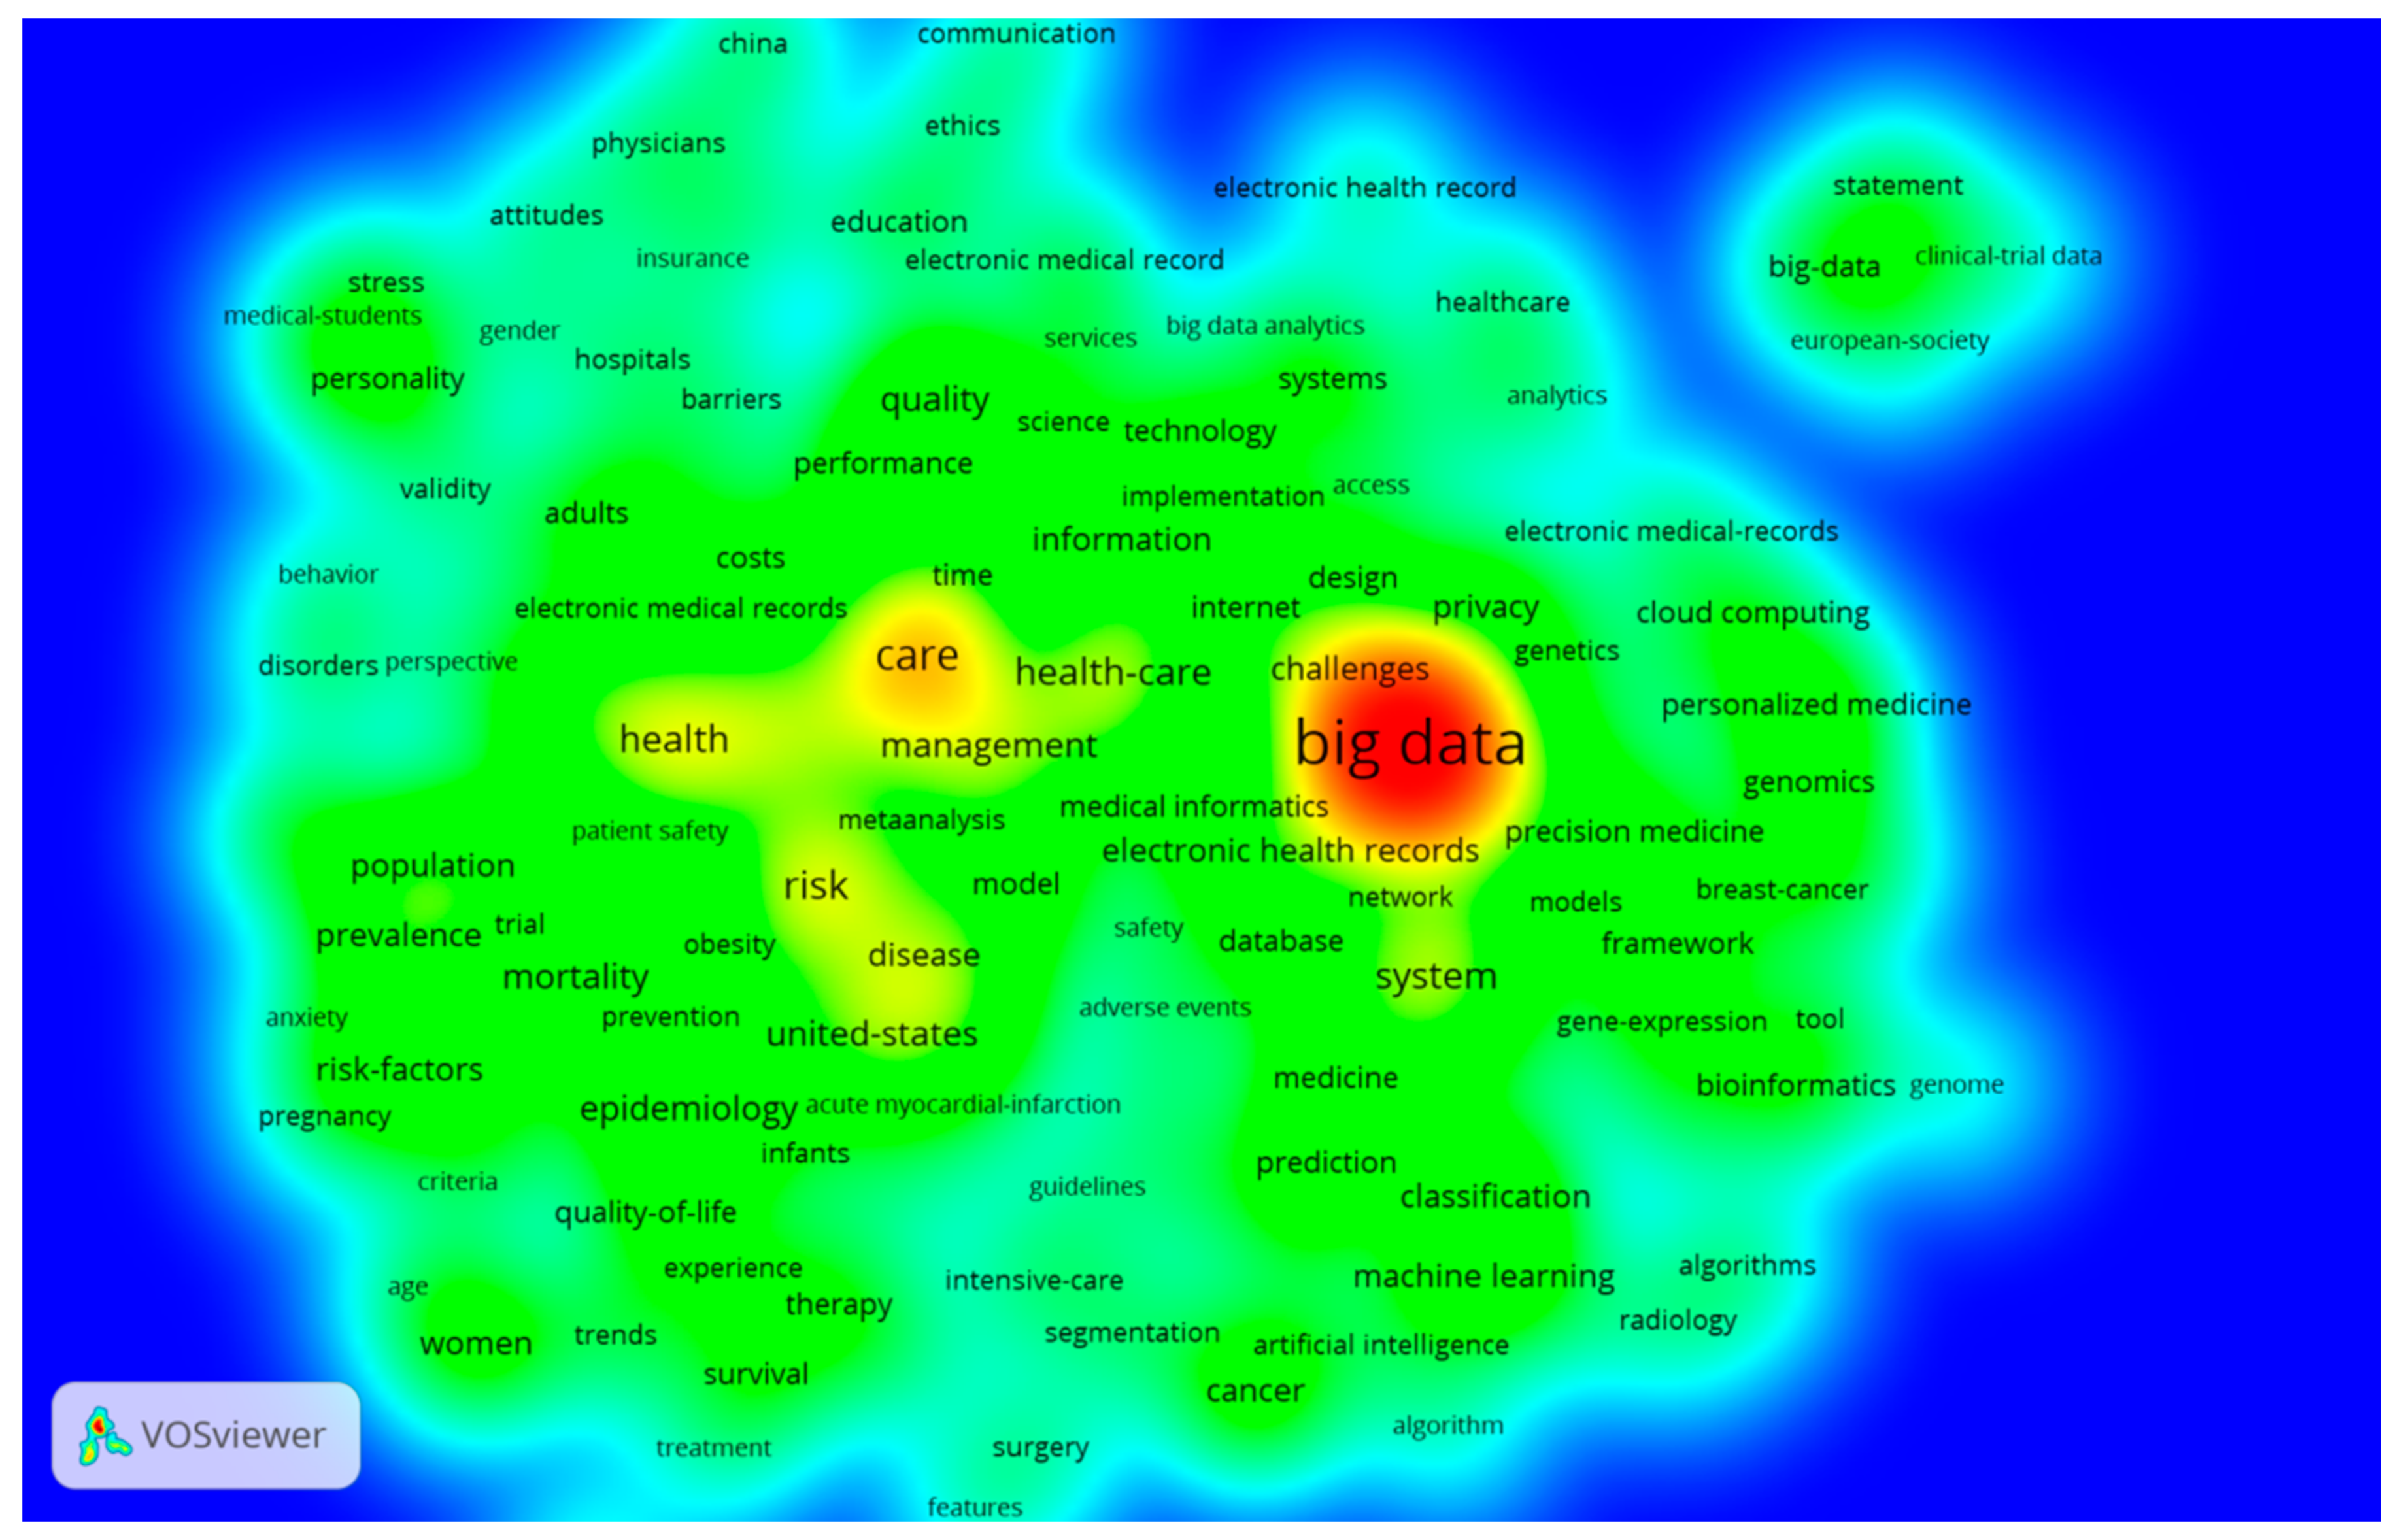
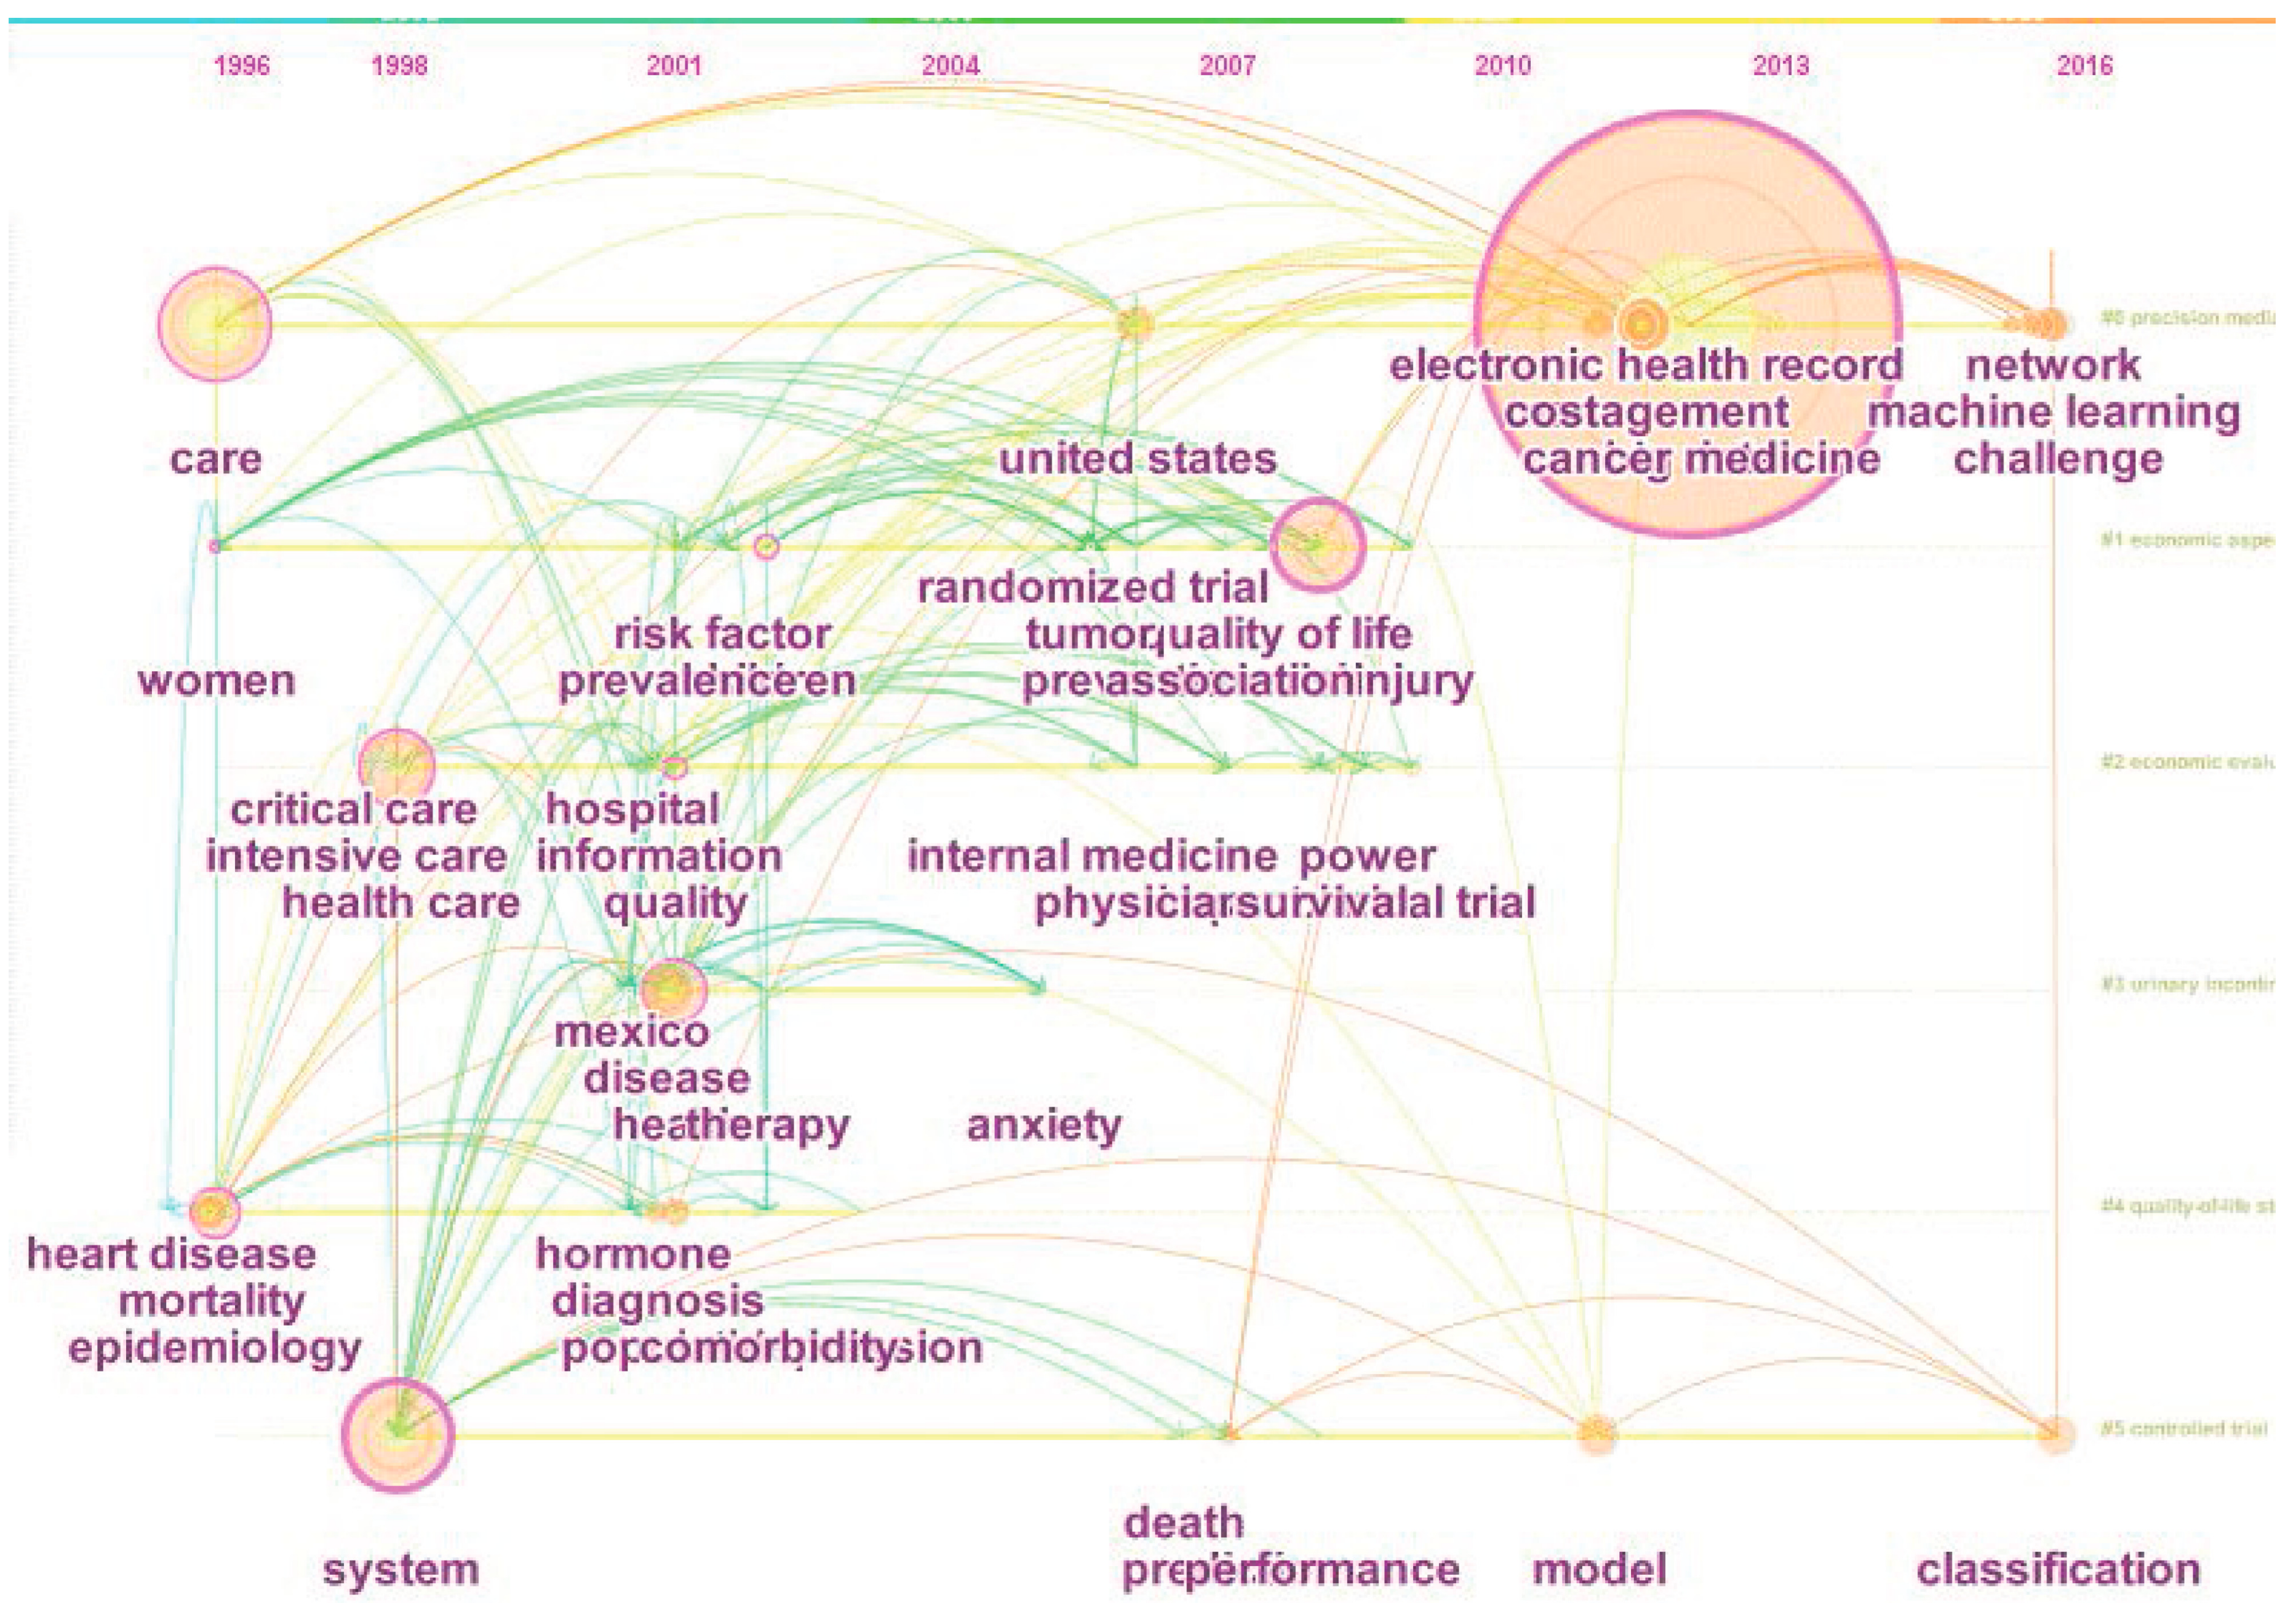
3.2. The Keywords Analysis of Research Hotspots on MBD Study

In this part, we study the content by analyzing the distribution of keywords. The keywords co-occurrence network map, the top 10 keywords in MBD publications, the keywords density visualization map and the keywords timeline view will be shown.
Keywords co-occurrence can effectively reflect the research hotspots in the discipline fields, providing auxiliary support for scientific research [33]. In all the 988 MBD-related publications, we obtained 5591 keywords altogether. Among them, 4579 keywords appeared only once, accounting for 81.9%.
The keyword co-occurrence network of MBD (see Figure 5) was constructed by the VOSviewer software. The size of the nodes and words in Figure 5 represents the weights of the nodes. The bigger the node and word are, the larger the weight is. The distance between two nodes reflects the strength of the relation between two nodes. A shorter distance generally reveals a stronger relation. The line between two keywords represents that they have appeared together. The thicker the line is, the more co-occurrence they have [34]. The nodes with the same color belong to a cluster. VOSviewer divided the keywords of MBD-related publications into 7 clusters. The keyword “big data” has a highest frequency of 203. Other keywords with a high frequency include “care” (70), “risk” (50), and “health-care” (45).
The link strength between two nodes refers to the frequency of co-occurrence. It can be used as a quantitative index to depict the relationship between two nodes [35]. The total link strength of a node is the sum of link strengths of this node over all the other nodes. The node, “big data”, has thicker lines with “care” (19), “risk” (14), “data mining” (12), “machine learning” (13), “electronic health records” (18), “challenges” (14), “systems” (13), “privacy” (15), and “personalized” (15). These are all the nodes whose link strengths are greater than 10. The relationships between “big data” and “care” as well as “risk” imply the close integration of big data and medical treatment. The relationships between “big data” and “data mining”, “machine mining”, “challenges” and “electronic health record” reflect that the MBD study needs the support from some professional techniques. The relationships between “big data” and “privacy” as well as “personalized” show the development trends of personalized medical care and the importance of privacy in healthcare. Personalized medicine can be defined as a method of treatment and prevention of disease, which takes into account the individual variability of genes, environments and lifestyles in each subject [36]. By taking this approach, it is possible to treat the right patient at the right time, because preventive measures and treatments can be tailored to each individual [36]. The top 10 keywords with their frequencies and total link strengths are shown in Table 2.
VOSviewer can make density visualization (see Figure 6). Each node in the keywords density visualization plat has a color that relies on the density of items at that node. In other words, the color of a node depends on the number of items in the neighborhood of the node. The keywords in red color area appear more frequently; on the contrary, the keywords in green color area appear less frequently. Density views are especially useful for understanding the overall structure of a map and drawing attention to the most important areas in the map [9]. From Figure 6, we can see the research focuses of MBD study intuitively. “big data”, ”care”, “risk” turn out to be important. These keywords are the core keywords in the MBD study.
We can make the timeline view by the Citespace software (see Figure 7). It can be seen from Figure 7 that, before 2000, the research on MBD is little and the keywords of that period are concentrated on “women”, “mortality” and “pregnancy”. The research on MBD at this stage is somehow foundational. Entering twenty-first century, the research on MBD began to increase, and the types of keywords are also very extensive. But the keywords in terms of disease, such as “diagnose”, “clinical trial”, “cohort”, “breast cancer” and “risk”, account for large proportions. After 2010, the research issues of MBD had an evolution. There are two main directions: one is the support technique for big data, like “data mining”, “database” and “machine learning”; the other is concerning medical care for specific individuals, like “personalized medicine”, “privacy” and “personality”. This indicates that the MBD study was developing from a disease-centered model towards a patient-centered model [37]. It is noted that the keyword “big data” showed a trend of concentration in 2012. This can be partly attributed to the Obama administration’s big data research and development program. Table 3 lists the keywords of MBD-related publications appeared during different periods.

3.3. The Co-Authorship Analysis on MBD

It is difficult for a person to complete a research on a certain subject individually. Many research projects need collaborative strength to complete. Co-authorship research is an important content of bibliometrics and the level of research collaboration is an index to assess the current status of research in a specific field [38]. In this part, we mainly present the country co-authorship analysis, the institute co-authorship analysis and the highly cited MBD-related publications. We make the co-authorship network with the help of the VOSviewer software.

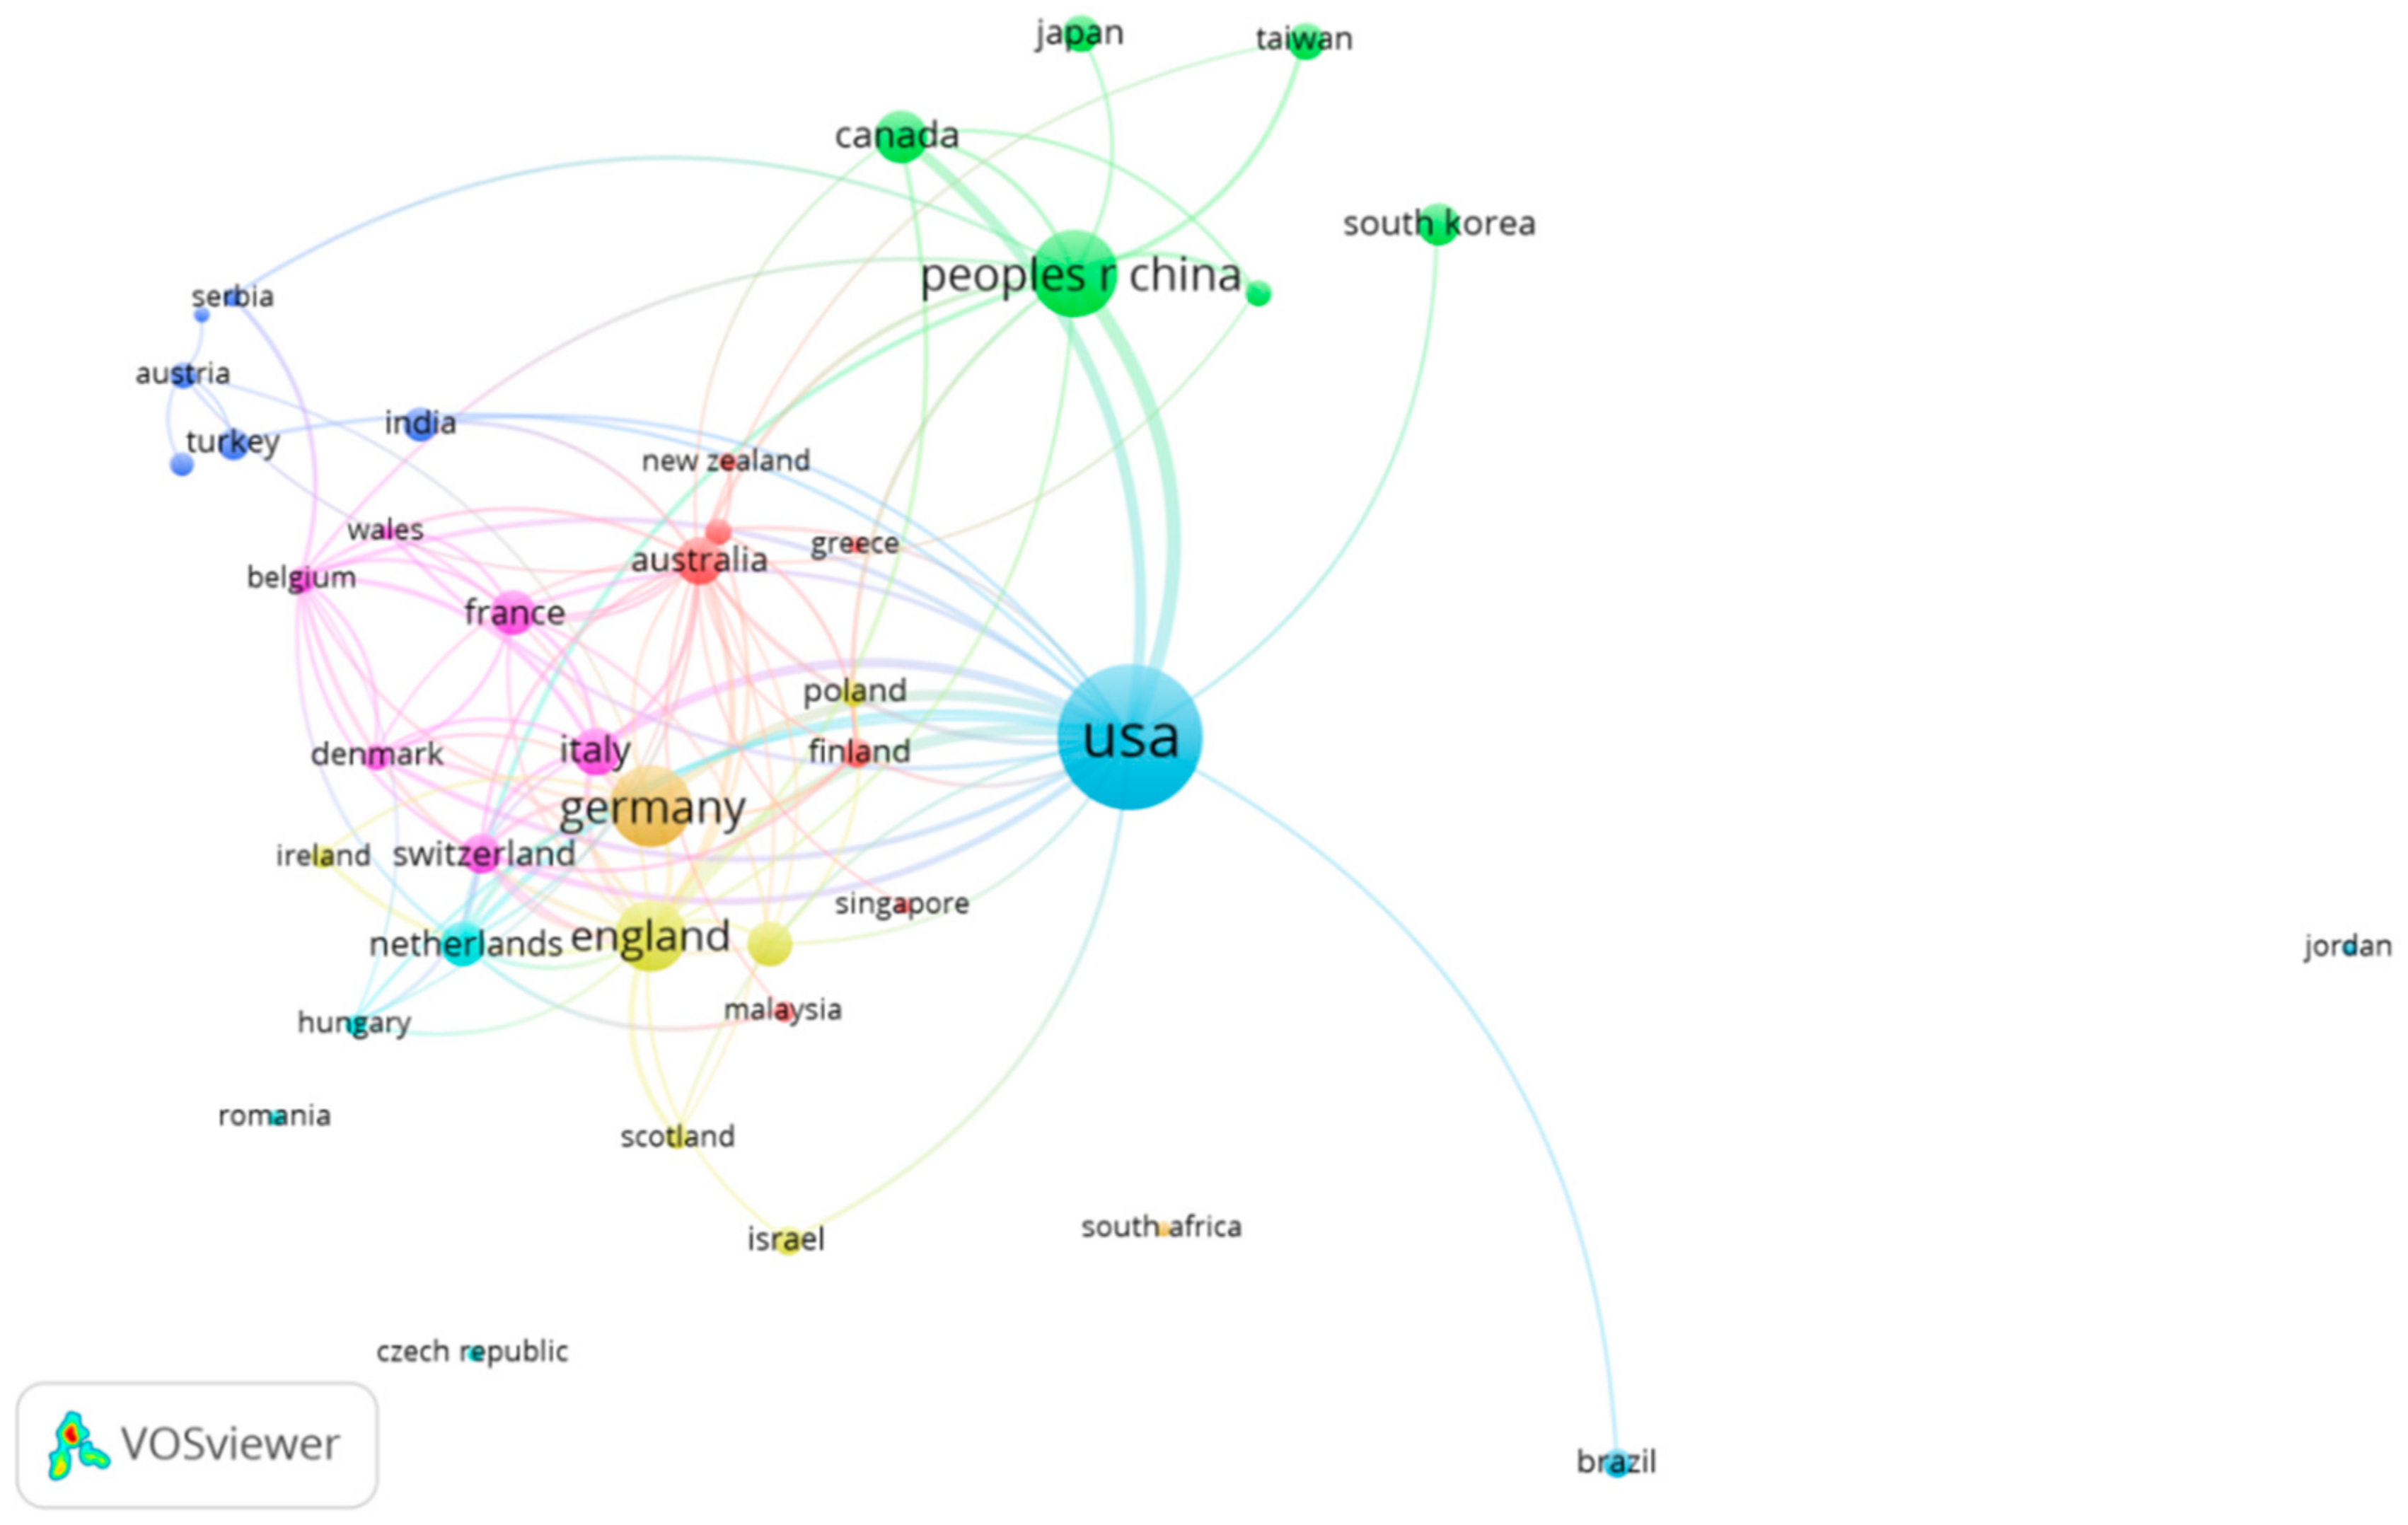
3.3.1. The Country Co-Authorship Analysis

Country co-authorship analysis is an important form of co-authorship analysis. It can reflect the degree of communication between countries as well as the influential countries in this field. The country co-authorship network of MBD-related publications is showed in Figure 8. There are many colors in the map, which shows the diversification of research directions. The big nodes represent the influential countries. The links between nodes represent the cooperative relationships among institutes. The distance between the nodes and the thickness of the links represent the level of cooperation among countries. As we can see in Figure 8, the research center in the field of MBD is in the United States and Asia’s research center is in China. The link strength between the USA and China is 25, between the USA and England being 17, between the USA and Germany being 13. While the link strength between England and Germany is 4. It indicates that geographical advantage is not the primary factor that influences the cooperative relationship.

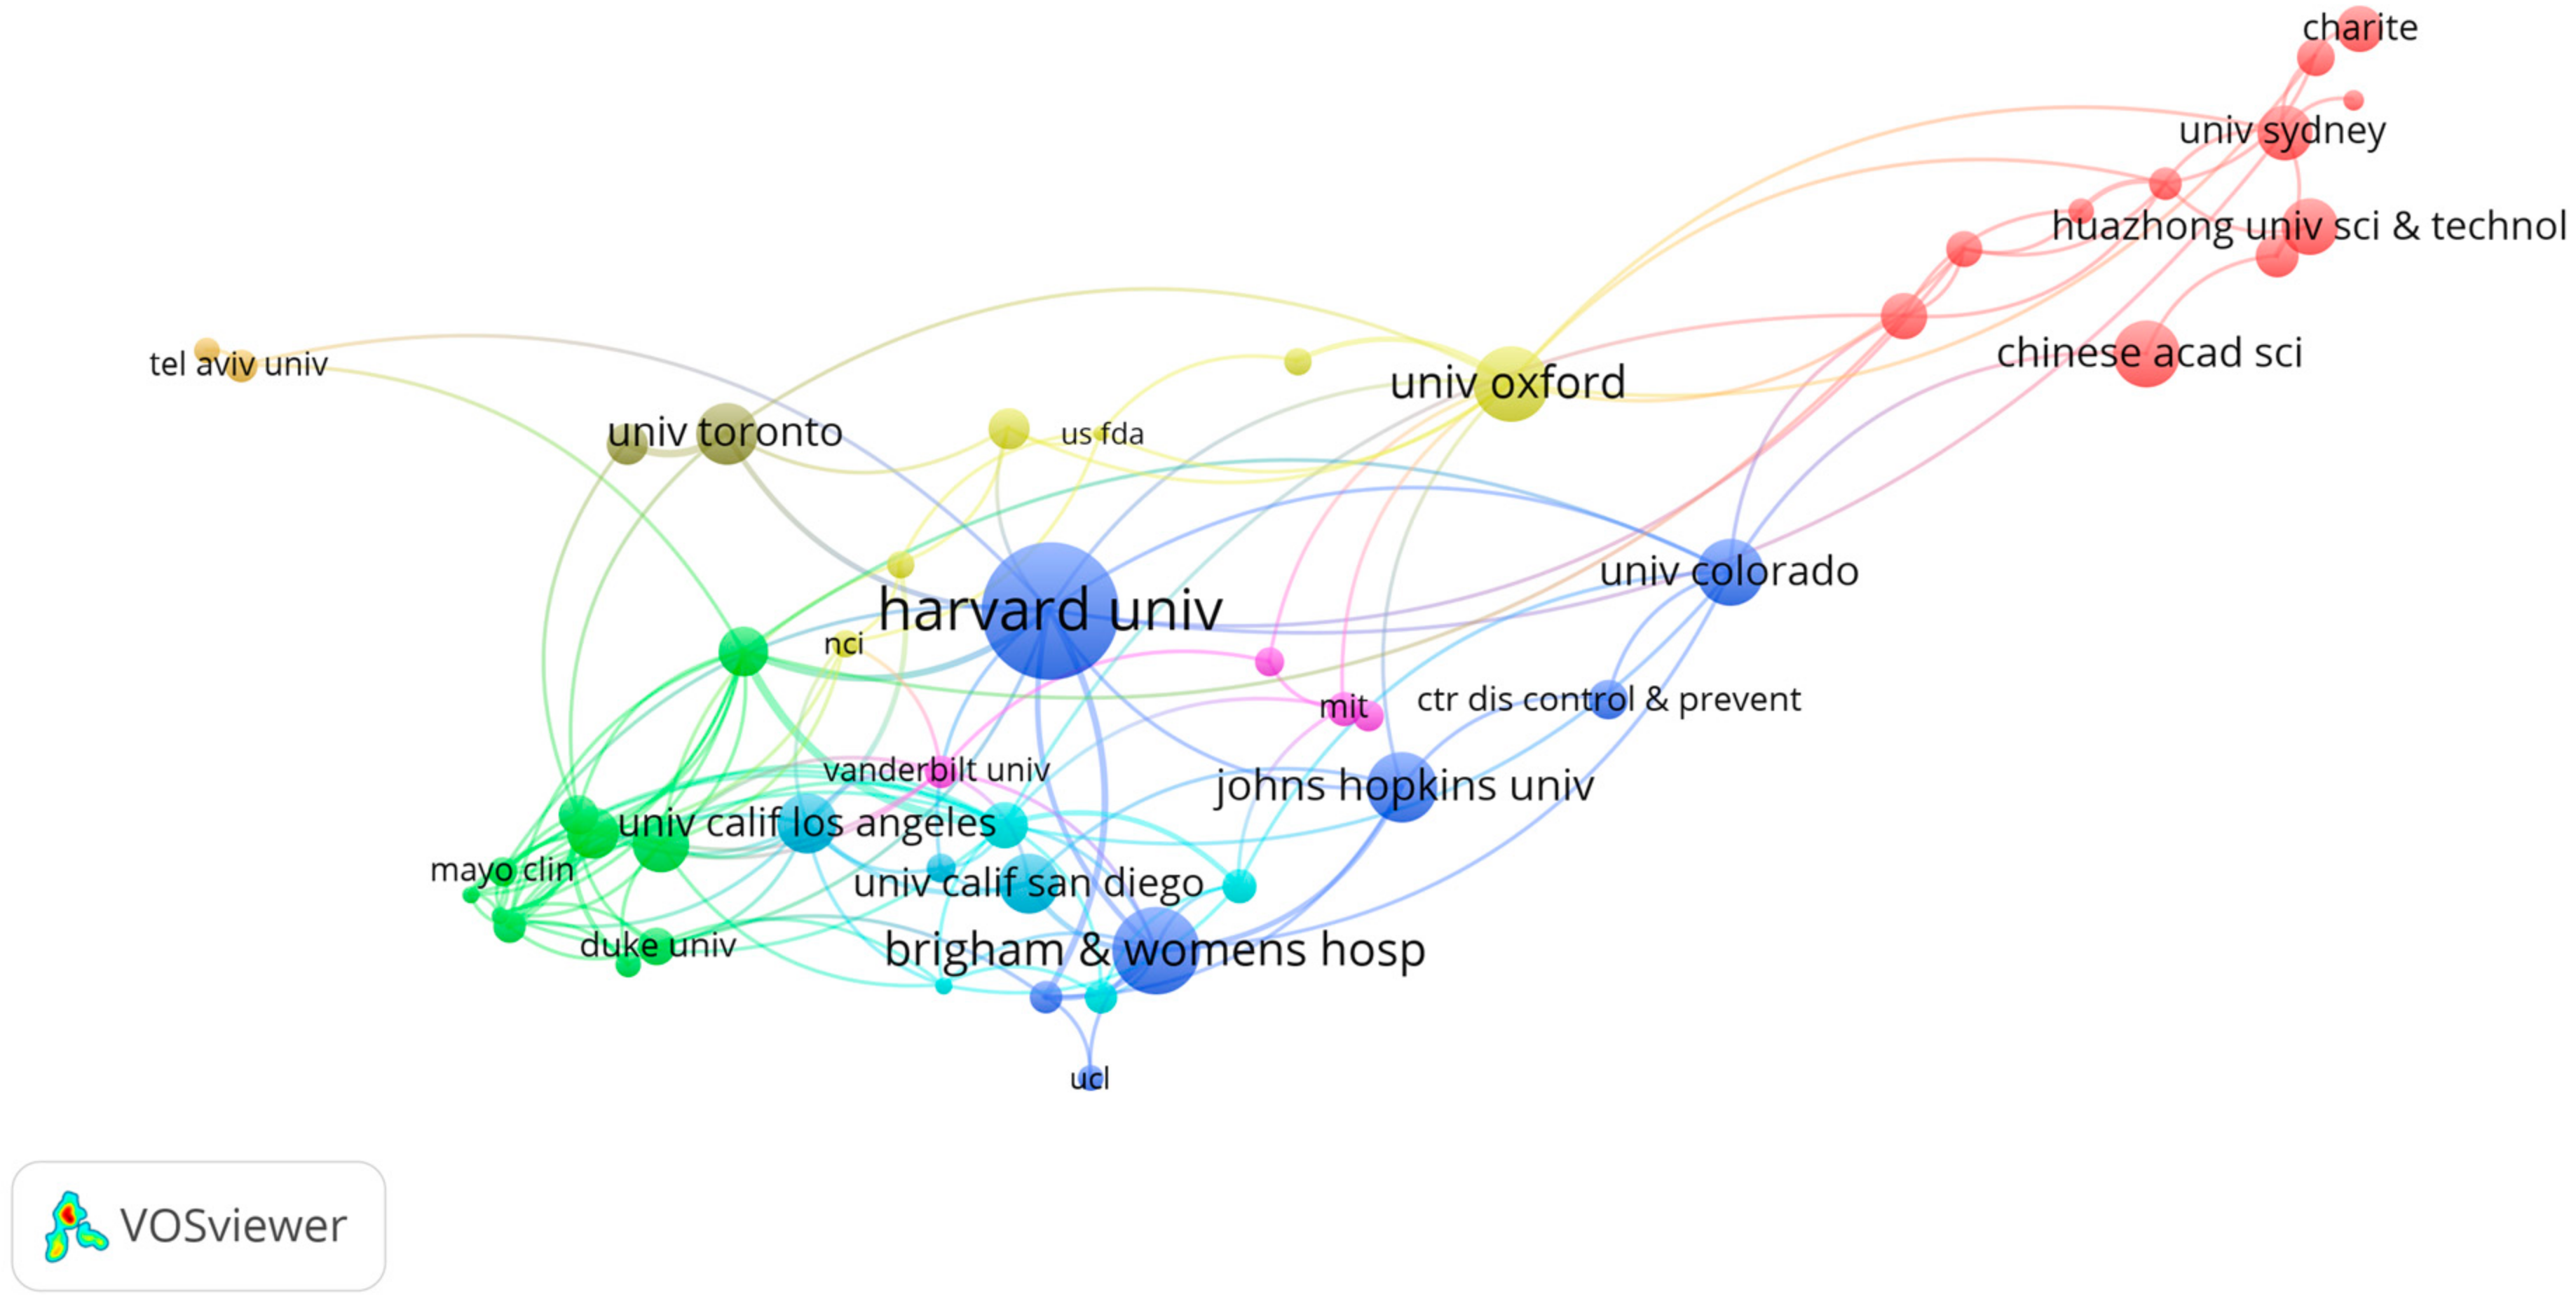
3.3.2. The Institute Co-Authorship Analysis

The institute co-authorship network is shown in Figure 9. The Harvard University from the USA, the University of California Los Angeles from the USA, and the Northwestern University from the USA are the top three influential institutes of the MBD-related publications. In China, the top universities include the Peking University, the Huazhong University of Sciences and Technology and the Zhejiang University.

3.3.3. The Highly Cited MBD-Related Publications

To identify the most influential papers in the field of MBD, we select the top 10 papers with the most citations. Table 4 shows these highly cited papers in terms of title, journal, Authors, publication year, citation numbers, institute numbers (IN) and country numbers (CN). There are more than three authors in some papers, and we selected the first three to be shown in Table 3. There are two highly cited papers published in 1991–2000, 4 papers published in 2001–2010, and 4 papers published in 2011–2017. All of these 10 papers were co-authored. The average number of authors is 4.9. In addition, 4 publications were completed through cooperation between institutes. 2 publications were accomplished by international cooperation. It indicates that it is necessary for authors to cooperate, and the international co-authorship remains to be strengthened.
The paper written by von Haehling and Anker [39] ranks first with 216 citations. In this paper, the authors presented that cachexia is a severe but underestimated aftermath of malignant cancer and many other chronic diseases with a series of facts and numbers. The work of Robinson and Sexton [40] occupied the second position. The paper ranked third is “Assessment of letrozole and tamoxifen alone and in sequence for postmenopausal women with steroid hormone receptor-positive breast cancer: the BIG 1–98 randomised clinical trial at 8.1 years median follow-up”. In this study [41], an update of curative effect outcomes was presented. These findings are of guiding significance for the control of breast cancer recurrence. Zhang and Muhlenbein’s [42] paper ranked fourth, which aims to balance the precision and cost in genetic programming. The other articles also varied in content, including the application of big data in medical and the web-based survey on the evaluation of noise-induced hearing loss in young people.

3.4. The Co-Citation Analysis on MBD-Related Publications

When two items (such as documents, journals and authors) are cited in a citing item’s reference list, they have a co-citation relationship [14]. Small [43] presented a co-citation analysis to examine the relationship and structure of academic fields. After that, the co-citation analysis has been extensively used to reveal the relationship and structure of authors, articles and journals in academic fields. In this part, the reference co-citation analysis and the journal co-citation analysis are displayed.

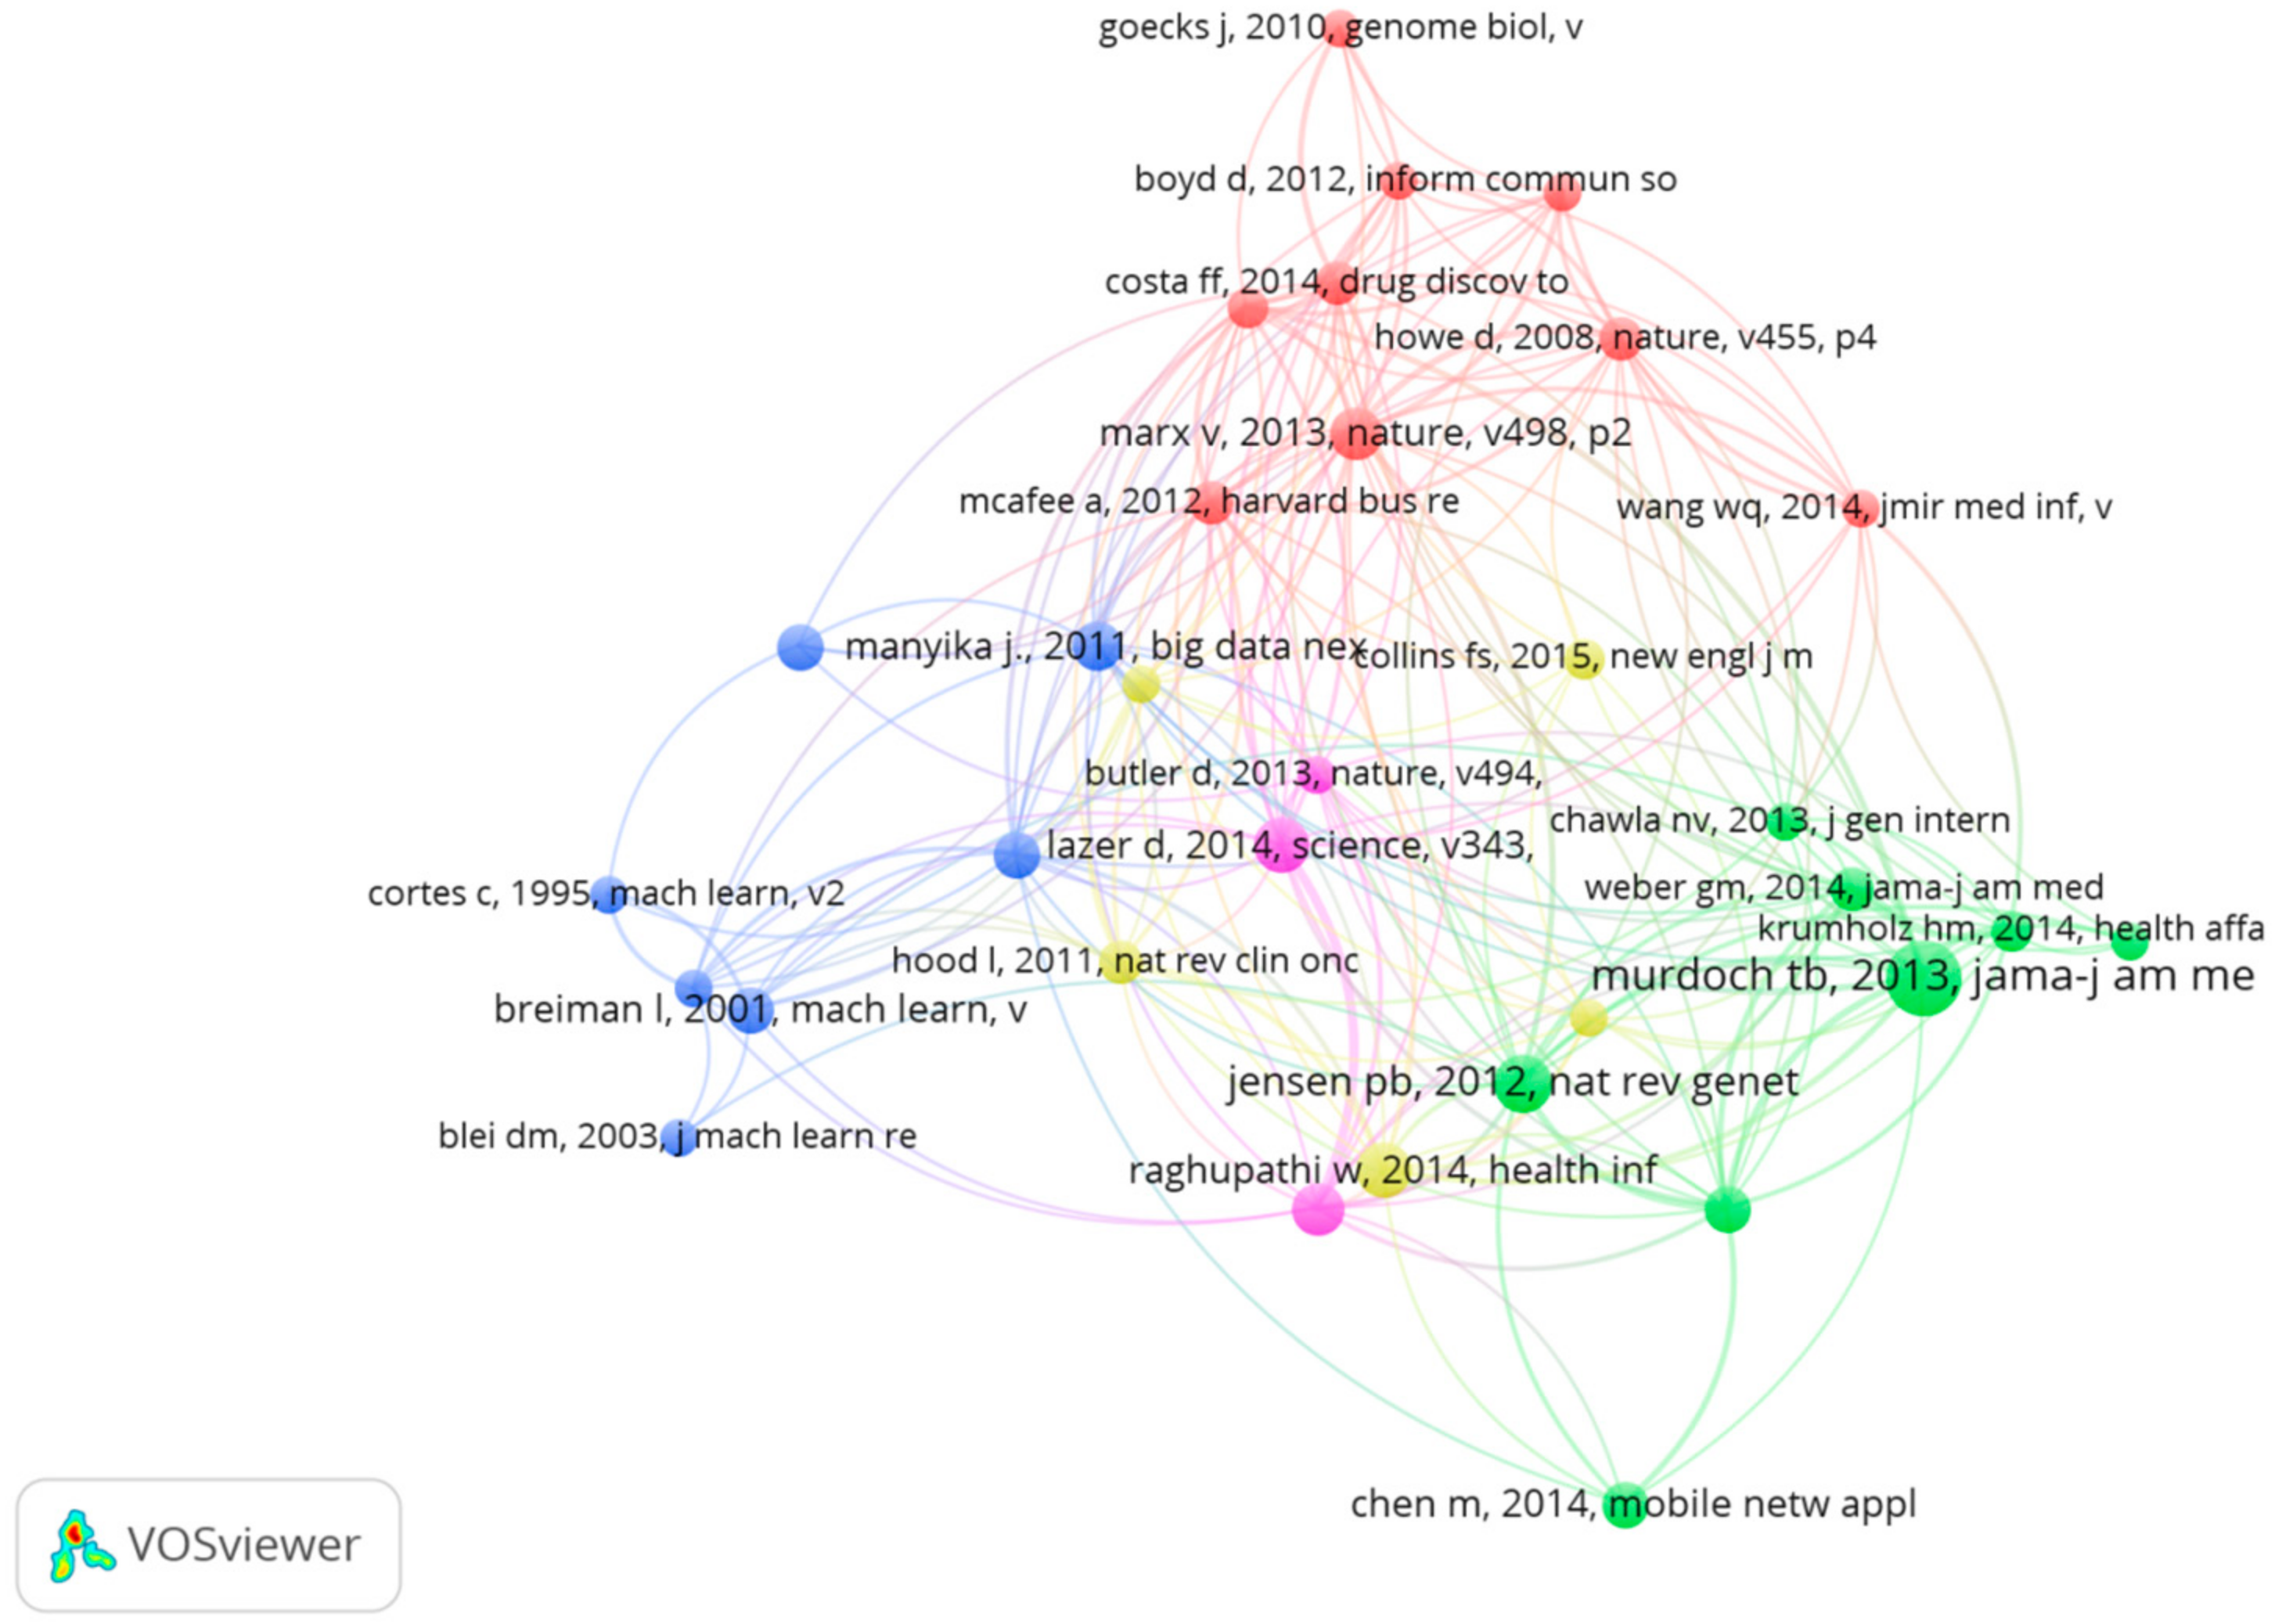
3.4.1. The Reference Co-Citation Analysis

When two papers appeared simultaneously in the third paper’s citations, it is considered that the two papers established a co-citation relationship [44]. Reference co-citation analysis is an important mean to detect the structure and evolution path of a specific domain. Co-citation analysis is a kind of citation network analysis method. It is different from another citation analysis method, namely, the citation quantity analysis method. The citation quantity analysis method is to evaluate the quality of the subjects (journal, author, country, document, type of document, etc.) by the number of citations. Co-citation analysis selects some representative literatures as the analysis object, and then uses the network analysis method to divide these literatures into several clusters. In this way, we can obtain the structure and characteristics of a specific domain. In the reference co-citation network, the importance of nodes does not reveal the high number of citations, but illustrates the research themes that are closely related to MBD-related research. In this sense, the two methods are based on different target subjects and the co-citation analysis is limited to the 988 publications. For example, Murdoch TB’s paper was cited 29 times altogether in those 988 documents, but it was cited 533 times in Google Scholar. Figure 10 shows the reference co-citation network in the field of MBD study. Betweenness Centrality measures the importance of nodes in a network. The specific calculation method is computed by counting the percentage that the shortest path between pairwise nodes in the network passes through the node [24]. From Figure 10, we can find that the biggest node is Murdoch (2013). His paper entitled “The Inevitable Application of Big Data to Health Care” published in JAMA-Journal of the American Medical Association proposed that the use of patient and physician data collection may be an important way to improve the quality and efficiency of health care services [45].
Table 5 lists the top 10 most co-cited documents related to MBD study.

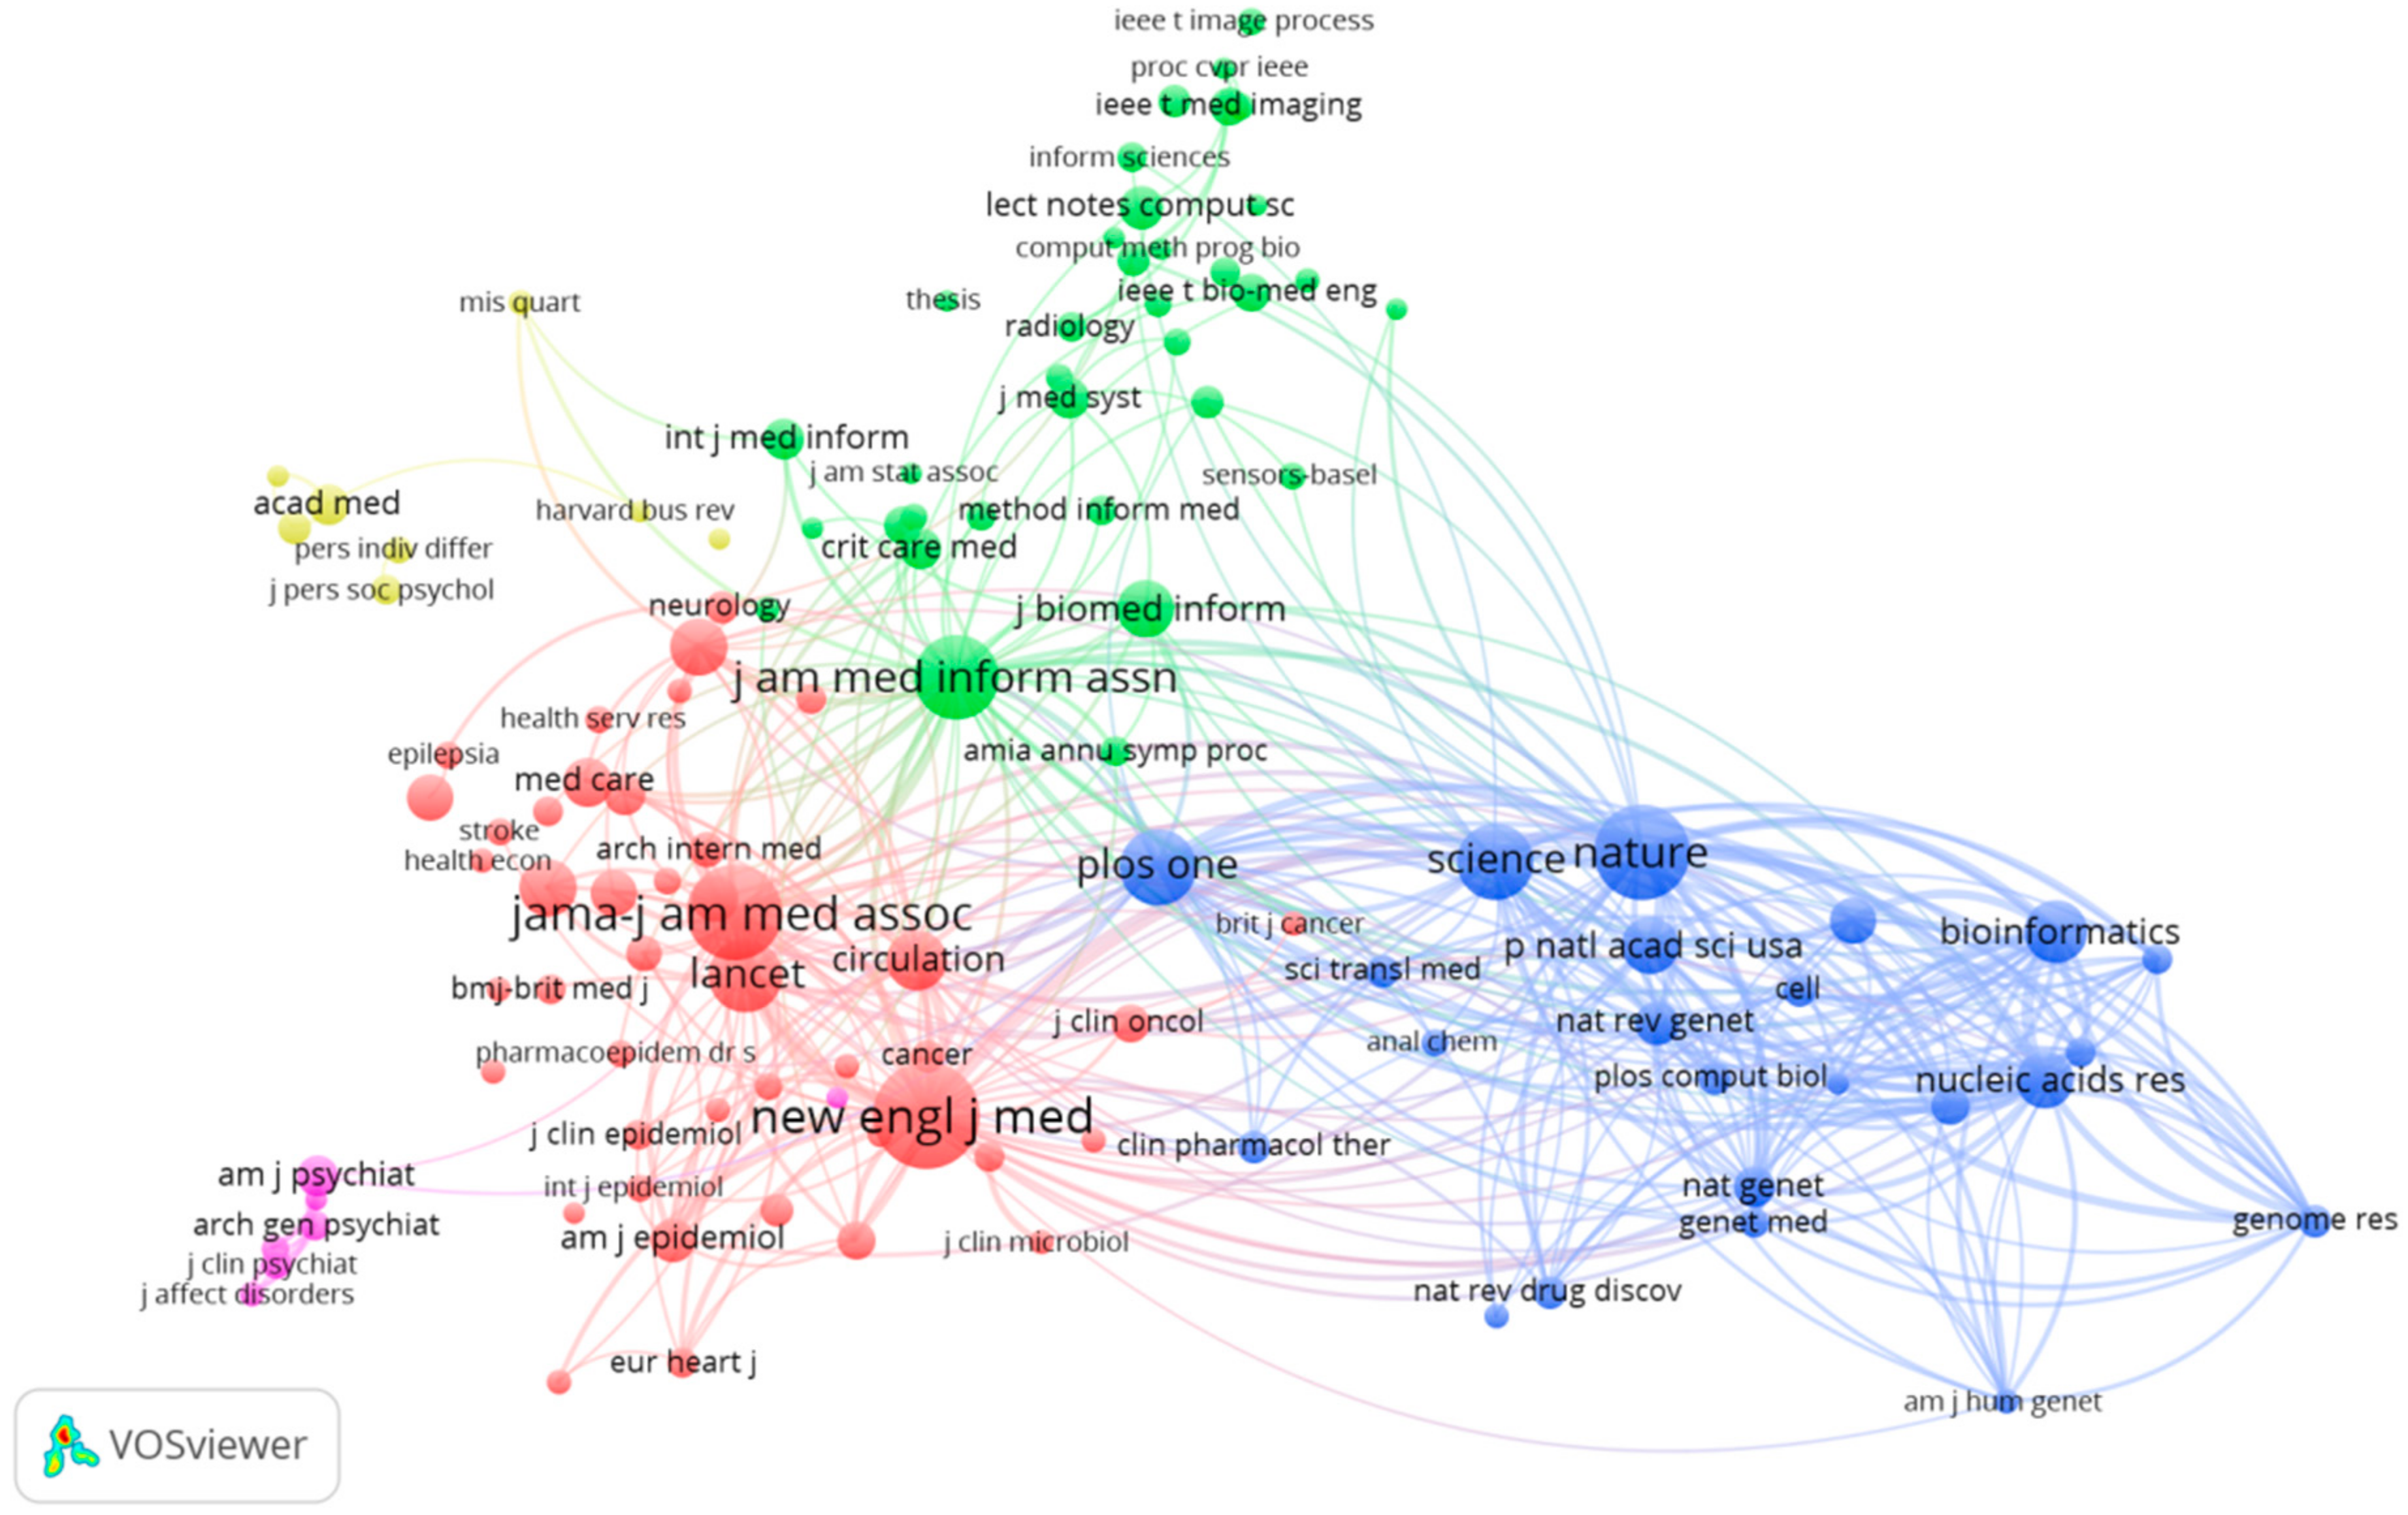
3.4.2. The Journal Co-Citation Analysis

The journal co-citation analysis is not only an efficacious way to study the structure and characteristics of a subject, but also reveals the overall structure of the subject and the characteristics of a journal [46]. We use the VOSviewer software to plot the journal co-citation network. Figure 11 shows the journal co-citation network with 144 nodes. The size of node represents the activity of the journal and the number of published papers. The distance between two nodes is also very important. Generally, the smaller the distance between two nodes is, the higher the citation frequency is. As the visualization illustrated in Figure 11, each cluster has a color that indicates the group to which the cluster is assigned. We can see that all these journals are divided into five clusters. The red cluster contains JAMA-Journal of the American Medical Association, New England Journal of Medicine and Lancet, etc. This cluster represents medical journals. The blue cluster contains Nature, Science and PLoS ONE. This cluster represents science and technology journals. The green cluster represents information journals.
Table 6 illustrates the distribution of core journals on MBD study. As Table 6 shows, JAMA-Journal of the American Medical Association has the biggest centrality value (0.25) and it is followed by Lancet (0.24) and New England Journal of Medicine (0.18).

4. Discussions and Conclusions

This study made a bibliometric analysis and visualization on MBD-related publications. We explored some interesting results concerning the MBD-related publications, which can be summarized as follows:
First, the MBD-related publications fluctuated at low level during the initial periods of 1990s and the first decade of the 21st century. However, after 2010, the number of publications grown rapidly. In terms of institutes, the Harvard University has the highest number of publications. The USA has 8 institutes ranked the top 10 regarding to the number of MBD-related publications. The journal, PLoS ONE, ranks first among the MBD-related journals. The USA has the most publications, the highest number of citation frequency and H-index. It implies that the USA is the bellwether in this field. China has a large number of publications, while Chinese scholars should pay attention to the quality of their papers.
Second, through the analysis of keywords, we have found that medical care is moving from a disease-centered model towards a patient-centered model. Until now, personalized medicine is heating up. At the same time, the technical support of MBD study is the key direction that people need to overcome.
Third, in MBD domain, the phenomenon of cooperation among multiple authors is widespread. All the top 10 publications with the highest number of citations were completed with more than one author. However, the international cooperation is not universal.
Fourth, the most frequently cited work in MBD area is Murdoch (2013). JAMA-Journal of the American Medical Association is most influential in MBD domain.
We can draw a conclusion that the patient-centered model is an inevitable trend in future medical development. (1) Firstly, precision medicine construction has spread throughout the world, and many countries have begun to chase the related concepts and industries. In 2008, Clayton Christensen, professor of Harvard Business School, first proposed the concept of precision. In 2011, National Research Council formally introduced the definition of precision medicine in the research reporter Toward Precision Medicine: Building a Knowledge Network for Biomedical Research and a New Taxonomy of Disease [47]. At the end of January 2015, in the USA, President Obama announced a new project in the field of life science, namely, Precision Medicine Initiative. This project aims to cure diseases such as cancer and diabetes, with the aim of getting everyone healthy with personalized information [48]. Jameson and Longo [49] from the University of Pennsylvania summarized the strengths, challenges and clinical practice of accelerated precision medicine systematically. Wishart [50] aimed to unmask the essential reason of complex disease and metabolomics’s potential impact on precision medicine via exploring the application of metabonomics. Aronson and Rehm [51]’s paper published in Nature built a medical system with seamless cycling between clinical study and nursing to expedite the application of precision medicine. There are great improvements in the field of molecular biology, such as tumor molecular pathology and gene detection. However, the mining, evaluation, integration and application of these data need to be strengthened. Precision medical information technology systems include biological samples, bioinformatics, electronic medical records, and big data analysis techniques. Big data analysis is the key to precision medical treatment [52]. Making good use of MBD can improve the accuracy and scientific of medical diagnostic, and form the personalized medical care. Through analyzing the influencing factors of residents’ health, patients’ health information can be integrated to provide better data evidence for the diagnosis and treatment of the disease. The data mining framework of precision medical treatment is shown in Figure 12. (2) Secondly, with the continuous progress of modern society, people’s awareness of safeguarding rights is gradually improved. The protection of patient privacy has become particularly important. Protecting patient privacy is also an all-around project [53]. It needs to have privacy laws and legal support agreement. Protecting the privacy of patients requires the cooperation among all stakeholders, including patients, patients’ health information holding institutes and government agencies for supervision and enforcement.
Furthermore, to utilize and develop MBD, the technical challenges cannot be ignored. (1) Firstly, the expanding medical information data is filled with a large number of unstructured data, and the data sources are becoming more and more diverse. The storage and transferring technologies of the MBD are quite different from the traditional data analysis technologies. The current storage architecture is unable to meet the needs of big data applications. (2) Secondly, the mining of MBD has become imminent. The original clinical data is large and heterogeneous, mostly from electronic medical records, medical images, medical record parameters, laboratory results, and clinical observation and interpretation [54]. This clinical information has its own particularity and complexity, such as diversity, privacy, redundancy, incompleteness, and lack of mathematical properties. This makes great difference between medical data mining and conventional data mining. (3) Thirdly, in the perspective of data collection, large scale data is collected from various data sources like Internet, mobile phones, hospital, and scientific community [55]. (4) Fourthly, there are many other challenges existed in both data management and data analysis to support the big data era, for example, processing highly distributed data sources, tracking data sources, coping with sampling bias and heterogeneity, and developing parallel and distributed architecture algorithm.
Although we have obtained some interesting results through the bibliometric analysis and visualization on MBD-related publications, this study has some shortcomings. We downloaded the documents from SSCI and SCIE databases via Web of Science and more than 99% of the articles were written in English. This leads to underestimation of researchers who use other languages. In addition, we have not considered the technologies for handling MBD.

Acknowledgments

The work was supported in part by the National Natural Science Foundation of China (Nos. 71501135, 71771156, and 71532007), the Scientific Research Foundation for Excellent Young Scholars at Sichuan University (No. 2016SCU04A23), and the Scientific Research Foundation for Scholars at Sichuan University (No. YJ201535).

Author Contributions

The research is designed and performed by Huchang Liao and Ming Tang. The data was collected by Ming Tang. Analysis of data was performed by Huchang Liao, Ming Tang, Li Luo, and Chunyang Li. Finally, the paper is written by Huchang Liao, Ming Tang, Francisco Chiclana, and Xiao-Jun Zeng. All authors read and approved the final manuscript.

Conflicts of Interest

The authors declare no conflict of interest.

References

  1. Jin, X.L.; Wah, B.W.; Chen, X.Q.; Wang, Y.Z. Significance and challenges of big data research. Big Data Res. 2015, 2, 59–64. [Google Scholar] [CrossRef]
  2. Binder, H.; Blettner, M. Big data in medical science-A biostatistical view. Dtsch. Arztebl. Int. 2015, 112, 137–142. [Google Scholar] [PubMed]
  3. Katal, A.; Wazid, M.; Goudar, R.H. Big data: Issues, challenges, tools and good practices. In Proceedings of the Sixth International Conference on Contemporary Computing (IC3), Noida, India, 8–10 August 2013; pp. 404–409. [Google Scholar]
  4. Wamba, S.F.; Akter, S.; Edwards, A.; Chopin, G.; Gnanzou, D. How ‘big data’ can make big impact: Findings from a systematic review and a longitudinal case study. Int. J. Prod. Econ. 2015, 165, 234–246. [Google Scholar] [CrossRef]
  5. Alles, M.G. Drivers of the use and facilitators and obstacles of the evolution of big data by the audit profession. Account. Horiz. 2015, 29, 439–449. [Google Scholar] [CrossRef]
  6. Huwe, T.K. Big data, big future. Comput. Lib. 2012, 32, 20–22. [Google Scholar]
  7. Li, G.J.; Cheng, X.Q. Research status and scientific thinking of big data. Bull. Chin. Acad. Sci. 2012, 6, 647–657. [Google Scholar]
  8. Jee, K.; Kim, G.H. Potentiality of big data in the medical sector: Focus on how to reshape the healthcare system. Healthc. Inform. Res. 2013, 19, 79–85. [Google Scholar] [CrossRef] [PubMed]
  9. Chawla, N.V.; Davis, D.A. Bringing big data to personalized healthcare: A patient-centered framework. J. Gen. Intern. Med. 2013, 28, 660–665. [Google Scholar] [CrossRef] [PubMed]
  10. Antman, E.M.; Benjamin, E.J.; Harrington, R.A.; Houser, S.R.; Peterson, E.D.; Bauman, M.A.; Brown, N.; Bufalino, V.; Califf, R.M.; Creager, M.A.; et al. Acquisition, analysis, and sharing of data in 2015 and beyond: A survey of the landscape. J. Am. Heart Assoc. 2015, 4, e002810. [Google Scholar] [CrossRef] [PubMed]
  11. Merigó, J.M. Academic research in innovation: A country analysis. Scientometrics 2016, 108, 559–593. [Google Scholar] [CrossRef]
  12. Železnik, D.; Vošner, H.B.; Kokol, P. A bibliometric analysis of the Journal of Advanced Nursing, 1976–2015. J. Adv. Nurs. 2017, 73, 2407–2419. [Google Scholar] [CrossRef] [PubMed]
  13. Merigó, J.M.; Mas-Tur, A.; Roig-Tierno, N.; Ribeiro-Soriano, D. A bibliometric overview of the Journal of Business Research between 1973 and 2014. J. Bus. Res. 2015, 68, 2645–2653. [Google Scholar] [CrossRef]
  14. Osareh, F. Bibliometrics, citation analysis and co-citation analysis: A review of literature I. Libri 2009, 49, 149–158. [Google Scholar] [CrossRef]
  15. Yeung, A.W.K.; Goto, T.K.; Leung, W.K. A bibliometric review of research trends in neuroimaging. Curr. Sci. 2017, 112, 725–734. [Google Scholar] [CrossRef]
  16. Sweileh, W.M.; Al-Jabi, S.W.; Sawalha, A.F.; AbuTaha, A.S.; Saed, H.Z. Bibliometric analysis of publications on Campylobacter: (2000–2015). J. Health Popul. Nutr. 2016, 35, 35–39. [Google Scholar] [CrossRef] [PubMed]
  17. Merigó, J.M.; Blanco-Mesa, F.; Gil-Lafuente, A.M.; Yager, R.R. Thirty years of the International Journal of Intelligent Systems: A bibliometric review. Int. J. Intell. Syst. 2017, 32, 526–554. [Google Scholar] [CrossRef]
  18. Merigó, J.M.; Yang, J.B. A bibliometric analysis of operations research and management science. Omega 2016, 97, 1–16. [Google Scholar] [CrossRef]
  19. Kostoff, R.N. The underpublishing of science and technology results. Scientist 2000, 14, 6. [Google Scholar]
  20. Liu, W.S.; Liao, H.C. A bibliometric analysis of fuzzy decision research during 1970–2015. Int. J. Fuzzy Syst. 2017, 19, 1–14. [Google Scholar] [CrossRef]
  21. Yu, D.J.; Liao, H.C. Visualization and quantitative research on intuitionistic fuzzy studies. J. Intell. Fuzzy Syst. 2016, 30, 3653–3663. [Google Scholar] [CrossRef]
  22. Powell, T.H.; Kouropalatis, Y.; Morgan, R.E.; Karhu, P. Mapping knowledge and innovation research themes: Using bibliometrics for classification, evolution, proliferation and determinism. Int. J. Entrep. Innov. Manag. 2016, 20, 174–199. [Google Scholar] [CrossRef]
  23. Garousi, V.; Mantyla, M.V. Citations, research topics and active countries in software engineering. Comput. Sci. Rev. 2016, 19, 56–77. [Google Scholar] [CrossRef]
  24. Chen, C.M. CiteSpace II: Detecting and visualizing emerging trends and transient patterns in scientific literature. J. Assoc. Inf. Sci. Tech. 2006, 57, 359–377. [Google Scholar] [CrossRef]
  25. Chen, C.M.; Hu, Z.; Liu, S.; Tseng, H. Emerging trends in regenerative medicine: A scientometric analysis in CiteSpace. Expert Opin. Biol. Ther. 2012, 12, 593–608. [Google Scholar] [CrossRef] [PubMed]
  26. Van Eck, N.J.; Waltman, L. Software survey: VOSviewer, a computer program for bibliometric mapping. Scientometrics 2010, 84, 523–538. [Google Scholar] [CrossRef] [PubMed]
  27. Cobo, M.J.; López-Herrera, A.G.; Herrera-Viedma, E.; Herrera, F. Science mapping software tools: Review, analysis, and cooperative study among tools. J. Assoc. Inf. Sci. Tech. 2011, 62, 1382–1402. [Google Scholar] [CrossRef]
  28. Bates, D.W.; Saria, S.; Ohnomachado, L.; Shah, A.; Escobar, G. Big data in health care: Using analytics to identify and manage high-risk and high-cost patients. Health Affair. 2014, 33, 1123–1131. [Google Scholar] [CrossRef] [PubMed]
  29. Tahamtan, I.; Afshar, A.S.; Ahamdzadeh, K. Factors affecting number of citations: A comprehensive review of the literature. Scientometrics 2016, 107, 1195–1225. [Google Scholar] [CrossRef]
  30. Bertolibarsotti, L.; Lando, T. A theoretical model of the relationship between the h-index and other simple citation indicators. Scientometrics 2017, 111, 1–34. [Google Scholar]
  31. Bornmann, L.; Daniel, H.D. What do we know about the h index? J. Am. Soc. Inf. Sci. Technol. 2007, 58, 1381–1385. [Google Scholar] [CrossRef]
  32. Díaz, I.; Cortey, M.; Olvera, À.; Segalés, J. Use of H-index and other bibliometric indicators to evaluate research productivity outcome on swine diseases. PLoS ONE 2016, 11, e0149690. [Google Scholar] [CrossRef] [PubMed]
  33. Li, H.J.; An, H.Z.; Wang, Y.; Huang, J.C.; Gao, X.Y. Evolutionary features of academic articles co-keyword network and keywords co-occurrence network: Based on two-mode affiliation network. Phys. A 2016, 450, 657–669. [Google Scholar] [CrossRef]
  34. Gu, D.X.; Li, J.J.; Li, X.G.; Liang, C.Y. Visualizing the knowledge structure and evolution of big data research in healthcare informatics. Int. J. Med. Inform. 2017, 98, 22–32. [Google Scholar] [CrossRef] [PubMed]
  35. Pinto, M.; Pulgarín, A.; Escalona, M.I. Viewing information literacy concepts: A comparison of two branches of knowledge. Scientometrics 2014, 98, 2311–2329. [Google Scholar] [CrossRef]
  36. Chung, K.F. Personalised medicine in asthma: Time for action. Eur. Respir. Rev. 2017, 26, 170064. [Google Scholar] [CrossRef] [PubMed]
  37. Schulkes, K.J.G.; Nguyen, C.; van den Bos, F.; Hamaker, M.E.; van Elden, L.J. Patient-centered outcome measures in lung cancer trials. Lung 2016, 94, 647–652. [Google Scholar] [CrossRef] [PubMed]
  38. Reyes, G.L.; Gonzalez, C.N.B.; Veloso, F. Using co-authorship and citation analysis to identify research groups: A new way to assess performance. Scientometrics 2016, 108, 1171–1191. [Google Scholar] [CrossRef]
  39. Von Haehling, S.; Anker, S.D. Cachexia as a major underestimated and unmet medical need: Facts and numbers. J. Cachexia Sarcopenia Muscle 2010, 1, 1–5. [Google Scholar] [CrossRef] [PubMed]
  40. Robinson, P.B.; Sexton, E.A. The effect of education and experience on self-employment success. J. Bus. Ventur. 1994, 9, 141–156. [Google Scholar] [CrossRef]
  41. Regan, M.M.; Neven, P.; Giobbie-Hurder, A.; Goldhirsch, A.; Ejlertsen, B.; Mauriac, L.; Forbes Fracs, J.F.; Lang, I.; Wardley, A.; Rabaglio, M.; et al. Assessment of letrozole and tamoxifen alone and in sequence for postmenopausal women with steroid hormone receptor-positive breast cancer: The BIG 1-98 randomised clinical trial at 8.1 years median follow-up. Lancet Oncol. 2011, 12, 1101–1108. [Google Scholar] [CrossRef]
  42. Zhang, B.T.; Muhlenbein, H. Balancing accuracy and parsimony in genetic programming. Evol. Comput. 1995, 3, 17–38. [Google Scholar] [CrossRef]
  43. Small, H. Co-citation in the scientific literature: A new measure of the relationship between two documents. J. Am. Soc. Inform. Sci. 1973, 24, 265–269. [Google Scholar] [CrossRef]
  44. Boyack, K.W.; Klavans, R. Co-citation analysis, bibliographic coupling, and direct citation: Which citation approach represents the research front most accurately? J. Assoc. Inf. Sci. Technol. 2010, 61, 2389–2404. [Google Scholar] [CrossRef]
  45. Murdoch, T.B.; Detsky, A.S. The inevitable application of big data to health care. JAMA J. Am. Med. Assoc. 2013, 309, 1351–1352. [Google Scholar] [CrossRef] [PubMed]
  46. Hu, C.P.; Hu, J.M.; Gao, Y.; Zhang, Y.K. A journal co-citation analysis of library and information science in China. Scientometrics 2011, 86, 657–670. [Google Scholar] [CrossRef]
  47. Mirnezami, R.; Nicholson, J.; Darzi, A. Preparing for Precision Medicine. N. Engl. J. Med. 2012, 366, 489–491. [Google Scholar] [CrossRef] [PubMed]
  48. Hammer, M.J. Precision medicine and the changing landscape of research ethics. Oncol. Nurs. Forum 2016, 43, 149–150. [Google Scholar] [CrossRef] [PubMed]
  49. Jameson, J.L.; Longo, D.L. Precision medicine—Personalized, problematic, and promising. N. Engl. J. Med. 2015, 372, 2229–2234. [Google Scholar] [CrossRef] [PubMed]
  50. Wishart, D.S. Emerging applications of metabolomics in drug discovery and precision medicine. Nat. Rev. Drug Discov. 2016, 17, 473–484. [Google Scholar] [CrossRef] [PubMed]
  51. Aronson, S.J.; Rehm, H.L. Building the foundation for genomics in precision medicine. Nature 2015, 526, 336–342. [Google Scholar] [CrossRef] [PubMed]
  52. Costa, F.F. Big data in biomedicine. Drug Discov. Today 2014, 19, 433–440. [Google Scholar] [CrossRef] [PubMed]
  53. Kayaalp, M. Patient privacy in the era of big data. Balk. Med. J. 2017. [Google Scholar] [CrossRef] [PubMed]
  54. Cios, K.J.; Moore, G.W. Uniqueness of medical data mining. Artif. Intell. Med. 2002, 26, 1–24. [Google Scholar] [CrossRef]
  55. Huang, T.; Lan, L.; Fang, X.; An, P.; Min, J.; Wang, F. Promises and challenges of big data computing in health sciences. Big Data Res. 2015, 2, 2–11. [Google Scholar] [CrossRef]
Figure 1. The annual trends of MBD-related publications.
Sustainability 10 00166 g001
Figure 2. The top 10 institutes with MBD-related publications.
Sustainability 10 00166 g002
Figure 3. The top 10 journals with MBD-related publications.
Sustainability 10 00166 g003
Figure 4. (a) Number of publications; (b) Sum of citations and (c) H-index of MBD-related publications.
Sustainability 10 00166 g004
Figure 5. Keywords co-occurrence network of MBD-related publications.
Sustainability 10 00166 g005
Figure 6. Keywords density visualization map of MBD-related publications.
Sustainability 10 00166 g006
Figure 7. The keywords timeline view of MBD-related publications.
Sustainability 10 00166 g007
Figure 8. The country co-authorship network of MBD-related publications.
Sustainability 10 00166 g008
Figure 9. The institute co-authorship network of MBD-related publications.
Sustainability 10 00166 g009
Figure 10. The reference co-authorship network of MBD-related publications.
Sustainability 10 00166 g010
Figure 11. The journal co-citation network of MBD-related publications.
Sustainability 10 00166 g011
Figure 12. Data mining framework for precision medical treatment.
Sustainability 10 00166 g012
Table 1. Types of retrieved documents.
Type of DocumentFrequencyProportion
Article80781.7
Review9810.7
Editorial material363.6
Proceedings paper252.5
Meeting abstract121.2
Book chapter50.5
Letter20.2
Book review10.1
Correction10.1
News item10.1
Total988100
Table 2. The top 10 keywords of the MBD-related publications.
RankKeywordsFrequencyTotal Link Strength
1Big data203597
2Care70220
3Risk50172
4Health-care45152
5System43139
6Health43121
7Management3494
8The United States33123
9Epidemiology32118
10Quality3195
Table 3. The keywords of MBD-related publications appeared during different periods.
PeriodsKeywords
Before 2000mortality, care, internet, women, intensive care system
2001–2010Diagnosis, impact, the United States, clinical trial, quality of life, risk, model, predication, cost, stress, death, anxiety, simulation, complication, birth, association, cohort, breast cancer
After 2010Personalized medicine, machine learning, framework, database, datasharing, statement, privacy, personality, China, data mining
Table 4. The top 10 papers with the most citations.
TitleJournalAuthorsYearCitationINCN
Cachexia as a major underestimated and unmet medical need: facts and numbersJournal of Cachexia Sarcopenia and Musclevon Haehling & Anker201021611
The effect of education and experience on self-employment successJournal of Business VenturingRobinson & Sexton199419022
Assessment of letrozole and tamoxifen alone and in sequence for postmenopausal women with steroid hormone receptor-positive breast cancer: the BIG 1-98 randomised clinical trial at 8.1 years median follow-upLancet OncologyRegan et al.2011157149
Balancing accuracy and parsimony in genetic programmingEvolutionary ComputationZhang & Muhlenbein199511311
Galactomannan detection for invasive aspergillosis in immunocompromized patientsCochrane Database of Systematic ReviewsLeeflang, Debets-Ossenkopp & Visser200811211
Meta-analysis in clinical trials revisitedContemporary Clinical TrialsDerSimonian & Laird201510511
Evaluation of noise-induced hearing loss in young people using a web-based survey techniquePediatricsChung, Des Roches & Meunier20059821
Big data in health care: Using analytics to identify and manage high-risk and high-cost patientsHealth AffairsBates, Saria & Ohno-Machado20149651
Multimorbidity and quality of life: A closer lookHealth and Quality of Life OutcomesFortin, Dubois & Hudon20079211
‘Big data’, Hadoop and cloud computing in genomicsJournal Biomedical InformaticsO’Driscoll, Daugelaite & Sleator20139011
Table 5. The top 10 most co-cited documents of MBD-related study.
FrequencyBetweenness CentralityAuthorYear
290.16Murdoch TB2013
170.04Jensen PB2012
150Lazer D2014
150Raghupathi W2014
140.04Marx V2013
130Ginsberg J2009
110Mayer-schonberger V2013
110Manyika J2011
100.08Bates DW2014
90.02Dean J2008
Table 6. Distribution of core journals on MBD.
FrequencyCentralitySourcesSubject
2530.25JAMA-J AM MED ASSOCComputer science, healthcare sciences& Services, Information science &Library Science, Medical Informatics
2400.18NEW ENGL J MEDGeneral & Internal Medicine
1770.24LANCETGeneral & Internal Medicine
1630.10NATUREScience & Technology
1620.10PLOS ONEScience &Technology
1340.13SCIENCEScience & Technology
1320.14J AM MED INFORM ASSNComputer Science
Health Care Sciences & Services
Information Science & Library Science
Medical Informatics
1140.09BRIT MED JGeneral & Internal Medicine
860.09HEALTH AFFAIRSHealth Care Sciences & Services
840.06ANN INTERN MEDGeneral & Internal Medicine

