1. Introduction
In recent years, there has been increased consensus that the social responsibility of a company is significant for both business and public sectors. The statement “being socially responsible” implies that the company takes full responsibility for its activities that surpass the area of only economic interests. In other words, responsible businesses need to take into account a broader bottom line of public consciousness that includes the financial, environmental, and social impact of their decisions and actions. Recently, the term “Triple Bottom Line” (TBL: financial, environmental, social) has been coined to this approach. With this need to be socially and environmentally responsible, companies have been facing significant pressure to address climate change, especially in carbon emissions related businesses.
Since the Intergovernmental Panel on Climate Change (IPCC) reported that global warming was mainly caused by increasing concentrations of greenhouse gases, carbon emission related businesses have been expected to take responsibility for their role in this severe global issue. The most well-known effort regarding this issue is the “Kyoto Protocol (UNFCC, 1997)”, an international treaty adopted in Kyoto, Japan on 11 December 1997 and enforced on 16 February 2005. Currently, 192 parties are involved in the Protocol to implement the objective of reducing greenhouse gas concentrations. The Protocol places the obligation to reduce current emissions on developed countries since they are historically responsible for the current levels of greenhouse gases in the atmosphere.
The Kyoto Protocol defines three flexibility carbon reduction mechanisms: International Emissions Trading (IET), Clean Development Mechanism (CDM), and Joint Implementation (JI). By considering the marginal cost of reducing emissions, which differs among countries, the Protocol provides flexibility, where only developed countries can join JI, while both developed and developing countries can join CDM. CDM and JI are called “project-based mechanisms”, where they attempt to reduce emissions by running projects such as investment in reduction equipment or new technology. IET differs from these project-based mechanisms because it is based on the setting of a quantitative restriction of emissions, while CDM and JI focus more on the activities of actually reducing emissions. Our study is more closely related to IET than to CDM and JI, since IET adopts a market-based capitalist solution, a cap-and-trade system, to carbon reductions.
A number of emissions trading schemes in IET have been implemented, and many countries including Japan, European Union, Canada, and Australia design their own emissions trading schemes. Although the details of trading schemes might vary, the basic idea of trading is the same, whereby each firm’s emission is restricted by pre-assigned allowance limits and firms that exceed their allowances can purchase credit from other firms that have surplus emission credits. Under this trading scheme, the way in which pre-assigned allowance limits are allocated has significant impact on the carbon trading market, and several alternative approaches have been used for distributing carbon emission allowances. One approach is known as “grandfathering”, in which allowances are allocated based on the historic generation of emissions. The second approach is to use a “generation performance standard”, in which updates of allowance allocations are based on the shares of the current generation of emissions. A third approach is ”output-based allocation”, in which a fixed quantity of emission allowances is allocated to sources in proportion to their relative share of total generation of emissions in the recent year. “Auctioning” is also emphasized currently as an allocation scheme.
Nevertheless, several market failures are still observed, associated with inefficient initial allowances allocation in practice. This implies that a different angle of approach is required to tackle this important and complicated issue. As an attempt, we suggest the total carbon emissions allocation at the end of the accounting year. More specifically, while each firm is still restricted by its own allowances, the policy maker accumulates all remaining and exceeding carbon emission allowances over the industry at the end of the accounting year, and allocates this total carbon emissions to each firm according to our newly proposed allocation rules. This idea is based on a concept of a cost sharing method from which we expect the following benefits. First, this allocation motivates firms to cooperate by revealing their true emission quantities. In the carbon emissions market, correct measurement of each firm’s carbon emissions is difficult to achieve. However, under our allocation method, we expect firms to reveal their true values voluntarily [
1]. Second, we expect firms are aligned with a single and common objective of “reducing total emissions”, not merely “meeting individual’s allowances”. For example, if a firm has a selling price that is sufficiently higher than the carbon price, it would not be concerned about its carbon emissions and would thus produce high level of emissions.
In our proposed models, the policy maker who allocates the carbon emissions in the market can regulate the carbon price in order to minimize the total carbon emissions. Note that in general, policy makers do not have such an authority that implements a carbon price level in practice since it is determined via market mechanism in a way that balances social marginal cost and private marginal benefit from emissions. However, there has been an increasing necessity for a political instrument, such as price regulation, in order to rapidly vitalize and stabilize the market [
2,
3] to avoid several market failures of emissions trading system (e.g., windfall profit or carbon leakage). As a result, this study aims to provide a useful guideline for this kind of political instrument and regulation which indicates a direction and magnitude of price changes, not an exact price level. For the success of this idea, developing an efficient allocation scheme is critical, and we propose the following allocation mechanisms.
Our proposed allocation schemes are given as follows. (1) Separate Payment (SP): This model is currently implemented in most countries, and is thus, provided for benchmark analysis. Pre-assigned allowance limits restrict each firm’s emissions, and firms can trade their emissions separately in the market. (2) Deterministic Equal Splitting (DES): Total carbon emissions in the industry equally split among the firms to which they belong. This scheme is principally based on the microeconomic foundation of uniform allocation studied by Sprumont [
4]. (3) Allocation proportion to unit Carbon Emission rate (ACE): Total carbon emissions split according to each firm’s unit carbon emissions rate which is a factor reflecting each firm’s investment in clean technology (i.e., a firm that invest more in clean technology has a lower carbon emission rate). This scheme is based on the idea of proportional allocation proposed by Cachon and Lariviere [
5]. By examining a stylized model of each allocation scheme, we compare the schemes to determine which scheme generates more profits for the firms with less carbon emissions. The models we present are based on a newsvendor non-cooperative game under a Stackelberg framework. More specifically, the firms determine an optimal production quantity according to the newsvendor non-cooperative game based on the carbon price offered by the policy maker in order to minimize the total carbon emission in this industry. The non-cooperative game between these two vertical parties in a supply chain is modeled as a Stackelberg game, where the policy maker is the leader and the firms are the followers. Each game is characterized differently according to its allocation scheme, and the firms pay depending on their allocation scheme and amount of total carbon emissions.
From our analysis, the following conclusions are drawn. We show that our allocation schemes reduce total carbon emissions by aligning the firms with a single and common objective of “reducing total emissions”, not merely “meeting individual’s allowances”. Moreover, we characterize the conditions under which SP and DES equally generate less total carbon emissions than ACE. Furthermore, we identify the condition in which DES can dominate SP in terms of a firm’s profit while both policies generate the same total carbon emissions. Our numerical studies further demonstrate that DES outperforms SP in terms of a firm’s financial performance depending on the gap among the firms’ unit emission rates. Given the findings in this study, we provide a useful guideline and decision criteria for both the policy maker and the firms when adopting an allocation policy, and suggest the use of DES to help the firms enhance their profit while reducing total carbon emissions in the industry.
This paper is organized as follows. We review relevant literature in
Section 2.
Section 3 presents a model as a Stackelberg game where the policy maker as a leader attempts to minimize the total carbon emission and the firms as followers maximize their profit by anticipating the policy maker’s behavior. We first solve the firm’s problem in
Section 4, and then, deal with the policy maker’s problem in
Section 5.
Section 6 supports our findings with numerical experiments. Some concluding remarks are then given in
Section 7.
2. Literature Review
From the literature review, a broad consensus is observed that firms should pursue not only short-term profitability, but long-term sustainability. Given the constraints relative to the availability of non-renewable resources, firms focus more on developing their strategies to ensure the social and environmental sustainability of their operations [
6]. As some practical evidence for strategic behavior on the side of firms in cap-and-trade markets, Bushnell et al. [
7] provide an analysis for the response of the stock market to the devaluation of carbon permit costs, and Oestreich and Tsiakas [
8] find that firms receiving carbon emission allowances significantly outperform the ones not doing. In operations management area, researchers have developed a concept of closed-loop supply chains to contribute to this area [
9,
10,
11,
12]. Furthermore, a well-known operations area also follows this trend and generates other avenues such as production planning and control for re-manufacturing [
13], inventory management [
14], product recovery [
15], and reverse logistics [
16]. However, recovery of used products and re-processing (re-manufacturing, recycling, disposal, etc.) might increase operating costs and contribute to an increase in greenhouse gases. Indeed, these actions may not be sufficient to guarantee long-term sustainability. Carbon emission reduction through the carbon trading market is an activity that addresses this shortcoming of previous actions as it recognizes the interdependence among the three dimensions of the economic, environmental, and social performances of an organization.
It is generally accepted that carbon emission trading is one of the most effective market-based mechanisms to curb the amount of carbon emissions generated by firms [
17]. However, the operations has also been contributing to carbon emissions reduction, albeit differently. Cholette and Venkat [
18] find that different supply chain configurations can result in different energy consumption values and carbon emissions. Chaabane et al. [
19] build a mixed-integer linear programming-based framework for sustainable supply chain design to demonstrate that efficient carbon management strategies help firms achieve sustainability objectives in a cost-effective manner. Letmathe and Balakrishnan [
20] present a model to determine optimal product mix and quantities of firms in the presence of carbon emission regulations and constraints. Cachon [
21] studies the density, size, and location of retail stores considering the cost of carbon. Caro et al. [
22] point out that focusing on the life-cycle assessment and carbon footprint literature avoiding carbon double-counting is misguided, and find that emissions need to be over-allocated for efficient measure and emissions reduction. Pan et al. [
23] examine the environmental impact of pooling supply chains, and find that supply network pooling is an efficient approach in reducing carbon emissions. This type of operational approach is successful in reducing more carbon emissions with less or no cost than adopting low-energy-consumption technologies [
24]. However, industry and academia seem to have paid less attention to improving the carbon emission trading market itself. Our study contributes to this area by presenting new carbon emissions allocation schemes for the trading market which can align the firms to seek a single and common objective. This results in not only profitability improvement but also carbon emissions reduction.
In carbon trading markets, firms that generate more emissions than their allocated allowances receive significant fines or, to avoid such fines, purchase emission allowances off the market from those firms generating fewer than their allowed emissions. Allocating initial allowances to each firm is a primary challenge in a carbon trading mechanism and several emissions allocation methods have been investigated [
25,
26]. In the most widely used allocation method, emission allowances are grandfathered (allocated) according to the available historical emission data [
26]. Auctioning is also gradually emerging as an allocation method. To alleviate perverse incentives of grandfathering (e.g., carbon crooks and windfall profit), auctioning has recently received much attention, and the share of auctioning has increased progressively.
A fairly extensive body of economic studies is related to allocating allowances to different emitting agents. Among them, mechanism design with applications is the most relevant area that addresses this initial allowance allocation problem [
27]. Baliga and Maskin [
28] survey the concepts of mechanism design in the context of environment pollution. Arava et al. [
29] further explore the carbon credit allocation problem through mechanism design approach. The most important properties of allocating carbon emission credits are incentive compatibility, allocative efficiency, minimum budget balance, cost minimization, and individual rationality. Both incentive compatibility and allocative efficiency are achieved by the classical Vickrey-Clarke-Groves mechanisms [
30,
31,
32]. Among those mechanisms, the Groves mechanism [
32] is the most general. However, for the current setting, the Clarke mechanism [
31] suffices. These extant studies deal with the “initial” allocation of emission credits. However, this study aims to address allocation of total emissions in the industry at the end of the accounting year. By allocating total carbon emissions via our proposed allocation schemes, we expect every firm in the industry seeks the single and common objective of “reducing total emissions”, not merely “meeting individual’s allowances”; this results in reducing carbon emissions while enhancing the firms’ profitability. In addition to the contribution to the existing academic literature, the findings of this study can be of significant value for industry practitioners and policy makers.
3. Model
This paper considers n firms under the regulation of a carbon reducing policy maker. n firms determine an optimal production quantity according to a newsvendor non-cooperative game, and the policy maker regulates the carbon trading price in order to minimize the total carbon emission in this industry. The non-cooperative game between these two vertical parties in a supply chain is modeled as a Stackelberg game, where the policy maker is the leader and the firms are the followers. The abstract model description of this problem is then given as follows:
Production cost, selling price, and salvage value for the unit of product of firm i is denoted by and , respectively. Random demand for product of firm i is , while , , and are its probability density (positive) function, cumulative distribution and inverse distribution functions, respectively. It is generally assumed that probability density function, , decreases in u because higher demand happens less likely. Further, it is also common to assume that all demands are non-negative, so we assume that for all , . The carbon cap of Firm i is , and firm i needs to buy more carbon credit from the spot market at unit price if the carbon emission exceeds the given carbon cap. Let be the carbon emission for producing one unit of firm i’s product, such that the total carbon emission of firm i is given by when firm i produces units. Considering each firm has its own carbon cap for all i, the total carbon emission in the industry is given by . This total carbon emission is allocated to firm i by following a given allocation rule for all i. Hereafter, to simplify the notation we omit the arguments of notation throughout the paper (i.e., for all i). We examine three different allocation rules in this study.
By utilizing the setting given above, each firm
maximizes its expected profit
which is
where
. While
n firms determine optimal order quantities
, the policy maker determines an optimal carbon price for minimizing the total carbon emission in this industry. The policy maker then minimizes the total carbon emission
where
In summary, the non-cooperative game between these two vertical players in a supply chain is
where
and
are a strategic space of firm
i and the policy maker, respectively.
Since the policy maker possesses the freedom to price the carbon credits, the supply chain game is deemed a Stackelberg game with the policy maker as the leader and the firms as the followers. This game is solved by backward induction where we first solve the firm’s problem, and then solve the policy maker’s problem. The firms’ problem is characterized differently according to its allocation scheme as shown below.
4. Firms’ Problem: Carbon Emission Allocation Rules
We first solve the firms’ problem, and then solve the policy maker’s problem.
4.1. Separate Payment (SP):
To distinguish the equilibrium results of each allocation rule, we use subscription , , and throughout the paper, such as and for firm i under allocation scheme k.
Under SP, firm
i chooses its production quantity
to maximize his profit
By utilizing the first order condition, it is easy to show that the optimal
satisfies:
This is a typical newsvendor solution, whereby the critical ratio satisfies where is the under-stock cost and is the over-stock cost (In this case, and ).
The critical ratio under SP is given by
We provide insight into all of the solutions after characterizing the policy maker’s equilibrium outcomes in
Section 5.
4.2. Deterministic Equal Splitting (DES):
Under DES, firm
i chooses its production quantity
to maximize his profit
By utilizing the first order condition, it is easy to show that the optimal
satisfies:
Therefore, the critical ratio under DES is given by
4.3. Allocation Proportion to Unit Carbon Emission Rate (ACE):
Under ACE, firm
i chooses its production quantity
to maximize his profit
By utilizing the first order condition, it is easy to show that the optimal
satisfies:
Therefore, the critical ratio under ACE is given by
5. Policy Maker’s Problem
We can now solve the policy maker’s problem by utilizing the optimal response of each firm (
for all
i and case
) given in the previous section. Since the policy maker’s problem is
for all
k, we re-write this as
for all
k. In order to compute the first order condition of policy maker’s problem, we first get
by applying the chain rule as follows:
Then, the first order condition of the policy maker’s problem for all i and k is given by
- (1)
Separate Payment (SP,
):
- (2)
Deterministic Equal Splitting (DES,
):
- (3)
Allocation proportion to unit Carbon Emission (ACE,
):
By utilizing these first order conditions, we prove the following.
Lemma 1. is a convex-decreasing function of for all k.
Proof. First, it is easy to observe that for all k since is non-negative. Thus, is decreasing in . Further, we know that is decreasing in because is increasing in where is decreasing in . Since we assume decreases in u, we conclude that increases in . Therefore, decreases in (i.e., ). Thus, we have , and then conclude (i.e., is a convex function of ). This completes the proof. ☐
According to Lemma 1, the total emission decreases in carbon emission price. Higher
translates to fewer total carbon emissions, and the marginal effect of
decreases. Due to decreasing-convexity of the policy maker’s objective with respect to
, an optimal carbon emission price (
, say) would take the possible largest value under the range into which
falls. Therefore, if we can obtain a feasible interval of
, e.g.,
, then
. Such interval for Case 1 (SP) is given by
since the input value of the inverse cdf,
is only possible between 0 and 1. Rewriting this with respect to
results in
Since the above should be satisfied for all
i, it gives the following interval for
:
Therefore, the optimal price for Case 1,
, is given by
In analogous, the optimal prices for Case 2 and 3 are given
Suppose
,
for all
i. The optimal carbon prices are then determined by a value of
, and are not affected by the value of
. We further formalize this observation in the following theorem. We thus characterize the associated equilibrium outcomes as follows:
By comparing the equilibrium outcomes in (4)–(7), we summarize our findings in the following theorem, and provide their insights accordingly.
Theorem 1. The following statements are true.
- (1)
.
- (2)
If for all i, then for all i. Consequently, .
- (3)
Suppose , , , for all i. Then, for all i. Consequently,.
Proof. (Theorem 1 (1)), (Theorem 1 (2)) Straightforward from Equations (
1)–(6); (Theorem 1 (3)) Noting that
if
for all
i since
is a non-decreasing function, and from Equations (4) and (5). Without loss of generality, we sort
in decreasing order such that
. Then,
for all
i. Thus, we have
,
and
. This observation along with Theorem 1 (2) completes the proof. ☐
Theorem 1 (1) reveals that, the policy maker charges n times higher carbon price under DES compared to SP , but this higher price does not affect the firm’s production quantity as the critical ratios of both schemes given in Equation (4) are equal. An n times higher carbon price is justifiable as the firms equally share the aggregated emissions of n firms. It is also interesting to note that the free-riding problem is not observed in DES (i.e., the firms do not inflate their production quantities). If the firms can benefit from the public good or shared resources without contributing to the cost, one can expect free-riding to occur. Under DES, the firms pay more if the total emissions exceed the total allowances in the industry due to its higher carbon price compared to SP. On the other hand, the firms are paid more if the total emissions are below the total allowances. This higher price risk prevents the firms from inflating their production, and the free-riding problem is thus mitigated. Furthermore, if the carbon emission efficiencies among the firms are well-leveled ( for all i), the carbon prices under DES and ACE are the same as shown in Theorem 1 (2).
We recognize that the policy maker is indifferent in choosing either SP or DES since the same critical ratio of both schemes given in Equation (4) generates the same total emissions. This result is further specified in Theorem 1 (2), which shows that the policy maker is indifferent in choosing all the given allocation schemes (SP, DES, and ACE) when for all i. This implies that, when the firms have a similar carbon emission rate, the policy maker does not benefit from any proposed allocation schemes in terms of reducing carbon emissions. However, it is interesting to note that from Theorem 1 (3), SP and DES dominate ACE in terms of total carbon emissions under the specified conditions. A mass production market satisfies these conditions well since it is less segmented, where the selling price and production cost are well-equalized over the industry. The difference in implies that the firms implement different carbon emissions reduction technology into their operations where higher represents an environmentally less efficient firm. Under ACE unlike SP and DES, a firm which has a lower will pay less than a firm with a higher when the total emissions exceed the total allowances. On the other hand, a firm with a higher will be paid less when the total emissions are less than the total allowances. Therefore, an environmentally efficient firm has no incentive to produce less. An increase in the production of environmentally efficient firms results in an increase in total carbon emissions. Consequently, ACE generates more carbon emissions than SP and DES.
We now examine the impact of allocation schemes on a firm’s equilibrium profits. Our analysis focuses on SP and DES as we have already demonstrated that SP and DES dominate ACE in terms of total carbon emissions in the industry. By analyzing Equation (7), we obtain the following:
Theorem 2. Suppose , , , and for all i. Then, the following statements are true.
- (1)
if for all .
- (2)
for all i if where and .
Proof. (1) from Equation (7). We know (1) if from Equations (4) and (5), (2) , (3) . Combining (1), (2), and (3) shows . (2) from Equation (7). Thus, if and only if . By noting that , we have if . By rearranging the terms, we simplify the condition as since if and only if . ☐
Theorem 2 (1) demonstrates that an environmentally efficient firm earns more than a less efficient firm under DES. This intuitive result does not always hold under SP as can be verified from Equation (7). Thus, DES delivers more incentives to the firms investing in carbon emissions reduction technology in order to have lower than SP. The condition of Theorem 2 (2) is more likely satisfied when decreases. When decreases, the carbon price increases and the production quantities decrease. Lower production could result in the total carbon emission becoming less than the total allowances in the industry. Due to a higher carbon price in DES compared to SP from Theorem 1 (1), the firms are paid more under DES when the total emissions are below the total allowances. Consequently, the firm earns more under DES than under SP with the given condition. This means that under a more environmentally developed industry with a lower , the firms benefit more under DES than under SP and thus generate more profits. However, since excessive profits from the remaining emissions induce a greater social cost, the policy maker should properly design initial allowances by considering their trade-off.
6. Numerical Experiments
We showed that two policies (SP and DES) result in the same total carbon emissions with the same production quantities. Thus, the policy maker is indifferent in choosing either SP or DES in terms of total carbon emissions in the industry. However, firms prefer to be regulated by the policy that delivers more profit, provided the candidate policies generate the same total carbon emissions. A possible resolution to this issue can be found in Theorem 2 (2), in which, under a specific condition (i.e., , , , and for all i), DES dominates SP when satisfying . In general, this inequality is more likely to hold when approaches closer to because this reduces the value of the left hand side. Since and are the maximum and minimum carbon emission rates, respectively, among the firms, this implies that a large gap does not occur among the emission rates of the firms. Such phenomenon can occur in countries that are evenly developed from an environmental perspective. In other words, it can apply both environmentally well-developed and less-developed countries as long as they maintain a similar level of carbon emission rate. For example, in well-developed countries such as Germany, France, and Canada that seek aggressive reduction targets, firms equally exert much effort and investment in clean technology. On the other hand, we observe the opposite in less-developed countries where most firms are not interested in investment on clean technology because it is too costly and lack of regulation. For such countries, firms remain equally undeveloped from an environmental perspective. As a result, the countries that are environmentally either conscious or unconscious could benefit from DES in terms of firms profitability as well as carbon emissions reduction, while some other countries where firms have variable carbon emission rates would prefer SP in terms of firms’ profitability.
However, satisfying Theorem 2 (2) seems to be quite specific since this is not generally held. Furthermore, we cannot determine the policy that is more beneficial when this inequality does not hold. To deal with this issue, we numerically investigate the policy that would be more attractive in the firms’ perspective. We arbitrarily generate a number of values that do not satisfy this inequality, and randomly change the carbon emission rates, . Note that the values generated may not be realistic. Nevertheless, our findings based on the simulations could provide some meaningful results.
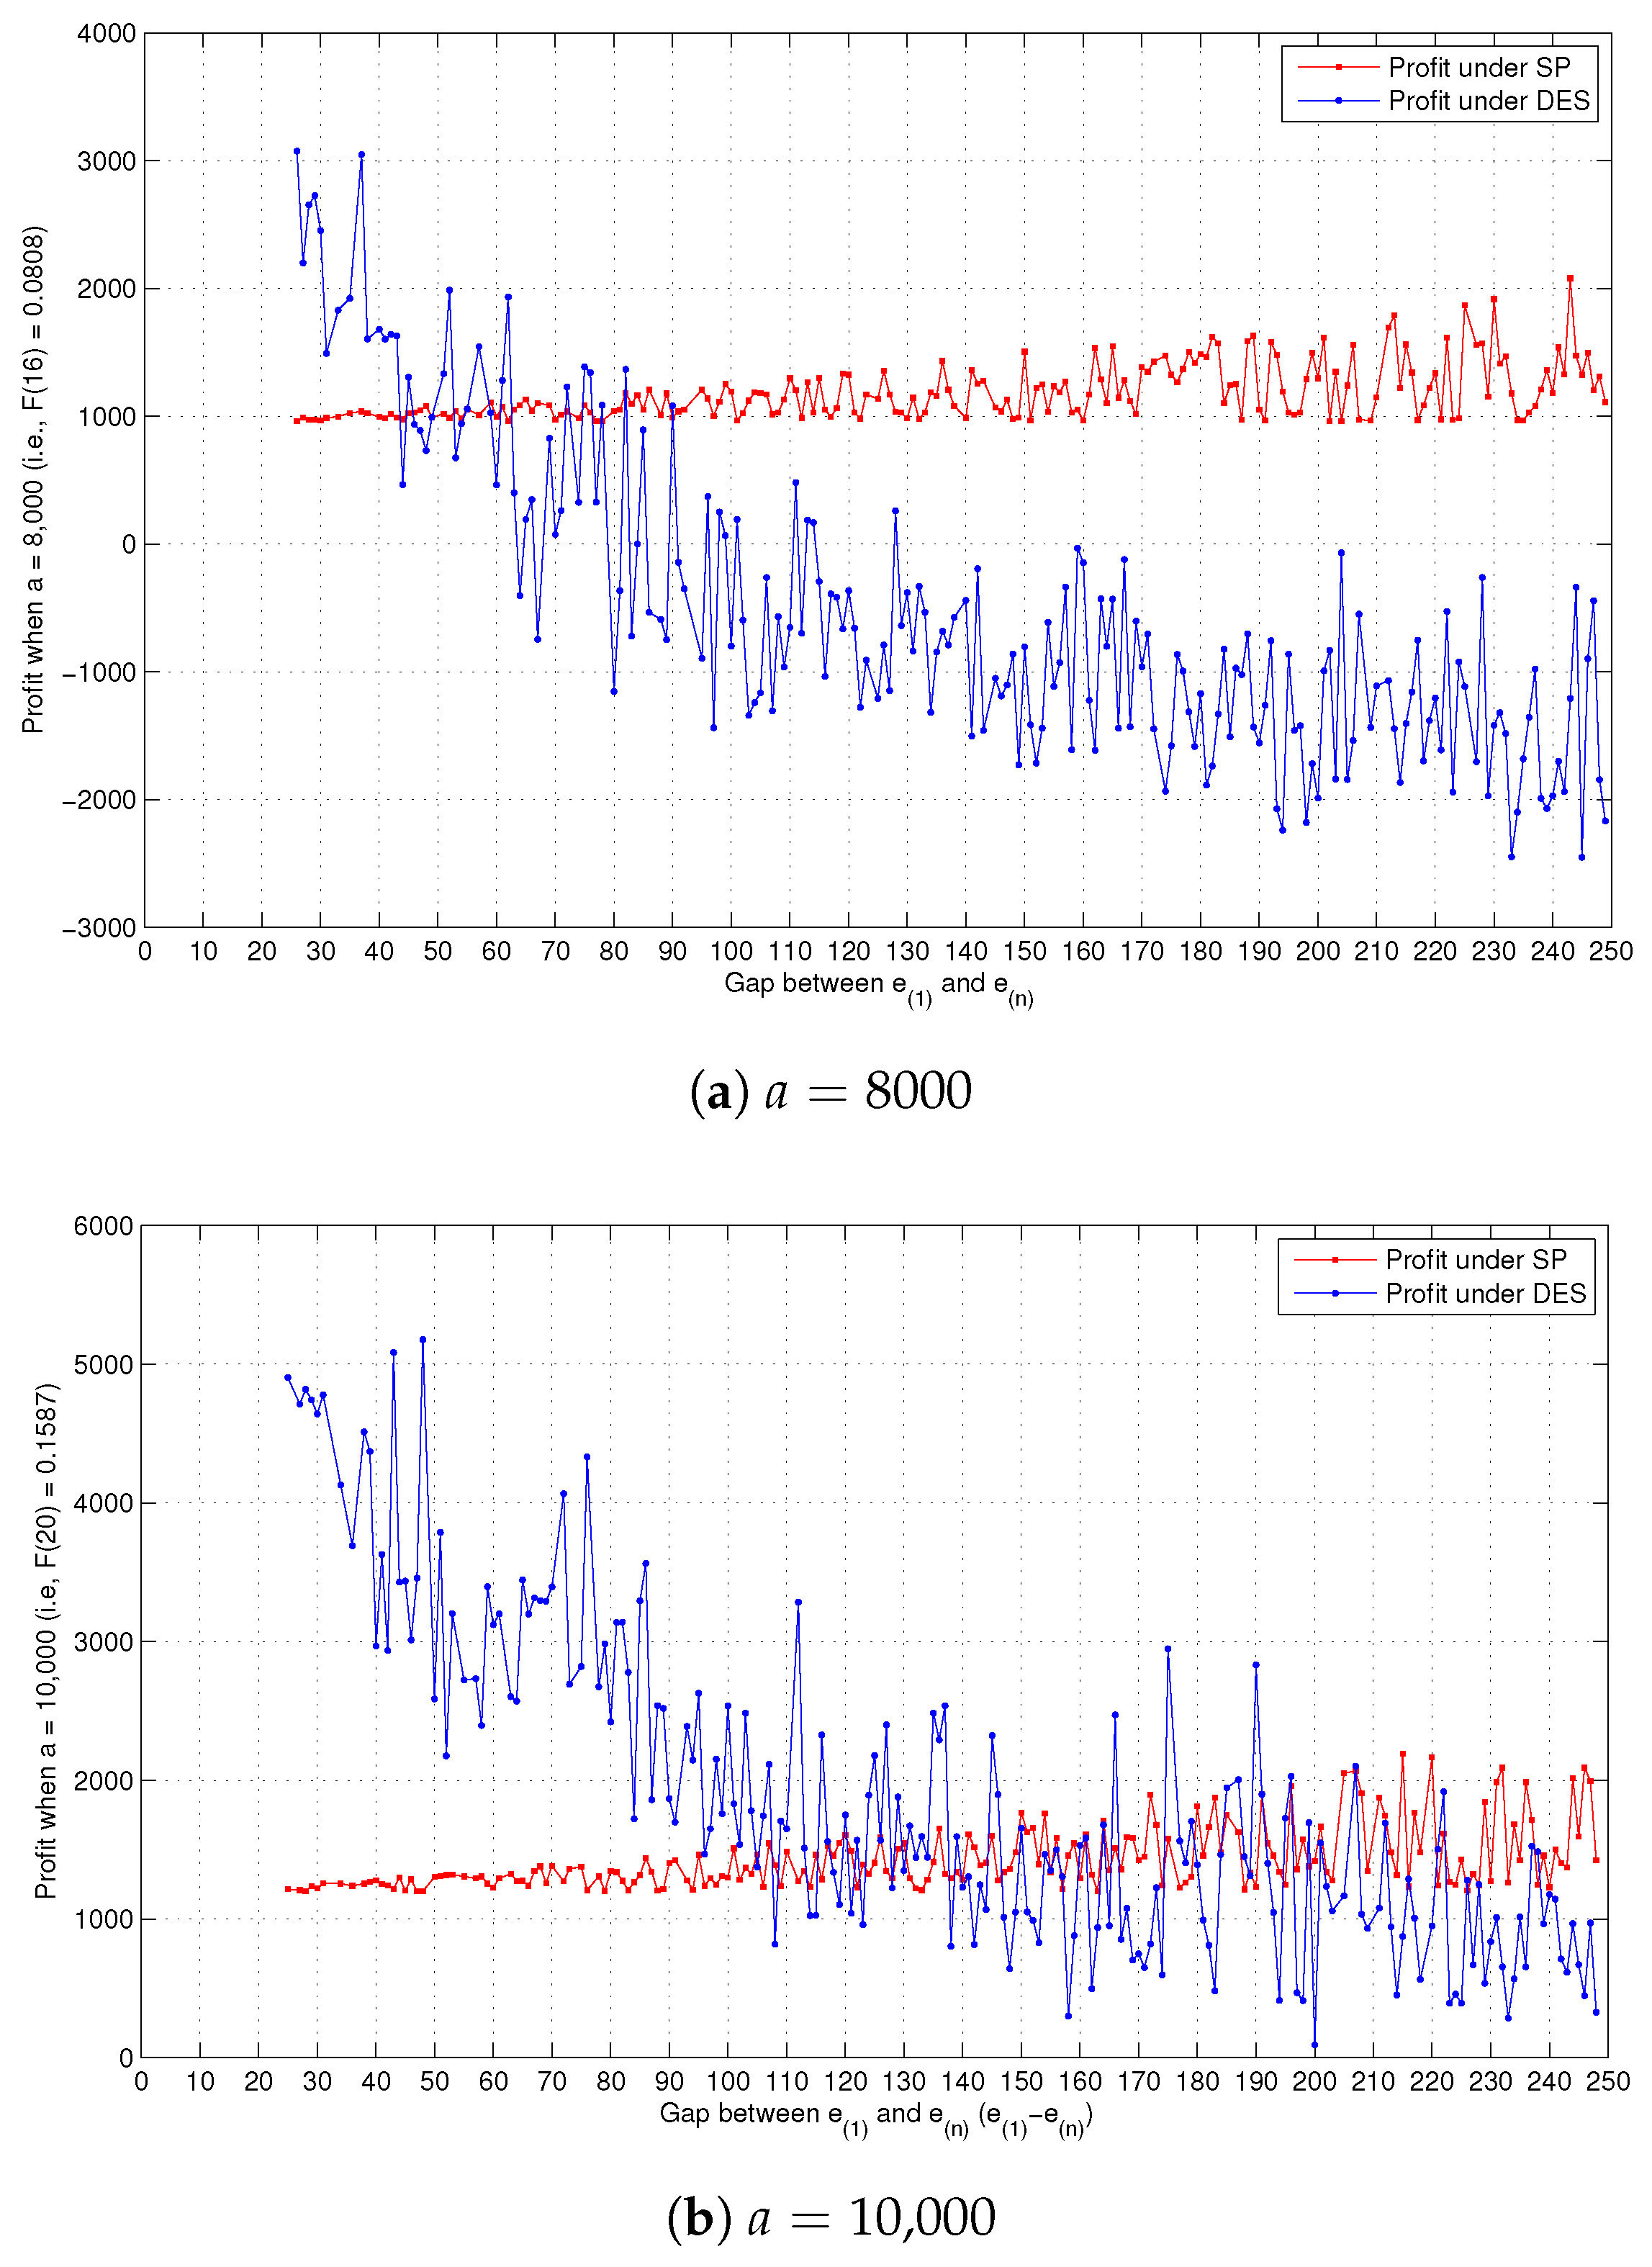
We found that DES provides more profit than SP under the condition that , even though both DES and SP give the same total carbon emissions. Nevertheless, this is only a sufficient condition for such dominance of DES. We observe that when the condition is not satisfied by changing , the difference in firms’ profits under DES and SP depends on the gap among the firms’ unit emission rates.
In this numerical study, we generate randomly by fixing the values of , , , and for all i. Considering 10 firms (i.e., ), we set , , , , , and . In addition, all the demands for firms follow the normal distribution with mean and variance , i.e., they are independent and identically distributed. We assume that Firm 1 has emission and Firm 10 has , and the emission rates of all other 8 firms are randomly chosen from the uniform distribution with interval . We then compare a certain firm’s profit under the two different policies, SP and DES, to determine the policy under which policy the firm obtains a higher profit. These computational experiments repeat by changing starting from 251 up to 475 by increasing by 1. Therefore, it is observed that the difference of the emission rates among the firms may affect their profits and for some values of . Considering Theorem 2 (2), we have and according to our setting. Therefore, plays a role in determining whether to satisfy the condition of since we change . Changing this value from 251 to 475 results in the value of from 0.4980 to 0.0500, and thus, changes (or, decreases) from 0.9960 to 0.1000. Thus, we want to observe the case when , whether the profit of a firm under SP policy outperforms that under DES policy.
Figure 1b shows that as the gap between
and
increases, SP acquires more profit than DES. Furthermore, while the profit under SP increases, the one under DES decreases as the gap increases. In other words, when the unit carbon emission
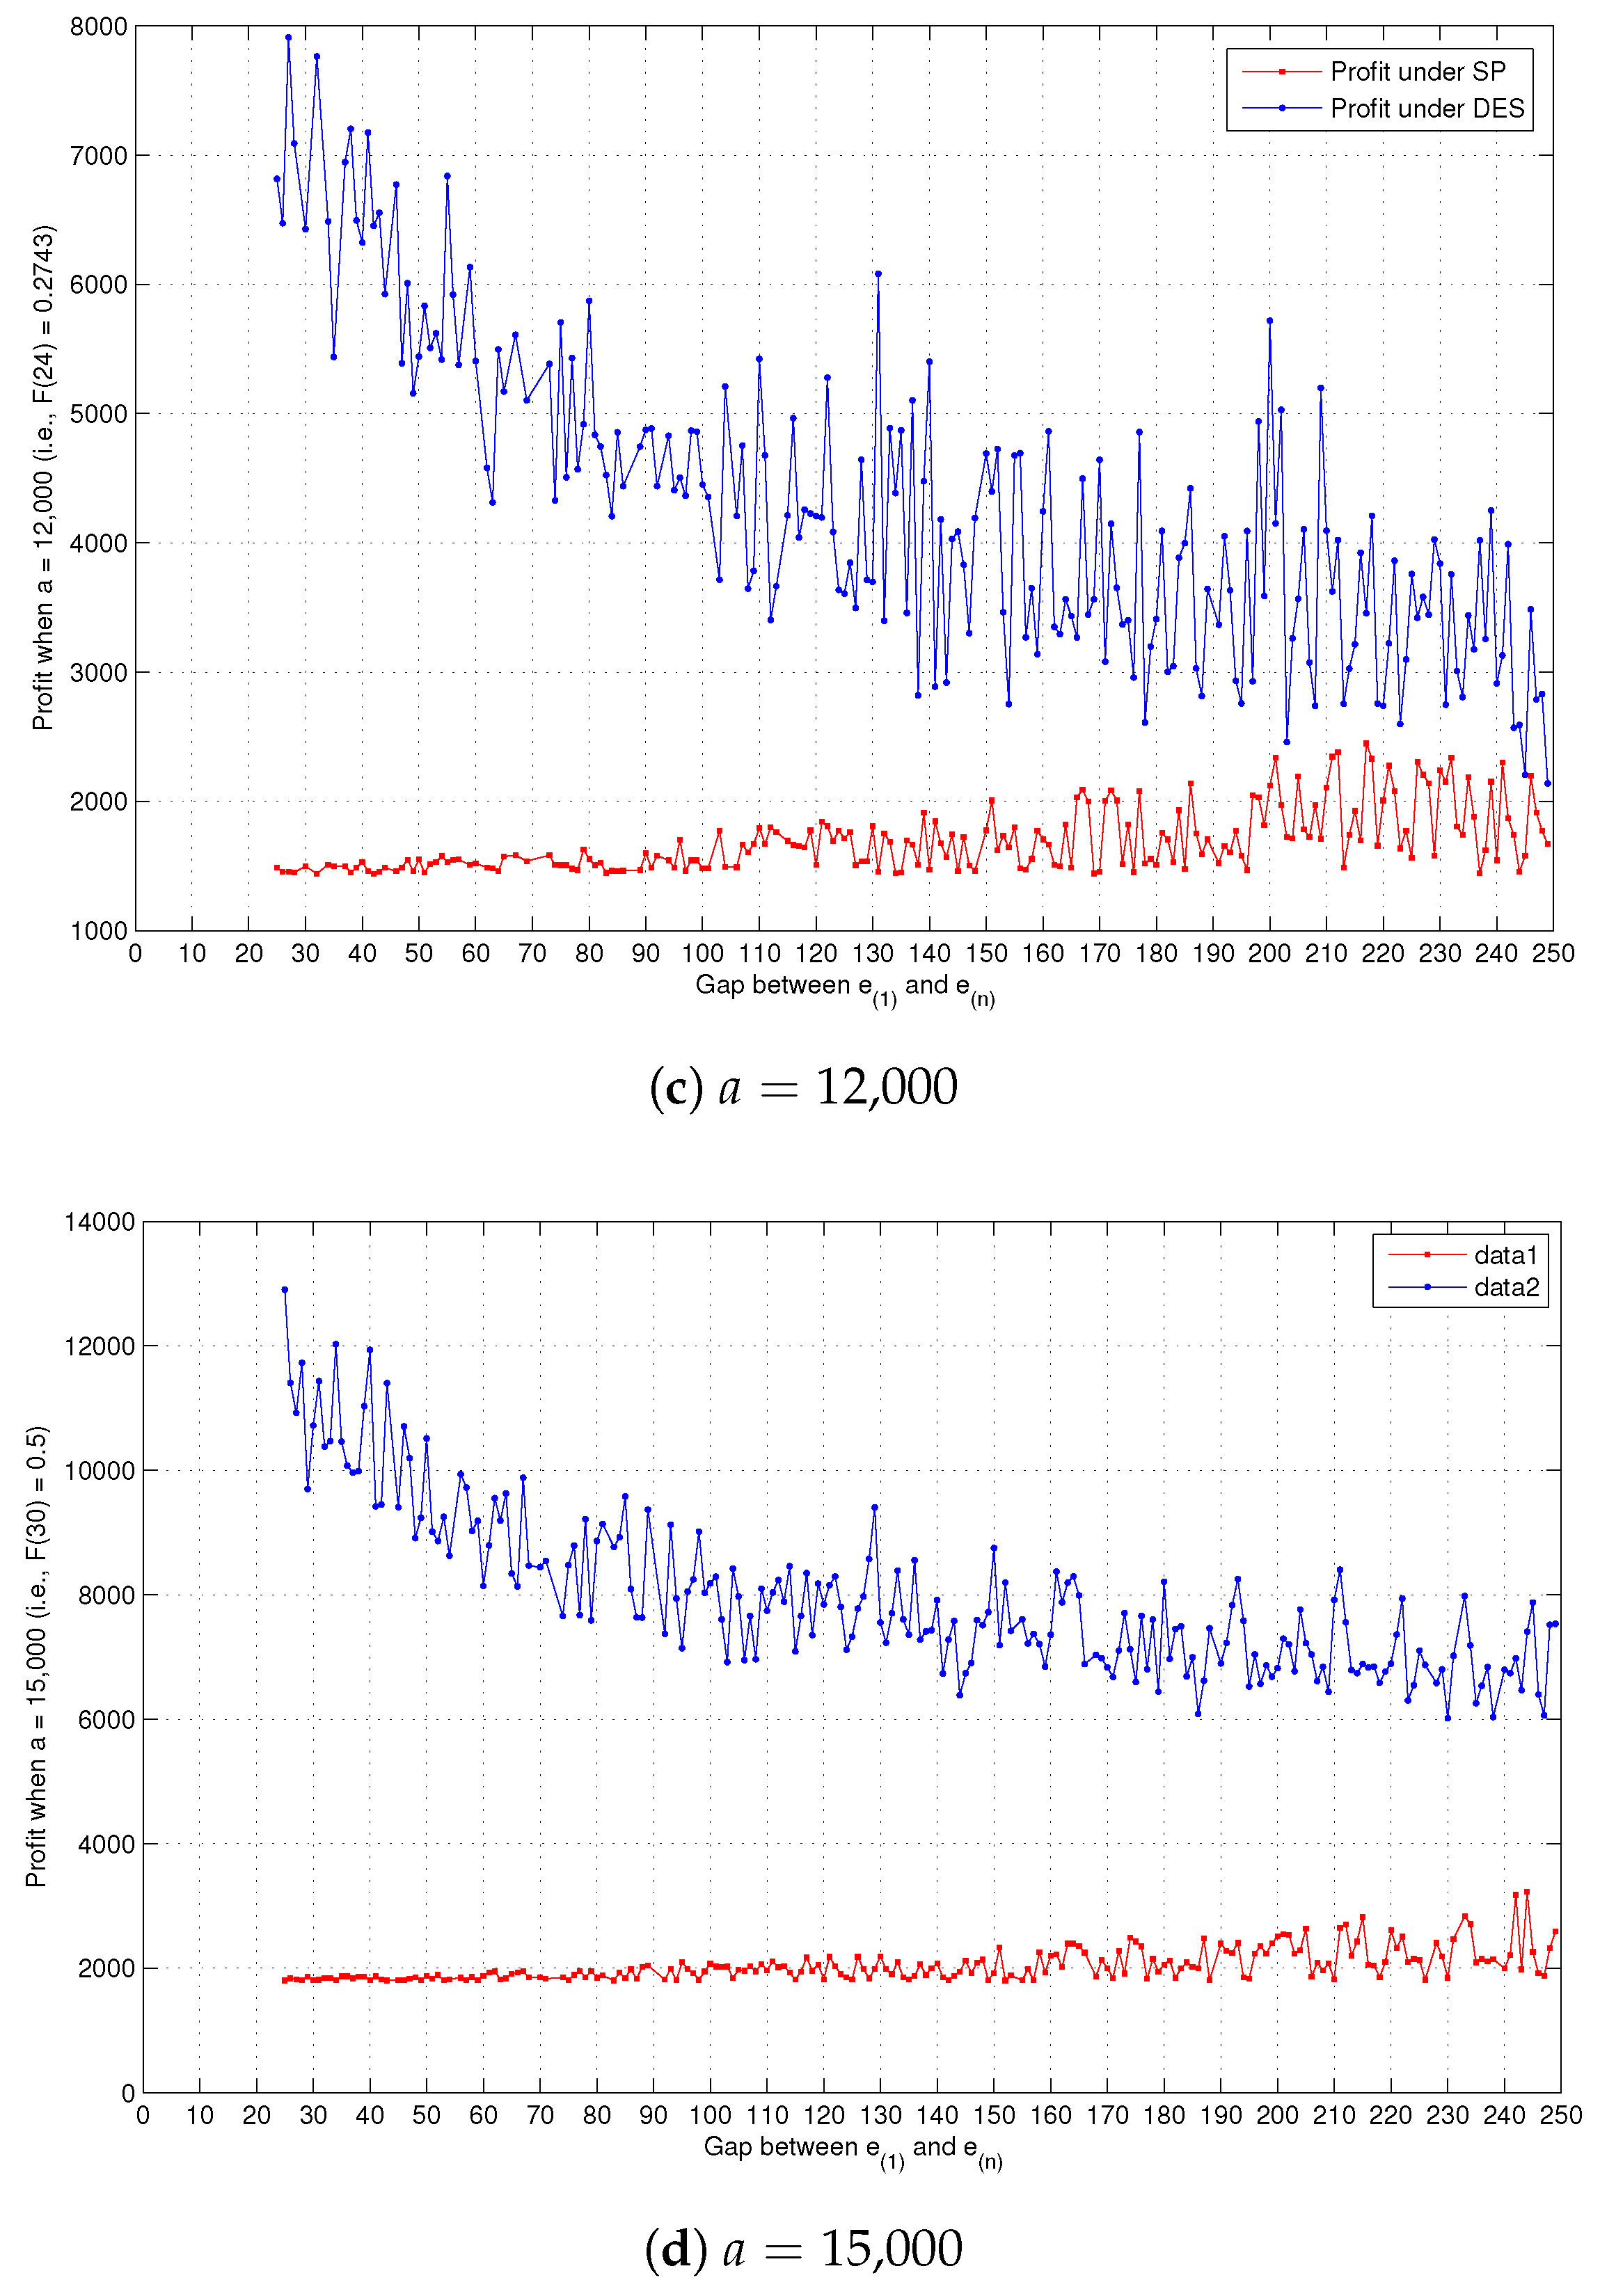
is more various among the firms, SP is more likely to outperform DES for each firm’s profit. Therefore, although the two policies provide the same total carbon emission, the policy maker would prefer to choose SP in the case where unit carbon emission rates significanlty differ among the firms, while they would prefer to choose DES when the differences in emission rates are sufficiently small. Profit may also be affected by carbon cap. As additional computations, we change
a to 8000, 12,000, up to 15,000.
Figure 1a,c,d show the corresponding results. As seen in these figures, SP obtains a higher profit in a relatively small gap between
and
when the carbon cap (
a) is small. However, as the size of the carbon cap increases, the chance for SP to have a higher profit than DES significantly diminishes. In this case, the policy maker would prefer to choose DES.
7. Conclusions
In this paper, we examined a case in which a cap-and-trade carbon trading market adopts some carbon allocation mechanism with the aim of reducing the effect of the inefficient initial allowances allocation system. While each firm is still restricted by its own allowances, the policy maker accumulates all remaining and exceeding carbon emission allowances over the industry, and allocates this total carbon emissions to each firm according to our newly proposed allocation rules: Deterministic Equal Splitting (DES) and Allocation proportion to unit Carbon Emission (ACE). Separate Payment (SP) allocation scheme is also provided for benchmark analysis. Using a Stackelberg framework based on a newsvendor non-cooperative game, we show how our suggested allocation schemes can change the carbon consumption behavior of the firms, and improve the social welfare associated with carbon emissions. Moreover, we show that this allocation reduces total carbon emissions by aligning the firms with a single and common objective of “reducing total emissions”, not merely “meeting individual’s allowances”. By comparing SP, DES, and ACE, we characterize a certain condition where ACE generates more total emissions than SP and DES. This implies that SP and DES outperform ACE in terms of reducing carbon emissions. Furthermore, we found the condition in which DES can dominate SP in terms of a firm’s profit while both policies generate the same total carbon emissions. Our numerical studies further demonstrate that DES outperforms SP in terms of a firm’s financial performance depending on the gap among firms’ unit emission rate.
Given the findings in this paper, we provide a useful guideline and decision criteria for both the policy maker and the firm when adopting a proposed allocation policy, and suggest the use of DES to help firms enhance their profit while reducing total carbon emissions in the industry. More specifically, from a practical perspective, if a market is well-equalized over the industry in terms of selling price, production cost, salvage value, and carbon cap, such as in the mass production market, then the policy maker would like to adopt DES and SP rather than ACE. Moreover, under such an industry, a firm that has a lower carbon emission rate has a more benefit in its profit when adopting DES. This implies that DES can encourage the firm to invest more in clean technology to have a lower carbon emission rate, which is a right direction to construct environmentally sustainable business. In addition, if the firms’ carbon emission rates have more variety, taking SP provides more profits to the firms, whereas the ones whose carbon emission rates are similar would prefer to adopt DES. Therefore, countries in which firms maintain a similar level of carbon emission rate due to their market circumstance and regulation will take more advantage to adopt DES. On the other hand, for several countries in which the level of clean technology investment is much differentiated, SP provides more profit to the firms. Therefore, depending on the situation where each country or society faces, the policy maker can have a different choice.
Despite our findings and practical implementations, the models we suggest in this study have several limitations that need further investigation. First, due to the decentralized decision making of the firms, a free-riding problem would be expected on sharing the total carbon emissions in the industry. Hence, extending our models to address the issue of free-riding and self-interest could result in newer insights. Second, it would be interesting to extend our model to incorporate the impact of firms’ behavior regarding their initial carbon cap. Such analysis would enable us to anticipate the potential political and managerial impacts when we allow firms to request their carbon cap. We expect such future research topics to be handled in order to sustain energy issues that have been raised globally over the world.


