Modelling and Evaluation of Battery Packs with Different Numbers of Paralleled Cells


1
TUM CREATE Ltd., 1 CREATE Way, #10-02 CREATE Tower, Singapore 138602, Singapore
2
Institute of Automotive Technology, Technical University of Munich, Boltzmannstraße 15, Garching, 85748 Bavaria, Germany
*
Author to whom correspondence should be addressed.
World Electr. Veh. J. 2018, 9(1), 8; https://doi.org/10.3390/wevj9010008
Submission received: 2 May 2018
/
Revised: 2 June 2018
/
Accepted: 4 June 2018
/
Published: 7 June 2018
(This article belongs to the Special Issue Selected Papers from The 30th International Electric Vehicles Symposium and Exhibition (Stuttgart, Germany))
Abstract
:To better evaluate the configuration of battery packs in electric vehicles (EV) in the early design phase, this paper proposes a mathematic model for the simulation of battery packs based on the elementwise calculations of matrices. This model is compatible with the different battery models and has a fast simulation speed. An experimental platform is built for the verification. Based on the proposed model and the statistic features of battery cells, the influence of the number of paralleled cells in a battery pack is evaluated in Monte-Carlo experiments. The simulation results obtained from Monte-Carlo experiments show that the parallel number is able to influence the total energy loss inside the cells, the energy loss caused by the balancing of the battery management system (BMS) and the degradation of the battery pack.
1. Introduction
The production technology of battery cells has greatly progressed, but the unevenness of the cell properties, e.g., the capacity, the inner resistance and the polarization time constants, between different cells is still inevitable [1,2]. The unevenness of cells will certainly result in extra charging and discharging processes when the cells are connected in a battery pack. For the paralleled cells in the pack, due to the difference of the polarization time constants and the inner resistance, a self-balancing process between cells can be observed after a charge or discharge [3,4,5,6]. For the cells in series, the cells with higher capacity will have a higher state of charge (SOC) than the average value during the operation of the battery pack. The extra SOC in those cells must be dissipated by the passive or active balancing of a battery management system (BMS) to prevent the over charge or over discharge of the weak cells [2,7]. As these additional cyclings of the batteries cannot be eliminated due to the unevenness of the cell properties, it is important to understand how the configuration of battery packs can influence those additional processes and how these additional processes can influence the electric and degradation behaviours of a battery pack. This knowledge can find a better configuration of a battery pack for different applications in early design phases. In this paper, the focus is the impact caused by paralleling more cells of the same type in a battery pack.
Previous researchers also noticed the importance of the parallel number and the additional charging or discharging processes in the battery pack. The conclusions, however, are different. Reference [8] compared the degradation behaviours of a battery pack and a single cell in an experiment, in which the high quality and homogenous cells were used. No obvious difference of degradation between a single cell and a battery pack was identified. References [6,9] concluded that a significant accelerated degradation can be observed when the capacities or resistances of two paralleled cells are largely different from each other. In addition, the conclusion of [5] is that when the difference of inner resistances and capacities between cells is large, connecting more cells in parallel can reduce the stress on each individual cell and therefore decelerate the degradation of the whole battery pack.
One possible explanation for the contradiction of those conclusions in different tests is that all the aforementioned studies largely depended on the results obtained from a limited number of samples, a coincidence which could thus be taken as the conclusion for the whole population. Secondly, all the conclusions were drawn based on the comparison between only one battery pack with a specific configuration and a single cell. The difference of the conclusions could be caused by the difference of the battery pack configurations. Therefore, in order to obtain a more general view of the influence of the parallel number, a statistic approach should be taken in the research and a large number of different battery packs should be tested.
However, testing a large number of battery packs in experiments is too time-consuming and ineffective in terms of cost. An efficient method to simulate battery packs is thus required. Zhang and Miyatake’s group [3,4] used Simulink to simulate the current distribution between paralleled cells, but expanding the model to thousands of interconnected cells is difficult, as every cell in the battery pack needs to be set and connected manually in the software. Zhang’s group [3] built a model of a battery pack based on the models of the cells in the complex frequency domain. This model can be easily expanded to simulate large battery packs, but it contains a time-consuming iteration and therefore is not suitable for large scale simulations or degradation simulations. Wei’s group [10] built a battery cell model and realized an effective and accurate SOC estimation. Many research [11,12,13,14] developed pack models for the same purpose. Zhong’s research [15] further takes the differences of the cells in a battery pack into consideration for SOC estimation. However, as the main focus of these studies is SOC or SOH estimation, the models are not directly appropriate for large scale simulation to evaluate battery pack configurations.
Therefore, to enable the quick evaluation of battery packs while taking the statistic view, this paper firstly proposes a model of battery pack based on the elementwise calculation of matrices, in which different cell models can be implemented. Experimental results are obtained for the verification. Then the distributions followed by the properties of battery cells are obtained from the measurement results of 50 NCR18650PF cells. Based on the model and the statistic features of NCR18650PF cells, different battery packs are generated and simulated in Monte-Carlo experiments with the focus on how the number of cells in parallel can influence the efficiency and the degradation of battery packs.
2. Battery Pack Model
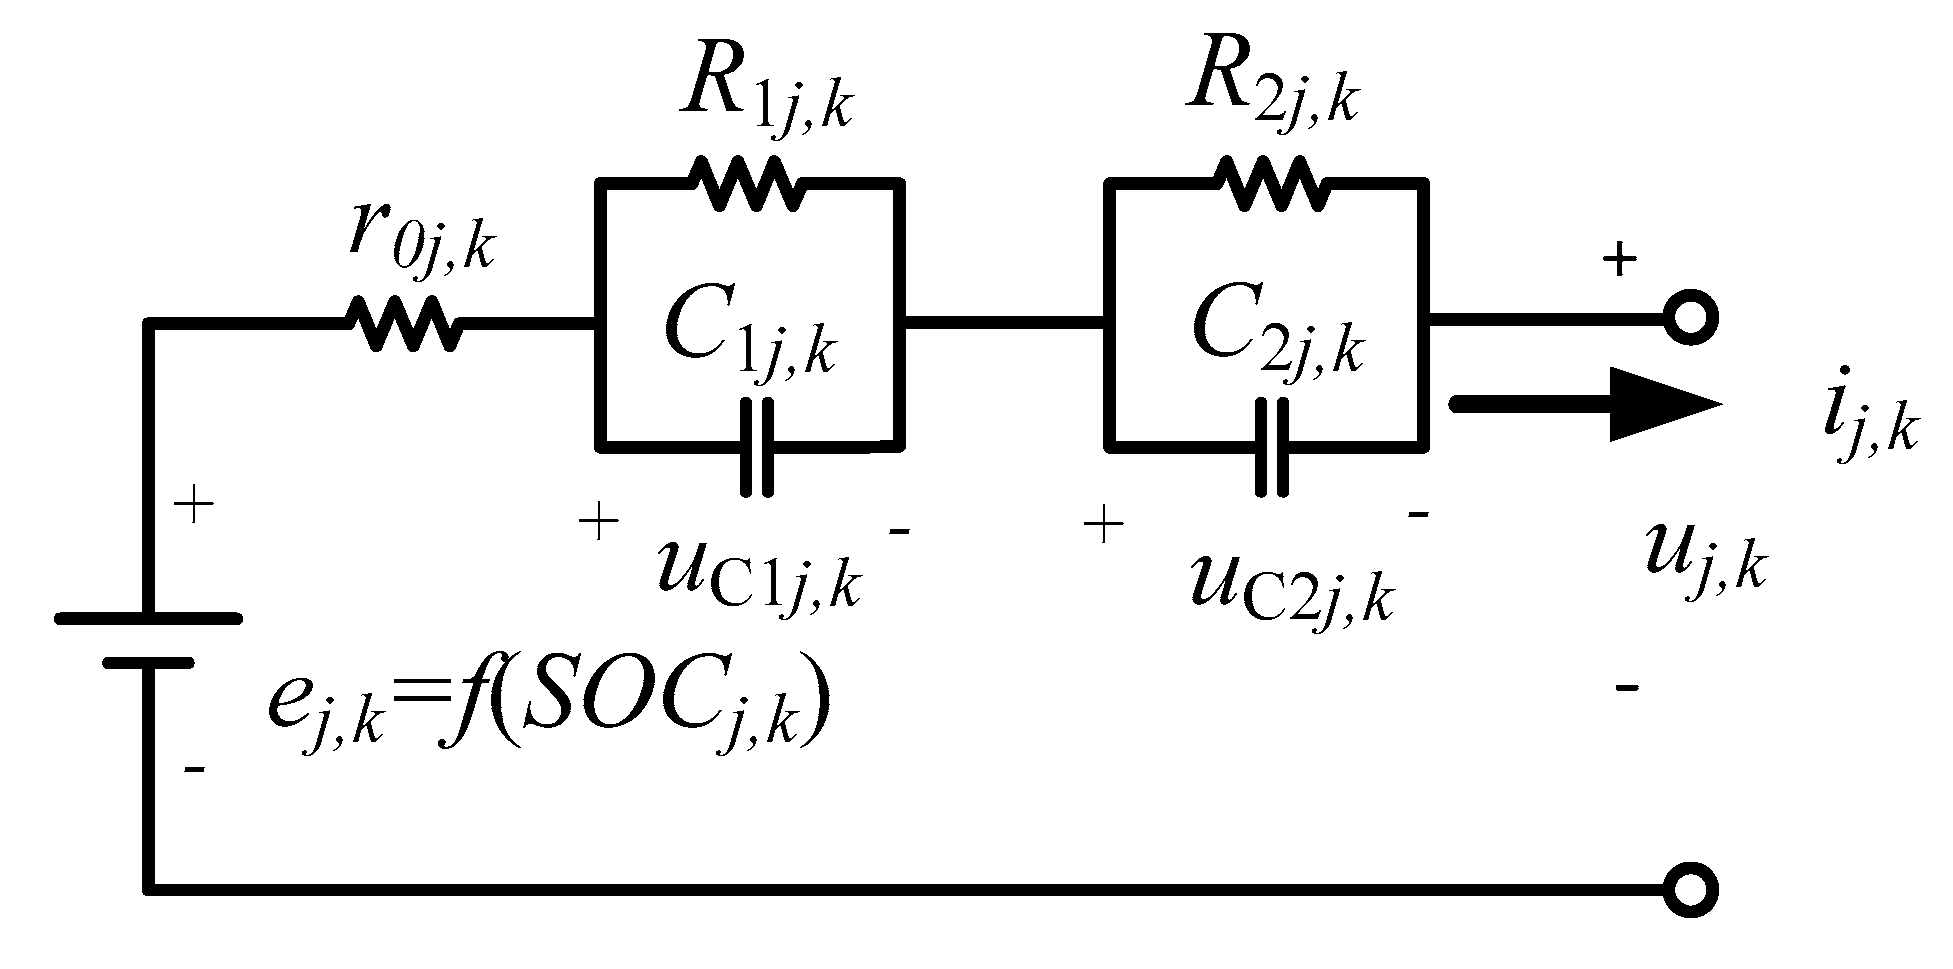
To build the battery pack model, this paper uses a second-order cell model [3] in Figure 1. The resistor R0j,k is the Direct Current (DC) inner resistance. The open circuit voltage (OCV) ej,k is generated according to the state of charge, SOCj,k. ij,k is the output current of the cell while the terminal voltage is denoted by uj,k.
Two RC circuits are used to demonstrate the polarization during charge or discharge. The four parameters, R1j,k, C1j,k, R2j,k, C2j,k, can be identified by measuring the transient voltage when the cell is discharged by a constant current. R1j,k and C1j,k are denoted to have a smaller time constant than that of R2j,k and R2j,k, so that the polarization in the short term (several seconds) and the long term (in minutes level) can be demonstrated by R1j,k, C1j,k and R2j,k, R2j,k respectively. uc1j,k and uc2j,k are the voltage of C1j,k and C2j,k. uj,k is the terminal voltage of the cell. In this model, the resistance and capacitance are assumed to stay constant. The dependency on the SOC is neglected.
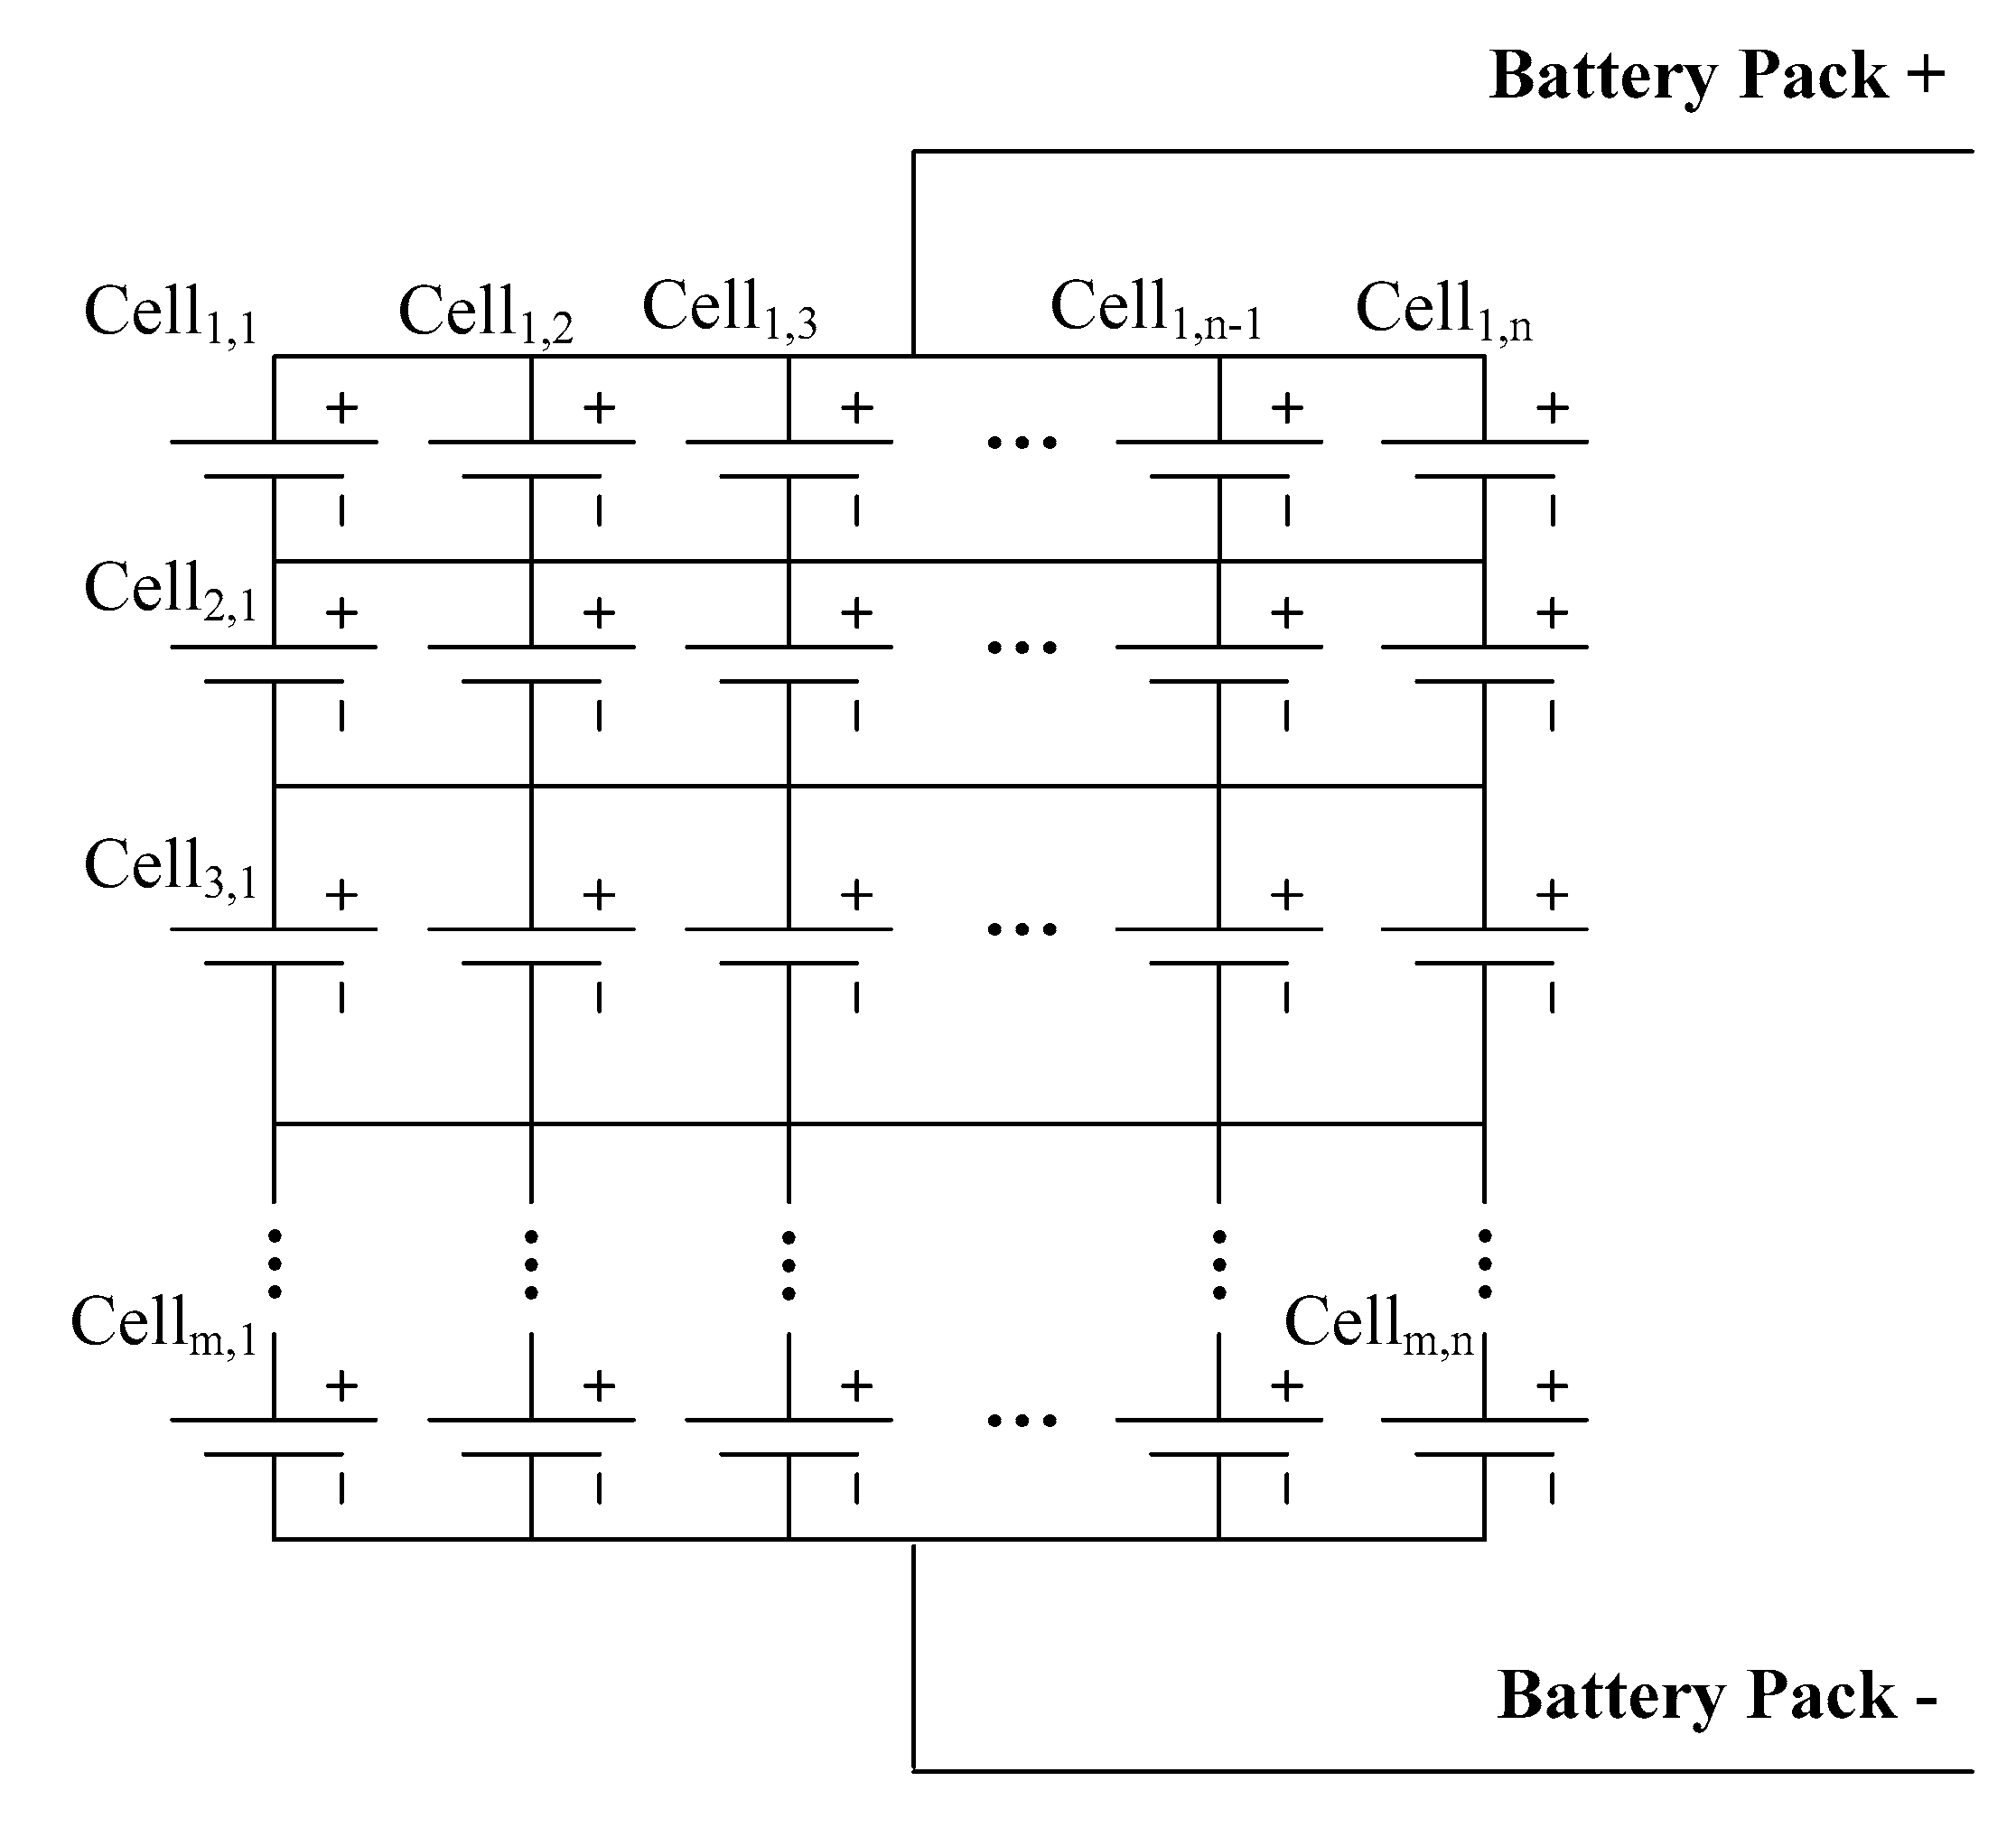
For a battery pack composed of n cells in parallel and m rows of paralleled cells connected in series (represented by npms thereafter in this paper), the quantity in Figure 1 with subscript j,k means the properties of the cell in the jth parallel row and the kth column of the pack, as demonstrated in Figure 2. Qj,k is the capacity of the corresponding cell. The output current of the pack is represented by ipack. The output of the model is the current and the voltage of each cell in the battery pack, when the load of the battery pack, ipack, is given.
To calculate the output variables with a given input, paralleled cells in one row are analysed first. In a given row, e.g., the jth row, since all the battery cells are connected in parallel, the terminal voltage of the cells is the same, denoted by uj. Using Kirchhoff’s law of current, the following group of equations can be derived in Equation (1):
In Equation (1), by transforming the cell terminal voltage equations into the cell current equations and then substituting all the cell current values in the pack current equation, Equation (2) can be obtained. The uj and correspondingly the current of each cell can be calculated by Equation (2) if the polarization voltage and OCV are known.
However, the OCV and polarization voltage are state variables in this model, which cannot be calculated directly with only the information at a given point of time. Equations of state should thus be built to continue the modelling of the battery pack. Using the integer l to represent the lth step of the simulation, assuming that the initial SOC values of all the cells are already known, and that the polarization voltage of all the cells is zero initially, the equations of state in Equation (3) can be obtained.
Δt is the time step of the simulation. In each step, four state variables, the SOC, the OCV and the polarization voltage values are updated first. Then the current distribution within the paralleled cells in the jth row and the cell voltage are recalculated, which will be used to update the state variables in the next simulation step. For the battery cells in other rows, the results could be obtained by sweeping the subscript j from 1 to m. In this way, the current and voltage of all the cells in the npms battery pack can be obtained. In addition, it should be noted that the assumptions in this model are common in reality, because most battery tests should start at a known SOC value and after a long time of relaxation eliminate the polarization voltage. Therefore, the model in Equation (3) can be reliably used to simulate a battery pack.
As the model has no nonlinearly coupled variables, the model can be rewritten as the elementwise calculations of matrices as in Equation (4), in which all the operations of matrices are elementwise operations. Compared to calculating each variable in loops, the transformation (also known as vectorisation) of the model can significantly improve the calculation speed if the Intel Math Kernel Library (MKL) is implemented in the simulation environment [16]. An example of such a simulation environment is MATLAB. On an Intel i7 6600U CPU, using this model on MATLAB, a simulation, in which a 72p108s battery pack (the configuration of the battery pack in Tesla Model S) discharged by a fluctuating load for 1800 s (time step 0.1 s) and then left stand for relaxation for another 800 s, is finished in 51.87 s.
It should also be noted that the second-order cell model used in this paper can be replaced by other more advanced cell models for different purposes of research, e.g., the dependency of parameters on the SOC can be further considered. The derivation procedure of the battery pack model in this paper still applies. As the main contribution of the paper, the battery pack model is mainly proposed as a calculation framework. Hence the model can be easily used by other researchers with different focuses on cell or pack behaviours.
3. Experimental Verification of the Proposed Model
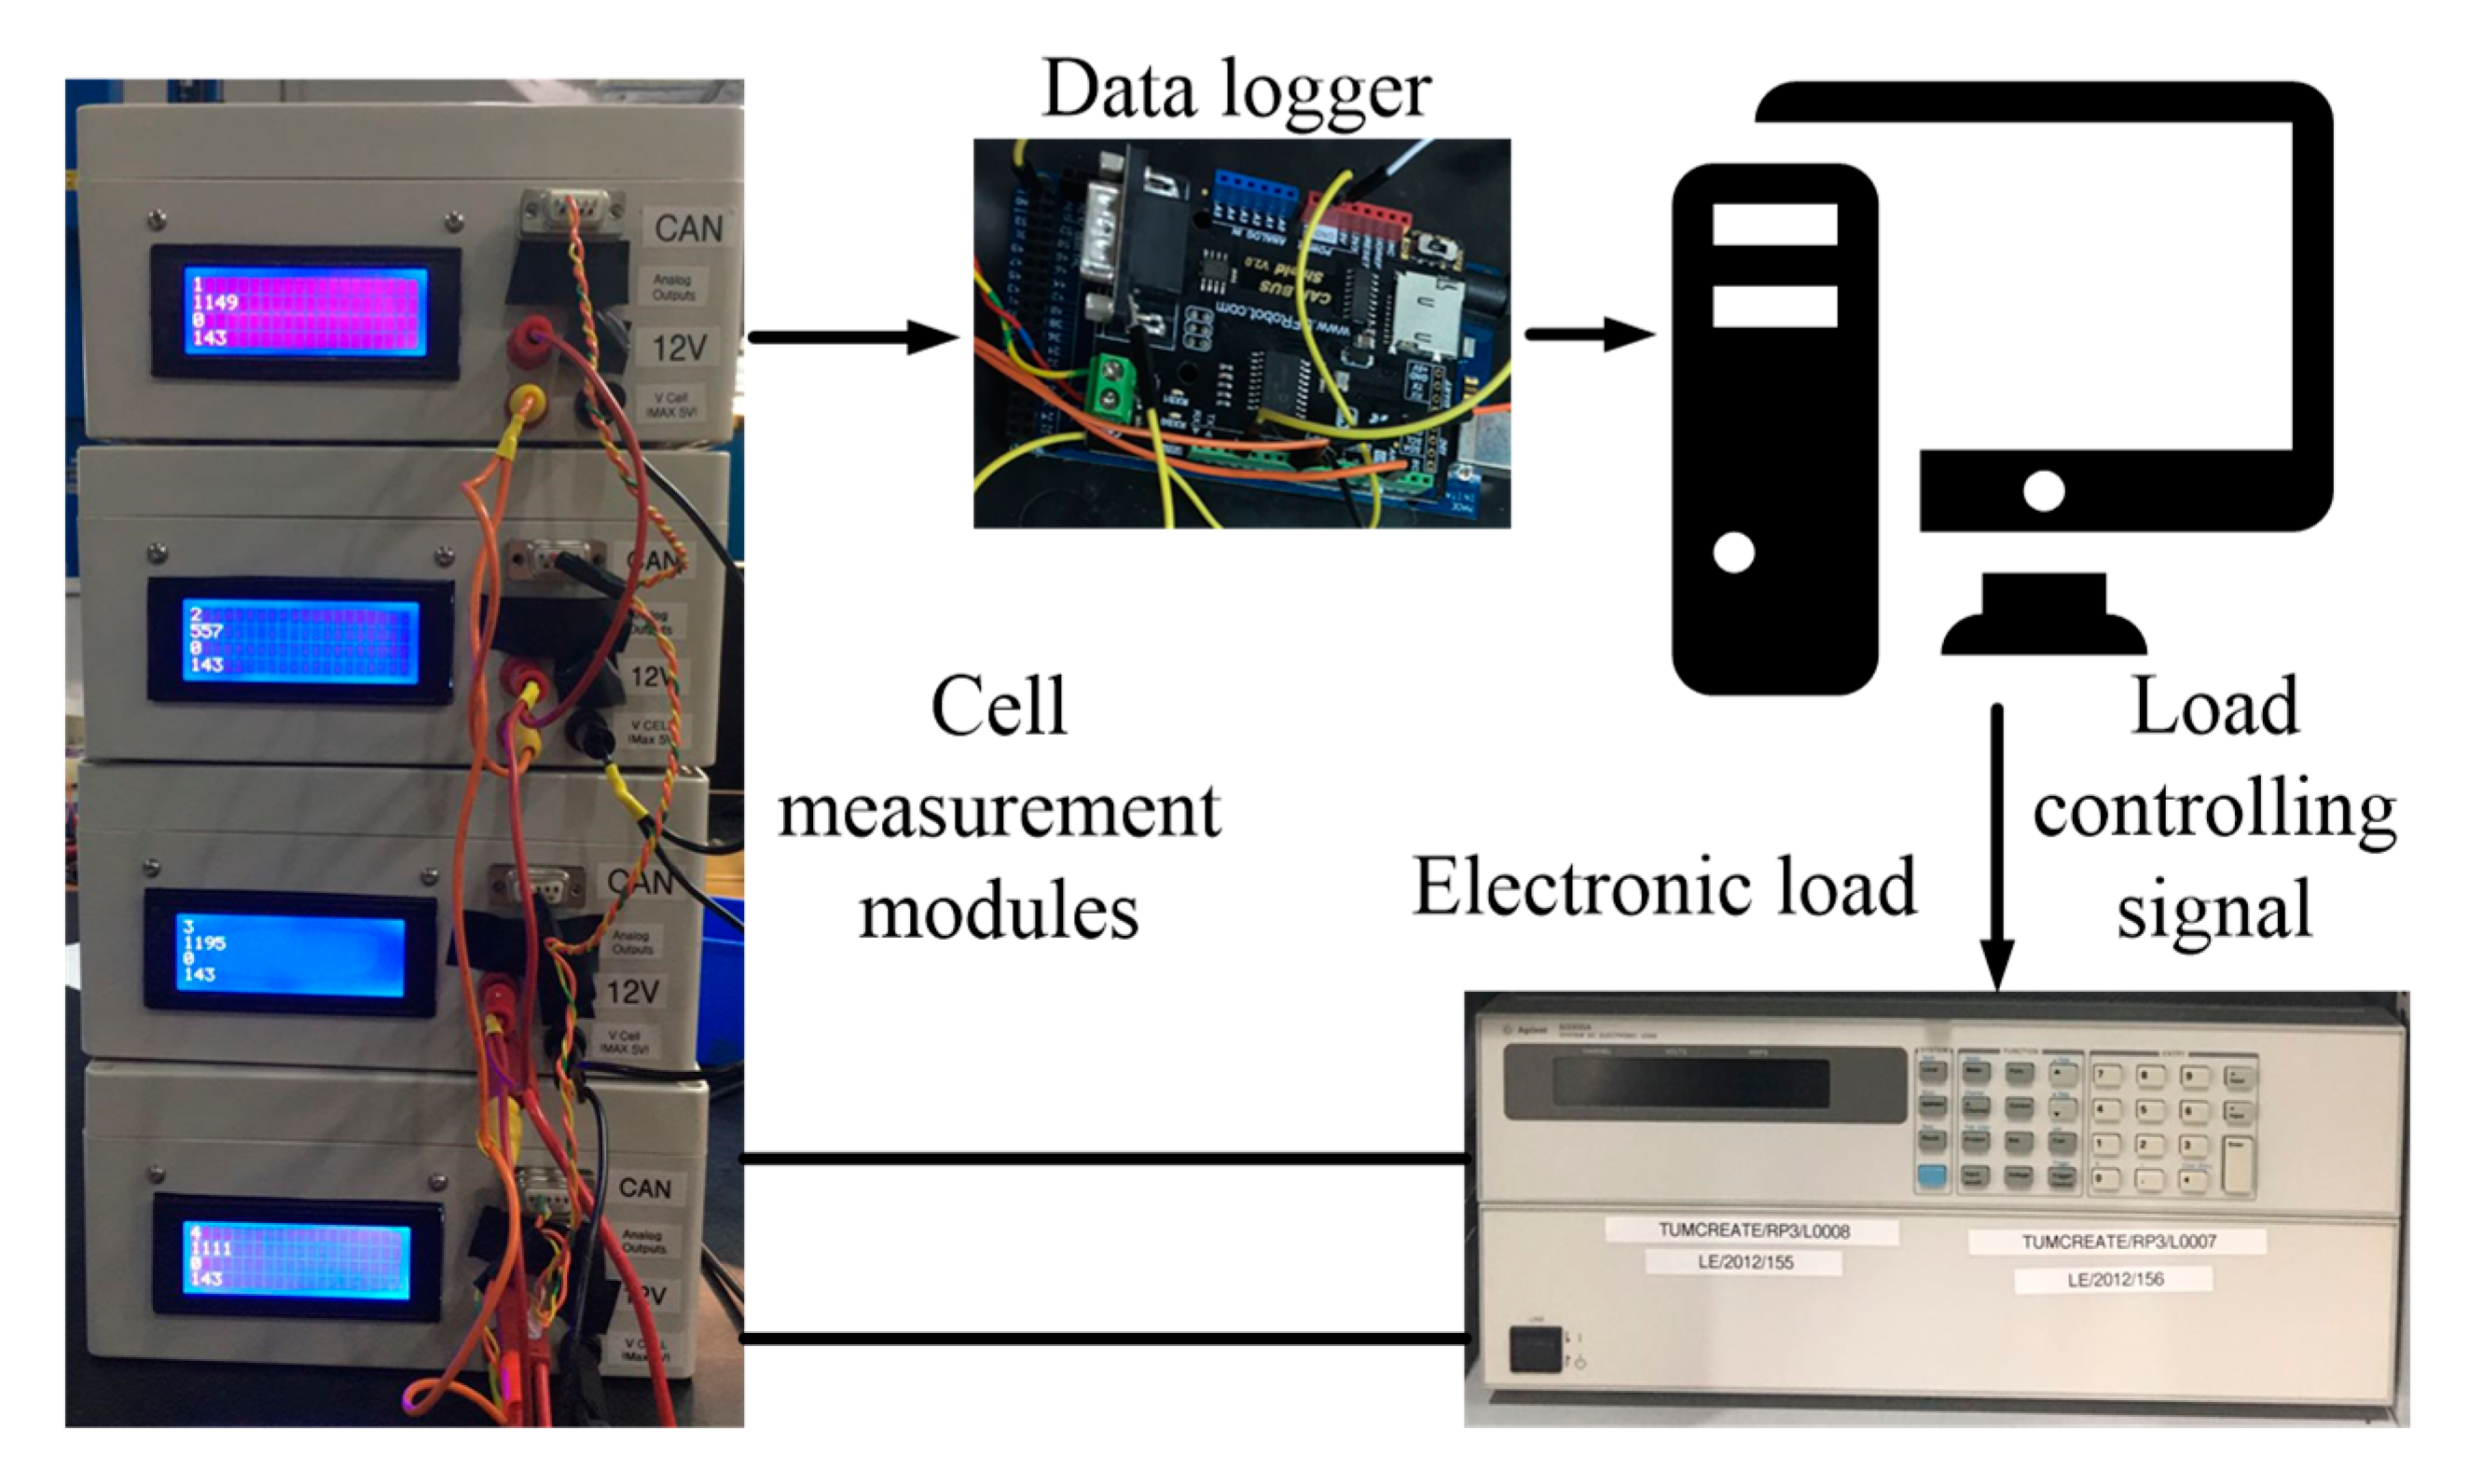
In order to verify the model, an experiment platform was built (Figure 3). This platform is used to measure and record the current and voltage of four paralleled battery cells when they are discharged or charged. The cells are Panasonic NCR18650PF cells rated at 2.9 Ah. The identification is done at 80% of SOC. However, as stated in Section 2, the parameters of cells in this paper are assumed to be SOC-independent. Errors can thus occur when the influence of SOC on parameters are significant. The line resistance from each cell to the load is also measured accurately by a Kelvin bridge before the experiment, as the line resistance is comparable with the DC resistance of cells and has a large impact on the current distribution. The cell parameters and the line resistance Rline are listed in Table 1.
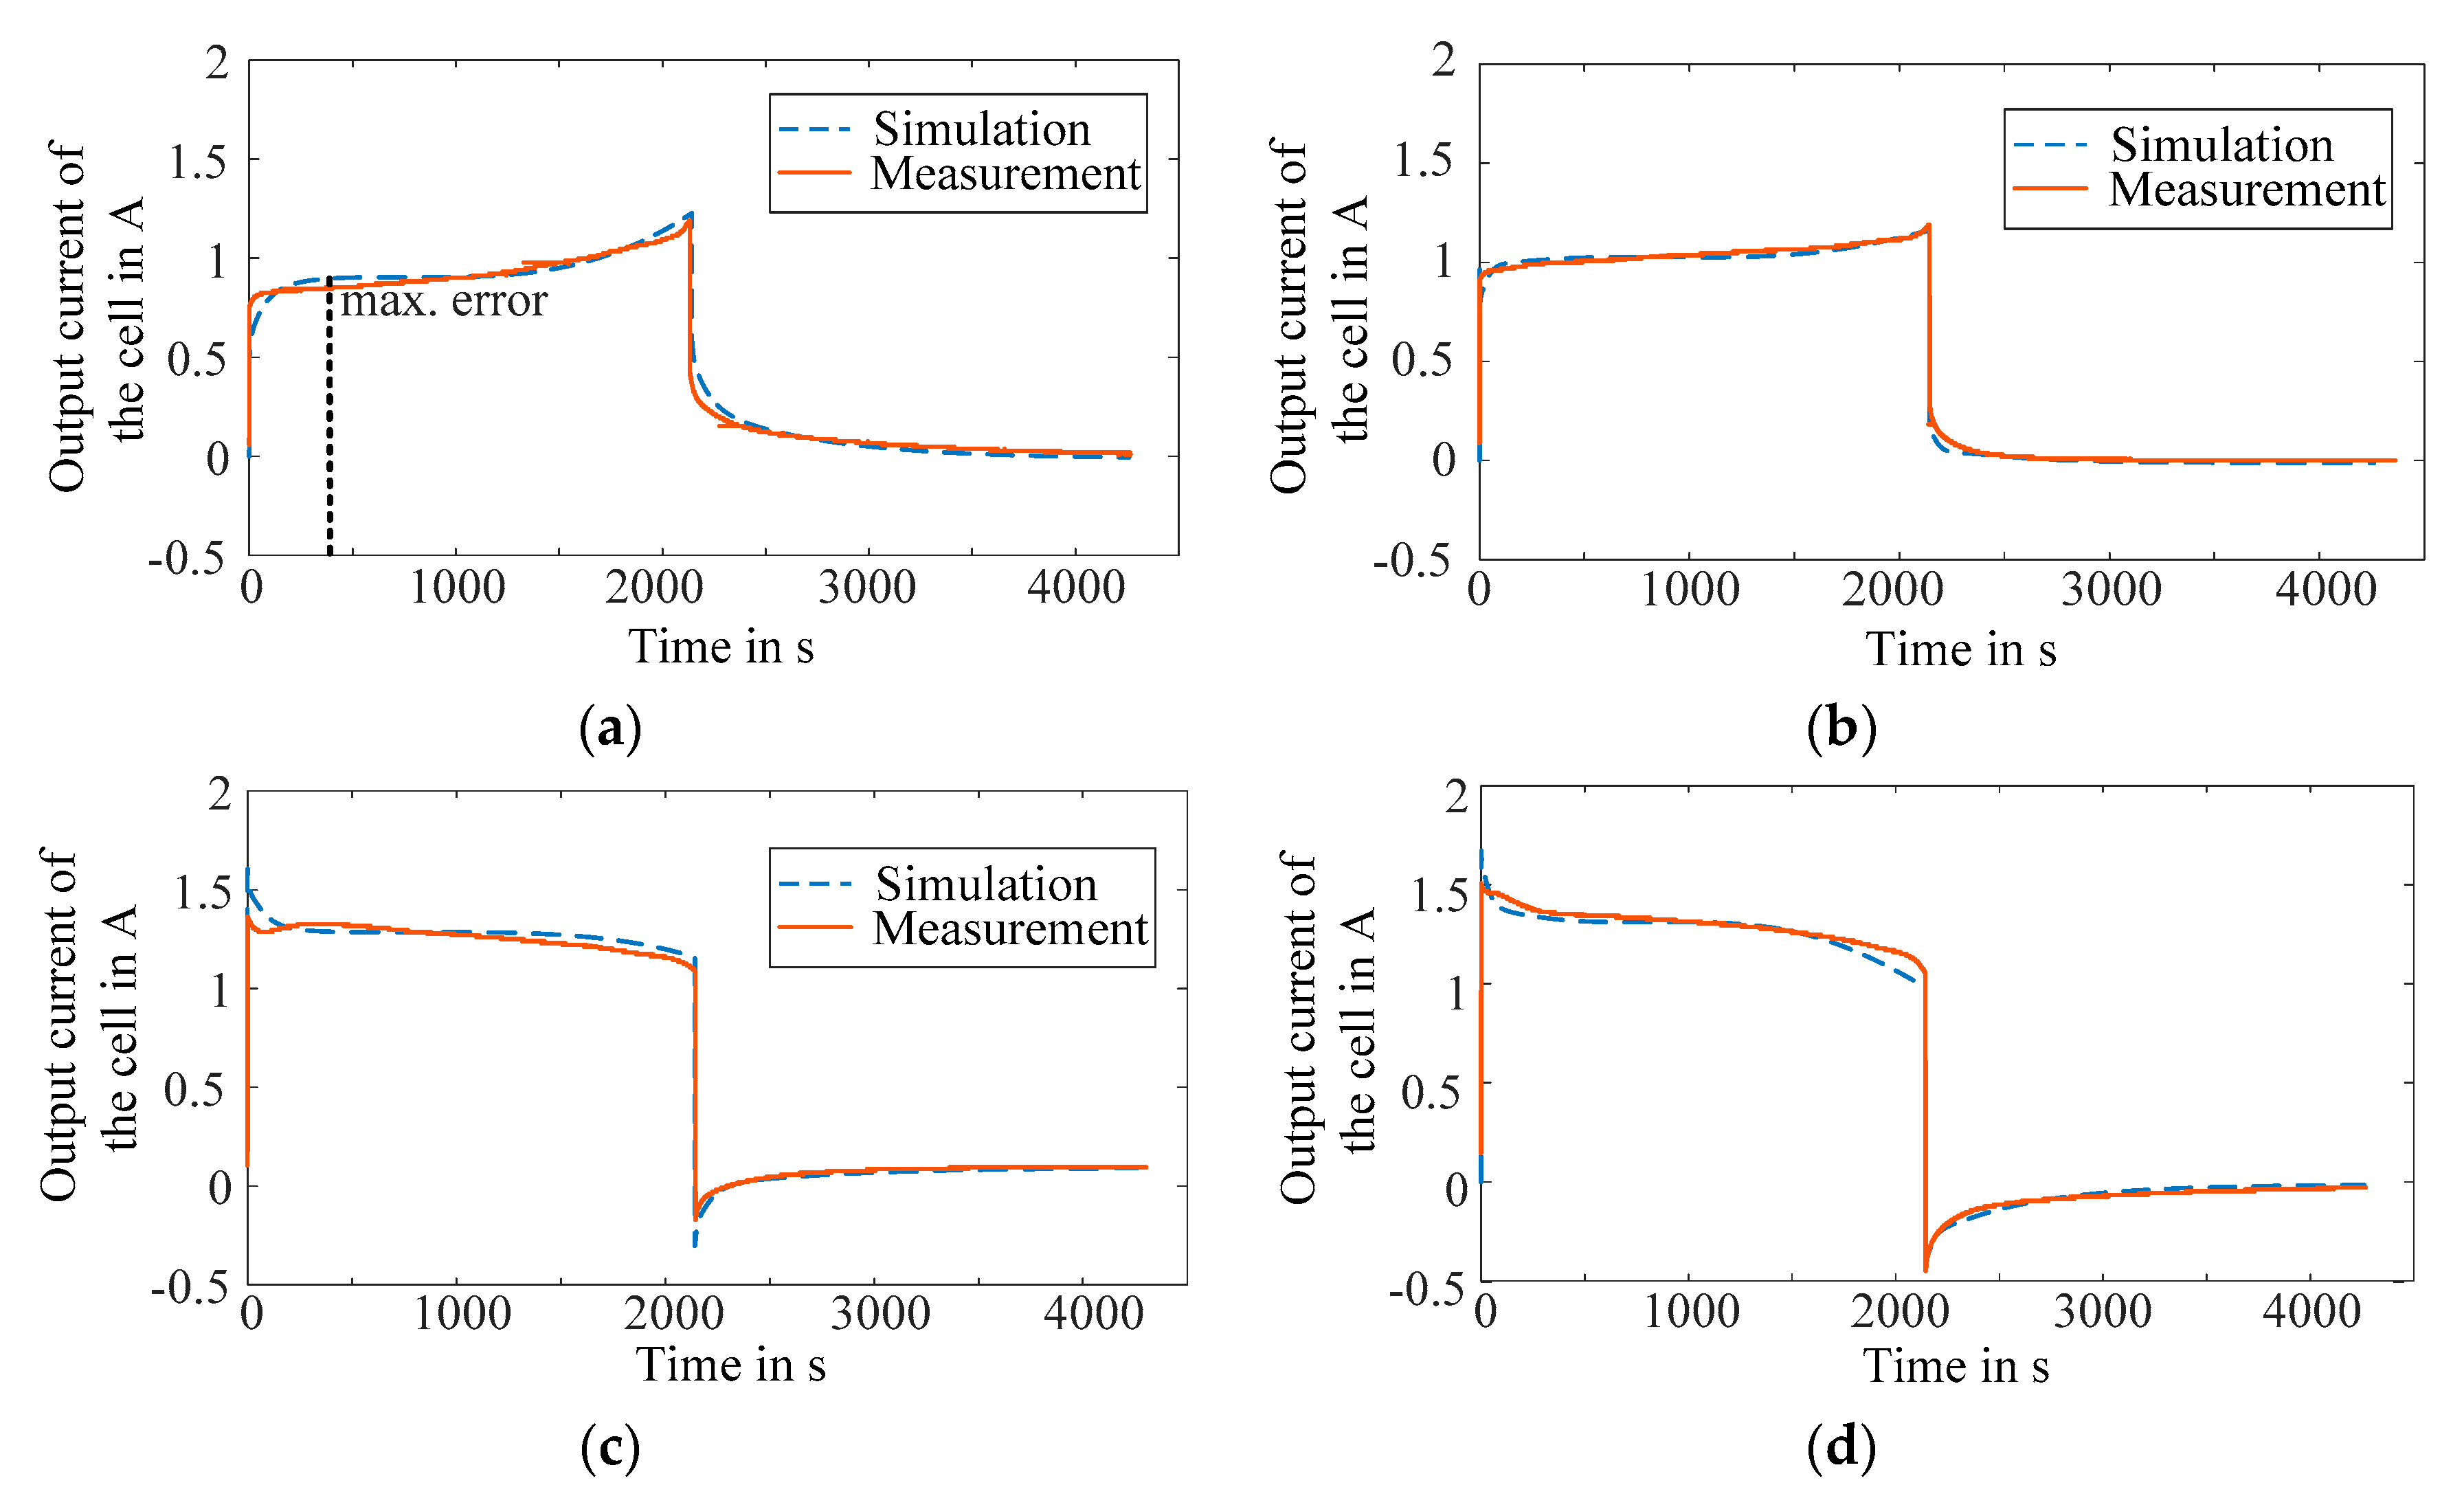
The four paralleled cells are firstly tested by a 1 C constant current load, starting from 80% SOC until 20% SOC. The current is recorded for another 2500 s after the removal of the load. The measured and simulated current waveforms of each cell are compared below in Figure 4. The simulated waveforms follow the measured waveforms accurately. The maximum error of the simulation result is 0.06 A, still within 0.1 A, and it is found in the simulation result of cell 1.
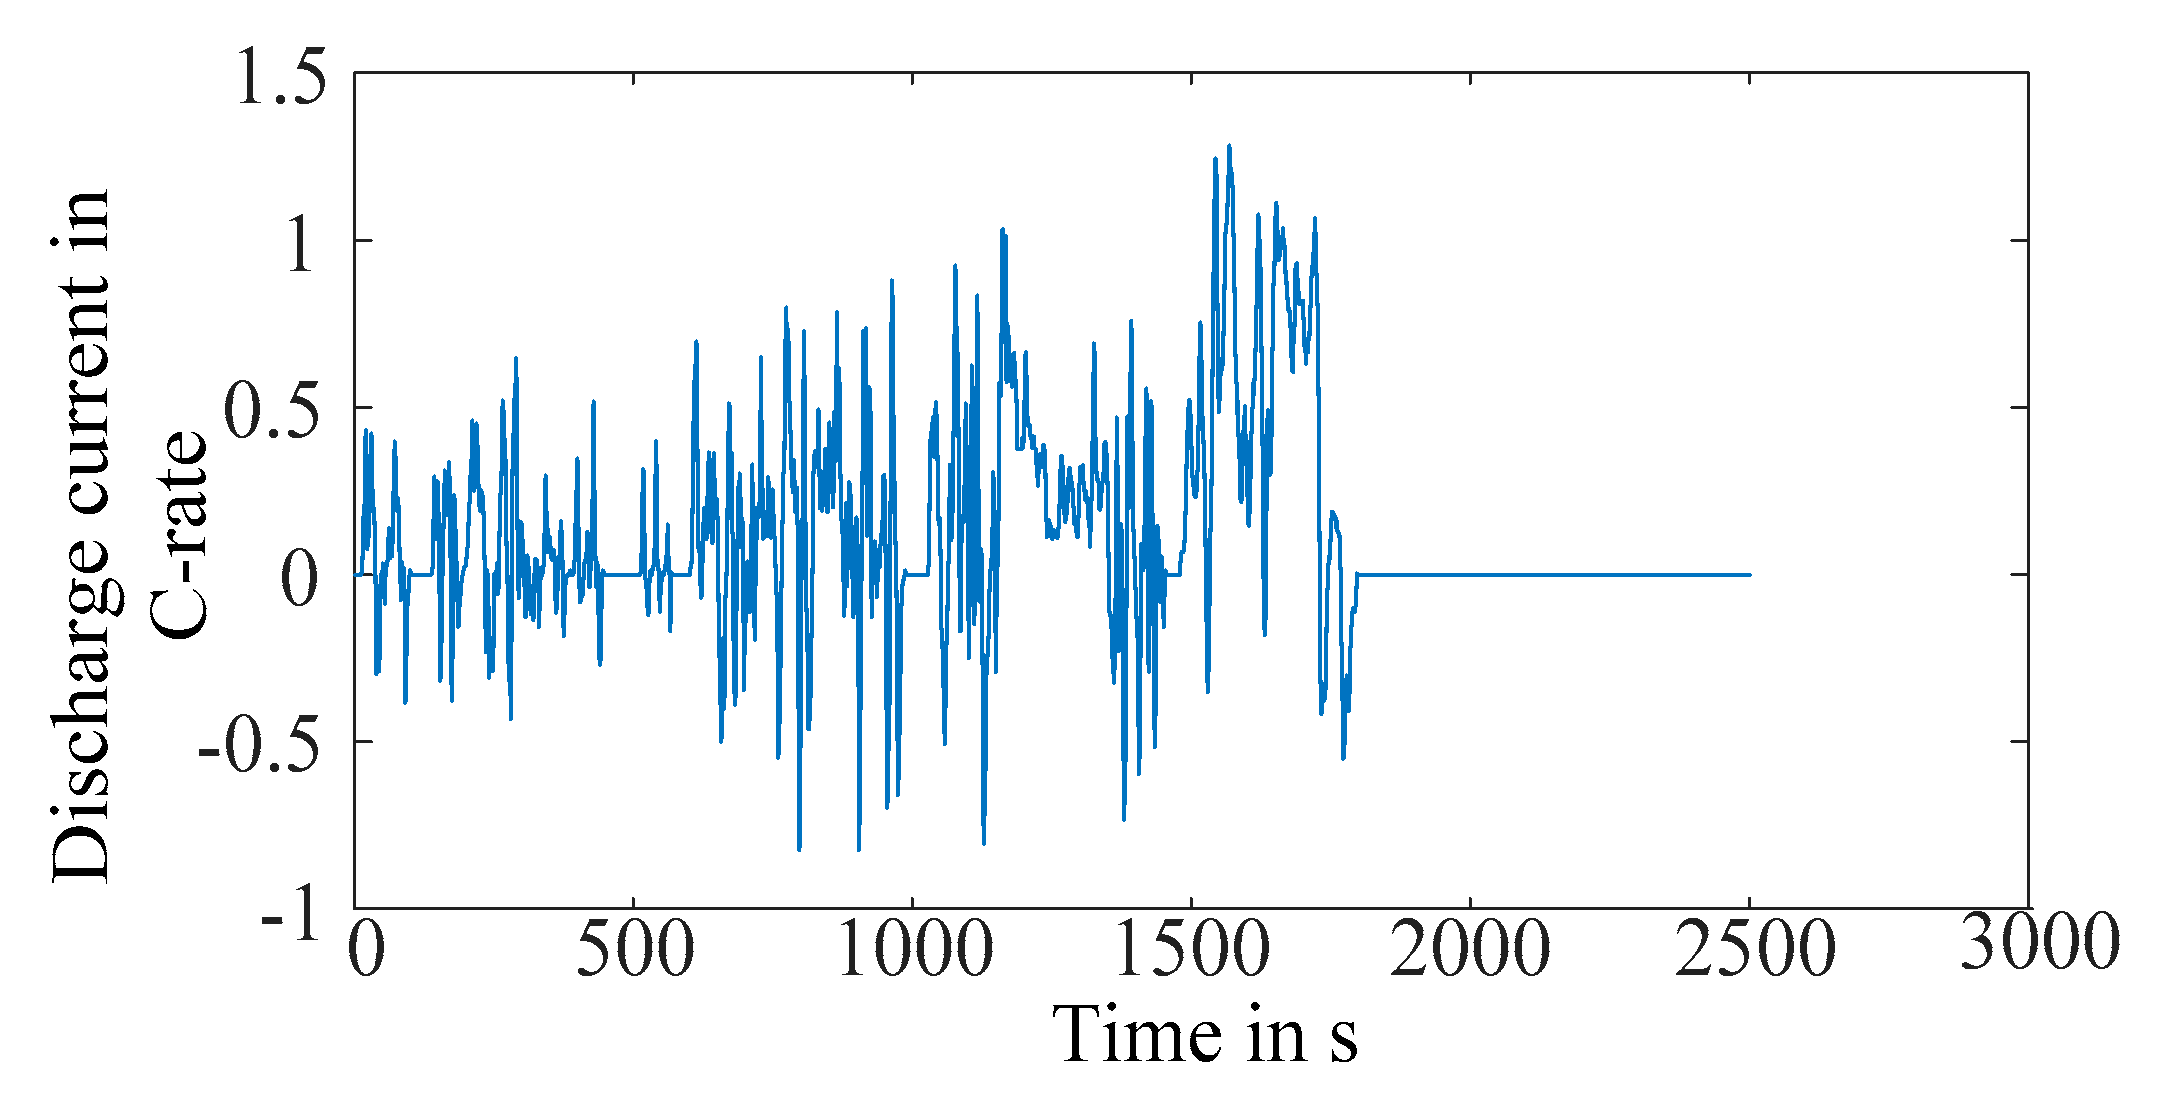
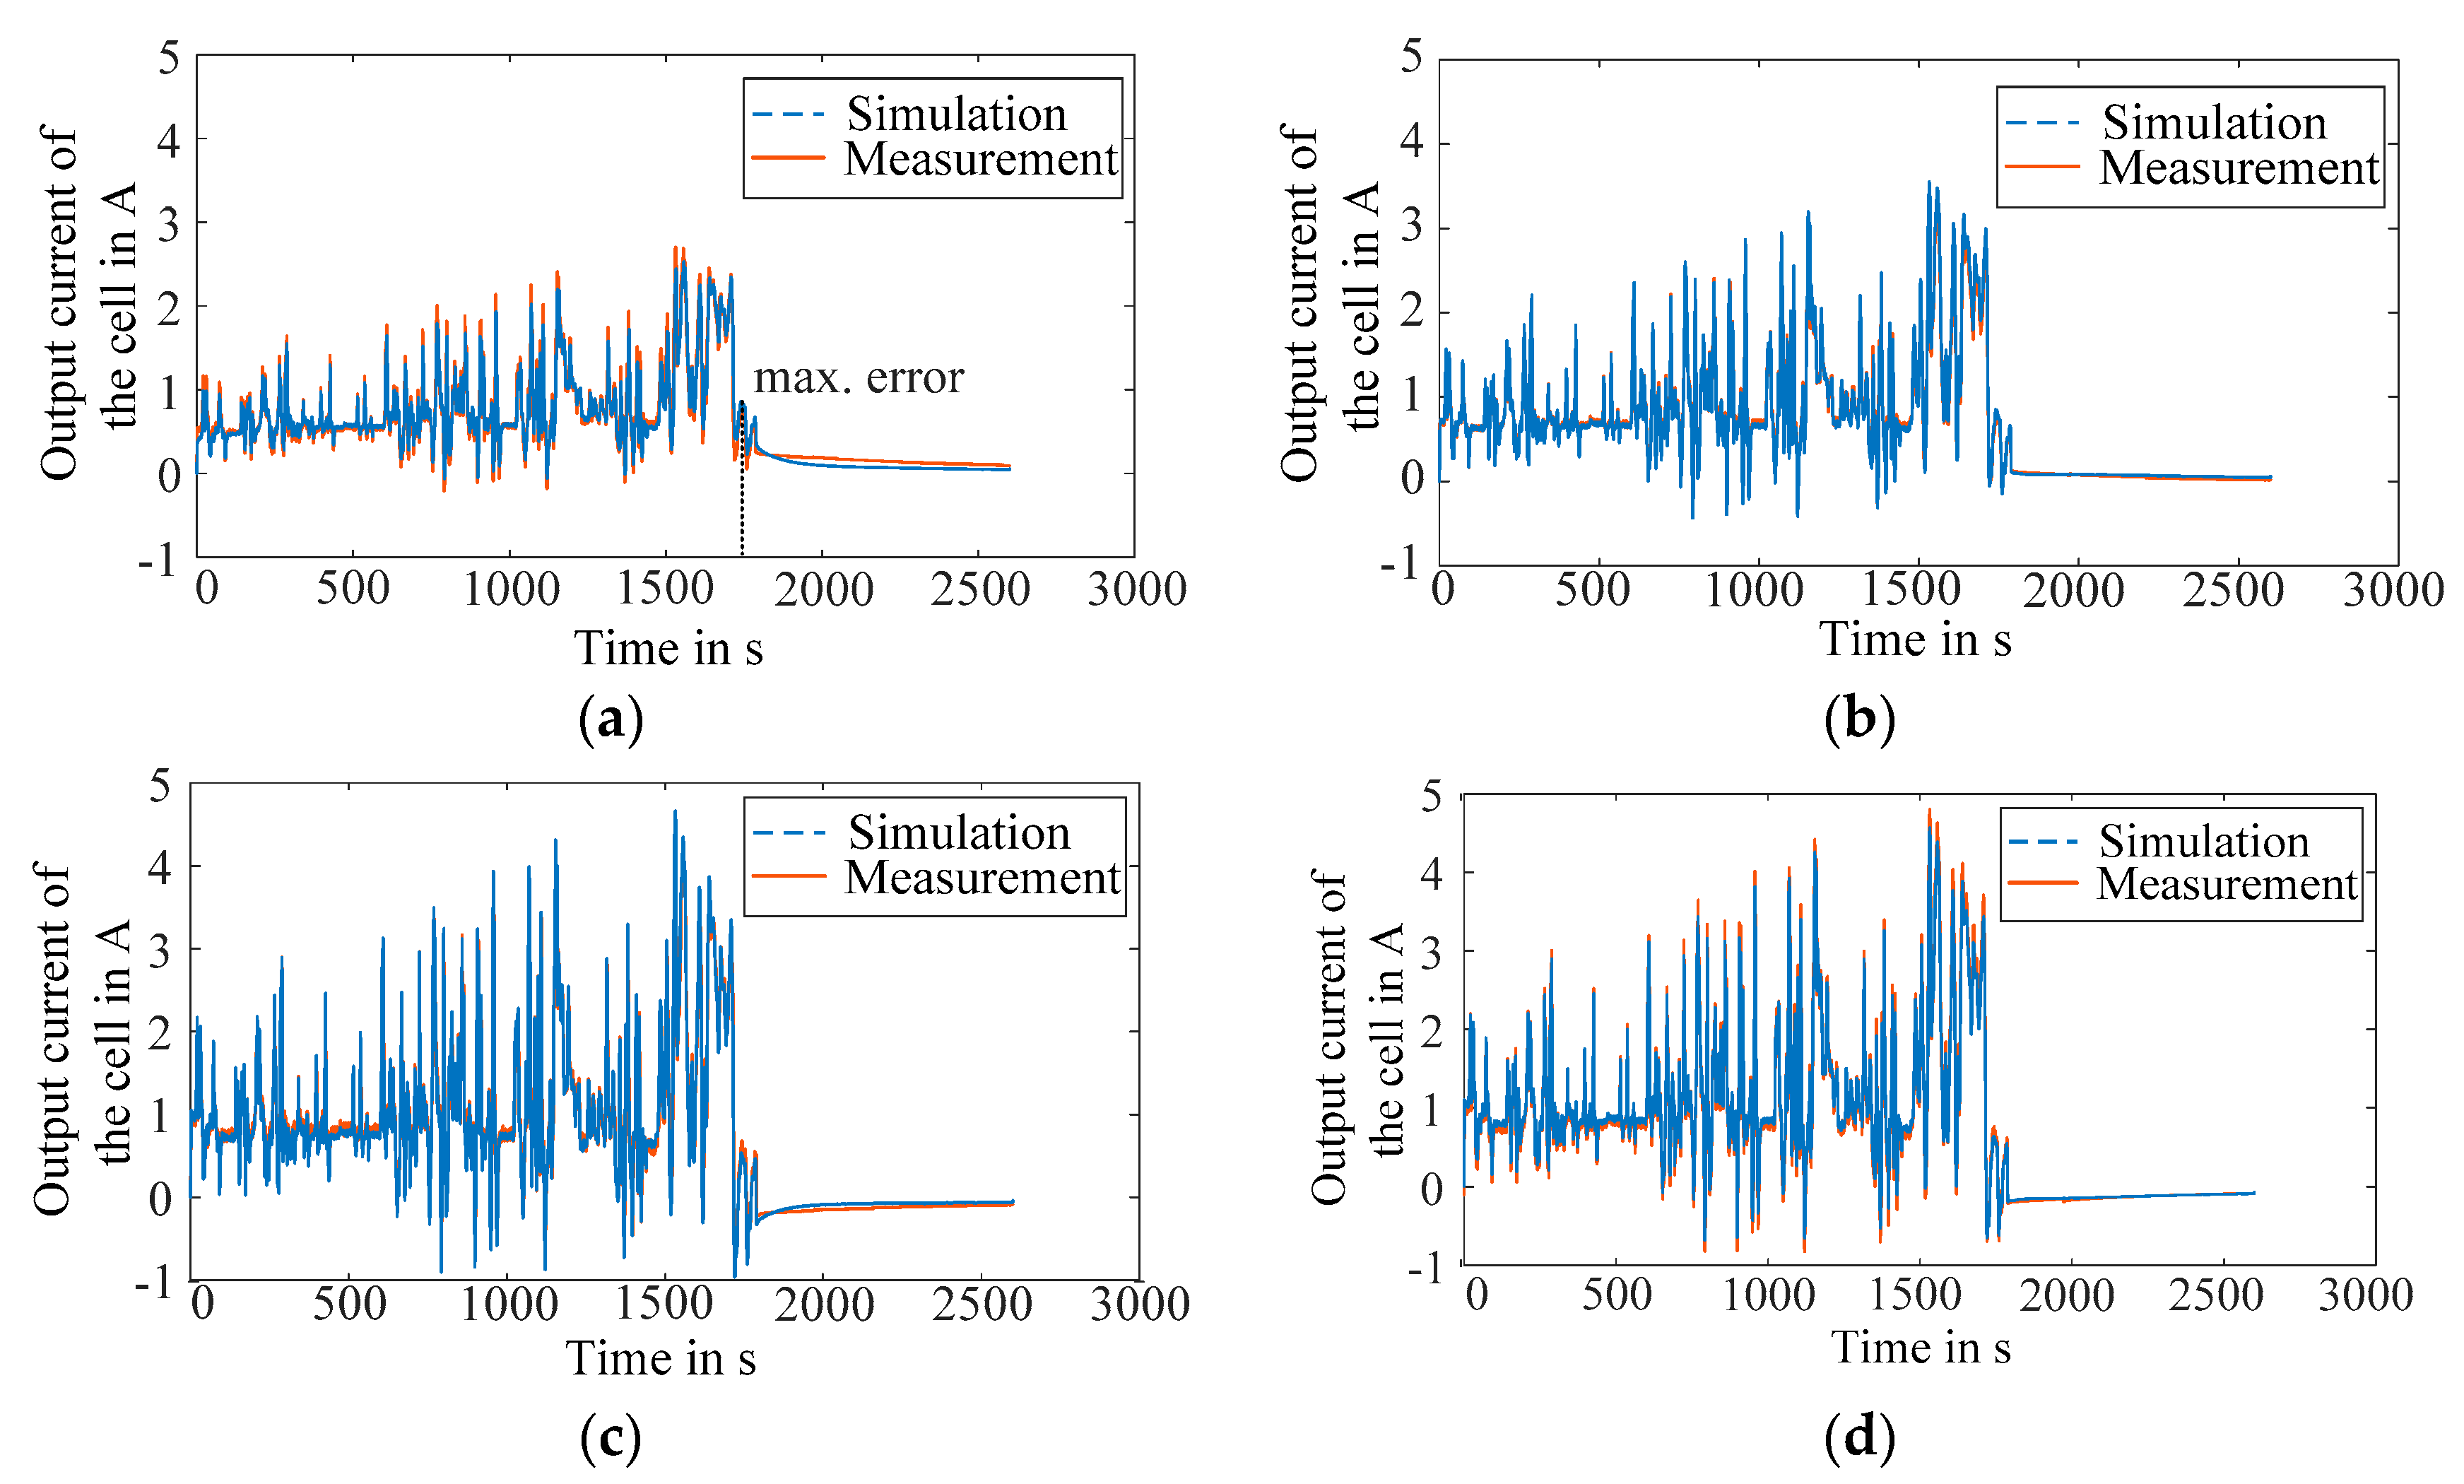
To evaluate the accuracy of the model in the automotive use cases, the four cells are also discharged by the C-rate curve in Figure 5. From 0 to 1800 s, the curve is the output current (in C-rate) of a battery pack in an EV, when the EV is simulated by the WLTP C3 driving cycle. The following 800 s is the relaxation period of the battery pack, during which the self-balancing current between paralleled cells can be observed. Therefore, this load C-rate curve is able to manifest the possible fluctuations of a practical load in an EV. The current waveforms in the simulation and the experiment are compared in Figure 6. The simulation and measured results can match accurately during the whole period of the test. The maximum error, 0.39 A, appears in the simulation result of the cell 1 in the 1716th second, while the error of all the four cells in the remaining time is within 0.1 A.
Therefore, the two tests proved that the proposed model is able to accurately calculate the current distribution within paralleled cells. The further results based on the models can thus also be reliable. The errors observed in the simulation results could be caused by the errors in the parameter identification and also the assumption that parameters are SOC-independent.
4. Evaluation of Battery Packs Based on Monte-Carlo Experiments
In this chapter, the proposed battery pack model is used in Monte-Carlo experiments to evaluate battery packs with different numbers of parallel. For each configuration, hundreds of battery packs are simulated and the conclusion based on these results will thus not be influenced by possible coincidences of a limited number of samples.
This paper only intends to find out the influence of paralleling more NCR18650PF cells instead of trying to find the optimal cell size and the corresponding parallel number for a given battery pack capacity. Therefore, it should be noted that all the cells generated in this paper have the same nominal capacity and that the battery packs with different parallel numbers thus have different capacities.
4.1. Statistic Features of Battery Cells
In order to generate the properties of the battery cells, i.e., the inner resistance (R0j,k), capacity (Qj,k), polarization resistors (R1j,k, R2j,k) and polarization capacitors (C1j,k, C2j,k) in the Monte-Carlo experiments, the statistic features and the distributions of the parameters are analysed based on the measured data of 50 Panasonic NCR18650PF cells.
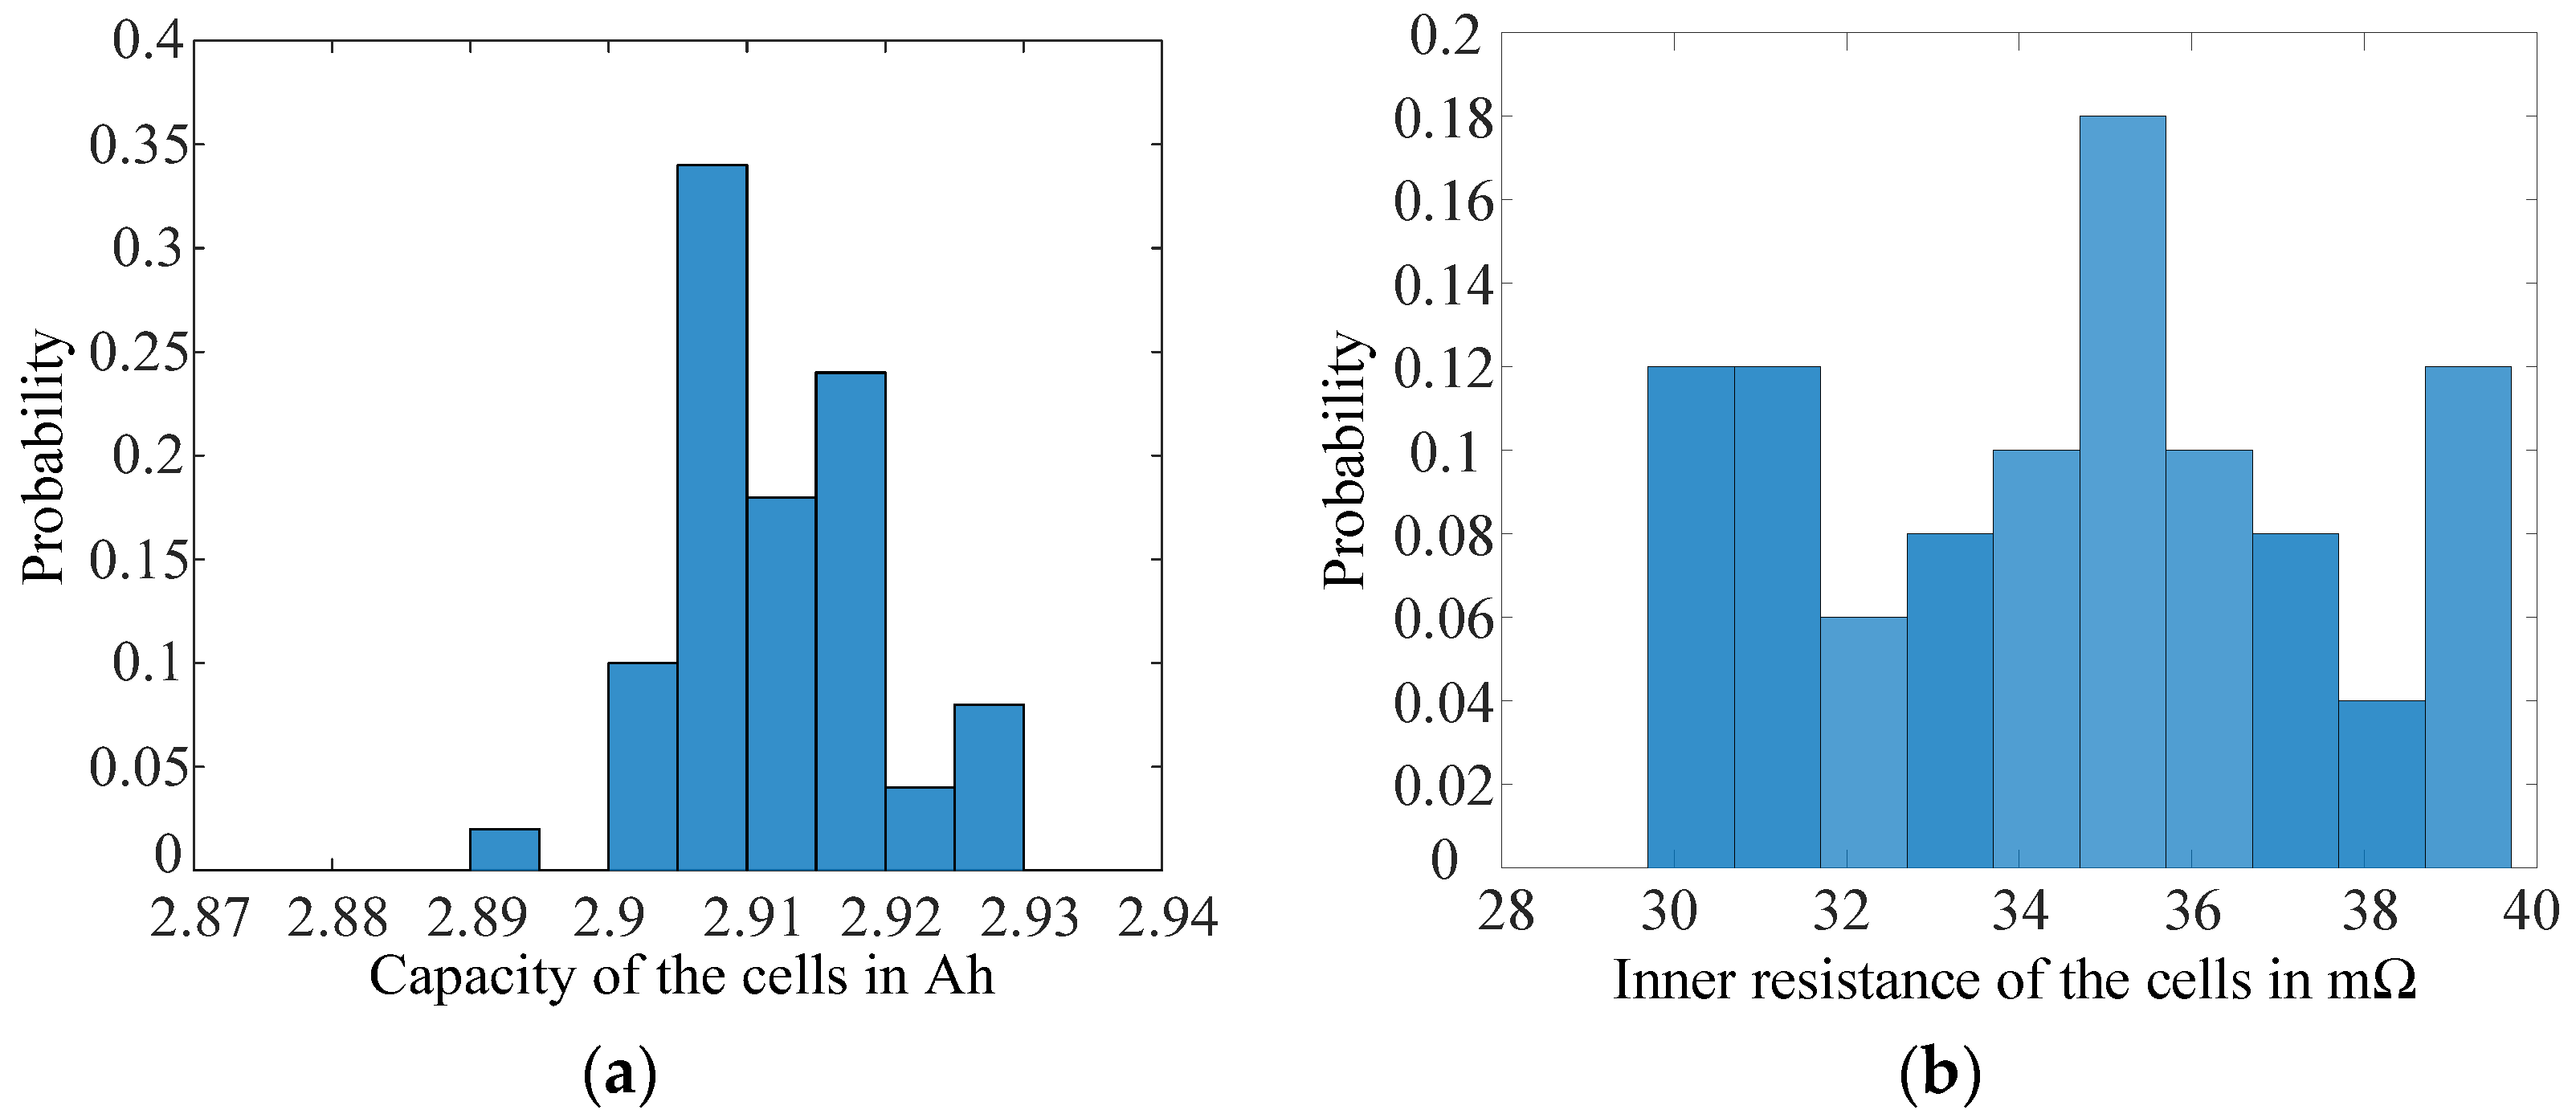
The distribution of the cell capacity is studied first. The frequency histogram of the capacity is in Figure 7a. The Kolmogorov-Smirnov test (KS-test) shows the probability of the null hypothesis that the capacity data complies with a normal distribution is 66%. As this probability cannot directly decide if the null hypothesis should be accepted, the skewness of the data is also calculated. The skewness 0.1941 and the histogram show that the data has a clear skew on the right side. Therefore, this paper proposes to use the skew normal distribution instead of the normal distribution to generate the capacity of cells [1]. The choice can be reasonable, because the cell capacity must not be lower than the nominal value in the datasheet, which could result in a tendency in the production to make the distribution of the cell capacity skew to the right side.
Secondly, the distribution of the inner resistance is discussed. The histogram is in Figure 7b, which resembles the normal distribution better than that of the cell capacity. The skewness of the inner resistance data is 0.11. Therefore, although the probability of the null hypothesis is 51% in the Kolmogorov-Smirnov test, the normal distribution is still adopted for the inner resistance due to the lower skewness and the histogram.
The four polarization parameters in the equivalent circuit, R1j,k, C1j,k, R2j,k and C2j,k, are more difficult to measure, as there is no equipment specially designed for the automatic measurement of those parameters. Therefore, the polarization parameters of only 10 cells are identified manually to obtain their statistic features. As 10 results cannot show an obvious pattern in the histograms, the statistic indices of the four polarization parameters are calculated to identify their distributions. Results are listed in Table 2, in which the p-value of KS-test is the probability that the tested dataset complies with a normal distribution. From the p-values of the KS-test and the skewness values, it is seen that the C2j,k quite possibly follows the normal distribution while R1j,k, R2j,k and C1j,k should be generated by skew normal distributions.
Additionally, the interdependence between the six parameters should also be identified. The correlation between every two parameters is tested with the null hypothesis that the tested two parameters are linearly independent. Similar to a covariance matrix, the p-value (possibilities of the null hypothesis) of each test is listed in the symmetric matrix in Table 3 and located by the column and the row labelled by the two corresponding parameters. The values on the diagonal are not important, because they correspond to the self-dependence and must be 1. As all the p-values are lower than 50%, the null hypotheses cannot be declined. The distributions of the parameters can be considered as linearly independent of each other.
Based on the discussions above and the statistic indices, the properties of the cells in Monte-Carlo experiments could be generated by the distributions in Equation (5). r0j,k and C2j,k comply with normal distributions, represented by N in Equation (5), while the other four properties are generated according to the skew normal distributions, represented by SKEWN in Equation (5).
In Equation (5), μ1, μ2 and σ1, σ2 are respectively the mean values and standard deviations of the two normal distributions. ω1–ω4, α1–α4 and ε1–ε4 are the parameters of the skew normal distributions. In the possibility density function (PDF) of the skew normal distribution, Φ and ϕ are respectively the cumulative distribution function (CDF) and the PDF of a standard normal distribution N(0,1). The values of these parameters are selected to ensure that the distributions have the same mean values, standard deviations and skewness values as those of the measured data. The detailed values and calculation processes are not given in this paper due to the length limit.
4.2. Simulative Evaluations with Monte-Carlo Experiments
Using the distributions in Equation (5), battery packs composed of randomly generated NCR18650PF cells are simulated to evaluate the influences of the parallel number in terms of efficiency and degradation.
Firstly, battery packs with 36p108s, 18p108s, 9p108s, 4p108s, 2p108s and 1p108s configurations are generated. The parameter of every cell in all tested packs is randomly generated according to the distribution derived in Section 4.1. In addition, 500 battery packs of each configuration (3000 packs in total) are generated to form enough samples in the Monte-Carlo experiments. The series connection numbers of all the pack configurations are kept constantly 108 to reach the required nominal voltage 400 V, while the parallel number starts at 36, half of the parallel number of the Tesla Model S battery pack, then declines following an equal ratio progression until 1 to make the difference brought by different parallel numbers more noticeable. The parallel number 9 is followed by 4 instead of 4.5, because the parallel number should be integer.
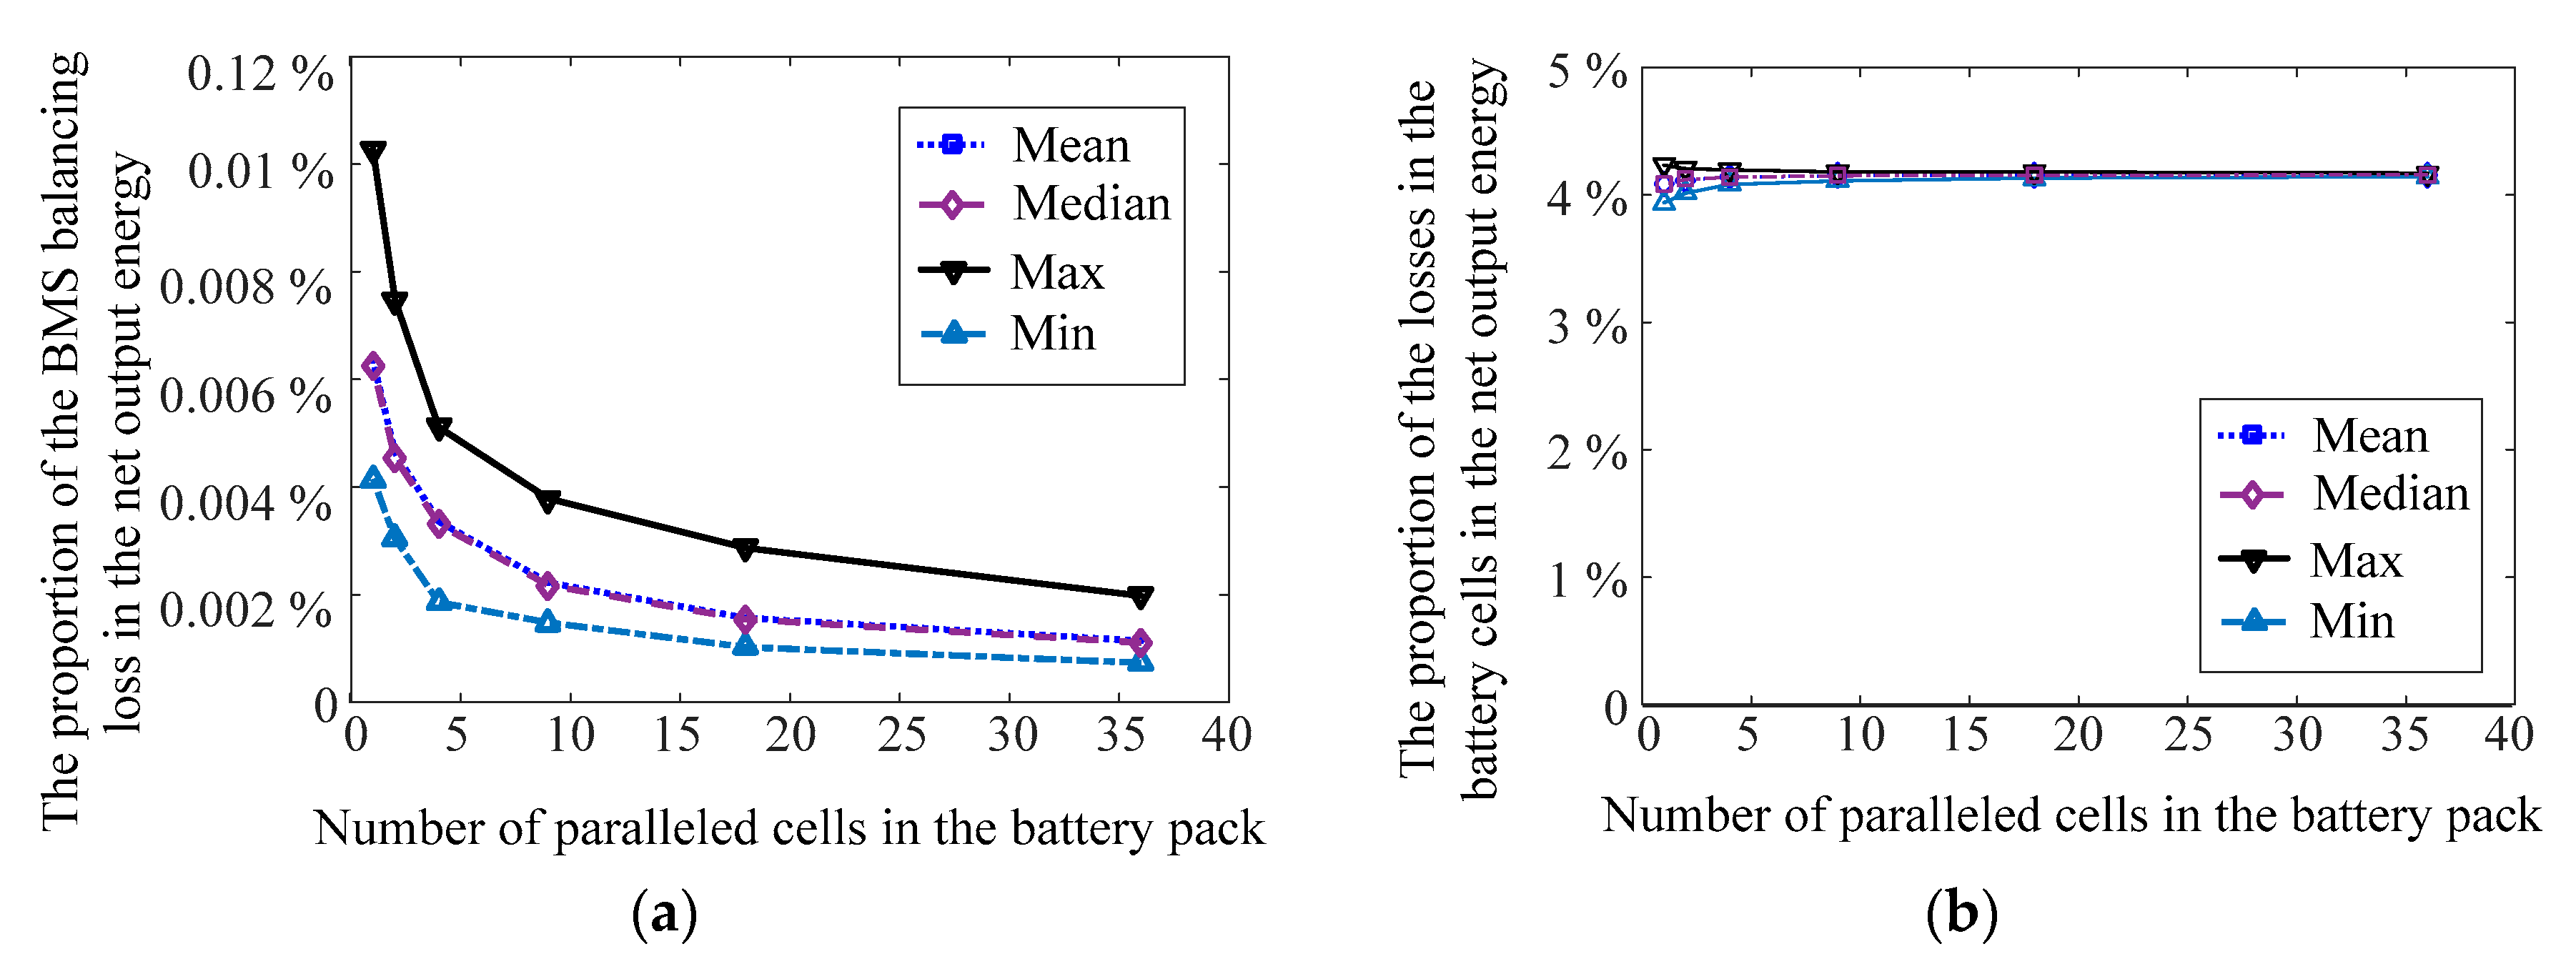
Secondly, to evaluate the efficiency of different configurations, a discharge simulation from 100% to 20% of SOC, repetitive using the C-rate curve in Figure 5 for 10 times, is performed on every battery of the 3000. The total energy dissipated by the BMS balancing and the total energy loss inside the cells of every battery pack are recorded. To obtain the proportions, the two losses count in the total output, they are then divided by the net output energy of the battery packs. In that way, the losses of different battery packs can be compared. The medians, means, minimums and maximums of the proportions of the two losses over the parallel numbers are plotted in Figure 8a,b.
In the results, it is observed that as the parallel number increases, the energy consumed by the balancing of BMS decreases. The reason is that the sum of several independent and identical distributions always has a lower relative standard deviation (standard deviation divided by mean value) compared to the original distribution as deduced in Equation (6). SD means standard deviation while the E is the expectation function. The first sub equation shows that the standard deviation of the sum value counts for a portion of σ/μ in the mean value, while in the second sub equation the deviation of a single variable counts for a portion of σ/μ in the mean value, which is times higher than that of the summed value. In Equation (6) X1, X2 …, XN are not physical variables in the battery model, but just a group of independent normal distributed variables to prove that the deviation of the sum value is much smaller than the deviation of individual variables. Connecting more cells in parallel will lower the capacity difference between different rows of paralleled cells, and thus reduces the proportion of the energy consumed by the balancing of the BMS.
Additionally, an increasing number of paralleled cells is expected to result in a higher loss in the cells, because as the parallel number increases, a cell with the properties significantly different from those of the other cells in parallel is more likely to appear. This cell intensifies the energy exchanges between the cells and thus makes the energy loss inside the cells higher.
The curves of the maximum and minimum values manifest that the distribution of the total in-cell loss tends to converge as the parallel number increases in the Monte-Carlo experiments. Therefore, although the total in-cell loss tends to grow together with the parallel number, this loss is also more unlikely to diverge far from the expectation value.
However, the influence of the parallel number on the efficiency of a battery pack is not significant, as the changes of losses count lower than 0.1% in the net output energy when the parallel number varies. Nonetheless, if the small influences accumulate over a longer time, it is possible that the aging behaviours of the battery packs are different.
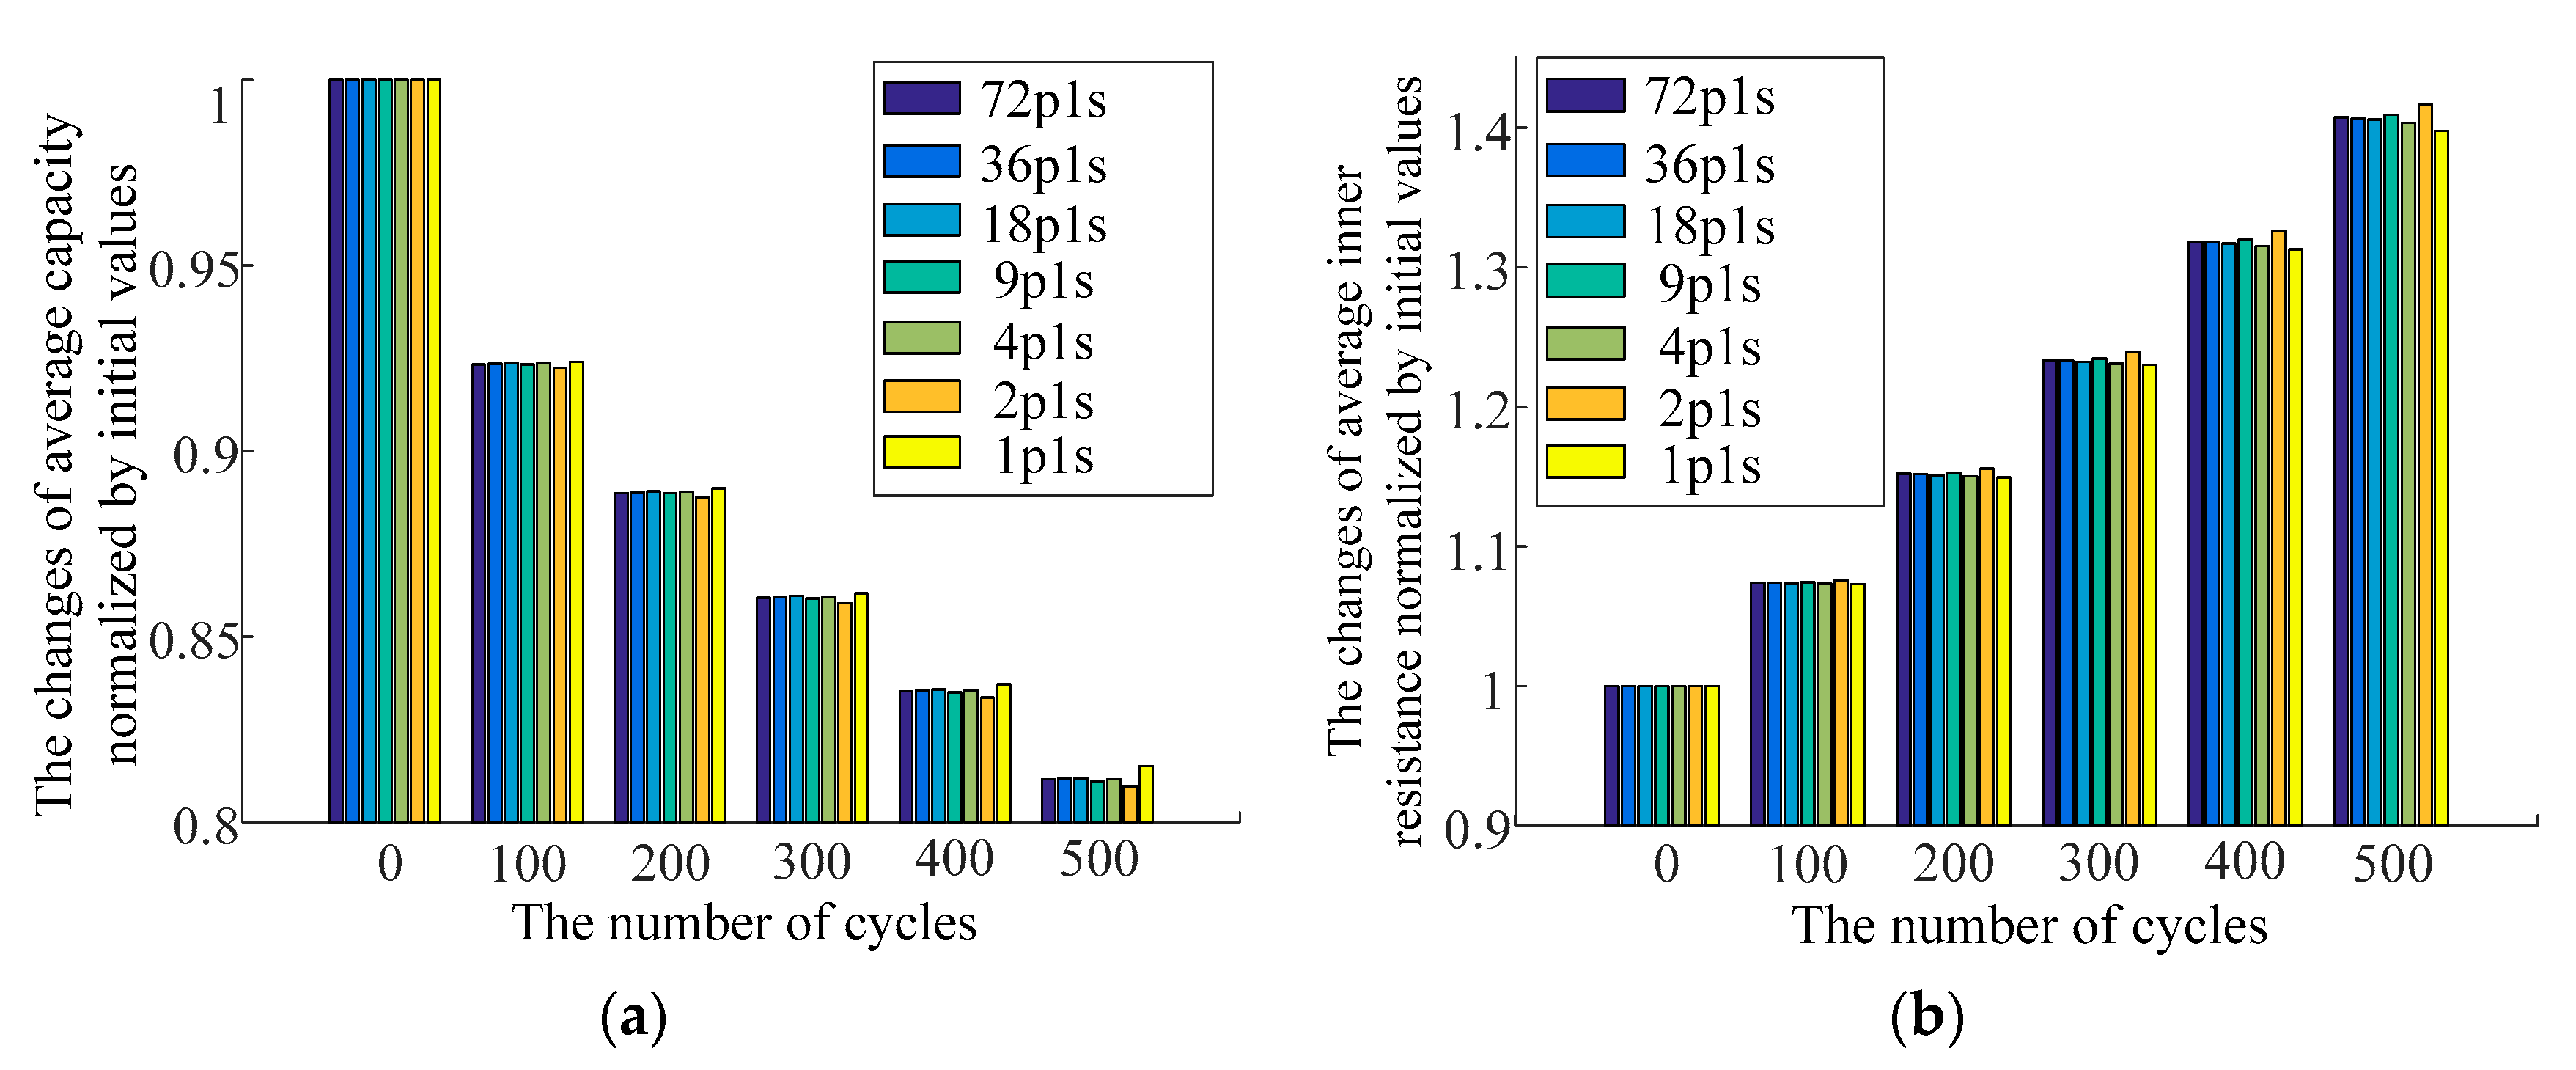
Therefore, as the third step of the Monte Carlo experiment, one battery pack with respectively 72p1s, 36p1s, 18p1s, 9p1s, 4p8s, 2p1s and 1p1s configuration is generated and simulated for 500 discharging cycles (the cycle life of Panasonic NCR18650PF cells) to observe the long term influence of the parallel number. In each cycle of simulation, the load curve in Figure 5 is repeated for 10 times to discharge the battery pack from 100% SOC to 20% SOC. The degradation model in [17] is used. Only one pack of each configuration is simulated, because of the long simulation time of the degradation test. In addition, the series connection number of battery packs is reduced to one, because only the cells in parallel can influence each other in terms of degradation and one parallel row is thus already enough to demonstrate the aging behaviours. The simulation time is also in this way further reduced.
The simulation contains no temperature model and the temperature of the cells is set to be constantly 25 °C. Therefore, this simulation implies the assumption that the battery packs have a good cooling system to maintain the constant temperature. The statistic indices of the capacity and the inner resistance of all cells in each battery pack before and after the aging test are listed in Table 4. The aging curves of the average capacity and the average inner resistance after every 100 cycles are plotted in Figure 9.
It is observed that the influence of the parallel number is more conspicuous in terms of degradation. In Table 4 the highest increase of the mean inner resistance is 41.69% in the 2p1s battery pack while the lowest increase is 39.77% in the 1p1s battery pack (single cell). The difference is around 2%.
Moreover, as the parallel number increases, instead of a monotonic trend, Figure 9a,b shows that the changes of the average inner resistance and the average capacity tend to converge (to respectively around 40.7% and −18.8% in this paper) after 500 cycles of degradation test. The convergence is also supported by the standard deviations: When the parallel number is higher than nine, the post-test standard deviations of the capacity and the inner resistance of cells are significantly lower than those in the 2p1s and 4p1s packs, although the initial deviations of the 2p1s and 4p1s packs can be lower. This means the cell properties do not tend to diverge but to follow a consistent pattern when the parallel number is higher. The battery pack properties will thus also distribute in narrower intervals after the degradation test.
Although only one pack of each configuration is simulated in the aging test, the trend of convergence can still be confirmed by the degradation of the battery pack properties and the cell properties. Therefore, it can be concluded that the degradation behaviour of battery packs with a higher parallel number is more consistent or, in other words, more predictable.
A possible explanation is that the energy exchange caused by the few particularly weak or strong cells is shared by more cells when the parallel number increases. The influence of these few cells on the aging of the battery pack degradation is thus limited.
Another noteworthy phenomenon is that the degradation of the 1p1s battery pack (single cell) is slower than that of the other battery packs as seen in Figure 9. To verify if this is a coincidence of a single sample, another 15 single cells, i.e., 1p1s battery packs, are simulated. The maximum inner resistance growth and capacity reduction are respectively 40.31% and −19.76%, which are still lower than the corresponding changes of the other battery packs tested in this paper. Therefore, this phenomenon can be confirmed as a general situation. An explanation is that a single cell is not involved in any extra charging or discharging processes and thus has a lower cycle aging.
Based on the results collected in Monte-Carlo experiments, it can be concluded that the parallel number is able to influence the efficiency and the degradation of a battery pack. If the parallel number increases, the BMS balancing loss tends to decrease while the energy loss inside the cells tends to rise. However, when evaluating battery packs composed of homogeneous cells as in this paper, the influence on the efficiency is only marginal. The influence on the degradation is in comparison more conspicuous. If more cells are paralleled in a battery pack, the degradation behaviours of the battery pack tend to be more predictable.
4.3. Discussion
As proved by the Monte-Carlo experiments, the parallel number cannot significantly influence the efficiency of a battery pack. The reason is that the significance is limited by the highly consistent cell properties, as all the distributions of the properties are obtained from the measurement results of high quality cells. If cells with higher variance are used to design a battery pack, the influence on efficiency should be considered.
Secondly, although the degradation simulation shows that the single cell has a slower aging process than that of the paralleled cells, it does not mean reducing the parallel number to one is an optimal choice. On the one hand there are more factors, e.g., the cost and reliability, that need to be considered. On the other hand, the degradation simulation largely depends on the degradation model and the temperature model. The conclusion could be changed if different models are selected to adapt to different scenarios of application.
Nonetheless, although the simulation in this paper does not have a temperature model and the universality of the conclusions could thus be limited, the proposed approach can still be used to further evaluate the configuration of battery packs in other scenarios by implementing more detailed or more specific models, because of the compatibility of the battery pack model.
5. Conclusions
The paper proposes a model for the simulation of battery packs, the accuracy of which is verified by experimental results. Using the proposed model and the statistic features of the battery cell properties, different battery packs are simulated in Monte-Carlo experiments to evaluate the potential influence of paralleling different numbers of the cells of the same type in a battery pack. When the parallel number changes, the influence on the degradation and the efficiency of the battery packs can be observed. The influence is not significant in terms of efficiency because the cell properties have a high homogeneity. The influence on the degradation is in comparison more conspicuous. A higher parallel number will make the degradation behaviours of the battery packs more predictable.
The major contribution of this paper is the proposal of the battery pack model and the statistic approach to evaluate battery packs. In a practical design, if the statistical features of different battery cells are known, the proposed model and the approach can also be used to select the cells and correspondingly the configuration of the battery pack to achieve the best performance in terms of efficiency and degradation.
Author Contributions
F.C. is the major author of the paper. He proposed the battery pack model and the approach to evaluate battery packs randomly generated cells in Monte-Carlo experiments. F.R. designed the experimental platforms and conducted the verification experiments. M.B. provided the capacity and inner resistance of the Panasonic NCR18650PF cells. M.L. made an essential contribution to the conception of the research project. He revised the paper critically for important intellectual content. M.L. gave final approval of the version to be published and agrees to all aspects of the work. As a guarantor, he accepts responsibility for the overall integrity of the paper.
Acknowledgments
This work was financially supported by the Singapore National Research Foundation under its Campus for Research Excellence and Technological Enterprise (CREATE) programme.
Conflicts of Interest
The authors declare no conflicts of interest
References
- Brand, M.J.; Hofmann, M.H.; Steinhardt, M.; Schuster, S.F.; Jossen, A. Current distribution within parallel-connected battery cells. J. Power Sources 2016, 334, 202–212. [Google Scholar] [CrossRef]
- Cui, X.; Shen, W.; Zhang, Y.; Hu, C.; Zheng, J. Novel active LiFePO4 battery balancing method based on chargeable and dischargeable capacity. Comput. Chem. Eng. 2017, 97, 27–35. [Google Scholar] [CrossRef]
- Zhang, J.; Ci, S.; Sharif, H.; Alahmad, M. Modeling discharge behavior of multicell battery. IEEE Trans. Energy Convers. 2010, 25, 1133–1141. [Google Scholar] [CrossRef]
- Miyatake, S.; Susuki, Y.; Hikihara, T.; Itoh, S.; Tanaka, K. Discharge characteristics of multicell lithium-ion battery with nonuniform cells. J. Power Sources 2013, 241, 736–743. [Google Scholar] [CrossRef] [Green Version]
- Gong, X.; Xiong, R.; Mi, C.C. Study of the Characteristics of Battery Packs in Electric Vehicles with Parallel-Connected Lithium-Ion Battery Cells. In Proceedings of the 2014 Twenty-Ninth Annual IEEE Applied Power Electronics Conference and Exposition (APEC), Fort Worth, TX, USA, 16–20 March 2014; pp. 3218–3224. [Google Scholar]
- Gogoana, R.; Pinson, M.B.; Bazant, M.Z.; Sarma, S.E. Internal resistance matching for parallel-connected lithium-ion cells and impacts on battery pack cycle life. J. Power Sources 2014, 252, 8–13. [Google Scholar] [CrossRef]
- Bouchhima, N.; Schnierle, M.; Schulte, S.; Birke, K.P. Erratum: Corrigendum to ‘Active model-based balancing strategy for self-reconfigurable batteries’. J. Power Sources 2016, 326. [Google Scholar] [CrossRef]
- Campestrini, C.; Keil, P.; Schuster, S.F.; Jossen, A. Ageing of lithium-ion battery modules with dissipative balancing compared with single-cell ageing. J. Energy Storage 2016, 6, 142–152. [Google Scholar] [CrossRef]
- Shi, W.; Hu, X.; Jin, C.; Jiang, J.; Zhang, Y.; Yip, T. Effects of imbalanced currents on large-format LiFePO4/graphite batteries systems connected in parallel. J. Power Sources 2016, 313, 198–204. [Google Scholar] [CrossRef]
- Wei, J.; Dong, G.; Chen, Z. On-board adaptive model for state of charge estimation of lithium-ion batteries based on Kalman filter with proportional integral-based error adjustment. J. Power Sources 2017, 365, 308–319. [Google Scholar] [CrossRef]
- Hua, Y.; Cordoba-Arenas, A.; Warner, N.; Rizzoni, G. A multi time-scale state-of-charge and state-of-health estimation framework using nonlinear predictive filter for lithium-ion battery pack with passive balance control. J. Power Sources 2015, 280, 293–312. [Google Scholar] [CrossRef]
- Sun, F.; Xiong, R. A novel dual-scale cell state-of-charge estimation approach for series-connected battery pack used in electric vehicles. J. Power Sources 2015, 274, 582–594. [Google Scholar] [CrossRef]
- Zheng, Y.; Ouyang, M.; Lu, L.; Li, J.; Han, X.; Xu, L.; Ma, H.; Dollmeyer, T.A.; Freyermuth, V. Cell state-of-charge inconsistency estimation for LiFePO4battery pack in hybrid electric vehicles using mean-difference model. Appl. Energy 2013, 111, 571–580. [Google Scholar] [CrossRef]
- Plett, G.L. High-performance battery-pack power estimation using a dynamic cell model. IEEE Trans. Veh. Technol. 2004, 53, 1586–1593. [Google Scholar] [CrossRef]
- Zhong, L.; Zhang, C.; He, Y.; Chen, Z. A method for the estimation of the battery pack state of charge based on in-pack cells uniformity analysis. Appl. Energy 2014, 113, 558–564. [Google Scholar] [CrossRef]
- Intel. Intel Math Kernel Library. Reference Manual; Intel: Santa Clara, CA, USA, 2003. [Google Scholar]
- Schmalstieg, J.; Käbitz, S.; Ecker, M.; Sauer, D.U. A holistic aging model for Li(NiMnCo)O2 based 18650 lithium-ion batteries. J. Power Sources 2014, 257, 325–334. [Google Scholar] [CrossRef]
Figure 1.
Equivalent circuit of a battery cell in the parallel row j and the column k.
Figure 2.
Cell numbering inside a battery pack.
Figure 3.
Experimental Platform to test paralleled battery cells.
Figure 4.
The simulated and measured current waveforms of four paralleled cells when discharged by the 1 C constant current load. (a) Output current waveforms of cell 1; (b) Output current waveforms of cell 2; (c) Output current waveforms of cell 3; (d) Output current waveforms of cell 4.
Figure 4.
The simulated and measured current waveforms of four paralleled cells when discharged by the 1 C constant current load. (a) Output current waveforms of cell 1; (b) Output current waveforms of cell 2; (c) Output current waveforms of cell 3; (d) Output current waveforms of cell 4.
Figure 5.
C-rate curve of the load current obtained in a simulation with the WLTP C3 driving cycle.
Figure 6.
The simulated and measured current waveforms of four paralleled cells when discharged by the fluctuating driving cycle load. (a) Output current waveforms of cell 1; (b) Output current waveforms of cell 2; (c) Output current waveforms of cell 3; (d) Output current waveforms of cell 4.
Figure 6.
The simulated and measured current waveforms of four paralleled cells when discharged by the fluctuating driving cycle load. (a) Output current waveforms of cell 1; (b) Output current waveforms of cell 2; (c) Output current waveforms of cell 3; (d) Output current waveforms of cell 4.
Figure 7.
The frequency histograms of the capacity and the inner resistance of the 50 cells (a) Frequency histogram of the capacity; (b) Frequency histogram of the DC inner resistance.
Figure 7.
The frequency histograms of the capacity and the inner resistance of the 50 cells (a) Frequency histogram of the capacity; (b) Frequency histogram of the DC inner resistance.
Figure 8.
The influence of the parallel number on the losses of battery packs; (a) The influence on the Battery Management System (BMS) balancing loss; (b) The influence on the total in-cell energy loss.
Figure 8.
The influence of the parallel number on the losses of battery packs; (a) The influence on the Battery Management System (BMS) balancing loss; (b) The influence on the total in-cell energy loss.

Figure 9.
The aging process of the average capacity and the average inner resistance of each battery pack; (a) Aging process of the average capacity; (b) Aging process of the average inner resistance.
Figure 9.
The aging process of the average capacity and the average inner resistance of each battery pack; (a) Aging process of the average capacity; (b) Aging process of the average inner resistance.

Table 1.
Parameters of the four cells in the experiment.
| Cell No. | Rline | R0j,k | R1j,k | C1j,k | R2j,k | C2j,k |
|---|---|---|---|---|---|---|
| Cell1 | 81.3 mΩ | 37 mΩ | 8.6 mΩ | 204 F | 54.7 mΩ | 791 F |
| Cell2 | 41.9 mΩ | 36 mΩ | 17.7 mΩ | 446 F | 64.3 mΩ | 1252 F |
| Cell3 | 15.8 mΩ | 36 mΩ | 14.1 mΩ | 436 F | 72.3 mΩ | 1170 F |
| Cell4 | 22.6 mΩ | 32 mΩ | 9.3 mΩ | 322 F | 61.2 mΩ | 1033 F |
Table 2.
Statistic indices of polarization indices.
| Indices | R1j,k | C1j,k | R2j,k | C2j,k |
|---|---|---|---|---|
| Mean | 0.0122 Ω | 326.6 F | 0.06 Ω | 1020.4 F |
| Standard Deviation | 0.003 Ω | 83.9 F | 0.012 Ω | 145.5 F |
| Skewness | 1.0831 | 0.372 | −0.9416 | 0.034 |
| p-Value of KS-test | 0.441 | 0.628 | 0.539 | 0.902 |
Table 3.
The matrix of p-Values obtained from correlation tests of the six parameters.
| p-Values of Correlation Tests | Qj,k | R0j,k | R1j,k | C1j,k | R2j,k | C2j,k |
|---|---|---|---|---|---|---|
| Qj,k | 1.00 | 0.04 | 0.21 | 0.22 | 0.33 | 0.10 |
| R0j,k | 0.04 | 1.00 | 0.08 | 0.18 | 0.40 | 0.35 |
| R1j,k | 0.21 | 0.08 | 1.00 | 0.00 | 0.18 | 0.00 |
| C1j,k | 0.22 | 0.18 | 0.00 | 1.00 | 0.23 | 0.00 |
| R2j,k | 0.33 | 0.40 | 0.18 | 0.23 | 1.00 | 0.31 |
| C2j,k | 0.10 | 0.35 | 0.00 | 0.00 | 0.31 | 1.00 |
Table 4.
The capacity and the inner resistance of cells in each battery pack before and after the degradation test.
Table 4.
The capacity and the inner resistance of cells in each battery pack before and after the degradation test.
| Configuration of Battery Packs | 1p1s | 2p1s | 4p1s | 9p1s | 18p1s | 36p1s | 72p1s | |
|---|---|---|---|---|---|---|---|---|
| New | E(Qj,k) | 2.910 Ah | 2.915 Ah | 2.910 Ah | 2.918 Ah | 2.913 Ah | 2.913 Ah | 2.914 Ah |
| SD(Qj,k) | - | 0.0133 | 0.0058 | 0.0062 | 0.0073 | 0.0076 | 0.0082 | |
| E(r0j,k) | 38.16 mΩ | 34.51 mΩ | 34.91 mΩ | 36.42 mΩ | 35.64 mΩ | 33.94 mΩ | 34.26 mΩ | |
| SD(r0j,k) | - | 0.0033 | 0.00451 | 0.00263 | 0.00242 | 0.00269 | 0.00284 | |
| After 500 cycles test | E(Qj,k) | 2.372 Ah | 2.361 Ah | 2.362 Ah | 2.367 Ah | 2.365 Ah | 2.365 Ah | 2.365 Ah |
| E(Qj,k) change | −18.48% | −19.02% | −18.84% | −18.89% | −18.81% | −18.82% | −18.84% | |
| SD(Qj,k) | - | 0.0255 | 0.0301 | 0.0177 | 0.0113 | 0.0160 | 0.0185 | |
| E(r0j,k) | 53.33 mΩ | 48.90 mΩ | 49.00 mΩ | 51.33 mΩ | 50.10 mΩ | 47.75 mΩ | 48.22 mΩ | |
| E(r0j,k) change | 39.77% | 41.69% | 40.36% | 40.93% | 40.58% | 40.70% | 40.75% | |
| SD(r0j,k) | - | 0.00512 | 0.00513 | 0.00357 | 0.00308 | 0.00343 | 0.00352 | |
© 2018 by the authors. Licensee MDPI, Basel, Switzerland. This article is an open access article distributed under the terms and conditions of the Creative Commons Attribution (CC BY) license (http://creativecommons.org/licenses/by/4.0/).
Share and Cite
MDPI and ACS Style
Chang, F.; Roemer, F.; Baumann, M.; Lienkamp, M. Modelling and Evaluation of Battery Packs with Different Numbers of Paralleled Cells. World Electr. Veh. J. 2018, 9, 8. https://doi.org/10.3390/wevj9010008
AMA Style
Chang F, Roemer F, Baumann M, Lienkamp M. Modelling and Evaluation of Battery Packs with Different Numbers of Paralleled Cells. World Electric Vehicle Journal. 2018; 9(1):8. https://doi.org/10.3390/wevj9010008
Chicago/Turabian StyleChang, Fengqi, Felix Roemer, Michael Baumann, and Markus Lienkamp. 2018. "Modelling and Evaluation of Battery Packs with Different Numbers of Paralleled Cells" World Electric Vehicle Journal 9, no. 1: 8. https://doi.org/10.3390/wevj9010008