
Systemic Evaluation of PV Self-Consumption Optimization Using Electric Vehicles

1
FfE, 80995 Munich, Germany
2
School of Engineering and Design, Technical University of Munich (TUM), 80333 Munich, Germany
*
Author to whom correspondence should be addressed.
World Electr. Veh. J. 2024, 15(3), 98; https://doi.org/10.3390/wevj15030098
Submission received: 13 February 2024
/
Revised: 23 February 2024
/
Accepted: 28 February 2024
/
Published: 5 March 2024
(This article belongs to the Special Issue Power and Energy Systems for E-mobility)
Abstract
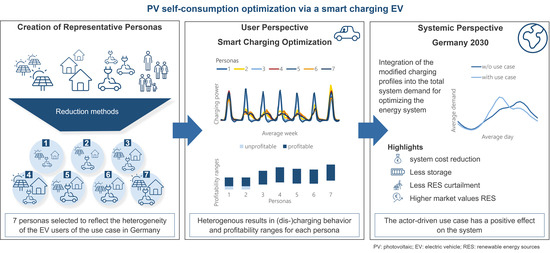
:The shift to electric transportation is crucial to fighting climate change. However, Germany’s goal of 15 million electric vehicles (EVs) by 2030 remains distant. Therefore, enhancing their economic viability is essential to promoting EV adoption. One promising option to increase the economics for the user is PV self-consumption optimization using smart charging EVs. Yet, more research is needed to explore the use case’s impacts on the German/European energy systems. Therefore, PV self-consumption optimization using EVs is integrated into an energy system model, assessing its impact on the energy system in 2030. For this purpose, the use case is modeled for different groups of people—personas—which are defined in a way that creates a diverse set of personas reflecting the distribution of different statistical values within Germany. The modified (dis)charging profiles are then aggregated and integrated into the energy system model. With a high implementation of PV self-consumption optimization in Germany in 2030, a positive system effect (with a system cost reduction of 53 million EUR/a) can be observed with a lower need for further storage and less curtailment of renewable energies (RES). Furthermore, the market values for RES increase by 0.7%, which fosters the integration of RES.
1. Introduction
The electrification of the transport sector is seen as a vital element in the German energy transition. While CO2 emissions in the German energy sector have significantly declined due to the substantial growth of renewable energy sources (RES), emissions in the transportation sector have remained mostly unchanged since 1990 [1]. Consequently, the German government has set an ambitious target of achieving 15 million electric vehicles (EVs) by 2030 [2]. However, this target is still far from being reached. To promote the widespread adoption of EVs, it is essential to improve their economic viability compared to internal-combustion-engine vehicles.
For EVs, smart unidirectional or smart bidirectional charging is discussed frequently to establish profitable use cases from a user perspective. One particular economic use case is the optimization of PV self-consumption for households [3]. This use case aims to maximize the use of self-generated electricity from residential PV systems by shifting EVs’ charging and discharging times. Usually, the charging times are shifted to midday during maximal PV generation and the discharging times to peak load hours in the evening. The economic viability is achieved by the high residential electricity prices and relatively low feed-in tariffs for PV systems in Germany, which make maximizing the use of the self-generated electricity from PV systems profitable. The use case is also possible for the tertiary or industrial sector. Commercial electricity prices, however, are usually much lower in Germany, reducing profitability. Thus, in this paper, we focus on residential systems (residential households with EV and PV) in Germany. Since it has, currently, a favorable setting, a high implementation of the use case can be assumed to lead to systemic effects.
Numerous studies analyze the effect of PV self-consumption optimization with battery storage or an EV from the user perspective. In [4,5], the profitability of PV-battery systems is analyzed. The usage of EVs is compared to battery usage in [6], while [3,7,8] focus on PV-EV systems. These analyses are not just performed in Germany but also in other countries, regions, or large cities such as Sweden, Italy, the Mediterranean Area, or Shanghai [4,5,7,8].
Depending on the configuration of the case study, the profitability of the PV-battery systems varies. The system is profitable in most configurations in [4]. In [5], it is shown that even though the PV-battery system is economically viable, installing a PV system alone gives higher revenues.
Analyzing a smart household with heat pumps, thermal energy storage systems, batteries, PV and EVs [6] shows that the system is profitable compared to a system without PV and battery/smart EV. In the smart household, the smart EV performing PV self-consumption optimization can substitute the stationary battery.
The PV-EV system is economically viable for different configurations. In [3], the revenues are mainly sensitive regarding the difference between the electricity price and feed-in tariff for the PV system, as well as the PV system design and household demand.
None of the papers, however, address the aggregation of the user-specific results across a country to analyze nationwide systemic impacts.
There is also literature considering different configurations for one country, for example, [9] for Sweden. Here, 400 configurations of measured household demand profiles and driving profiles (with a large variation between the profiles) are used to analyze the use case of PV self-consumption optimization with EVs and/or battery systems. The focus is on the technical potential of the use case. This paper does not examine the representativeness of the entire country, which limits its applicability to energy system modeling.
In addition, there are several analyses of the impact of smart EVs on the distribution grid. Due to electrification in the residential and transport sectors, a significant increase in grid load is expected, mostly if EVs and heat pumps are charged/used unmanaged [10]. Refs. [11,12] show that the charging strategy significantly influences the grid load for unidirectionally charged EVs. Refs. [13,14] extend this finding for bidirectionally charged EVs. While spot market-oriented flexibility marketing can result in high peak-load-simultaneities and a significant increase in grid load, PV self-consumption optimization can slightly positively affect the distribution grid [13,15]. These papers analyze the systemic effects of smart EVs; however, on regional distribution grids rather than the country level.
In [16], a conceptual study was performed on how an energy system based on only PV and smart EVs can cover the electricity demand of Spain. However, there is neither an economical assessment nor a detailed energy system optimization, but rather a rough conceptual study showing general feasibility.
The literature about the systemic effects of smart EVs on a country level, for example, [17], does not consider PV self-consumption optimization but vehicle-to-grid/market-oriented optimization (resulting in different (dis-)charging behavior compared to PV self-consumption optimization). Ref. [17] shows that bidirectional charging proves advantageous for the energy system and reduces the need for thermal power plants and stationary battery storage.
In summary, the literature review lacks studies addressing the systemic impacts of PV self-consumption optimization using an EV at a national or international level concerning the integration of RES (in Europe)—regarding market values or curtailment—and the total system costs of the resulting energy system. In [18], it is discussed that the use case can have a positive effect in summer but may have a negative systemic effect in winter. However, no energy system modeling has analyzed it so far. This paper aims to fill this research gap.
To evaluate the systemic effects of PV self-consumption optimization, it is necessary to create results of the actor-driven use case of PV self-consumption optimization that are representative of a country. Since the people in one country are very heterogeneous, a great number of possible types of persons (personas) exist. This large quantity should be reduced by a suitable reduction method to reduce complexity and computational time.
Various reduction or clustering methods exist in the literature, such as k-means or dbscan [19]. In k-means, clusters for a given data set are created based on the minimal variance between the elements in one cluster, while in dbscan, the selection criterion is the density between elements. k-means is the most popular clustering algorithm, as it is advantageous in many ways.
However, these clustering methods require a complete data set (real or simulated data for the entire country) to group into representative clusters. If no complete data set exists but only possible data combinations (generated by combinatorics), other methods are required. In this case, instead of clustering algorithms, using statistical data for individual features is a possible approach. These statistical data define how often a feature should be present in the resulting clusters. The selection of how these features are combined could be, for example, a random combination. Another approach—chosen in this paper—is to create an optimization problem using this partial information about a data set that calculates a possible or best possible distribution.
The main contributions of this paper are as follows:
- Creating a methodology to integrate PV self-consumption optimization using EVs from a user perspective into an energy system model.
- Modeling the profitability of PV self-consumption optimization for different groups of people to analyze for which groups of people in Germany PV self-consumption optimization is profitable.
- Modeling the European energy system with a focus on Germany for the year 2030 while considering PV self-consumption optimization using EVs to answer the research question of whether PV self-consumption optimization using EVs is always beneficial to the energy system.
2. Methods
A three-step methodology is created to evaluate the systemic effect of the user-driven use case of PV self-consumption optimization using EVs. First, relevant personas to explain the different groups of people in Germany are defined. Second, PV self-consumption optimization profitability—for relevant personas—is calculated from a user perspective, to obtain all profitable personas. Third, the results are aggregated for Germany and implemented as fixed input in an energy system model to evaluate PV self-consumption optimization from a systemic perspective. All three steps are explained in detail in the following subchapters and summarized in Figure 1.
2.1. Methodology for the Definition of Relevant Personas
One main challenge is that the user-perspective evaluation needs to represent the entire country of Germany. This representativity can be achieved using an average actor. This approach, however, does not represent the heterogeneity of Germany (with varying user groups, household demands, and EV types) and produces more uniform results than are truly realistic. Therefore, we define personas in this paper to reflect this heterogeneity. Personas represent a group of people in Germany. A representative person in one group would be, for example, a single pensioner living in a rental apartment without an EV.
To define possible personas, it is necessary to specify relevant categories and their respective features for the use case of PV self-consumption optimization. Possible categories for this use case are the type of EV, the PV system, and household demand. For the type of EV, the feature could be, for example, minis, middle-class vehicles, and SUVs. The number of categories and features then results in the total number of possible personas (Equation (1)):
with as the number of features of the category .
Not all possible personas are calculated since not all are realistic; some features contradict other features (for the use case of PV self-consumption optimization). To factor out these contradictions, excluding statements are created. These excluding statements are, for example, that a large family cannot have the electricity demand of a single-person household.
The number of realistic personas is still high, so we reduce it further in a second step via an optimization program. This program selects the best combination and smallest number of personas that optimally fulfill the statistical values given by the categories and their features. For example, the distribution of EVs (minis, middle-class vehicles, and SUVs) among all chosen personas has to match the distribution in Germany. The resulting nonlinear optimization program is structured as follows (Equations (2)–(4)):
The optimization variable is the share of the persona with values ranging from zero to one, as indicated in Equations (3) and (4). A value of zero indicates that this persona is not selected. In contrast, values above zero indicate the degree to which it is considered. Equation (3) defines that the sum of all shares equals 1.
Equation (2) minimizes the squared difference between the modeled and statistical values given by the features of each category . is the statistic share to reach (with values between 0 and 1, for example, the distribution of EVs in Germany given by a statistical office), and the modeled value. The binary parameter indicates whether this feature is present in the persona.
The second term in Equation (2), , serves as a penalty term to reduce the number of personas. The term becomes large if the shares are all in a similar range, and small if there are a small number of shares with large values and the remaining shares are very small. Therefore, this term encourages a reduction in the number of personas. However, since it is not a mixed-integer optimization program, typically takes values greater than zero (for example, 0.01 instead of 0). Therefore, to reduce the number of personas, all small shares are removed, and the remaining shares are normalized.
We repeat the above-explained optimization program with different random start parameters to avoid ending in local minima.
2.2. Methodology for the Evaluation of PV Self-Consumption Optimization Profitability to Obtain Profitable Personas
In the second step, the profitability of PV self-consumption optimization using EVs is calculated for the identified personas in order to obtain all profitable personas. This profitability calculation includes the revenue from the optimized (dis-)charging of the EV as well as the additional costs caused by the additional components compared to unmanaged charging.
The actor-model eFlame (electric Flexibility assessment modeling environment) calculates the revenues. eFlame is an optimization model that models several use cases, such as arbitrage trading, PV self-consumption optimization, FCR trading, and peak shaving for different flexible assets [3,20,21,22].
The general structure of eFlame is displayed in Figure 2. It is built modularly with different elements, such as PV systems, industrial loads, and stationary batteries. For the use case of PV self-consumption optimization with an EV, we need the household profile generator coupled with the EV profile generator, the EV with charging infrastructure (EVSE), the PV system, and the grid. These elements are displayed in dark blue in the figure.
In the household and EV profile generator, a fixed electrical consumption profile of a specific household and the EV driving profile are modeled based on consecutive activity plans [23]. Depending on the persona, 20 to 30 profiles for each persona are created, based on an analysis in [24], to obtain representative results. For the PV system, a fixed generation profile is integrated depending on the region, orientation, and slope of the PV system. For the EV, three different charging strategies are considered: unmanaged, smart unidirectional, and smart bidirectional charging. In the case of unmanaged charging, the EV is charged as soon as it arrives (if it is plugged in) with full power, and, therefore, no optimization takes place. For smart unidirectional and bidirectional charging, the charging (and discharging) are optimized for PV self-consumption. The model minimizes the total electricity costs for the individual grid connection point (GCP) by shifting charging (and discharging) times (see Equation (5)).
The total electricity costs result from the costs of the electricity procurement at the grid connection point (), subtracting the revenues of selling excess energy based on the feed-in tariff (). The electricity procurement costs are the energy procurement () multiplied by the electricity price (including SIPs and grid fees) (). If solutions have the same total electricity costs, the EV is charged at the earliest possible time to achieve the most robust result for the user, even in the event of uncertainty. We refrain from presenting the complete mathematical formulation of the model eFlame here; see [3] for a detailed description. As discussed in [3], for PV self-consumption optimization via an EV, a variable efficiency is modeled since a constant efficiency significantly overestimates revenues due to the often small (dis)charging power in this use case.
We refer to [25] for calculating the additional costs for smart unidirectional and bidirectional charging compared to unmanaged charging. Relevant components that cause additional costs are, for example, the costs of a bidirectional charging system. All relevant components that cause additional costs for smart unidirectional and bidirectional charging compared to unmanaged charging are listed and quantified in a range (minimal and maximal value). For this paper, these cost components from [25] were updated in dialogue with experts in the project unIT-e2 [26] and with a literature review of currently existing systems (such as the charging systems of Eli, QUASAR, and ABL).
To calculate the profit ranges for each persona, the additional cost range is combined with the revenue range, leading to a minimal and maximal profit. This profit can be negative if the revenues do not cover the costs (mainly for the minimal profit). To obtain the profitable share of personas , we assume that the distribution between minimal and maximal profit is equally distributed so that it can be described by a linear profit function (Equation (6)):
and is the minimal and maximal profit for each persona . We assume that users only perform the use case if it is profitable for them. Therefore, only the profitable shares of the personas are passed to the energy system model.
2.3. Methodology for the Evaluation of PV Self-Consumption Optimization from a Systemic Perspective
In the third and final step, the different (dis-)charging profiles of the personas for Germany are aggregated and then implemented as fixed inputs into the energy system model ISAaR (Integrated Simulation Model for Unit Dispatch and Expansion with Regionalization) to evaluate the optimization of PV self-consumption from a systems perspective [20,27,28].
ISAaR is a linear optimization model for the European energy system using perfect foresight, optimizing asset expansion and dispatch with hourly time steps. Electricity, district heating, hydrogen, biomass, and gaseous and liquid hydrocarbons are considered energy carriers (see central part of Figure 3). Several assets couple these energy carriers, such as power-to-X technologies. Furthermore, there are storage systems for the different energy carriers, such as pump storage for electricity. The demand of the industrial, transport, residential, and tertiary sectors is a fixed input for the ISAaR (see left side of Figure 3). Moreover, energy can be imported from outside Europe (see lower part of Figure 3). The RES expansion is modeled endogenously but with exogenous model input (see right side of Figure 3).
The geographical scope is EU27 + UK, Norway, and Switzerland. The calculations are performed at the country level, except for the UK and Denmark. In these cases, Great Britain and Northern Ireland, as well as Denmark West and Denmark East, are further subdivided for the analysis.
In ISAaR, the total system costs are minimized under the constraint that for every timestep , region , and energy carrier , the energy balance is met (see Equation (7)). The sectoral demand equals the sum of all generation of all elements minus the sum of all consumption elements added to the imports subtracted by the exports of the energy carrier .
The complete mathematical formulation of the optimization problem can be found in [27].
In the ISAaR, the EVs are modeled in two different ways. Unmanaged charging is a fixed load profile from the transport sector delivered to the ISAaR (left side in Figure 3). Smart unidirectional and bidirectional EVs are integrated directly into the ISAaR as an expansion element. In the optimization model, an endogenous integration of smart EVs is optimized based on the additional costs (upgrade of unmanaged charging to smart charging). In the case of an expansion of smart EVs, the fixed demand of unmanaged charging EVs is reduced analogously, representing the upgrading of unmanaged charged EVs to smart EVs (see [20] for further information and the mathematical formulation).
To consider PV self-consumption optimization via EVs in the ISAaR, the profitable personas from the user perspective are aggregated to obtain the total number of users in Germany in 2030. We refer to [29] for the total number of possible users performing PV self-consumption optimization with EVs (considering the achievable potential). The total number of users is split into relevant personas for each persona according to the shares obtained in Equations (2)–(4).
As users are expected to only implement profitable use cases in reality, the number of users is further reduced by the linear profit function in Equation (6). The linear profit function is used both for unidirectional and bidirectional charging, displayed as and . In this work, we assume that 50% of all possible users choose unidirectional and 50% bidirectional charging, leading to Equation (9).
The modified (dis)charging profiles for each persona are then scaled with and aggregated to one profile. This profile is integrated into the energy system model as a fixed input. To model the upgrade rather than additional EVs, the number of unmanaged charging EVs in the transport sector is reduced.
To quantify the effect of PV self-consumption optimization with EVs on the energy system, two scenarios are compared: a base scenario without PV self-consumption optimization and a second scenario with PV self-consumption optimization.
3. Results
In line with the methodology, we divide the results into three sections. In Section 3.1, the results of the definition of relevant personas are presented, followed by the evaluation of PV self-consumption optimization profitability from the user perspective in Section 3.2, and finished by the evaluation of PV self-consumption optimization from a systemic perspective in Section 3.3.
3.1. Definition of Relevant Personas
For the definition of relevant categories, we consider the necessary input of eFlame for modeling the use case of PV self-consumption optimization. Required assets are the EV with EVSE, the household load, and the PV system. For all these assets, at least one category is necessary. The household load profiles and the EV driving profiles also depend on the user behavior, which is added as a further category. To avoid redundant categories, we aggregate categories (for example, two EV categories), leading to the following four categories:
- EV: consumption and battery capacity;
- Household: yearly electricity consumption (profile);
- PV: installed capacity;
- Type of actor/User group: number of children, amount of driving, work situation.
For the category EV, the share of vehicle types in Germany according to the Federal Motor Transport Authority (KBA) (1 January 2022) [30] is taken and aggregated to the three features: small, medium, and large. Small contains minis and small cars, medium contains compact and middle-class vehicles, and large contains all remaining cars. These vehicle types are combined with assumed average battery capacities from the project unIT-e2 [25], which are the result of an extensive consultation process with relevant stakeholders from the automotive and energy industries.
For the yearly electrical household demand, including the distribution in Germany, we use data from the Federal Statistical Office of Germany (destatis) [31,32]. The electrical household demand (without electrical heating) can be split into three features: small, medium, and large, with corresponding consumptions of 1623 kWh/a, 2731 kWh/a, and 4394 kWh/a.
All PV systems in Germany are listed in the “Marktstammdatenregister” (MaStR, market master data register) [33]. We consider residential systems between 1 kWp and 20 kWp on rooftops of buildings and facades to be suitable for PV self-consumption optimization (analog to [29]). The total number (until 1 January 2023) is split into three equal shares to define the installed capacity for the features small, medium, and large, with corresponding values of 3.9 kWp, 7 kWp, and 11 kWp.
For the user groups (UGs), we refer to the dissertation of Steffen Fattler [34]. Twelve UGs are defined there, with shares ranging from 1.2% to 19.3%. We only consider UG1, UG2, UG4, UG6, UG8, UG9, and UG10 (all shares > 6%) from the dissertation, with rescaled shares resulting in small deviations from the original statistics. This way, we can reduce the number of user groups in this work.
All four categories and their respective (three to seven) features are shown in Table 1, resulting in 189 possible personas.
An important influencing factor is the feed-in tariff. As it greatly impacts the results (shown, for example, in [3]) and the user in 2030 will be a mix of old and new funding schemes, it is not sufficient to assume one feed-in tariff. Therefore, we assume two different funding schemes: low and high. Depending on the size of the PV system, the small tariff is assumed to be either 8.6 ct/kWh or 7.5 ct/kWh. The high tariff is assumed to be 15 ct/kWh. These values are oriented toward the development of remuneration in Germany over the last 13 years [35]. For all personas, both possibilities—small and high tariffs—are calculated and aggregated later.
To reduce the number of personas before using the optimization program, we assume logic, excluding statements. These excluding statements are supposed to create unique, differing personas. These statements are not intended to apply to every person in Germany but exclude rarer combinations.
- Statement 1: No small PV system (PV1) with a large household load (HH3). It is assumed that households with higher demand install larger PV systems, as PV system installers or online guidelines recommend different PV sizes depending on the number of people and electricity consumption of the household. This impacts the typical household load-to-PV ratio, even if it also depends on other factors such as the suitable roof size. Additionally, larger demand often implies larger houses with a larger roof area.
- Statement 2: No large PV system (PV3) with a small household load (HH1). Same argumentation as in statement 1. PV system installers or online guidelines recommend different PV sizes depending on the number of people and electricity consumption of the household, and a small household load can imply a smaller roof area.
- Statement 3: No small PV system (PV1) with a large EV (EV3). It is assumed that wealthy people with expensive vehicles also more often invest in a medium or large PV system instead of a small PV system. Furthermore, larger EVs result in greater total demand.
- Statement 4: No large EV (EV3) with unemployed (UG6, UG7). It is assumed that unemployed people more often cannot afford a large, expensive EV.
- Statement 5: No childless (UG1, UG2, UG4, UG6, UG7) with a large household load (HH3). There is a correlation between household load and the number of persons in a household, which can be found in the data provided by destatis [31].
- Statement 6: No small EV (EV1) with a frequent driver (UG2, UG3, UG4, UG5, UG7). Frequent drivers are assumed to prefer comfort and generous space in the first row of seats as they spend much time driving. This often leads to larger vehicles, as the ADAC (German automobile club) also states. In addition, smaller EVs imply smaller battery capacities and shorter minimum driving distances.
- Statement 7: No small household load (HH1) with children (UG3, UG5). The same argumentation as in statement 5. There is a correlation between household load and the number of people in a household.
If several combinations are available, the PV size that fits the household size is preferred (for example, a large PV system (PV3) with a large household load (HH3)). This results in 25 of the previous 189 combinations (see Table A1 in the Appendix A). The optimization program (Equations (2)–(4)) can further reduce this number, leading to seven combinations that reflect well all chosen statistics (see Table 2).
As shown in Figure 4, these seven personas satisfy the statistics similarly well as the 25 combinations. The highest deviations are for the PV system size (PV1 and PV3), followed by deviations for HH1, UG3 and UG5. As the deviations are in the same range for both all 25 personas and the seven personas, we assume seven personas in the following, as demonstrated in Table 2.
3.2. Evaluation of PV Self-Consumption Optimization Profitability to Obtain Profitable Personas
The model eFlame includes one PV system, one EV with EVSE, an electrical household load without a heat pump or battery storage, and a constant electricity price and feed-in tariff for the PV system to calculate the revenues. The specific parameters of the components are shown in Table 3. Regarding variable values depending on the persona, please see Table 1. The parameters result from an extensive consultation process as part of the unIT-e2 project [26] with relevant stakeholders from the automotive and energy industries.
The average household demand of one day for each persona is shown in Figure 5. Depending on the persona, different characteristics can be identified. While persona 3 has a high peak around midday, persona 2 has a much less volatile consumption with only a small peak in the evening.
These different characteristics, combined with different EVs and PV systems, result in different average optimized (dis-)charging profiles (see Figure 6 for persona 3 and Figure A1 in the Appendix B for the remaining personas).
If no optimization is performed (unmanaged charging), charging takes place quite regularly, with a peak time of around 6 p.m. and an average power of 0.8 kW. Introducing smart unidirectional charging leads to an earlier, narrow peak at midday with an average power of 2 kW. The effect is slightly increased if bidirectional charging is possible, as the additional energy can be discharged in the evening to cover part of the evening consumption of the household (see Figure 5). This applies to all days and not only to the weekend, as it does in the cases of personas with work during the daytime (see personas 2, 4, 6, and 7), where just the necessary amount is charged during the week, leading to smaller charging power during the week as for unmanaged charging.
The different (dis-)charging profiles lead to different revenue ranges (compared to unmanaged charging) as well (see Figure 7). Since 20 to 30 optimizations for each persona with slightly different input data are performed (30 for frequent drivers, 20 for the remaining), and two different feed-in tariffs are considered, we obtain revenue ranges. Generally, higher revenues can be obtained with bidirectional charging instead of unidirectional charging, although the differences vary greatly depending on the persona. For personas 1 and 2, almost no additional revenue can be generated with bidirectional charging compared to unidirectional charging since almost no discharging takes place (see Figure A1). In contrast, revenues for persona 5 increase largely with bidirectional charging.
To obtain the profit ranges, the additional costs of smart unidirectional and bidirectional charging compared to unmanaged charging have to be defined. The costs in [25] are updated for 2030, generating additional costs for smart unidirectional charging of 13 EUR/a to 117 EUR/a and smart bidirectional charging of 60 EUR/a to 196 EUR/a. These additional costs lead to the profit ranges shown in Figure 8. In the case of smart unidirectional charging, a positive profit is always reached (up to 412 EUR/a), as the additional costs are small compared to the revenue potential. In the case of smart bidirectional charging, not all personas are always profitable. The profit can also be negative in the case of personas 1 and 2. In these cases, the revenues are similar to those of smart unidirectional charging (see Figure 7), as discharging can be rarely used. These negative profits are reached just for the high feed-in tariff, as the difference between household price and feed-in tariff is rather small. Together with high additional costs, negative profit is obtained. In summary, smart bidirectional charging can lead to additional revenues in comparison to smart unidirectional charging (but not necessarily), together with higher additional costs, leading to a broader range of profit potential between negative profit (min −67 EUR/a) and 447 EUR/a.
These profit ranges result in a share of profitable users for personas 1 and 2 for bidirectional charging of 76%, with all other personas and smart unidirectional charging being 100% profitable. The share of 76% is composed of 51% profitable users with a high feed-in tariff and 100% with a low feed-in tariff.
3.3. Evaluation of PV Self-Consumption Optimization from a Systemic Perspective
To obtain the aggregated new load profile for the ISAaR, the shares of profitable personas are multiplied by the total potential of 4.3 million users, obtained from [29], leading to 4.0 million profitable users. The number of users for each persona, charging strategy, and feed-in tariff are used to scale the modified (dis)charging profiles (see exemplarily Figure 6). The aggregated new demand profile is integrated into the demand profile of the unmanaged EV demand in Germany and later into the total demand.
Generally, the yearly demand is increasing by around 0.8 TWh/a due to increased charging and discharging losses caused by load shifting. This absolute increase signifies an increase in the EV demand of 1.8% (48.2 TWh/a compared to 47.4 TWh/a) but just 0.1% for the total German demand (677.8 TWh/a compared to 677.0 TWh/a). However, larger changes occur for the peak load. As shown exemplarily in Figure 6, due to smart charging, the peak load is not only shifting but also increasing. The peak load of the EV demand increases from 19 GW to 27 GW (+43%), the peak load of the total transport sector increases from 24.7 GW to 31.9 GW (+29%), and the total peak load increases from 135.6 GW to 137.5 GW (+1.4%).
The effect of PV self-consumption optimization on EV demand is presented in Figure 9. The overall characteristic of the annual duration curve remains, although the total peak increases with PV self-consumption optimization. On the average, the effects mentioned above can be found: There is a peak shifting to midday, resulting in a second, larger peak.
The modified demand profile is integrated into the ISAaR. Two scenarios for 2030 (target scenarios according to the current government plans [37]) are calculated:
- Base: Base scenario without PV self-consumption optimization and fixed expansion of RES in Europe.
- PVSys: Scenario including PV self-consumption optimization and fixed expansion of RES in Europe.
In the following, the usage of EVs, the total system costs, the installed capacities with their respective energy usage and RES curtailment, and the market values for RES (Figure 10) are analyzed. The focus of the analysis is on Germany.
In total, four different charging options/use cases for EVs exist: unmanaged unidirectional charging, smart charging with the use case PV self-consumption optimization, and the optimized expansion of smart unidirectional and bidirectional charging within the energy system model. The allocation of the use cases depends on the scenario. There will be, in total, 16.5 million EVs in Germany in 2030, according to the chosen scenario. In the scenario Base, only the three options without PV self-consumption optimization are available, resulting in a maximum of 6.1 million unidirectional and bidirectional charging and the remaining 4.3 million unmanaged charging. The number of unmanaged charging decreases in the scenario PVSys to 0.2 million EVs, with 4 million EVs that perform the use-case PV self-consumption optimization. In both scenarios, the maximum amount of smart unidirectional and bidirectionally charged EVs are installed, as it is the most favorable electrical storage for the model compared to battery storage.
Around 600 billion EUR/a are necessary for energy procurement in Europe as total system costs. Besides electricity costs, these costs imply the costs for the other energy carriers but not the costs within the sector models. If PV self-consumption optimization in Germany is used, the costs are reduced by about 0.01%, or 53 million EUR/a. Therefore, from a systemic perspective, the use case of PV self-consumption optimization is favorable as it reduces the total system costs.
To understand how this cost reduction in the scenario of PVSys arises, we analyze the installed capacities and their usage. As both scenarios imply a fixed expansion of RES in Europe, no difference in installed capacities for RES exists. In general, there are only marginal changes for the installed capacities in Germany, which are in the range of the model uncertainty. The energy balance, however, does look different. There is less curtailment for RES and less usage of the dispatched electrical storages (mainly bidirectional charging), implying that the shifted demand better fits the volatile RES.
Between the scenarios, the interactions between Germany and Europe differ. However, the effects in general—less storage usage and curtailment for RES—can also be seen in Europe. Here, the installed capacity of electrical storage also decreases slightly.
For the curtailment of RES in Germany, a reduction of 1.3 TWh/a to 0.86 TWh/a occurs, resulting in a reduction of 0.44 TWh/a (or 34%). Depending on the technology, this is a reduction of 29% (wind offshore) to 46% (rooftop PV and wind onshore). In absolute terms, the curtailment reduction is highest for wind offshore, with 0.24 TWh/a. In the scenario Base, the curtailment of all technologies is below 1% of the potential energy (wind offshore with a maximum of 0.63%). The same effects can be observed in Europe, although they are less relevant since the changes occur mainly in Germany. Therefore, the relative reduction in curtailment is only −3% instead of −34%.
The general usage of smart unidirectionally and bidirectionally charged EVs (market-oriented) is similar in their characteristics in both scenarios, but the peaks are less pronounced, resulting in lower usage overall.
Due to the demand shifting into the midday, the residual load is getting less volatile in the scenario PVSys, resulting in a lower (average daily) standard deviation. This change also implies a less volatile electricity price with a decreasing average daily standard deviation from 24.9 EUR/MWh to 24.1 EUR/MWh (a decrease of 3.4%). Furthermore, the market values for all RES (PV, wind onshore, and wind offshore) are increasing. For all renewables, the annual market value increases by 0.7%, while the market value of wind offshore increases by 0.2%, wind onshore by 0.6%, and PV by 1.2%. Here, it is interesting to look deeper into the hourly deviations of the market values (see Figure 10).
When aggregating the hours (night(1): 0 a.m. to 3 a.m., morning: 4 a.m. to 7 a.m., daytime: 8 a.m. to 3 p.m., evening: 4 p.m. to 8 p.m., night(2): 9 p.m. to 11 p.m.), there is an increased market value (for all RES) by 2% during the day (69 EUR/MWh versus 67.7 EUR/MWh) and a decreased market value by 0.6% in the evening hours (95 EUR/MWh versus 95.6 EUR/MWh). This effect applies to all three technologies with varying degrees of intensity (maximal increase around midday for wind onshore with 2.4%, maximal reduction for PV in the evening hours with −2.5%).
4. Discussion and Conclusions
Electrifying the German transport sector is essential for our goals set in the Paris Agreement and the Green Deal. However, the goal of 15 million EVs by 2030 remains distant. To boost EV adoption, enhancing their profitability is, therefore, essential. Smart charging, both unidirectional and bidirectional, can create profitable EV use cases. One such use case involves optimizing PV self-consumption. In this paper, we study how promoting PV self-consumption optimization in Germany affects the German/European energy system.
To reflect the heterogeneity of Germany, we create representative personas performing PV self-consumption optimization. With these personas, varying results are achieved compared to an average actor. Different (dis)charging profiles result, with a shift in charging from the week to the weekend for frequent drivers and a more regular characteristic for low drivers. These profiles subsequently lead to different revenues and profits, ranging from −67 EUR/a to 447 EUR/a profit, depending on the personas and charging strategy. For two of the seven chosen personas, the use case is only sometimes profitable and would not occur. Therefore, using different personas when analyzing smart charging use cases is sensible.
In the second step, we aggregate the different charging profiles to integrate them into the energy system model. Due to the different personas, we can integrate only the share of profitable personas, which is more realistic. We show that with the integration of PV self-consumption optimization, the following effects occur:
- (1)
- The total system costs decrease by about 53 million EUR/a.
- (2)
- The installed capacities change only marginally, but the usage does change, resulting in less RES curtailment and less electrical storage usage.
- (3)
- The market values of RES increase due to the demand shift, leading to a favorable framework for the expansion of RES.
In [21], a positive effect in summer but a negative effect in winter is discussed. We could not verify this hypothesis, as in our scenario, we can identify a positive effect but no fundamental differences between the seasons. The hour of the day has a higher impact due to the load shifting from the evening to the midday hours.
Limitations
However, there are some limitations to the modeling and the results that show the need for further research.
The methodology for creating representative personas for Germany is highly sensitive to the input data/used statistical values. Furthermore, the excluding statements have to be updated every time the number of features or statistical values are updated. The excluding statements are, however, necessary to obtain sensible results from the optimization program, which has to be fine-tuned every time something changes. These statements are a weak point in the methodology since no statistical data exists to verify them. This high effort and weakness should be reduced in further work. One option might be two mean actors (a commuter and a non-commuter) if only systemic effects are to be analyzed. Taking just two mean actors might not significantly influence the final results regarding the effect of PV self-consumption optimization on the energy system. For detailed analyses of different users, however, the above methodology should be used to reflect the heterogeneity in Germany. The statements should be modified as soon as representative population surveys on the selected categories for Germany are available.
In this work, the focus is on Germany. Therefore, PV self-consumption optimization is only implemented there. However, the impact on the European energy system will increase if the use case is implemented in several European countries. Consequently, the same methodology should be applied to other countries as well, provided that similar statistics can be found and the EV and household profile generators are adapted to the behavior of the respective country.
The same applies to the scenarios. Currently, only one scenario is evaluated for 2030. The analysis should be expanded to different scenarios, and instead of calculating only the year 2030, we should calculate in five-year steps from today up to climate neutrality (for example, 2025, 2030, 2035, 2040, and 2045). In a further analysis, another scenario (free RES expansion) has already been studied, and generally similar statements have been drawn. However, further scenario deviations should be analyzed, such as other sectoral demands and different EV use case potentials. When defining new scenarios, it should, however, be taken into account that scenario deviations often have a higher impact than the use-case PV self-consumption optimization. For example, the scenario free RES expansion leads to a totally different energy system.
Last, as in both scenarios in this paper, the maximum expansion of smart charging is installed, it cannot be shown whether a substitution of use cases would be more favorable. That should be analyzed in detail.
In summary, the use case of PV self-consumption optimization with an EV makes installing a PV system and the investment in an EV almost always more profitable. Thus, the use case is positive from the user’s perspective. Furthermore, the actor-driven use case of PV self-consumption optimization in Germany can have a slightly positive effect on the energy system; thus, a promotion of this use case by the German government can help the energy transition in Germany.
Author Contributions
Conceptualization, K.G.; methodology, K.G.; software, K.G.; validation, K.G., T.K. and M.H.; formal analysis, K.G.; investigation, K.G.; writing—original draft preparation, K.G.; writing—review and editing, K.G., T.K. and M.H.; visualization, K.G.; All authors have read and agreed to the published version of the manuscript.
Funding
The work described was conducted within the unIT-e2 project, which is funded by the German Federal Ministry for Economics and Climate Action (BMWK) under the funding code 01MV21UN01.
Data Availability Statement
The data presented in this study are contained within the article.
Acknowledgments
Special thanks go to our colleagues Patrick Dossow and Louisa Wasmeier, who supported us in the development of the methodology.
Conflicts of Interest
The authors declare no conflicts of interests. The funders had no role in the design of the study; in the collection, analyses, or interpretation of the data; in the writing of the manuscript; or in the decision to publish the results.
Appendix A
The following section contains a list of all 25 personas, after applying the excluding statement. The structure is analogs to Table 2.

Table A1.
Resulting 25 combinations (after excluding statements) and their respective features for the categories EV, household, PV, and user group.
Table A1.
Resulting 25 combinations (after excluding statements) and their respective features for the categories EV, household, PV, and user group.
| ID | EV | Household | User Group | PV |
|---|---|---|---|---|
| 1 | 1 | 1 | 1 | 1 |
| 2 | 1 | 1 | 6 | 1 |
| 3 | 1 | 2 | 1 | 2 |
| 4 | 1 | 2 | 6 | 2 |
| 5 | 2 | 1 | 1 | 1 |
| 6 | 2 | 1 | 2 | 1 |
| 7 | 2 | 1 | 4 | 1 |
| 8 | 2 | 1 | 6 | 1 |
| 9 | 2 | 1 | 7 | 1 |
| 10 | 2 | 2 | 1 | 2 |
| 11 | 2 | 2 | 2 | 2 |
| 12 | 2 | 2 | 3 | 2 |
| 13 | 2 | 2 | 4 | 2 |
| 14 | 2 | 2 | 5 | 2 |
| 15 | 2 | 2 | 6 | 2 |
| 16 | 2 | 2 | 7 | 2 |
| 17 | 2 | 3 | 3 | 3 |
| 18 | 2 | 3 | 5 | 3 |
| 19 | 3 | 2 | 1 | 2 |
| 20 | 3 | 2 | 2 | 2 |
| 21 | 3 | 2 | 3 | 2 |
| 22 | 3 | 2 | 4 | 2 |
| 23 | 3 | 2 | 5 | 2 |
| 24 | 3 | 3 | 3 | 3 |
| 25 | 3 | 3 | 5 | 3 |
Appendix B
The following section contains an overview of the different charging strategies of all seven personas analogs to Figure 6.
Figure A1.
(Dis-)charging power of an average week for each persona, starting with persona 1 and ending with persona 7. The week starts with Sunday (1) and ends with Saturday (7).
Figure A1.
(Dis-)charging power of an average week for each persona, starting with persona 1 and ending with persona 7. The week starts with Sunday (1) and ends with Saturday (7).


References
- Klimaschutz in Zahlen—Aktuelle Emissionstrends und Klimaschutzmaßnahmen in Deutschland—Ausgabe 2022. Available online: https://www.bmwk.de/Redaktion/DE/Publikationen/Klimaschutz/klimaschutz-in-zahlen.pdf?__blob=publicationFile&v=8 (accessed on 19 October 2023).
- Germany’s Current Climate Action Status. Available online: https://www.bmwk.de/Redaktion/EN/Downloads/E/germany-s-current-climate-action-status.pdf?__blob=publicationFile&v=1 (accessed on 19 October 2023).
- Kern, T.; Dossow, P.; Morlock, E. Revenue opportunities by integrating combined vehicle-to-home and vehicle-to-grid applications in smart homes. Appl. Energy 2021, 307, 118187. [Google Scholar] [CrossRef]
- Chatzigeorgiou, N.G. Evaluating the Techno-Economic Effect of Pricing and Consumption Parameters on the Power-to-Energy Ratio for Sizing Photovoltaic-Battery Systems: An Assessment of Prosumers in the Mediterranean Area. Energies 2023, 16, 4073. [Google Scholar] [CrossRef]
- Ciocia, A. Self-Consumption and Self-Sufficiency in Photovoltaic Systems: Effect of Grid Limitation and Storage Installation. Energies 2021, 14, 1591. [Google Scholar] [CrossRef]
- Keiner, D. Coupling heat and electricity storage technologies for cost and self-consumption optimised residential PV prosumer systems in Germany. Int. J. Sustain. Energy Plan. Manag. 2019, 21, 35–58. [Google Scholar] [CrossRef]
- Chen, J.; Zhang, Y.; Li, X.; Sun, B.; Liao, Q.; Tao, Y.; Wang, Z. Strategic integration of vehicle-to-home system with home distributed photovoltaic power generation in Shanghai. Appl. Energy 2020, 263, 114603. [Google Scholar] [CrossRef]
- Salpakari, J.; Rasku, T.; Lindgren, J.; Lund, P.D. Flexibility of electric vehicles and space heating in net zero energy houses: An optimal control model with thermal dynamics and battery degradation. Appl. Energy 2017, 190, 800–812. [Google Scholar] [CrossRef]
- Gudmunds, D.; Nyholm, E.; Taljegard, M.; Odenberger, M. Self-consumption and self-sufficiency for household solar producers when introducing an electric vehicle. Renew. Energy 2020, 148, 1200–1215. [Google Scholar] [CrossRef]
- Verteilnetzausbau für die Energiewende—Elektromobilität im Fokus. Available online: https://www.agora-verkehrswende.de/fileadmin/Projekte/2019/EV-Grid/Agora-Verkehrswende_Agora-Energiewende_EV-Grid_WEB.pdf (accessed on 15 June 2023).
- Yin, W.; Ming, Z.; Wen, T. Scheduling strategy of electric vehicle charging considering different requirements of grid and users. Energy 2021, 232, 121118. [Google Scholar] [CrossRef]
- Gemassmer, J.; Daam, C.; Reibsch, R. Challenges in Grid Integration of Electric Vehicles in Urban and Rural Areas. World Electr. Veh. J. 2021, 12, 206. [Google Scholar] [CrossRef]
- Müller, M.; Blume, Y.; Reinhard, J. Impact of behind-the-meter optimised bidirectional electric vehicles on the distribution grid load. Energy 2022, 255, 124537. [Google Scholar] [CrossRef]
- Müller, M. Netzintegration Dezentraler Flexibilitätsoptionen mit Fokus auf Ausgewählte Anwendungsfälle für Bidirektionale Elektrofahrzeuge. Ph.D. Thesis, TUM, Munich, Germany, 2023. [Google Scholar]
- Müller, M.; Schulze, Y. Future grid load with bidirectional electric vehicles at home. In Proceedings of the International ETG Congress, Berlin, Germany, 18–19 May 2021. [Google Scholar]
- Boström, T. The pure PV-EV energy system—A conceptual study of a nationwide energy system based solely on photovoltaics and electric vehicles. Smart Energy 2021, 01, 100001. [Google Scholar] [CrossRef]
- Kern, T.; Kigle, S. Modeling and Evaluating Bidirectionally Chargeable Electric Vehicles in the Future European Energy System. Energy Rep. 2022, 8, 2352–4847. [Google Scholar] [CrossRef]
- Kern, T. Assessment of the Added Value of Bidirectionally Chargeable Electric Vehicles for the User and the Energy System. Ph.D. Thesis, TUM, Munich, Germany, 2022. [Google Scholar]
- Hennig, C.; Meila, M.; Murtagh, F.; Rocci, R. Handbook of Cluster Analysis, 1st ed.; CRC Press: Boca Raton, FL, USA, 2015; pp. 8–12, 33 f., 114 f. [Google Scholar]
- Biedenbach, F.; Ziemsky, V. Opportunity or Risk? Model-based Optimization of Electric Vehicle Charging Costs for Different Types of Variable Tariffs from a Consumer Perspective. In Proceedings of the CIRED Porto Workshop 2022, Porto, Portugal, 2–3 June 2022. [Google Scholar]
- Biedenbach, F.; Blume, Y. Size matters: Multi-use Optimization of a Depot for Battery Electric Heavy-Duty Trucks. In Proceedings of the International Electric Vehicle Symposium and Exhibition (EVS36), Sacramento, CA, USA, 11–14 June 2023. [Google Scholar]
- Preis, V.; Biedenbach, F. Assessing the incorporation of battery degradation in vehicle-to-grid optimization models. Energy Inform. 2023, 23 (Suppl. 1), 33. [Google Scholar] [CrossRef]
- Müller, M.; Biedenbach, F.; Reinhard, J. Development of an Integrated Simulation Model for Load and Mobility Profiles of Private Households. Energies 2020, 13, 3843. [Google Scholar] [CrossRef]
- Morlock, E.S. Entwicklung eines techno-ökonomischen Bewertungsmodells für Vehicle-to-Home-Systeme—Analyse der Erlöspotenziale von Bidirektionalen Elektrofahrzeugen durch Eigenverbrauchserhöhung Sowie Durch Tarifoptimiertes Laden und Entladen anhand eines Optimierungsmodells in MATLAB. Master’s Thesis, TU Berlin, Berlin, Germany, 2020. [Google Scholar]
- Dossow, P.; Kern, T. Profitability of V2X Under Uncertainty: Relevant Influencing Factors and Implications for Future Business Models. Energy Rep. 2022, 8, 449–455. [Google Scholar] [CrossRef]
- Project Webpage: UnIT-e2 Reallabor für verNETZe E-Mobilität—Wir Mobilisieren die Digitale Energiewende. Available online: https://unit-e2.de/ (accessed on 19 October 2023).
- Böing, F.; Regett, A. Hourly CO2 Emission Factors and Marginal Costs of Energy Carriers in Future Multi-Energy Systems. Energies 2019, 12, 2260. [Google Scholar] [CrossRef]
- Kigle, S.; Ebner, M.; Guminski, A. Greenhouse Gas Abatement in EUROPE—A Scenario-Based, Bottom-Up Analysis Showing the Effect of Deep Emission Mitigation on the European Energy System. Energies 2022, 15, 1334. [Google Scholar] [CrossRef]
- Dossow, P.; Ganz, K.; Kern, T. Smart e-mobility: User potential in Germany today and in the future. In Proceedings of the NEIS Conference 2023, Hamburg, Germany, 4–5 September 2023. [Google Scholar]
- Bestand an Personenkraftwagen nach Segmenten und Modellreihen. Available online: https://www.kba.de/DE/Statistik/Fahrzeuge/Bestand/Segmente/segmente_node.html (accessed on 25 February 2023).
- Stromverbrauch der Privaten Haushalte nach Haushaltsgrößenklassen. Available online: https://www.destatis.de/DE/Themen/Gesellschaft-Umwelt/Umwelt/UGR/private-haushalte/Tabellen/stromverbrauch-haushalte.html (accessed on 25 February 2023).
- Statistisches Bundesamt: Privathaushalte und Haushaltsmitglieder—nach Haushaltsgröße und Gebietsstand. Available online: https://www.destatis.de/DE/Themen/Gesellschaft-Umwelt/Bevoelkerung/Haushalte-Familien/Tabellen/1-1-privathaushalte-haushaltsmitglieder.html (accessed on 25 February 2023).
- Marktstammdatenregister. Available online: https://www.marktstammdatenregister.de/MaStR/Einheit/Einheiten/OeffentlicheEinheitenuebersicht (accessed on 25 February 2023).
- Fattler, S. Economic and Environmental Assessment of Electric Vehicle Charging Strategies. Ph.D. Thesis, TU Munich, Munich, Germany, 2021. [Google Scholar]
- Archivierte EEG-Vergütungssätze und Datenmeldungen. Available online: https://www.bundesnetzagentur.de/DE/Fachthemen/ElektrizitaetundGas/ErneuerbareEnergien/EEG_Foerderung/Archiv_VergSaetze/start.html (accessed on 1 March 2023).
- Schroedter-Homscheidt, M.; Hoyer-Klick, C.; Kilius, N.; Lefevre, M.; Wald, L.; Wey, E.; Soboret, L. User’s Guide to the CAMS Radiation Service—Status December 2016; ECMWF: Reading, UK, 2016. [Google Scholar]
- Mehr Fortschritt Wagen—Bündnis für Freiheit, Gerechtigkeit und Nachhaltigkeit—Koalitionsvertrag 2021–2025. Available online: https://www.spd.de/fileadmin/Dokumente/Koalitionsvertrag/Koalitionsvertrag_2021-2025.pdf (accessed on 19 October 2023).
Figure 1.
Methodology to determine the impact of PV self-consumption optimization on the energy system, split in user and systemic perspective.
Figure 1.
Methodology to determine the impact of PV self-consumption optimization on the energy system, split in user and systemic perspective.

Figure 2.
Schematic representation of eFlame, displaying all possible elements. The dark blue elements are used in this paper.
Figure 2.
Schematic representation of eFlame, displaying all possible elements. The dark blue elements are used in this paper.

Figure 3.
Model landscape with their interconnections, as well as generation and sector coupling technologies in ISAaR.
Figure 3.
Model landscape with their interconnections, as well as generation and sector coupling technologies in ISAaR.

Figure 4.
Statistical shares compared to the shares of 25 combinations (see Table A1 in the Appendix A, all combinations under consideration of the excluding statements) and seven combinations (see Table 2, the result of the further reduction of the combinations by the optimization program).
Figure 4.
Statistical shares compared to the shares of 25 combinations (see Table A1 in the Appendix A, all combinations under consideration of the excluding statements) and seven combinations (see Table 2, the result of the further reduction of the combinations by the optimization program).

Figure 5.
Electrical household demand of an average day for each persona.

Figure 6.
(Dis-)charging power of an average week for persona 3. The week starts on Sunday (1) and ends on Saturday (7).
Figure 6.
(Dis-)charging power of an average week for persona 3. The week starts on Sunday (1) and ends on Saturday (7).

Figure 7.
Yearly revenue ranges for each persona. Yellow bars represent smart unidirectional charging, and grey bars smart bidirectional charging.
Figure 7.
Yearly revenue ranges for each persona. Yellow bars represent smart unidirectional charging, and grey bars smart bidirectional charging.

Figure 8.
Profit ranges for each persona. Red bars represents negative profit for bidirectional charging. Yellow bars represents the positive revenues for smart unidirectional charging, grey bars the positive revenues for smart bidirectional charging.
Figure 8.
Profit ranges for each persona. Red bars represents negative profit for bidirectional charging. Yellow bars represents the positive revenues for smart unidirectional charging, grey bars the positive revenues for smart bidirectional charging.

Figure 9.
Modified demand profile of the EV demand in Germany: (a) Annual duration curve. (b) Average day.
Figure 9.
Modified demand profile of the EV demand in Germany: (a) Annual duration curve. (b) Average day.

Figure 10.
Average market values (all RES) for different times of the day. Night(1) represents 0 a.m. to 3 a.m., morning 4 a.m. to 7 a.m., daytime 8 a.m. to 3 p.m., evening 4 p.m. to 8 p.m., and night(2) 9 p.m. to 11 p.m.
Figure 10.
Average market values (all RES) for different times of the day. Night(1) represents 0 a.m. to 3 a.m., morning 4 a.m. to 7 a.m., daytime 8 a.m. to 3 p.m., evening 4 p.m. to 8 p.m., and night(2) 9 p.m. to 11 p.m.

Table 1.
All categories and their respective features, IDs, values, and shares. The numerical values are based on [30,31,32,33,34].
| Category | Feature | ID | Value | Share |
|---|---|---|---|---|
| EV | Small | EV1 | 47.5 kWh and 17.1 kWh/100 km | 27% |
| EV | Medium | EV2 | 80 kW and 20.5 kWh/100 km | 40% |
| EV | Large | EV3 | 120 kWh and 28.1 kWh/100 km | 33% |
| Household | Small | HH1 | 1623 kWh/a | 42% |
| Household | Medium | HH2 | 2731 kWh/a | 33% |
| Household | Large | HH3 | 4394 kWh/a | 25% |
| PV | Small | PV1 | 3.9 kWp | 33% |
| PV | Medium | PV2 | 7 kWp | 33% |
| PV | Large | PV3 | 11 kWp | 33% |
| User group | Group 1 | UG1 | Full-time, low driver, childless | 16% |
| User group | Group 2 | UG2 | Full-time, frequent driver, childless | 16% |
| User group | Group 3 | UG3 | Full-time, frequent driver, with children | 11% |
| User group | Group 4 | UG4 | Part-time, frequent driver, childless | 11% |
| User group | Group 5 | UG5 | Part-time, frequent driver, with children | 11% |
| User group | Group 6 | UG6 | Unemployed, low driver, childless | 26% |
| User group | Group 7 | UG7 | Unemployed, frequent driver, childless | 11% |
Table 2.
Resulting combinations and their respective features for the categories EV, household, PV, and user group. Shares represent the shares of the personas to reflect Germany.
Table 2.
Resulting combinations and their respective features for the categories EV, household, PV, and user group. Shares represent the shares of the personas to reflect Germany.
| ID | EV | Household | PV | User Group | Share |
|---|---|---|---|---|---|
| 1 | EV1 | HH1 | PV1 | UG6 | 26% |
| 2 | EV2 | HH1 | PV1 | UG2 | 14% |
| 3 | EV2 | HH2 | PV2 | UG7 | 11% |
| 4 | EV2 | HH3 | PV3 | UG5 | 15% |
| 5 | EV3 | HH2 | PV2 | UG1 | 14% |
| 6 | EV3 | HH2 | PV2 | UG4 | 9% |
| 7 | EV3 | HH3 | PV3 | UG3 | 12% |
Table 3.
Simulation parameters for the calculation of the revenues. The numerical values are based on [23,31,33] and the consultation process in the project unIT-e2.
| Component | Parameter | Value |
|---|---|---|
| EV+ EVSE | Type of vehicle | Depending on the persona (see Table 1) |
| EV+ EVSE | Battery capacity | Depending on the persona (see Table 1) |
| EV+ EVSE | Charging power | 11 kW |
| EV+ EVSE | SOC safety | 30% |
| EV+ EVSE | SOC departure | 60% |
| EV+ EVSE | Plug-in probability | 100% |
| EV+ EVSE | Efficiency | Variable plus const loss and standby loss |
| EV+ EVSE | Driving profiles | Generated by the EV profile generator (see Section 2.2, [23]) |
| PV | Power | Depending on the persona (see Table 1) |
| PV | Generation profile | Based on CAMS data [36] |
| Household | Yearly demand | Depending on the persona (see Table 1) |
| Household | Demand profile | Generated by the household demand generator (see Section 2.2, [23]) |
| Prices | Feed-in tariff | Depending on PV size and option |
| Prices | Household electricity price | 30 ct/kWh |
Disclaimer/Publisher’s Note: The statements, opinions and data contained in all publications are solely those of the individual author(s) and contributor(s) and not of MDPI and/or the editor(s). MDPI and/or the editor(s) disclaim responsibility for any injury to people or property resulting from any ideas, methods, instructions or products referred to in the content. |
© 2024 by the authors. Licensee MDPI, Basel, Switzerland. This article is an open access article distributed under the terms and conditions of the Creative Commons Attribution (CC BY) license (https://creativecommons.org/licenses/by/4.0/).
Share and Cite
MDPI and ACS Style
Ganz, K.; Kern, T.; Hinterstocker, M. Systemic Evaluation of PV Self-Consumption Optimization Using Electric Vehicles. World Electr. Veh. J. 2024, 15, 98. https://doi.org/10.3390/wevj15030098
AMA Style
Ganz K, Kern T, Hinterstocker M. Systemic Evaluation of PV Self-Consumption Optimization Using Electric Vehicles. World Electric Vehicle Journal. 2024; 15(3):98. https://doi.org/10.3390/wevj15030098
Chicago/Turabian StyleGanz, Kirstin, Timo Kern, and Michael Hinterstocker. 2024. "Systemic Evaluation of PV Self-Consumption Optimization Using Electric Vehicles" World Electric Vehicle Journal 15, no. 3: 98. https://doi.org/10.3390/wevj15030098