
Inhibitors of Battery Electric Vehicle Adoption in Morocco
by
 , ,
, ,
Dalal Nasreddin
1, 
Hamza El Hafdaoui
1,2,*,
Faissal Jelti
3,
Aya Boumelha
1 and
Ahmed Khallaayoun
1 1
School of Science and Engineering, Al Akhawayn University, Ifrane 53000, Morocco
2
National School of Applied Sciences, Sidi Mohamed Ben Abdellah University, Fez 30000, Morocco
3
Higher School of Technology, Moulay Ismail University, Meknes 50000, Morocco
*
Author to whom correspondence should be addressed.
World Electr. Veh. J. 2024, 15(1), 6; https://doi.org/10.3390/wevj15010006
Submission received: 21 November 2023
/
Revised: 13 December 2023
/
Accepted: 19 December 2023
/
Published: 22 December 2023
Abstract
:The transport sector is one of the main contributors to global CO2 emissions and the transport sector in the Kingdom of Morocco is no exception. To combat this, two important agreements aimed at reducing greenhouse gas emissions were created, the Paris Agreement and the Nationally Determined Contributions. The adoption of battery electric vehicles is one way of helping to reduce transport-related emissions. However, there are several barriers to the adoption of battery electric vehicles in Morocco. The objective of this paper is to identify these barriers and to propose solutions to overcome them based on a survey of 209 responses that were analyzed using the Smart-PLS 4 approach. The study found that the financial attributes, maintenance, design, social reinforcement, and lack of incentives related to battery electric vehicles are the most significant factors that could cause the hindrance of the adoption of battery electric vehicles. Therefore, more affordable and attractive battery electric vehicles should be made more accessible. Moreover, increased technical training facilities should be mobilized to boost further efforts and increase experience in the field of BEV maintenance in Morocco. By implementing these solutions, Morocco can increase the uptake of battery electric vehicles and reduce its greenhouse gas emissions. This will help Morocco reach its Nationally Determined Contributions and protect the environment as well as the health of its population.
1. Introduction
1.1. Background
The Earth’s atmosphere currently holds carbon dioxide concentrations of approximately 424.47 parts per million [1]. Carbon dioxide is the most abundant greenhouse gas in the atmosphere and is responsible for 66% of the rising temperatures on the planet [2]. This concentration of carbon dioxide is the highest ever recorded in history and continues to rise despite the decrease in 2022 due to the COVID-19 pandemic. The planet is in a climate emergency with temperatures, sea levels, and air pollution on the rise, leading to animals becoming extinct, cities submerging underwater, and people dying. In total, 99% of the world’s population in 2019 was exposed to levels of air pollution that are higher than the limits set by the World Health Organization [3]. This led to 4.2 million deaths that year [3]. Cleaner or greener modes of transportation such as battery electric vehicles (BEVs) can help in greatly reducing the amount of carbon dioxide emissions in the atmosphere.
To mitigate climate change, the Paris Agreement was adopted in 2015 at the United Nations Climate Change Conference (COP21) [4]. This agreement asks countries to report on Nationally Determined Contributions (NDCs) to mitigate climate change and lower greenhouse gas emissions. These NDCs help countries set up a long-term plan for their sustainability goals. Not only would countries be able to set up their goals, but they would also be able to keep track of their progress every year, ensuring that they reach them.
Likewise, the United Nations put together a total of 17 Sustainable Development Goals (SDGs) in 2015 to protect the planet [5]. Many of these goals have a strong relation to climate change. These goals are as follows:
- SDG 3: to establish and ensure good health and well-being.
- SDG 7: to provide and ensure access to affordable and clean energy.
- SDG 11: to organize sustainable communities and cities.
- SDG 13: to combat climate change and its impacts on the planet.
The United Nation’s objective is to reach the 17 SDGs by 2030 worldwide. Although this objective seems very hopeful, it is necessary to have a strategy set up to help countries act. Consequently, it can be determined that sustainability and clean energy are a top priority and are an agenda that is being pushed by most of the world today.
1.2. Worldwide CO2 Emissions: Transportation Sector
The transportation sector is responsible for a large share of the global CO2 emissions. In 2022, this sector was responsible for approximately 20% of the global CO2 emissions [6]. To put it in the context of this topic, Figure 1 shows the worldwide emissions in 2021 by transportation subsector. Passenger cars are responsible for 48% of the total CO2 emissions caused by the transportation system [7].
Due to the large contribution that the transportation sector has to greenhouse gas emissions, a plan for net zero transport has been developed. To be net zero means that there must be a decrease in the emissions of greenhouse gases to as close to zero as possible while also removing any existing emissions from the atmosphere [8]. Moreover, the International Transport Forum, an intergovernmental organization that is linked to the Organization for Economic Co-operation and Development (OECD), established the Decarbonizing Transport initiative [9]. This initiative aims to promote carbon-neutral transport while supporting countries in reaching this goal by providing them with tools to create targets and track progress. The forum also shares evidence with governments and industries regarding the best practices that will guide them toward carbon-neutral mobility.
Since passenger vehicles are responsible for such a large part of emissions, there is a niche in the market ready to be expanded. Although new technology is usually associated with uncertainty and risk, it has been well established that battery electric vehicles are an environmentally friendly mode of transportation that help the climate by decreasing CO2 emissions [10]. This signifies that encouraging the use of BEVs would be greatly beneficial to the planet. Understandably, the more a battery electric vehicle relies on electricity produced by renewables, the less emissions it will be responsible for in its life cycle. This is because its well-to-tank emissions would decrease. Yet, even if the energy mix of a country does not heavily rely on renewables, a BEV would still have a lower carbon footprint in its life cycle than a diesel vehicle would [11].
Although increasing the adoption of battery electric vehicles in developing countries may lead to benefits such as improving the public’s health and reducing air pollution, this increase is not always feasible [12]. The high price of BEVs proves to be an inhibitor within developing countries [13]. Developing countries such as Ethiopia, Kenya, and Nepal generate over 80% of their electricity using renewable energies, creating a clean supply to charge BEVs [14]. Nevertheless, many developing countries within Africa frequently have unstable electricity supplies and often face power outages that could last for days; hence, the increased load that BEVs would place on the grid would be an issue [15,16]. Furthermore, some developing countries, such as the Kingdom of Morocco, are making great strides toward building an infrastructure capable of supporting BEVs on a large scale [17,18].
1.3. An Overview of Morocco’s Automotive Industry
Morocco’s automotive industry has been experiencing significant growth and development. In 2021, the automotive industry in Morocco was valued at USD 4 billion and is expected to reach USD 5.5 billion by 2027 [19]. Moreover, the country can leverage its access to the European automotive market to attract more car producers and suppliers. Morocco’s ambition is to reach the highest level of competitiveness in this industry while opting for renewable energies as an energy source and expanding the local integration rate to 80% [20].
The Moroccan government has been making efforts, such as giving foreign investors access to the economy, to promote the automotive supplier industry. It also continues to encourage middle-income countries to adopt sustainable and responsible automotive production [21].
In the context of BEVs, Morocco has made strategic moves to position itself as a key player in this market. The country has a capacity to produce over 700,000 vehicles per year. This capacity places it at the top of vehicle manufacturing in North Africa. Citroën and Opel make Morocco the first country in North Africa to produce a 100% electric vehicle. This provides Morocco and its European partners a gain over China as well as a first-move advantage in the expanding car markets of North Africa [22].
Other automobile brands such as Stellantis, Citroën, Opel, and Renault also assemble and produce BEVs in Morocco [23]. The production of these cars nationally hopes to lower the costs of purchasing a BEV, making it more affordable to the population. BEVs can be expensive in Morocco with the BMW i4 possessing a starting price of MAD 815,000 and the Audi e-tron possessing a starting price of MAD 1,050,000 [24]. On the other hand, Dacia offers a BEV, the Dacia Spring, with the starting price of MAD 223,500, making it somewhat more affordable [25]. As of 2023, Morocco has a production capacity of 40,000 BEVs per year. It is aiming to increase this capacity to 100,000 per year by 2025 [26].
When looking at the total number of registered vehicles in Morocco in 2023, only 0.04% are battery electric vehicles. A total of 0.19% are hybrid electric vehicles and 99.77% are conventional vehicles [15]. According to El Hafdaoui [15], the availability of choices for BEVs and hybrid electric vehicles in the context of Morocco when compared to the availability of conventional vehicles is very limited. Moreover, the average cost of purchase for alternative fuel vehicles is also much higher than the average cost of conventional vehicles. From this information, it can be determined that the electric vehicle market is currently at a very early stage of development in Morocco.
1.4. Understanding the Barriers to BEV Adoption in Morocco
Understanding the barriers to BEV adoption in Morocco is crucial for the country’s transition to sustainable transportation. Several studies and reports highlight the significance of identifying these barriers. For instance, a project sponsored by the International University of Rabat developed a survey to predict consumer behavior and to identify the barriers to BEV adoption in Morocco [27]. Additionally, a report by the World Bank emphasizes the economic benefits of wider adoption of battery electric vehicles in developing countries, including Morocco, and discusses the worries about high upfront costs as a significant barrier to BEV adoption [12]. Furthermore, a study on the integration of renewable energies in Morocco addresses the impact that barriers could have for achieving renewable energy objectives [28].
Understanding these barriers is essential for policymakers, researchers, and industry stakeholders to develop targeted strategies and policies to overcome them. By doing so, Morocco can accelerate the adoption of battery electric vehicles, reduce greenhouse gas emissions, improve public health, and decrease dependence on expensive imported fossil fuels [29,30,31]. Moreover, understanding the barriers can provide a foundation for informed decision making and the development of tailored interventions to promote the widespread adoption of battery electric vehicles in the country.
2. Literature Review and Contribution
2.1. Literature Review on BEV Adoption in Various Countries and Regions
Based on the existing literature, the adoption of BEVs is influenced by various factors. The barriers to widespread adoption of BEVs included in 239 different articles relating to this topic have political, economic, social, and socio-demographic determinants [32,33]. Some common challenges identified in this literature include insufficient charging stations, infrastructure challenges, heat-related battery challenges, range anxiety, and consumer attitudes [34]. The enablers to overcome these barriers were found to be governmental support through regulation, research and development, the establishment of facilities for investors, as well as the availability of public BEV charging stations [34]. It is also important to address consumer concerns and perceptions to encourage greater adoption of BEVs based on a study conducted in the United Kingdom [35].
Furthermore, a study conducted in Qatar identified challenges such as a lack of the number of charging stations, heat-related battery challenges, and consumer attitudes as barriers to the adoption of BEVs in the country [33]. Furthermore, a Swiss study delved into marketing strategies that would increase the adoption of BEVs. It found that if BEVs were sold in a bundle with charging services, individuals were more likely to purchase them [36]. This gives significance to range anxiety and ready availability of charging stations.
Overall, the literature review on BEV adoption in various countries and regions emphasizes the need for a holistic approach to understand the multifaceted determinants affecting consumer adoption of BEVs.
2.2. The Common Barriers to the Adoption of BEVs
BEVs offer several benefits over gasoline-powered vehicles, including zero tailpipe emissions, lower operating costs, and quieter operation. However, there are also several common barriers to BEV adoption. Some of these common barriers include but are not limited to
- Infrastructure-related issues: The availability, positioning, and speed of charging stations are significant barriers to BEV adoption. The lack of reliable public charging options and the disparity between the number of BEVs and the number of public charging stations contribute to the challenge of addressing range anxiety and increasing BEV ownership [15,38,39]. Moreover, the ability to retrofit existing infrastructure to support BEVs also poses an issue [33].
- High upfront costs: The upfront purchase cost of BEVs is a barrier to adoption. The cost of purchasing a BEV, especially compared to internal combustion engine vehicles, remains a concern for many potential buyers [15].
Overcoming these barriers is crucial for accelerating the transition to greener ways of transportation and achieving widespread BEV adoption.
2.3. Focus on the Key Challenges and Opportunities for the Adoption of BEVs in Morocco
Morocco is one of the many countries that will experience the impact of global warming and the impact of large CO2 emissions in the atmosphere. The country has been experiencing heat waves, draughts, and changes in rainfall patterns due to the rising temperatures on the planet [40]. It is expected that these situations will only deteriorate in the coming years if no preventive actions are put in place. The changes in weather patterns negatively impact the agricultural sector, in turn negatively impacting the Moroccan economy. Additionally, in 2019, approximately 19,303 people died due to illnesses related to ambient air pollution in Morocco [3].
To combat these growing issues, Morocco created a document for its first Nationally Determined Contribution (NDC) for the year 2030. This document is comprised of goals to decrease the country’s carbon footprint and to ensure the sustainability of the environment and ecosystems while combating global warming [41]. The NDC is designed to help achieve Sustainable Development Goals 1, 3, 6, 7, 8, 9, 11, 12, 13, and 17, of which SDGs 3, 7, 11, and 13 are related to global warming and climate change.
Figure 2 gives an illustration of the energy mix of Morocco. In 2015, 34% of the installed capacity in Morocco was achieved using renewable energy sources while in 2020, the number increased to 42%. The goal for 2030 is to achieve 52% of installed capacity using renewable energy sources. The higher the share of renewables in the energy mix, the lower the well-to-wheel emissions, making this energy mix extremely beneficial for charging battery electric vehicles [15,24].
The transport sector in Morocco is responsible for 23% of CO2 emissions [42]. Due to this reason, there is a priority to develop sustainable transportation in the country. For there to be a successful adoption of BEVs, the grid must be capable of dealing with the increased demand. Therefore, the Moroccan government has infrastructure reinforcement as a top agenda. Table 1 shows the reinforcements planned and completed for the years 2019 and 2020. Although this is not enough and the grid needs further adjustments and reinforcements, Morocco is considered successful in taking steps forward toward its goals. Morocco has reached almost 100% rural electrification. It is providing affordable electricity and has been growing its supply of power generation as well as increasing its capacity [43].
Moreover, to support the transition to battery electric vehicles, Morocco plans to open 2500 charging stations by 2026 [44]; this would greatly help with decreasing range anxiety in customers interested in owning BEVs. In 2017, Morocco put an incentive in place for owners of hybrid and battery electric vehicles, making them exempt from paying the annual circulation tax [45]. Nonetheless, Morocco must increase incentives and subsidies related to BEVs.
2.4. Paper Contribution
Following the literature review, conducted and presented in Section 2.1 and Section 2.2, regarding the inhibitors of the adoption of BEVs, a research gap was uncovered. There was no study existing that used structural equation modelling to uncover the inhibitors of the adoption of BEVs in Morocco from the population’s perspective. The only case study found related to this specific topic is Chachdi et al.’s [46]. Although this study explored possible demotivators for the adoption of BEVs in Morocco, it lacked important factors in the study such as the availability of BEV maintenance and the possible lack of knowledge regarding BEVs among the Moroccan population. Moreover, the Factor Correlation Analysis method was used in this study. This method is limited as it can only find associations, or relationships, between two variables within a sample at once. And so, it could not conduct a thorough analysis for a whole model. It does not consider measurement error and cannot find more complex and indirect relationships between more than two variables, therefore lacking the ability to analyze the model as a whole. In addition, it lacks the ability to analyze the model fit using statistical tests to determine the validity of the given model.
Therefore, a more detailed and inclusive analysis with more detailed questions and factors needed to be conducted in Morocco to gather more data about the inhibitors of the increased adoption of BEVs in Morocco. It is also needed as it is important to test the population’s attitude toward BEVs and the implications of their attitude on the adoption of BEVs comprehensively. Moreover, more suitable software had to be used in order to analyze the relationship between multiple variables at once.
3. Materials and Methods
This paper used a mixed method of research as it used a questionnaire to collect both qualitative and quantitative data for the analysis. It also used social science statistics to analyze the intentions of the respondents. In addition, a research-based method was used to find research papers with similar methods of analyses that could be used as a guide for this study and as comparisons mentioned later in Section 4.3. The methods and procedures used to create the questionnaire, collect the data, and analyze it will be detailed in this section of the paper.
The methodology includes the data collection process as well as the analysis process used in this paper. It also includes the limitations of the research. Figure 3 below presents the outline of the research methodology.
3.1. Conceptual Framework
It is important to be clear and precise about the scope and objectives in order to achieve satisfactory answers to the research questions. Therefore, in this section, the research questions will be outlined, together with the research hypotheses and the proposed research model that will be the basis of this study.
3.1.1. Motivation
Morocco’s interest in BEVs is growing. The potential for BEVs in Morocco is significant, making it a topic worth exploring. In addition, there has been no research on this topic in Morocco using structural equation modelling.
3.1.2. Research Scope
This research paper has specific boundaries, which are listed below. These boundaries were put in place to give the study clearer and narrowed down objectives.
- (i)
- The study strictly analyzes data regarding battery electric vehicles and does not include electric scooters, buses, bikes, hybrid electric vehicles, or plug-in hybrid electric vehicles.
- (ii)
- The study targets individuals who reside in Morocco and does not include any individuals residing in any other country.
3.1.3. Research Questions
To better understand what questions the study will answer, the following research questions are outlined:
- (i)
- What are the constructs that inhibit or discourage the increased adoption of battery electric vehicles in Morocco?
- (ii)
- What are the constructs that encourage the adoption of battery electric vehicles in the country?
- (iii)
- Are there any misconceptions or lack of knowledge within the topic of battery electric vehicles in the country?
3.1.4. Research Objectives
Having clear objectives for the paper is also important. Having objectives helps draw clearer conclusions. They also make the selection of a more suitable research methodology easier as well as the selection of appropriate analysis methods. The research objectives for this paper are the following:
- (i)
- To assess the knowledge and intentions of individuals residing within Morocco regarding BEVs and their adoption.
- (ii)
- To determine both the constructs that encourage and inhibit the adoption of BEVs in Morocco.
- (iii)
- To evaluate the relationship between constructs related to the adoption of BEVs in Morocco using structural equation modelling.
3.1.5. Hypotheses
Following the comprehensive research conducted, a total of 18 hypotheses were drawn. These hypotheses were drawn to set guidelines for the research and predict and discover the relationships between the constructs in this study. The hypotheses for this research are the following:
Hypothesis 1.
Age will have a significant association and a negative relationship with social reinforcement.
The younger a person is, the more they care about what is considered as hip and what would make them look good to society. However, the older an individual gets, the less they would care about social approval. Therefore, it is assumed that the older a person gets, the less likely they are to care about the impact a BEV would have on their social image. On the other hand, it could also be assumed that the older an individual gets, the more likely they would believe that driving a BEV would positively impact their social image as they themselves believe that caring for the environment would be perceived positively by society.
Hypothesis 2.
Age will have a significant association and a positive relationship with the Willingness to Adopt a Battery Electric Vehicle.
It can be assumed that the younger an individual is, the more likely it would be for them to focus on their savings. Lower incomes are also related to younger age as when an individual starts their career, they would almost always start with a lower income. Additionally, it can be assumed that the younger an individual is, the more tech-savvy they are, making them more knowledgeable about the latest technologies and more interested in adopting them.
Hypothesis 3.
Autonomy will have a significant association and a negative relationship with the Willingness to Adopt a Battery Electric Vehicle.
Autonomy can be considered one of the most important components of BEVs. It would make sense that the range of a vehicle would be considered when choosing a vehicle. No individual would want a vehicle that would de-charge frequently. And so, it is hypothesized that the more a person cares about the autonomy of a vehicle, the less likely they would be to adopt a BEV, hence causing a negative relationship between autonomy and the Willingness to Adopt BEVs.
Hypothesis 4.
The Behavioral Factor will have a significant association and a negative relationship with the Willingness to Adopt a Battery Electric Vehicle.
The Behavioral Factor in this case is how often an individual drives per week. It is assumed that the more an individual would drive, the less they would want to worry about charging their vehicles. Moreover, if they had a BEV, they would have to worry about travelling to areas that are near charging stations. This would limit their range. Therefore, it is hypothesized that the more an individual drives, the less they would be willing to purchase a BEV, leading to a negative relationship between the Behavioral Factor and the Willingness to Adopt a BEV.
Hypothesis 5.
Design will have a significant association and a negative relationship with the Willingness to Adopt a Battery Electric Vehicle.
An aspect that is often overlooked when asking individuals about whether they would adopt BEVs is the design and style of a vehicle. This includes the maximum speed and overall look of a vehicle as well as safety features. It is assumed that the more the design of a vehicle affects a person’s purchase decisions, the less likely they would be to purchase a BEV.
Hypothesis 6.
Education will have a significant association and a positive relationship with Environmental Concern 1.
For this study, it is hypothesized that education will have a significant association with Environmental Concern 1, thus having an indirect effect on the willingness to purchase a BEV. EC1 is related to how important the sustainability of the environment and ecosystems is to individuals. The hypothesis is that the more educated an individual is, the more knowledge they will have about the issue of environmental sustainability and the more they will consider it an important topic.
Hypothesis 7.
Education will have a significant association and a positive relationship with Environmental Concern 2.
Similarly to Hypothesis 6, Hypothesis 7 states that the more educated an individual is, the more educated they will be about the technologies of BEVs and their impact on the environment. Environmental Concern 2 involves whether individuals believe BEVs positively impact the environment. Thus, individuals with higher education levels are more likely to believe that BEVs will have a positive impact on the environment.
Hypothesis 8.
Education will have a significant association and a positive relationship with the Willingness to Adopt a Battery Electric Vehicle.
It is assumed that the more educated an individual is, the more open-minded and well versed they are in subjects related to sustainability and global warming. Therefore, it is hypothesized that the more educated an individual is, the more they would be willing to adopt a BEV.
Hypothesis 9.
Environmental Concern 1 will have a significant association and a positive relationship with the Willingness to Adopt a Battery Electric Vehicle.
Environmental Concern 1 is related to how important the sustainability of the environment is to individuals. If an individual is concerned for the environment, it can be assumed that they are aware of the issues that are happening within the topic of global warming and environmental sustainability. Since these individuals are concerned for the environment, it can be deduced that they would be inclined to try and help solve the issues. Individuals who have a concern for the environment prefer BEVs [27]. Thus, it is hypothesized that the more concerned an individual is about the sustainability of the environment, the more likely they are to adopt a BEV.
Hypothesis 10.
Environmental Concern 2 will have a significant association and a positive relationship with the Willingness to Adopt a Battery Electric Vehicle.
Environmental Concern 2 is related to whether an individual believes that battery electric vehicles positively impact the environment. The hypothesis states that if an individual believes that a BEV positively impacts the environment, they are more willing to adopt it. And if an individual believes that a BEV does not positively impact the environment, they are less willing to adopt it.
Hypothesis 11.
Financial attributes will have a significant association and a positive relationship with the Willingness to Adopt a Battery Electric Vehicle.
Price will always be an important factor to consider when deciding to purchase an item. It is especially important in this study as it could have a large effect on purchasing a BEV. Therefore, price is a critical factor for BEVs [12]. In this case, the financial attributes include how much an individual is willing to pay for a BEV and whether they believe owning a BEV would save them money. The hypothesis states that the higher a person is willing to pay for the BEV, the more likely they are to adopt a BEV. Moreover, the more an individual believes owning a BEV will save them money, the more likely they are to adopt it.
Hypothesis 12.
Gender will have a significant association and a negative relationship with the Behavioral Factor.
According to a study performed in the United States, women drive less than men [46]. In the case of this hypothesis, the Behavioral Factor in question is how often individuals drive. It would be helpful to know which gender drives more frequently and find out whether that would have an impact on the Willingness to Adopt a BEV. For this analysis, males were assigned the digit 0 and women were assigned the digit 1. Therefore, if the relationship between gender and the Behavioral Factor is negative, it would mean that men drive more frequently than women. If it is positive, it would mean that women drive more frequently than men. Hypothesis 12 theorizes that men drive more frequently than women in Morocco.
Hypothesis 13.
Gender will have a significant association and a negative relationship with the Willingness to Adopt a Battery Electric Vehicle.
Men are more likely to purchase battery electric vehicles when compared to women [47]. There is a tangible gender gap when it comes to the ownership and purchasing of BEVs. However, there is a lack of information regarding this phenomenon in Morocco. Hypothesis 13 states that there will be a significant association between these constructs and that women will be less likely to adopt BEVs.
Hypothesis 14.
Incentive 1 will have a significant association and a positive relationship with the Willingness to Adopt a Battery Electric Vehicle.
Incentive 1 enquires about whether individuals are aware of any governmental incentives available for battery electric vehicles in Morocco. It is assumed that the more an individual is aware of benefits related to owning a BEV, i.e., subsidies and incentives, the more likely they are to adopt a BEV.
Hypothesis 15.
Incentive 2 will have a significant association and a negative relationship with the Willingness to Adopt a Battery Electric Vehicle.
Incentive 2 enquires about whether individuals believe that there should be more governmental support in the form of incentives for BEVs. In several countries, it was found that financial incentives were no longer making a large impact in the encouragement of the purchase of battery electric vehicles [33]. However, it is still widely believed that governments should still offer incentives for owning environmentally friendly technology. This hypothesis states that the more individuals believe the government needs to increase support in the form of subsidies and incentives, the less willing they will be to adopt BEVs.
Hypothesis 16.
Income will have a significant association and a positive relationship with the Willingness to Adopt a Battery Electric Vehicle.
The upper class spends more money than the lower class do since they have higher incomes [34]. For Hypothesis 16, it is assumed that there will be significant association between income and the Willingness to Adopt a BEV. The relationship is also assumed to be positive since the higher the income, the more the will increases to purchase a BEV.
Hypothesis 17.
Maintenance will have a significant association and a positive relationship with the Willingness to Adopt a Battery Electric Vehicle.
Maintenance is an extremely important factor when considering purchasing battery electric vehicles. In this case, it is assumed that the more an individual believes that the BEV can easily be maintained in Morocco, the more likely they are to adopt it.
Hypothesis 18.
Social reinforcement will have a significant association and a positive relationship with the Willingness to Adopt a Battery Electric Vehicle.
According to a previous paper based on a study conducted in the United Kingdom, it was found that social reinforcement had an impact on the customers’ intention to purchase BEVs [35]. It is also a well-known phenomenon that people often consider their family and friends’ opinions when purchasing items and making decisions. Whether or not an item is socially acceptable and whether a purchase would be praised by society will also have an impact on individuals’ decisions [48]. Therefore, it is hypothesized that in this model, social reinforcement will have a significant association with whether an individual is willing to purchase or adopt a BEV or not.
To sum up the hypotheses, Figure 4 offers an illustration for the proposed research model for this study. There are a total of 15 constructs, or latent variables, in this model and 18 hypotheses.
3.2. Data Collection
3.2.1. Instruments and Measures
To collect the data necessary to run the analysis, a questionnaire was created to collect information about the socio-demographics of the respondents as well as to gather data regarding BEVs in Morocco. A combination of convenience sampling and snowball sampling, both non-probability sampling techniques, was used in this study. Convenience sampling is a common method, which proves to be easy to use, efficient, inexpensive, and convenient. The sample is chosen based on the respondents’ availabilities as well as their willingness to respond to the questionnaire [49]. Snowball sampling is also a popular and commonly used method, especially in qualitative studies [50]. This method relies on respondents forwarding the questionnaire to more individuals and sharing it with random individuals, which they may encounter in places such as at work or on the street. This method has its advantages as it ensures the sample data will increase in number and in diversity.
When building the questionnaire, a five-point Likert scale was used for most of the questions as it gives the respondents the ability to choose between a range, or degree of opinions [51]. Using the Likert scale also makes it easy for the respondents to complete the questionnaire as it would take them a small amount of effort to choose the responses. Questionnaires longer than 15–20 questions have a lower rate of completion since people’s attention spans have become shorter, making it harder for them to complete them [51]. Furthermore, responses to all questions were required before the questionnaire could be submitted to ensure that respondents answered all questions.
Google Forms was used to create the 18-question online questionnaire. The questionnaire was offered in two languages, English and French. Since this study was conducted at Al Akhawayn University, which has a curriculum based on the American system, the questionnaire was first created and offered in English. The second language it was offered in was French since it is often used in business and education in Morocco. Morocco was colonized by France from 1912 to 1955, engraining the French language into the Moroccan system [52]. In this case, due to its position as the second unofficial language in Morocco, it was included as an option in the questionnaire.
The instrument of the analysis that was used for this research was Smart-PLS 4. The software was also used to run the validity and reliability analyses for the data. Moreover, it was used to test the hypotheses by using the structural equation modelling and Bootstrapping algorithms.
3.2.2. Participants
It is important to calculate the minimum sample size. Two methods were used to find the minimum sample size for greater reliability. The first method is a calculation, which states that the minimum sample size should be more than or equal to 10 times the total number of direct paths from the constructs to the target construct [53]. In this case, the target construct is the Willingness to Adopt an EV and the total direct paths to the target construct are 14. Therefore, the minimum sample size according to the first method is 140 respondents. The second method relied on published research, which states that as a rule of thumb, the minimum sample data can be between 200 and 300 respondents. The sample size for this research after cleaning the data was 209 respondents. Therefore, it satisfies the minimum sample size as it is larger than 140 respondents while also being between 200 and 300 respondents.
3.2.3. Procedures
To remain ethical and to respect the privacy of individuals, the questionnaire did not include people younger than the age of 18. Moreover, it did not ask individuals for any contact information nor for their first and last names to ensure they remain anonymous.
Prior to beginning the analysis of the collected data, it is important to clean it. This is to avoid any responses from negatively impacting the study. Once all the responses were collected, answers that go beyond the limitations of the study were removed. For example, certain individuals responded by choosing cities that were not in Morocco as their places of residence. This was beyond the scope of the study as the purpose of the study is to examine the population of Morocco. Therefore, 5 respondents were removed from the data and the total number of respondents decreased from 214 to 209.
Following the collection and cleaning of the data, Excel was used to create graphical and visual representations to interpret the results collected from the questionnaire for the first part of the analysis.
Next, the software was chosen to run the structural equation modelling. As some of the data collected are categorical data, meaning they are non-numerical data, they cannot be run through the regression analysis tool in Excel. Although a dummy variable could have been used to translate the qualitative data into quantitative data, there were far too many dummy variables, making it too complex for the Excel regression tool to give precise results. It was therefore verified that Microsoft Excel would not be a fit choice as software used to run the analysis of the data. Due to these reasons, the Smart-PLS 4 software was chosen.
3.2.4. Limitations of the Data Collection Procedure
While using the Smart-PLS 4 software, a limitation was uncovered due to the data collection procedure. As the questionnaire was created prior to the selection of the analysis software, the questions were not written in the format that the software uses. For example, all the questions had to be in the same five-point Likert scale. However, they were not. Instead, some questions were binary. This created a limitation in this study.
3.2.5. Smart-PLS 4 Methods and Procedures
As concluded in Section 3.2.3, linear regression cannot fully show the direct as well as the indirect correlations between the independent variables, hence the use of structural equation modelling. Consequently, this section will explain the methods and procedures of choosing and using the Smart-PLS 4 program.
Prior to deciding on the software to be used for the analysis in this paper, multiple software was considered. Software that can be used for structural equation modelling is IBM SPSS Amos, R Open Mx, and Smart-PLS 4. Although all three software options are powerful and useful for structural equation modelling, Smart-PLS 4 was the most user-friendly, so it was chosen to conduct this study.
Structural equation modelling (SEM) is a complex method widely used to analyze relationships between observed variables (indicators) and latent constructs [54]. Latent constructs are factors that cannot be observed nor measured directly. This method has several advantages as it combines a multiple regression analysis and factor analysis, allowing the model to run multiple independent variables and dependent variables, examining multiple direct and indirect relationships at once. It also uses a path analysis and includes measurement error, which are associated with latent variables that a normal regression analysis does not include. SEM is an extremely popular and effective method mostly used in social sciences as they usually contain many latent variables.
The Smart-PLS 4 software offers several different algorithms for structural equation modelling that can be used for a data analysis. Two of these algorithms will be used in this paper. The first algorithm used in this paper is the Partial Least Square Structural Equation Modelling (PLS-SEM) algorithm. The PLS-SEM algorithm is used to produce the path coefficients, or strength of relationships, between the observed variables and latent constructs in the model. The second algorithm used in this paper is the Bootstrapping algorithm. This algorithm tests the significance of path coefficients to either reject or accept hypotheses [53].
Certain questions from the survey were left out of the proposed research model as they would not be able to be processed by the software. The full list of questions can be found in Appendix A. For example, Question 3 and Question 5 are left out as they include the region that the respondent is from as well as the employment type. Both these variables cannot be included as they do not have a clear scale. Table 2 presents the constructs in the study, their indicators, and which questions they represent. Willingness to Adopt BEVs is the target construct.
As mentioned previously, Question 3 and Question 5 were not used in the model. Some questions had responses that were not based on the five-point Likert scale. Questions 15, 16, and 18 were binary with answer options of Yes and No. Therefore, they were assigned 1 for Yes and 0 for No. Question 1 for gender was also binary and was assigned 0 for male and 1 for female. Other questions had more than 5 ranges and so they were assigned numbers according to the number of answer choices they had, ranging from lowest to highest or least to most.
Following the sorting of the data and the creation of the model, the data needed to be tested for reliability and validity. As the Smart-PLS 4 software can run several different algorithms, it can be used for different applications. And so, it was also used for testing the reliability and validity of the constructs.
Once the reliability and validity of the data were verified and the final model was ready, Smart-PLS 4 was used to test the hypotheses with the Bootstrapping and PLS-SEM algorithms. Finally, the interpretations were made, discussions were written, and conclusions were drawn.
4. Results and Discussion
This section presents the results and discussions of the questionnaire as well as both the results of the Bootstrapping algorithm and of the PLS-SEM algorithm, which were both conducted using Smart-PLS 4. These results are split into two subsections. The first subsection, Section 4.1, presents the questionnaire results analyzed through graphs and tables using Excel. The second subsection, Section 4.2, presents the results found using the analysis run by Smart-PLS 4.
4.1. Questionnaire Results
This subsection of the report will present the results collected directly from the questionnaire. For this section, the questionnaire is split into two parts for a clearer display. The first part includes Question 1 to Question 6. These questions focus on collecting information about the demographics of the respondents. The second part includes Question 6 to Question 18. These questions focus on the main frame of the study related to information and opinions regarding BEVs.
4.1.1. First Part of the Questionnaire—Demographic Profiles
The first six questions of the questionnaire are aimed at collecting the demographic profiles of the respondents. Table 3 gives a summary of the demographic profiles of the respondents including gender, age, highest educational level reached, and monthly income. It can be concluded from the table that the percentage of males and females is almost balanced. This shows no bias for gender. However, for the data collected regarding the respondents’ ages, it can be inferred that there is a bias for the ages below 30 as they are responsible for 71% of the answers collected. Moreover, the sample of respondents includes 27% of individuals who obtained a high school diploma, 12% who continued their education past a high school diploma, 28% who have a bachelor’s degree, and finally 33% postgraduates. These results give a diverse data set for the highest level of education category. Regarding the monthly income, almost half the respondents have no income. This can be explained by the fact that 45% of the respondents are students, so they do not have a job yet.
Most respondents reside in the regions of Casablanca-Settat and Tangier-Tetouan-Al Hoceima, 28% and 24%, respectively. The results were categorized into regions to find out which region has the highest and lowest percentage of Willingness to Adopt a BEV. The responses of Question 18 were then plotted against the respondents’ regions. Figure 5 shows the regions with the highest likelihood of adopting a BEV as well as the regions with the lowest likelihood of adopting a BEV. The top three regions with the highest percentage of the response “Yes” to Question 18 are the “Other” regions, the Fez-Meknes region, and the Tangier-Tetouan-Al Hoceima region. Furthermore, the region that has the highest percentage of the response “No” to Question 18 is the Souss-Massa region. This region has the lowest likelihood of adopting a BEV.
Concerning the findings of the employment categories of which the respondents belong to, almost half of the respondents, 45%, are students, showing a bias in the results. Furthermore, like the analysis performed for the likelihood of adopting a BEV by region, the same was performed for the employment category. Figure 6 gives a summary of the frequency of the answers “Yes” and “No” when individuals were asked whether they would adopt a BEV. The three employment categories that are most likely to adopt a BEV are health services, the administration sector, and the educational sector. The three employment categories least likely to adopt a BEV are individuals with no employment, the IT sector, and the social/governmental sector.
4.1.2. Second Part of the Questionnaire—Main Study Questions
This subsection of the report will present and discuss the findings of the second part of the questionnaire.
Figure 7 below gives an insight into some of the Behavioral Factors of the study. In total, 33% of the respondents do not drive while 67% of the respondents do drive. It can be considered good to have respondents who do not drive answering the questionnaire as that would offer more diverse points of view.
Figure 8 below tackles the preconceptions of how much the respondents believe a battery electric vehicle would cost in Morocco on average. In total, 9% of the respondents believed that a BEV would cost less than MAD 200,000, the lower extreme, while 9% believed that a BEV would cost over MAD 1,000,000, the higher extreme. Most of the respondents believed that a BEV would cost between MAD 200,000 and MAD 600,000 on average, meaning the respondents believed it would be affordable when compared to the prices of regular cars. This proves that the average population does not lack knowledge nor have false preconceptions about the prices of BEVs in Morocco.
Figure 9 below gives an idea about how much the population in Morocco is willing to pay for a BEV. In total, 55% of the respondents said they would pay between MAD 200,000 and 400,000 for a BEV. As the price gets higher, there is an obvious decrease in willingness to purchase a BEV. Therefore, the higher the price of the BEV, the less likely the adoption. However, over half of the respondents are willing to pay the minimum option given on the questionnaire. This is not a negative result as Dacia offers battery electric vehicles in this price range.
It is important to discover whether individuals believe that having a BEV would save them money. If they do, it would be safe to assume that they would be more willing to adopt one. Results showed that 65% of respondents believe that a BEV would save them money. In total, 20% of the respondents were neutral, and only 15% disagreed. This means that the majority of respondents have a positive notion about BEVs when it comes to saving money.
Whether or not a battery electric vehicle can easily be maintained in a certain country can have an impact on whether an individual would be willing to purchase one. Figure 10 below shows the results of the respondents regarding whether or not they believe a BEV can be easily maintained in Morocco; 65% of the respondents do not believe that BEVs can easily be maintained in Morocco while 15% believe they can. Moreover, 20% of the responses were neutral. This would mean that the majority of the respondents have a negative notion of maintenance for BEVs in Morocco. This could be a discouraging factor when thinking of adopting a BEV.
There are several factors that could possibly affect the intention to purchase a BEV. These factors were shown to the respondents and they were asked which would affect their decision and which would not. Table 4 gives a summary of the findings. The majority of responses reveal that the time to charge a BEV, the number of available charging stations, cost, maintenance, safety, travel range, and style/design are factors that would affect the respondents’ decisions to purchase a battery electric vehicle. The only factor that would not have an effect on the decision to purchase a BEV was the maximum speed.
Further, individuals find it important to consider society’s opinion when it comes to making purchases [55]. Therefore, it was essential to find out whether the respondents believe that driving a BEV would have an impact on their social image and whether that impact is negative or positive. Figure 11 below shows the results of this question. More than half the respondents believed that driving a BEV would positively impact their social image while 38% believed it would have no impact on their social image. Moreover, only 5% believed that driving a BEV would have a negative impact on their social image. This yields positive results as it infers that there exists positive social reinforcement when it comes to driving BEVs.
If an individual believes that the environment and the ecosystems are important and must be sustained, it can be assumed that it would be important for them to adopt methods to help sustain them. Therefore, it was asked how important the environment is to the respondents. Figure 12 below presents the findings. In total, 80% of the respondents believe that the environment and ecosystems are important while 10% believe it is somewhat important. In total, 7% of the respondents are neutral while only 3% of the respondents believe that it is not important. This paints a clear picture that 90% of the respondents give importance to this factor.
Similarly, Question 15 investigates whether respondents believe that battery electric vehicles have a positive impact on the environment. Figure 13 below presents the findings. The majority of respondents, 87%, believe that BEVs positively impact the environment. For the individuals who do not believe that BEVs positively impact the environment, they may possibly hold the opinion that the manufacturing of the BEV could harm the environment. They may also believe that the electricity used to charge BEVs is not produced with renewable resources and so does not have a positive impact on the environment. However, as discussed in previous parts of this paper, even in the case where a BEV would not be charged with clean energy, it would still have lower carbon dioxide emissions when compared to diesel fuel vehicles.
A factor that would help encourage the purchasing of BEVs would be incentives that offer benefits to individuals who own them. Whether or not individuals are aware of such benefits would either lead to more encouragement or less encouragement. The results show that 58% of respondents stated that they were not aware of any incentives related to the use of BEVs while 42% stated that they were. More than half of respondents are not aware of incentives, meaning more effort must be made to give the population information that could possibly encourage them to adopt BEVs.
Likewise, governmental support would also encourage the adoption of BEVs as when governments facilitate these aspects, there is more affinity from the population to move toward the concept. Figure 13 below presents the findings of whether people believe that more governmental support is needed regarding the encouragement of the use of BEVs in the form of incentives and subsidies. In total, 86% of the respondents agree that more governmental support is needed while 8% are neutral and only 6% do not agree. This indicates that the government needs to increase efforts in creating incentives and making people aware of them.
Finally, the last question on this questionnaire assesses whether individuals would purchase a battery electric vehicle or not. It was found that 78% of the respondents would purchase a BEV while 22% would not. This shows that a predisposition exists in Morocco for the purchase of BEVs.
4.2. Statistical Analysis and Results of Smart-PLS 4
The following results were obtained using the Partial Least Squares Structural Equation Modelling and Bootstrapping algorithms offered by the Smart-PLS 4 software. This software was used to both test the validity of the data and to examine the hypotheses mentioned in Section 3.1.5 of this paper.
4.2.1. Data Assessment for Reliability and Validity
Prior to running the model to investigate the hypotheses, the reliability and validity of the data were assessed. Table 5 summarizes the findings of the assessment conducted with the use of the PLS-SEM algorithm of the Smart-PLS 4 software. These findings are the results of the reliability and validity tests.
Factor loadings investigate whether indicators represent the underlying construct. The first few runs of the model gave factor loadings of less than 0.30, which were removed as any factor less than 0.30 is recommended to be removed [56]. Factor loadings above 0.30 prove moderate correlation between the indicators and constructs [57]. Indicators Des2, FinA1, FinA4, and Maint2 were removed from the model based on this assessment.
The final run of the model gave factor loadings of above 0.5. Factor loadings of over 0.70 are recommended, but more frequently they are found to be less than 0.70 in social science studies [58]. Moreover, just because factors are below 0.70 does not mean they should be removed unless they improve the Composite Reliability and Average Variance Extracted (AVE). These results proved the reliability of the data.
The Cronbach’s Alpha is also used to examine the reliability of the constructs as well as their internal relatedness and consistency. If the Cronbach’s Alpha is low, it could be due to poor inter-relatedness between the indicators in the construct or a low number of indicators within the constructs [59]. An acceptable alpha is above 0.6. The Cronbach’s Alphas for the design and financial attribute constructs are below 0.6. This could possibly mean there are not enough indicators within the constructs. However, since the factor loadings are above 0.5, they are accepted.
The Composite Reliability (ρc) also assesses the reliability of the constructs. The acceptable Composite Reliability is above 0.7 [60]. All the indicators have a ρc of over 0.7, proving reliability once again.
The Average Variance Extracted assesses the convergent validity of the construct. This evaluates how well the indicators converge to reflect the constructs. An AVE above 0.5 is acceptable [61]. All the AVEs for the constructs are above 0.5, proving construct validity.
The Collinearity Statistics, or Variance Inflation Factor (VIF), were also assessed. The VIF shows the level of collinearity between the constructs and the indicators. A high VIF means there is high collinearity, which would have a negative impact on the model, causing over-inflated weightings and statistical significance. An acceptable VIF is below 3.3 [62]. Table 6 summarizes the results of the VIF analysis of the outer model, which contains the indicators. All VIF values are below 3.3, indicating no collinearity issues within the data.
Table 7 below shows the results of the VIF analysis for the inner model, which contain the constructs. All results are below 3.3, meaning that the collinearity will cause no issues within the data.
Moreover, Table 8 shows us the results of the Fornell–Larcker Criterion. The Fornell–Larcker Criterion is used to assess the discriminant validity of the constructs. The discriminant validity shows how distinct each construct is and how unique the individual identity of the construct is. It is used to make sure that the constructs are not too highly correlated to one another. If the square root of the AVE is higher than the correlation between constructs, then the construct has met the criterion [63]. In Table 8, the diagonal of the matrix is higher than all the off-diagonal figures. This means that the square root of the AVE is higher than the correlations between all constructs for all the constructs. As a result, discriminant validity has been proven.
A newer method for assessing discriminant validity is the Heterotrait–Monotrait ratio (HTMT) analysis. This analysis calculates the average correlations between the indicators for all the constructs. The threshold for an acceptable HTMT ratio is below 0.85 [64]. The results in Figure 14 below show that all the relationships between the constructs and indicators pass the HTMT analysis, proving discriminant validity.
4.2.2. Hypothesis Testing
After proving the validity and reliability of the results, the PLS-SEM and Bootstrapping algorithms offered by Smart-PLS 4 were used to test the hypotheses. The PLS-SEM algorithm was used to find the R2 and path coefficients while the Bootstrapping algorithm was used to find the p-value and t-statistic. The path coefficients may also be found using the PLS-SEM algorithms.
The first value checked is the multiple correlation coefficients squared or R2. The R2 represents the amount of model variance that can be explained by the factors (i.e., how much change can be explained in the Willingness to Adopt a BEV by the constructs). The acceptable value for R2 is above or equal to 0.25 [60]. It can be seen from Figure 15 below that the R2 for Willingness to Adopt a BEV is 0.379, meeting the acceptable value. The R2 for the Behavioral Factor, social reinforcement, Environmental Concern 1, and Environmental Concern 2 was below the acceptable R2 value of 0.25 as seen in Figure 15. This means that the change in these constructs cannot be explained by the factors in the model alone. However, this is irrelevant as the study is interested in the Willingness to Adopt as the end goal, which is above the acceptable R2 value as mentioned previously.
For a hypothesis to be proven, it must have a p-value of below 0.05 and a t-statistic higher than 1.96, meaning that the null hypothesis, H0, is rejected [65]. The null hypothesis, H0, states that there is no significant relationship between the two variables in the data. The p-value establishes the significance of the relationship between the two variables. The t-statistics, or t-value, establish how far away the data are from the null hypothesis [66]. A total of 5000 subsamples were used when running the Bootstrapping algorithm.
As shown in Table 9, Hypotheses 1, 2, 3, 4, 8, 9, 13, 15, 16, and 17 were not supported as they have p-values larger than 0.05 and t-values less than 1.96. Meanwhile, Hypotheses 5, 6, 7, 10, 11, 12, 14, and 18 were supported as they have p-values less than 0.05 and t-values larger than 1.96; hence, the null hypothesis is rejected. Table 9 also presents the values of the path coefficients. A path coefficient must be at least 0.05 to be significant and 1.00 to have an impact on the whole model [67]. It measures the direct effect of one variable on another. If the path coefficient is negative, this means the effect the variable has on another variable is inversely correlated. The path coefficient cannot singularly prove a hypothesis but must be considered in combination with the p-value and t-statistic.
Hypothesis 5 was supported, meaning there is a significant association between design and the Willingness to Adopt a BEV. The path coefficient is also negative, meaning that the more an individual cares about the design of the vehicle, the less likely they are to adopt it.
Hypotheses 6 and 7 were supported, meaning there is a significant association between education and both EC1 and EC2. The path coefficient is also positive, meaning that the more educated an individual is, the more environmental concerns they have.
Hypothesis 10 is supported, meaning there is a significant association between Environmental Concern 2 and the Willingness to Adopt a BEV. The path coefficient is positive, meaning that the more an individual believes that a BEV is good for the environment, the more likely they are to adopt it.
Hypothesis 11 is supported, meaning there is a significant association between the financial attributes and the Willingness to Adopt a BEV. The path coefficient is positive, meaning that the more an individual believes a BEV will save them money, the more likely they are to adopt a BEV.
Hypothesis 12 is supported, meaning there is a significant association between gender and the Behavioral Factor. The path coefficient is negative. Since males were assigned the value 0 and females were assigned the value 1, this means that females drive less than males.
Hypothesis 14 is supported, meaning there is a significant association between Incentive 1 and the Willingness to Adopt a BEV. The path coefficient is positive, meaning that the more aware individuals are about incentives regarding BEVs, the more likely they are to adopt a BEV.
Hypothesis 18 is supported, meaning that there is a significant association between social reinforcement and the Willingness to Adopt a BEV. The path coefficient is positive for this relationship, meaning that the more positive of an impact individuals believe owning a BEV would have on their social image, the more likely they are to adopt a BEV.
4.2.3. Importance–Performance Map Analysis (IPMA)
The final analysis run in this paper is the importance–performance map analysis (IPMA). The IMPA analysis uses the path coefficient as a measure of importance and plots it against the value of performance. Importance is the total effects that the variable has on the Willingness to Adopt a BEV. It includes both direct and indirect effects. The performance is a value between 0 and 100, which represents how well the variable explains the target construct [60].
The importance values are plotted on the x-axis while the performance values are plotted on the y-axis shown below in Figure 16. Constructs with the highest importance need to be focused on as they will have the biggest impact on the Willingness to Adopt a BEV. As can be seen from the IPMA map in Figure 16, the three constructs with the lowest importance are design, Behavioral Factor, and income. Autonomy also has a low importance but a high performance in explaining the target construct. The two constructs with the highest importance, above 1.00, are Incentive 1 and Environmental Concern 2. Incentive 1 is whether an individual is aware of incentives regarding BEVs in Morocco and Environmental Concern 2 is whether the individual believes BEVs positively impact the environment. Therefore, it would be suggested to put extra emphasis on educating individuals about existing incentives and the importance of environmental sustainability.
4.3. Discussions and Implications of the Study
This subsection discusses the findings of this study and compares them with the findings found in studies conducted in other countries to give a global perspective.
Based on the findings of this study, it can be established that the majority of the respondents representing the population of Morocco are open and willing to adopt BEVs. Moreover, there is no lack of knowledge regarding the prices of BEVs unlike the lack of knowledge that exists regarding incentives.
The relationship between the financial attributes and the Willingness to Adopt a BEV also discovered that the respondents are interested in adopting measures that would save them money. The same goes for social reinforcement as individuals put heavy emphasis on how BEVs would impact their social image. They have a positive attitude tied to owning BEVs. This would be a supporting influence for the adoption of BEVs in Morocco.
A similar study conducted in India showed that the price of battery electric vehicles would have a considerable impact on their adoption. It was shown to be the single proven inhibitor toward the adoption of BEVs in India [68]. When compared to the current study conducted in Morocco, the results also found that the price of a BEV would impact the willingness to adopt one. Moreover, a Malaysian study, which used Smart-PLS 3, an older version of the software that was used in this paper, found that the subjective norm, how social image would be impacted when owning a BEV, and perceived consumer effectiveness, how the consumer believes their impact will help the environment, directly affect the Willingness to Adopt a BEV [69]. Similarly, this paper also found direct links between these factors and the Willingness to Adopt a BEV as mentioned in Hypotheses 10 and 18.
Likewise, in a study conducted in Denmark, Finland, Iceland, Norway, and Sweden, the results stated that the factors that have an impact on BEV adoption are financial savings and battery life [70]. The results found in this Moroccan study also found a link between financial savings and the Willingness to Adopt a BEV as stated in Hypothesis 11.
When comparing the results of the current study to a study conducted in China using SEM, the factors that increase the will to adopt BEVs in both studies are environmental awareness and external influence [71]. This solidifies the finding that the more awareness individuals have regarding the environment, the more they are willing to adopt a BEV. It also solidifies the finding that social reinforcement and external influence are important factors when discussing the factors attributed to the adoption of BEVs. The Chinese study also tested perceived usefulness, ease to use, as well as compatibility, which all showed direct links to the Willingness to Adopt BEVs; these factors are more detailed aspects of the design of the vehicle.
A study conducted in the United Kingdom using SEM found that range confidence, charging infrastructure, resale value, and environmental performance all influence the adoption of BEVs [72]. Similarly, in this study conducted in Morocco, results showed that financial attributes, environmental concern, travel range, and number of charging stations are all factors that influence the Willingness to Adopt a BEV.
When comparing these studies, several common factors are uncovered. This study has significant relevance to the goals established by Morocco and can be used to assess the factors that encourage and discourage individuals from adopting BEVs. Moreover, it can also be used to adopt solutions when creating plans for the adoption of BEVs in Morocco.
4.4. Limitations of the Study
This paper has several limitations. The first would be in the data collection method. As previously mentioned, the questionnaire was written prior to the selection of the software. This meant that the questionnaire was not tailor-made for the software. This caused issues in the analysis portion of the research as the software could not include all the data correctly. For example, Questions 14 and 15 about environmental concern should have been two indicators of a single construct. Instead, because their response ranges were different, they had to be classified as two separate constructs.
The second limitation is due to bias in the answers. Having a large portion of the respondents being students may skew the results as there is not enough variation in the responses. This may be due to the sampling method used in this study.
Thirdly, human error may almost always be a limitation in studies. In this study, a mistake could have been made when combining the data from the responses of the French and English questionnaires into one file. If gone undetected, this could cause an error in the results.
Additional limitations can be considered when considering the factors. More factors, different to the ones chosen for this study, can be considered for future research. For example, factors that were not included in the current study when compared to the study conducted in China are the acceptance of technology products and control over the resources needed to purchase a BEV [71].
5. Conclusions
To sum up the findings of this paper, some of the most important factors that inhibit the adoption of BEVs in Morocco are financial attributes, maintenance, and design. The majority of individuals reported a lack of interest in adopting BEVs as the price increases. Moreover, the majority also believe that maintaining a BEV in Morocco would not be easy. Therefore, difficulties maintaining the vehicles would lead to a lack of inclination to adopt them. Certain individuals, although not a majority, held the belief that BEVs do not positively impact the environment; this can be considered a misconception, which would inhibit individuals from adopting BEVs.
According to the direct answers collected from the questionnaire, the following results are found:
Question 12 indicates that the factors that individuals would take into consideration when purchasing a BEV are time to charge the BEV, number of available charging stations, as well as maintenance, safety, travel range, and design/style of the BEV. Results from the questionnaire also show that most individuals believe that owning a BEV will positively impact their social image. Additionally, and most importantly, 78% of respondents said they would buy a BEV. The factors mentioned in this paragraph were merged into the hypotheses for testing as previously mentioned in this study.
Furthermore, the findings of the Smart-PLS 4 analysis supported 8 hypotheses and rejected 10. The supported hypotheses are as follows:
Hypothesis 5 indicates that design is an important factor as individuals are less likely to adopt a BEV if it is not aesthetically pleasing. Moreover, safety of a BEV is also important as it is part of the design.
Hypotheses 6 and 7 indicate that higher educational levels are linked to higher environmental awareness, which in turn increases the Willingness to Adopt a BEV. This finding supports Hypothesis 10, which proved that the more environmentally aware an individual is, the more likely they were to adopt a BEV.
Hypothesis 11 indicates the importance of financial attributes to the adoption of a BEV. Financial attributes include price and financial savings. The more an individual is willing to pay for a BEV, the more likely they are to adopt it. Moreover, the more an individual believes owning a BEV would save them money, the more likely they are to adopt it.
Although Hypothesis 12 was supported, it does not hold any significance to the findings as it determines the relationship between gender and frequency of weekly driving but does not determine the relationship between gender and the Willingness to Adopt a BEV. It was found that males drive more frequently than females.
The importance of incentives was uncovered through Hypothesis 14 as it directly links the awareness of incentives to the Willingness to Adopt a BEV. The more aware individuals are of incentives regarding BEVs, the more likely they are to adopt one.
Finally, Hypothesis 18 proves a link between social reinforcement and the Willingness to Adopt a BEV, showing that the more society deems it positive to own a BEV, the more likely individuals will adopt one.
The following future recommendations can be made based on the results of the study:
- The population of Morocco should be made aware of more affordable options available within the country as only being aware of expensive BEVs would not allow them to seriously consider adopting one.
- A larger selection of BEVs should be made available for individuals with a focus on design variety. There should also be a focus on producing and offering BEVs that are more affordable to the average Moroccan.
- Focus should be placed on opening facilities that can maintain BEVs and the necessary technicians must be trained to be equipped to handle maintenance issues.
- The government should continue its effort in increasing the number of charging stations in the country to reduce range anxiety. Moreover, continued efforts to adapt the infrastructure for the adoption of BEVs are encouraged.
- The government should also create more incentives for owning and operating BEVs and make the population aware of them.
- A campaign should be created to correct misinformation regarding the benefits of BEVs to the environment and to spread awareness regarding the importance of the environment.
- Marketing of BEVs should include an element that shines a light on positive social reinforcement as it drives individuals to purchasing BEVs.
Author Contributions
Conceptualization, D.N. and A.K.; methodology, D.N.; software, D.N.; validation, D.N. and A.K.; formal analysis, D.N.; investigation, D.N.; resources, D.N.; data curation, D.N.; writing—original draft preparation, F.J. and A.B.; writing—review and editing, H.E.H.; visualization, H.E.H.; supervision, A.K. and H.E.H.; project administration, A.K.; funding acquisition, A.K. All authors have read and agreed to the published version of the manuscript.
Funding
This work was supported by the German Academic Exchange Service (DAAD) and the Federal Ministry for Economic Cooperation and Development in Germany (BMZ) within the framework of ‘Renewable Energy-based E-Mobility in Higher Education’, Grant Number: 57545562.
Data Availability Statement
The data presented in this study are available on request from the corresponding authors.
Conflicts of Interest
The authors declare no conflict of interest. The funding source had no involvement in the study design; the collection, analysis, and interpretation of data; or in the decision to submit the article for publication.
Abbreviations
| Aut | Autonomy |
| AVE | Average Variance Extracted |
| Bac | Baccalaureate |
| BehF | Behavioral Factor |
| Carbon Dioxide | |
| Des | Design |
| EnvC | Environmental Concern |
| BEV | Battery Electric Vehicle |
| FinA | Financial Attributes |
| HTMT | Heterotrait–Monotrait |
| Inc | Incentives |
| IPMA | Importance–Performance Map Analysis |
| Maint | Maintenance |
| NDC | Nationally Determined Contribution |
| PLS-SEM | Partial Least Squares Structural Equation Modelling |
| SDG | Sustainable Development Goal |
| SEM | Structural Equation Modelling |
| SocR | Social Reinforcement |
| Will | Willingness to Adopt EV |
Appendix A. Copy of the Questionnaire in English
Electric Vehicles in Morocco
This questionnaire was created to help collect data for a master’s Thesis with the aim of helping Morocco reach its goals of using more sustainable energy. Please know that all your answers are anonymous, and your privacy is protected.
Thank you in advance for your collaboration.
1. What is your gender?
- ○
- Female
- ○
- Male
2. What is your age?
- ○
- 18–25
- ○
- 26–30
- ○
- 31–40
- ○
- 41–50
- ○
- 51–60
- ○
- 60+
3. What city do you reside in?
- ○
- Tangier
- ○
- Casablanca
- ○
- Rabat
- ○
- Fes
- ○
- Meknes
- ○
- Kenitra
- ○
- Marrakech
- ○
- Agadir
- ○
- Other:
4. What is your highest level of education?
- ○
- High School Diploma (Baccalaureate)
- ○
- Baccalaureate +2
- ○
- Baccalaureate +3
- ○
- Bachelor’s Degree (Baccalaureate+4)
- ○
- Master’s Degree
- ○
- Doctorate Degree
5. What is your sector of employment?
- ○
- Educational
- ○
- Health Services
- ○
- Manufacturing
- ○
- Information Technology
- ○
- Engineering
- ○
- Agricultural
- ○
- Administration
- ○
- Social/Governmental
- ○
- Business Owner
- ○
- Student
- ○
- No employment
- ○
- Other:
6. What is your monthly income?
- ○
- 3000–8000 MAD
- ○
- 8001–13,000 MAD
- ○
- 13,001–18,000 MAD
- ○
- 18,001–25,000 MAD
- ○
- More than 25,000 MAD
- ○
- No income
7. How often do you drive?
- ○
- I do not drive
- ○
- Less than once a week (when necessary)
- ○
- 2–3 times a week
- ○
- 4–6 times a week
- ○
- Every day of the week
8. How much do you believe a fully electric vehicle costs on average in Morocco?
- ○
- Less than 200,000 MAD
- ○
- 200,000–400,000 MAD
- ○
- 400,001–600,000 MAD
- ○
- 600,001–800,000 MAD
- ○
- 800,001–1,000,000 MAD
- ○
- More than 1,000,000 MAD
9. The maximum I would pay for an electric vehicle is
- ○
- 200,000–400,000 MAD
- ○
- 400,001–600,000 MAD
- ○
- 600,001–800,000 MAD
- ○
- 800,001–1,000,000 MAD
- ○
- 1,000,001–1,600,000 MAD
10. Having an electric vehicle will save me money
- ○
- Strongly Disagree
- ○
- Disagree
- ○
- Neutral
- ○
- Strongly Agree
- ○
- Agree
11. Electric vehicles can easily be maintained in Morocco
- ○
- Strongly Disagree
- ○
- Disagree
- ○
- Neutral
- ○
- Strongly Agree
- ○
- Agree
12. Rate the following factors based on their effect on your decision to purchase a fully electric vehicle. * Range is how many km a vehicle can travel before running out of charge.
| Affects My Decision | Does Not Affect My Decision | I Don’t Know | |
| Time to charge | o | o | o |
| Number of available charging stations | o | o | o |
| Cost of vehicle | o | o | o |
| Maintenance | o | o | o |
| Maximum Speed | o | o | o |
| Safety | o | o | o |
| Travel Range * of the vehicle | o | o | o |
| Style/Design | o | o | o |
13. How will driving an electric vehicle impact your social image?
- ○
- Positively Impact
- ○
- Negatively Impact
- ○
- No Impact
14. How important is the sustainability and protection of our environment and ecosystems to you?
- ○
- Not Important
- ○
- Somewhat Important
- ○
- Neutral
- ○
- Important
- ○
- Very Important
15. Do you believe electric vehicles positively impact the environment?
- ○
- Yes
- ○
- No
16. Are you aware of any incentives for electric vehicles available in Morocco? (e.g., tax-free)
- ○
- Yes
- ○
- No
17. More support is needed from the government to encourage the use of electric vehicles in the form of incentives, subsidies etc.
- ○
- Strongly Disagree
- ○
- Disagree
- ○
- Neutral
- ○
- Strongly Agree
- ○
- Agree
18. I would purchase an electric vehicle
- ○
- Yes
- ○
- No
References
- Global Monitoring Laboratory. Carbon Cycle Greenhouse Gases. Available online: https://gml.noaa.gov.ccgg (accessed on 10 November 2023).
- Greenhouse Gas Bulletin: Another Year Another Record|World Meteorological Organization. Available online: https://public.wmo.int/en/media/press-release/greenhouse-gas-bulletin-another-year-another-record (accessed on 19 November 2023).
- WHO Ambient Air Pollution Attributable Deaths. Available online: https://www.who.int/data/gho/data/indicators/indicator-details/GHO/ambient-air-pollution-attributable-deaths (accessed on 17 November 2023).
- The Paris Agreement|UNFCCC. Available online: https://unfccc.int/process-and-meetings/the-paris-agreement (accessed on 19 November 2023).
- Sustainable Development Goals|United Nations Development Programme. Available online: https://www.undp.org/sustainable-development-goals?gclid=CjwKCAjwo7iiBhAEEiwAsIxQERnwDA5s35VVLqiWfxxupKb5j4irmcxC4h1_pGHxqBuhg (accessed on 19 November 2023).
- Statistica, Share of Global CO₂ Emissions by Sector 2022. Available online: https://www.statista.com/statistics/1129656/global-share-of-co2-emissions-from-fossil-fuel-and-cement/ (accessed on 19 November 2023).
- Statistica, Transport CO2 Emissions Shares by Type. Available online: https://www.statista.com/statistics/1185535/transport-carbon-dioxide-emissions-breakdown/ (accessed on 19 November 2023).
- Net Zero Coalition|United Nations. Available online: https://www.un.org/en/climatechange/net-zero-coalition (accessed on 19 November 2023).
- ITF, Decarbonising Transport Initiative. Available online: https://www.itf-oecd.org/decarbonising-transport (accessed on 19 November 2023).
- Sang, Y.N.; Bekhet, H.A. Modelling battery electric vehicle Usage Intentions: An Empirical Study in Malaysia. J. Clean. Prod. 2015, 92, 75–83. [Google Scholar] [CrossRef]
- Ayre, J. Electric Cars Release Less CO2 Over Lifetime Than Diesel Cars Even When Powered By Dirtiest Electricity In EU. CleanTechnica. 1 November 2017. Available online: https://cleantechnica.com/2017/11/01/electric-cars-release-less-co2-lifetime-diesel-cars-even-powered-dirtiest-electricity-eu/ (accessed on 19 November 2023).
- Electric Vehicles: An Economic and Environmental Win for Developing Countries. 2022. Available online: https://www.worldbank.org/en/news/feature/2022/11/17/electric-vehicles-an-economic-and-environmental-win-for-developing-countries (accessed on 19 November 2023).
- Rajper, S.Z.; Albrecht, J. Prospects of battery electric vehicles in the Developing Countries: A Literature Review. Sustainability 2020, 12, 1906. [Google Scholar] [CrossRef]
- Dioha, M.O.; Lukuyu, J.; Virgüez, E.; Caldeira, K. Guiding the Deployment of battery electric vehicles in the Developing World. Environ. Res. Lett. 2022, 17, 071001. [Google Scholar] [CrossRef]
- El Hafdaoui, H.; Khallaayoun, A. Mathematical Modeling of Social Assessment for Alternative Fuel Vehicles. IEEE Access 2023, 11, 59108–59132. [Google Scholar] [CrossRef]
- El Hafdaoui, H.; Khallaayoun, A.; Ouazzani, K. Activity and Efficiency of the Building Sector in Morocco: A Review of Status and Measures in Ifrane. AIMS Energy 2023, 11, 454–485. [Google Scholar] [CrossRef]
- El Hafdaoui, H.; El Alaoui, H.; Mahidat, S.; Harmouzi, Z.; Khallaayoun, A. Impact of Hot Arid Climate on Optimal Placement of battery electric vehicle Charging Stations. Energies 2023, 16, 753. [Google Scholar] [CrossRef]
- El Hafdaoui, H.; Khallaayoun, A. Internet of Energy (IoE) Adoption for a Secure Semi-Decentralized Renewable Energy Distribution. Sustain. Energy Technol. Assess. 2023, 57, 103307. [Google Scholar] [CrossRef]
- Intelligence, M. Morocco Automotive Industry Outlook-Growth, Trends, COVID-19 Impact, and Forecasts (2022–2027). Research and Markets. Available online: https://www.researchandmarkets.com/reports/4773661/morocco-automotive-industry-outlook-growth (accessed on 19 November 2023).
- AMACHRAA, A. Driving The Dream: Morocco’s Rise in The Global Automotive Industry. Available online: https://www.policycenter.ma/sites/default/files/2023-05/PP_09-23_AMACHRAA.pdf (accessed on 19 November 2023).
- Auktor, G.V. The Effectiveness of Morocco’s Industrial Policy in Promoting a National Automotive Industry. Available online: https://www.idos-research.de/uploads/media/DP_27.2017.pdf (accessed on 19 November 2023).
- Tanchum, M. Morocco’s “First in North Africa” Electric Car Production Is a European Manufacturing Gain over China. 2021. Available online: https://www.mei.edu/publications/moroccos-first-north-africa-electric-car-production-european-manufacturing-gain-over (accessed on 17 November 2023).
- Mousjid, B. Morocco Is Forcibly Transitioning to Electric Vehicles. The Africa Report. 29 August 2022. Available online: https://www.theafricareport.com/234745/morocco-is-forcibly-transitioning-to-electric-vehicles/ (accessed on 19 November 2023).
- Voiture Electrique: Le Maroc Accuse un Sérieux Retard Pour Installer un Cadre Favorable. Finance News. 26 June 2022. Available online: https://fnh.ma/article/actualite-economique/voiture-electrique-le-maroc-accuse-un-serieux-retard-pour-installer-un-cadre-favorable#:~:text=La%20plupart%20des%20offres%20disponibles,partir%20de%201.050.000%20DH (accessed on 19 November 2023).
- Dacia, “Nouvelle Dacia Spring”. 2023. Available online: https://www.dacia.ma/notre-gamme/spring-electrique.html?utm_content=sea_defensive%7Cgoogle_ads&CAMPAIGN=ma-fr-d-l-def-model-spring-electric-go-classic--&ORIGIN=sea_defensive&CAMPAIGN=ma-fr-d-l-def-model-spring-electric-go-classic--&ORIGIN=SEA&gad_source=1&gclid=Cj0KCQiAsburBhCIARIsAExmsu4-j4s2eIXJwh0Xx78AT_YvG8eMp84iFNsGD6cV3Gb9AF4xEYnmMVIaAqRiEALw_wc (accessed on 19 November 2023).
- SNECI. Morocco: A Rising Star in the Electric Car Industry. 29 September 2023. Available online: https://www.sneci.com/blog/morocco-a-rising-star-in-the-electric-car-industry/ (accessed on 19 November 2023).
- Blauser, A.; Forster, R.; Hicks, E.; Marion, R. Electric Vehicles in Morocco: Developing a Survey to Identify Public Sentiments. Available online: https://digital.wpi.edu/concern/student_works/4j03d2781?locale=es (accessed on 19 November 2023).
- Boulakhbar, M.; Lebrouhi, B.; Kousksou, T.; Smouh, S.; Jamil, A.; Maaroufi, M.; Zazi, M. Towards a Large-Scale Integration of Renewable Energies in Morocco. J. Energy Storage 2020, 32, 101806. [Google Scholar] [CrossRef]
- El Hafdaoui, H.; Jelti, F.; Khallaayoun, A.; Ouazzani, K. Energy and Environmental National Assessment of Alternative Fuel Buses in Morocco. World Battery Electr. Veh. J. 2023, 14, 105. [Google Scholar] [CrossRef]
- El Hafdaoui, H.; Jelti, F.; Khallaayoun, A.; Ouazzani, K. Energy and Environmental Evaluation of Alternative Fuel Vehicles in Maghreb Countries. Innov. Green Dev. 2023, 3, 100092. [Google Scholar] [CrossRef]
- El Alaoui, H.; Bazzi, A.; El Hafdaoui, H.; Khallaayoun, A.; Lghoul, R. Sustainable Railways for Morocco: A Comprehensive Energy and Environmental Assessment. J. Umm Al-Qura Univ. Eng. Archit. 2023, 14, 271–283. [Google Scholar] [CrossRef]
- Kumar, R.R.; Alok, K. Adoption of battery electric vehicle: A Literature Review and Prospects for Sustainability. J. Clean. Prod. 2020, 253, 119911. [Google Scholar] [CrossRef]
- Krishna, G. Understanding and Identifying Barriers to battery electric vehicle Adoption through Thematic Analysis. Transp. Res. Interdiscip. Perspect. 2021, 10, 100364. [Google Scholar] [CrossRef]
- Al-Shaiba, A.; Wilson Id, A.; Cochrane Id, L. The Enablers, Opportunities and Challenges of battery electric vehicle Adoption in Qatar: A Systematic Review of the Literature and Assessment of Progress toward Transportation Transformation Targets. PLoS Clim. 2023, 2, e0000271. [Google Scholar] [CrossRef]
- Axsen, J.; Orlebar, C.; Skippon, S. Social influence and consumer preference formation for pro-environmental technology: The case of a U.K. workplace electric-vehicle study. Ecol. Econ. 2013, 95, 96–107. [Google Scholar] [CrossRef]
- Plananska, J.; Gamma, K. Product bundling for accelerating electric vehicle adoption: A mixed-method empirical analysis of Swiss customers. Renew. Sustain. Energy Rev. 2022, 154, 111760. [Google Scholar] [CrossRef]
- Ian, D. What Are the Main Barriers to Increasing EV Adoption? 2023. Available online: https://www.here.com/learn/blog/electric-vehicle-adoption-barriers (accessed on 17 November 2023).
- David, R. The Road to Mass EV Adoption: Three Barriers to a Sustainable Future. 2023. Available online: https://www.forbes.com/sites/forbestechcouncil/2023/08/30/the-road-to-mass-ev-adoption-three-barriers-to-a-sustainable-future/?sh=3a6eb9be2293 (accessed on 17 November 2023).
- Hsu, C.W.; Fingerman, K. Public battery electric vehicle Charger Access Disparities across Race and Income in California. Transp. Policy 2021, 100, 59–67. [Google Scholar] [CrossRef]
- Climate Expert Morocco. 2017. Available online: https://www.climate-expert.org/en/home/business-adaptation/morocco (accessed on 17 November 2023).
- MEM Morocco First NDC (Updated Submission). 2022. Available online: https://unfccc.int/documents/497685 (accessed on 17 November 2023).
- Benoit-Ivan Wansi MOROCCO: ONEE Is Preparing the “National Master Plan for Electric Mobility”|Afrik 21. 2022. Available online: https://www.afrik21.africa/en/morocco-onee-is-preparing-the-national-master-plan-for-electric-mobility/ (accessed on 17 November 2023).
- Usman, Z. What Can Developing Countries Learn from Morocco’s Experience with Power Sector Reforms? 2019. Available online: https://blogs.worldbank.org/energy/what-can-developing-countries-learn-moroccos-experience-power-sector-reforms (accessed on 17 November 2023).
- Jihane Rahhou Morocco to Open 2500 Electric Car Charging Stations by 2026. 2023. Available online: https://www.moroccoworldnews.com/2023/04/354807/morocco-to-open-2-500-electric-car-charging-stations-by-2026 (accessed on 18 November 2023).
- IEA Circulation Tax Exemption Morocco–Policies. 2017. Available online: https://www.iea.org/policies/6993-circulation-tax-exemption-morocco (accessed on 18 November 2023).
- Chachdi, A.; Rahmouni, B.; Aniba, G. Socio-economic Analysis of Electric Vehicles in Morocco. Energy Procedia 2017, 141, 644–653. [Google Scholar] [CrossRef]
- Sivak, M. Female Drivers in the United States, 1963–2010: From a Minority to a Majority? Traffic Inj. Prev. 2013, 14, 259–260. [Google Scholar] [CrossRef]
- Chen, M.-F.; Tung, P.-J. Developing an extended Theory of Planned Behavior model to predict consumers’ intention to visit green hotels. Int. J. Hosp. Manag. 2014, 36, 221–230. [Google Scholar] [CrossRef]
- Acharya, A.S.; Prakash, A.; Saxena, P.; Nigam, A. Sampling: Why and how of it. Indian J. Med. Spec. 2013, 4, 330–333. [Google Scholar] [CrossRef]
- Parker, C.; Scott, S.; Geddes, A. Snowball Sampling; SAGE Research Methods Foundations: Sauzendoaks, CA, USA, 2019; Available online: https://www.sciencedirect.com/science/article/pii/S0278431913001266 (accessed on 19 November 2023).
- Menon, G. Book Review: Asking Questions: The Definitive Guide to Questionnaire Design: For Market Research, Political Polls, and Social and Health Questionnaires. J. Mark. Res. 2006, 43, 703–704. [Google Scholar] [CrossRef]
- Zouhir, A. Language situation and conflict in Morocco. In Proceedings of the Selected 43rd Annual Conference on African Linguistics, Cascadilla Proceedings Project, Somerville, MA, USA; 2013; pp. 271–277. [Google Scholar]
- Donald, R.T.; Barclay, W.; Higgins, C.A. The Partial Least Squares Approach to Causal Modeling: Personal Computer Adoption and Use as an Illustration. Available online: https://www.researchgate.net/publication/313137896_The_partial_least_squares_approach_to_causal_modeling_Personal_computer_adoption_and_use_as_an_illustration (accessed on 18 November 2023).
- Kline, R. Principles and Practice of Structural Equation Modeling; The Guilford Press: New York, NY, USA, 2023. [Google Scholar]
- Ali, I.; Naushad, M. Determinants of Customer Satisfaction in Online Grocery Shopping. Int. J. Data Netw. Sci. 2021, 5, 383–390. [Google Scholar] [CrossRef]
- Field, A. Discovering Statistics wth IBM and SPSS. Sage 2012, 66, 37–39. [Google Scholar]
- Royce, J.R. Factors as Theoretical Constructs. Am. Psychol. 1963, 18, 522–528. [Google Scholar] [CrossRef]
- Handbook of Partial Least Squares; Springer: Berlin/Heidelberg, Germany, 2010. [CrossRef]
- Cronbach’s Alpha-Statistics Solutions. Available online: https://www.statisticssolutions.com/cronbachs-alpha/ (accessed on 18 November 2023).
- Hair, J.F., Jr.; Hult, G.T.M.; Ringle, C.M.; Sarstedt, M.; Danks, N.P.; Ray, S. Partial Least Squares Structural Equation Modeling (PLS-SEM) Using R; Springer Science and Business Media LLC: Dordrecht, GX, Netherlands, 2021; Volume 197. [Google Scholar] [CrossRef]
- Leeflang, P.S.H.; Wieringa, J.E.; Bijmolt, T.H.A.; Pauwels, K.H. Advanced Methods for Modeling Markets (AMMM); Springer: Berlin/Heidelberg, Germany, 2017; pp. 3–27. [Google Scholar] [CrossRef]
- Diamantopoulos, A.; Siguaw, J.A. Formative versus Reflective Indicators in Organizational Measure Development: A Comparison and Empirical Illustration. Br. J. Manag. 2006, 17, 263–282. [Google Scholar] [CrossRef]
- Mikhalkin, E.N.; Tsikh, A.K.; Afthanorhan, A.; Liza Ghazali, P.; Rashid, N.; Ab Hamid, M.R.; Sami, W.; Mohmad Sidek, M.H. Discriminant Validity Assessment: Use of Fornell & Larcker Criterion versus HTMT Criterion. J. Phys. Conf. Ser. 2017, 890, 012163. [Google Scholar] [CrossRef]
- Henseler, J.; Ringle, C.M.; Sarstedt, M. A New Criterion for Assessing Discriminant Validity in Variance-Based Structural Equation Modeling. J. Acad. Mark. Sci. 2015, 43, 115–135. [Google Scholar] [CrossRef]
- Null Hypothesis-Overview, How It Works, Example. Available online: https://corporatefinanceinstitute.com/resources/data-science/null-hypothesis-2/ (accessed on 18 November 2023).
- Simple Structural Model in SmartPLS4-ResearchWithFawad. Available online: https://researchwithfawad.com/index.php/lp-courses/smartpls4-tutorial-series/simple-structural-model-in-smartpls4/ (accessed on 18 November 2023).
- Mohamed, Z.; Ubaidullah, N.; Yusof, S. An Evaluation of Structural Model for Independent Learning Through Connectivism Theory and Web 2.0 Towards Studentsr Achievement. In Proceedings of the International Conference on Applied Science and Engineering (ICASE 2018), Sukoharjo, Indonesia, 6–7 October 2018. [Google Scholar] [CrossRef]
- Ali, I.; Naushad, M. A Study to Investigate What Tempts Consumers to Adopt Electric Vehicles. World Electr. Veh. J. 2022, 13, 26. [Google Scholar] [CrossRef]
- Asadi, S.; Nilashi, M.; Samad, S.; Abdullah, R.; Mahmoud, M.; Alkinani, M.H.; Yadegaridehkordi, E. Factors impacting consumers’ intention toward adoption of electric vehicles in Malaysia. J. Clean. Prod. 2021, 282, 124474. [Google Scholar] [CrossRef]
- Chen, C.F.; de Rubens, G.Z.; Noel, L.; Kester, J.; Sovacool, B.K. Assessing the socio-demographic, technical, economic and behavioral factors of Nordic electric vehicle adoption and the influence of vehicle-to-grid preferences. Renew. Sustain. Energy Rev. 2020, 121, 109692. [Google Scholar] [CrossRef]
- Tu, J.-C.; Yang, C. Key Factors Influencing Consumers’ Purchase of Electric Vehicles. Sustainability 2019, 11, 3863. [Google Scholar] [CrossRef]
- Tiwari, V.; Aditjandra, P.; Dissanayake, D. Public Attitudes towards Electric Vehicle adoption using Structural Equation Modelling. Transp. Res. Procedia 2020, 48, 1615–1634. [Google Scholar] [CrossRef]
Figure 1.
Distribution of CO2 emissions in 2022 by transportation subsector [7].
Figure 1.
Distribution of CO2 emissions in 2022 by transportation subsector [7].
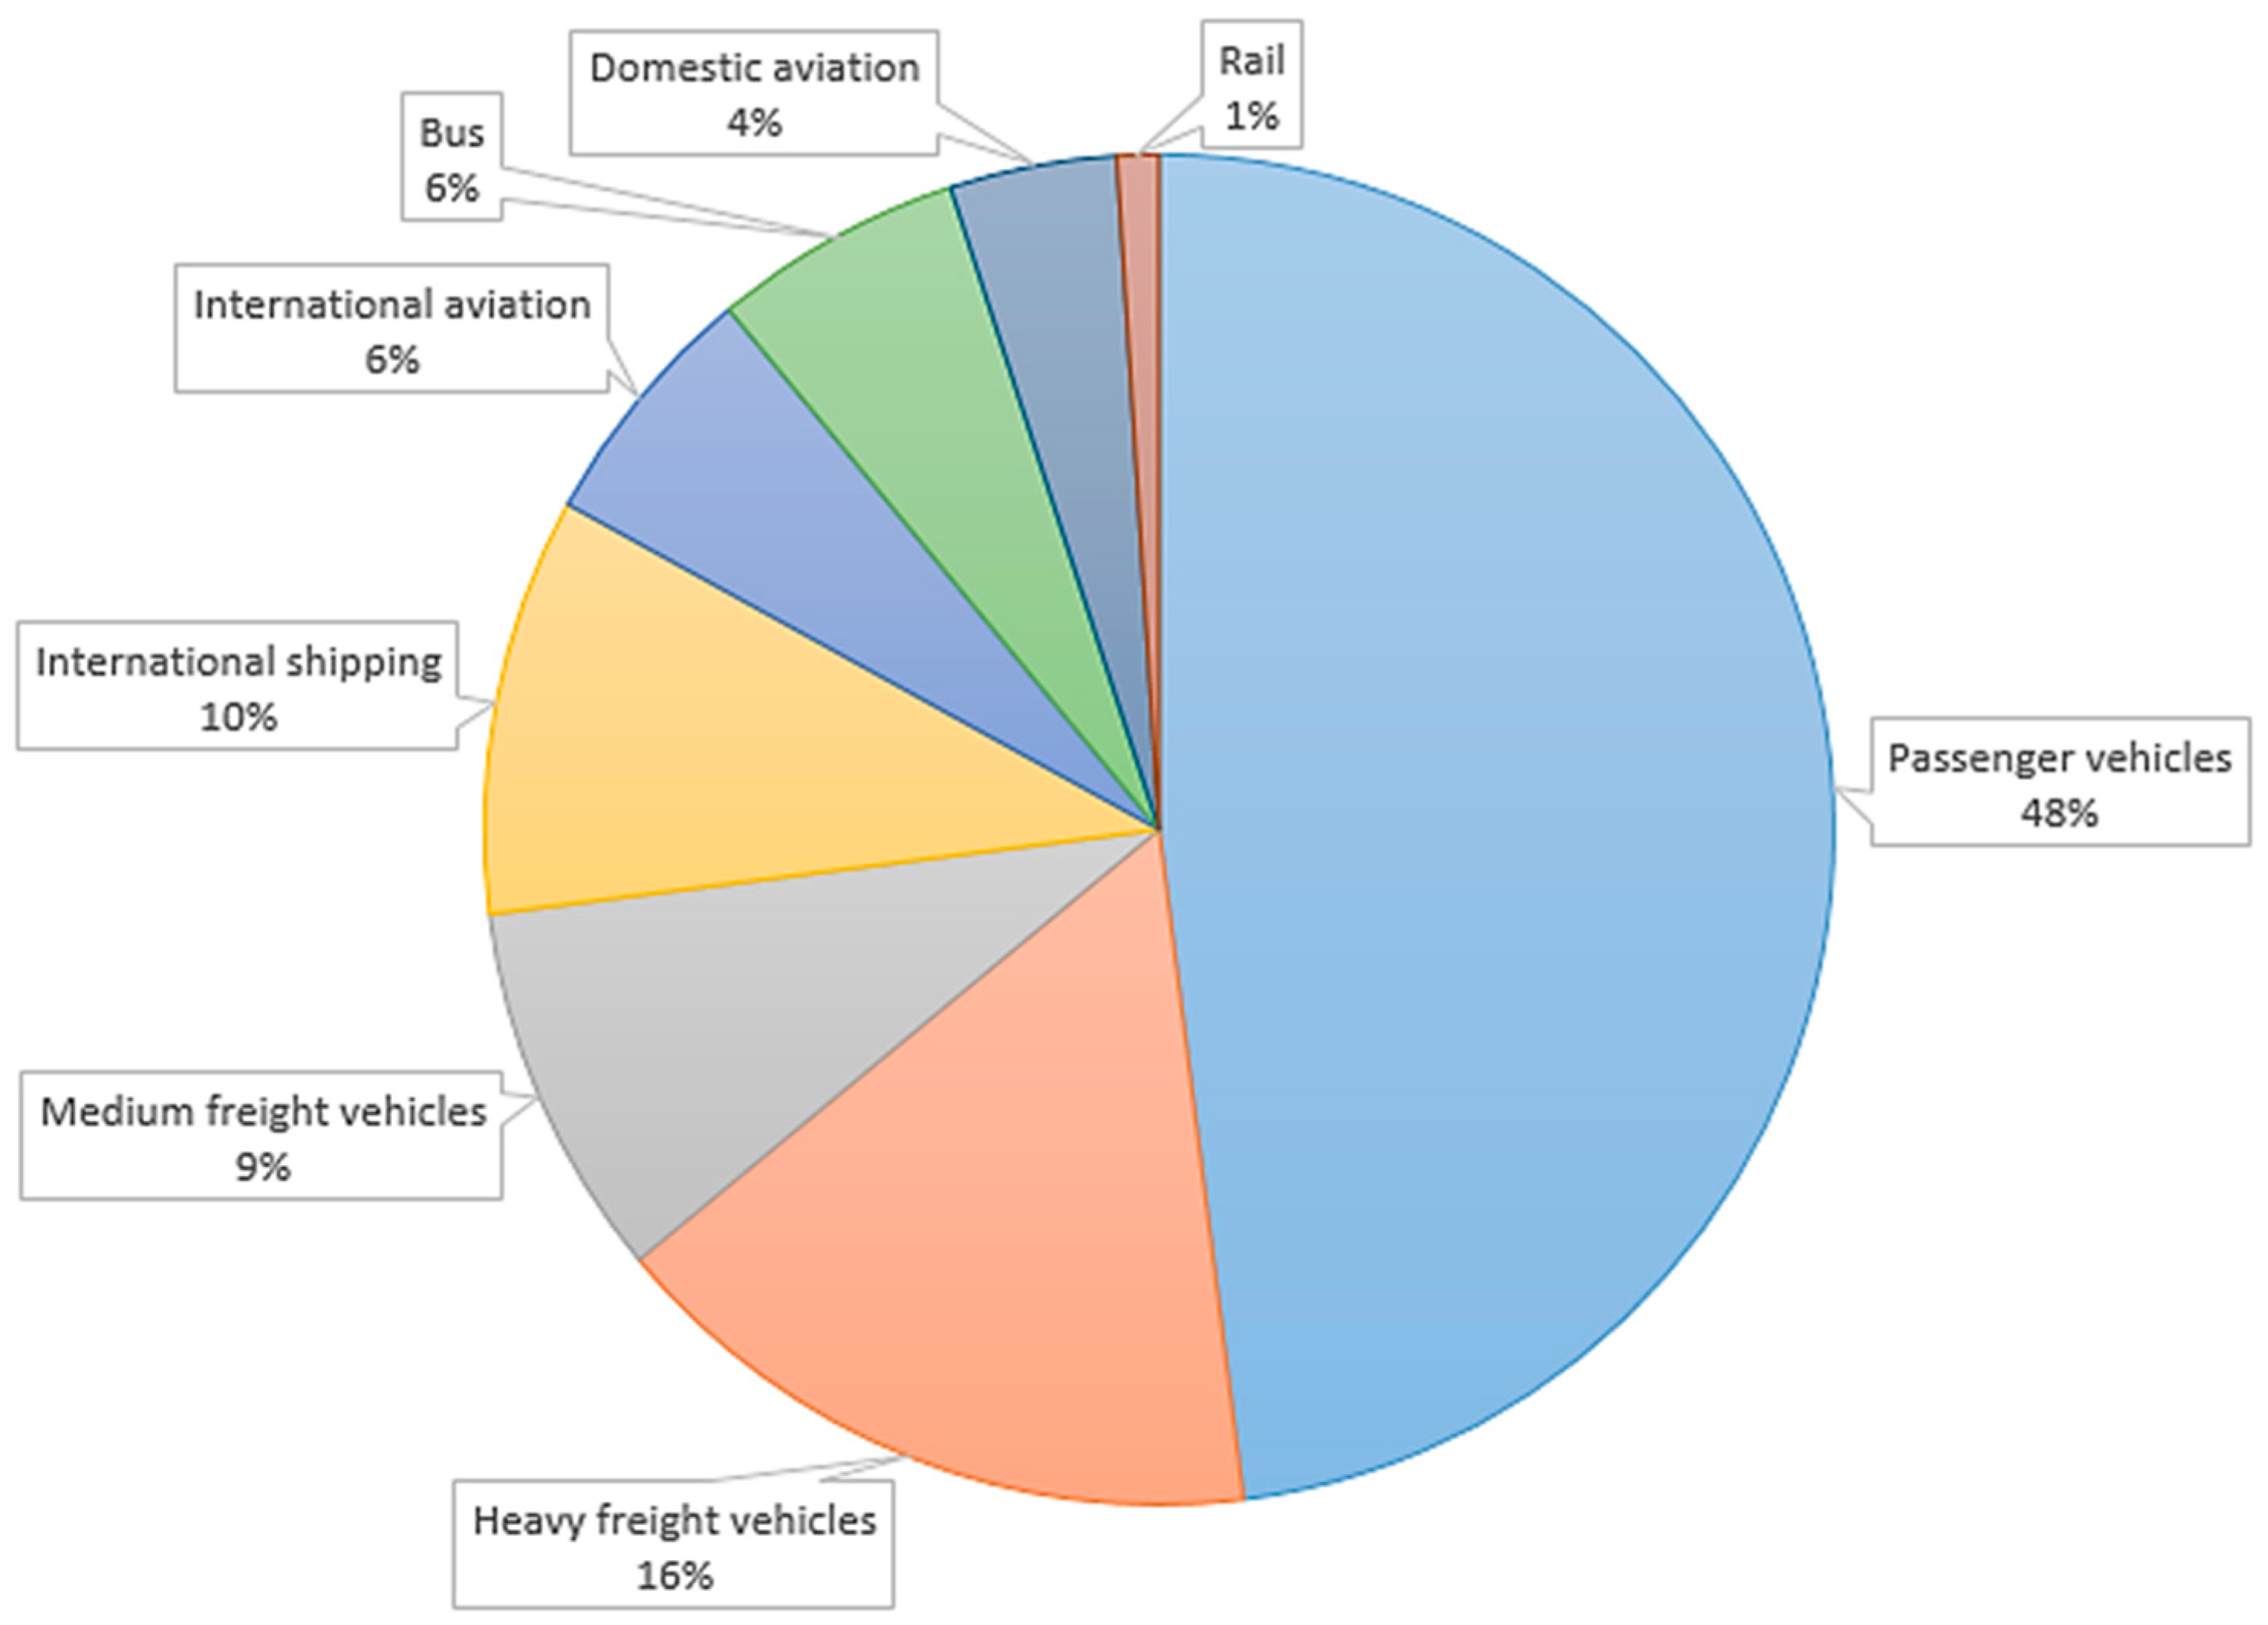
Figure 2.
Installed capacity in Morocco (2015, 2020, and 2030) [28].
Figure 2.
Installed capacity in Morocco (2015, 2020, and 2030) [28].
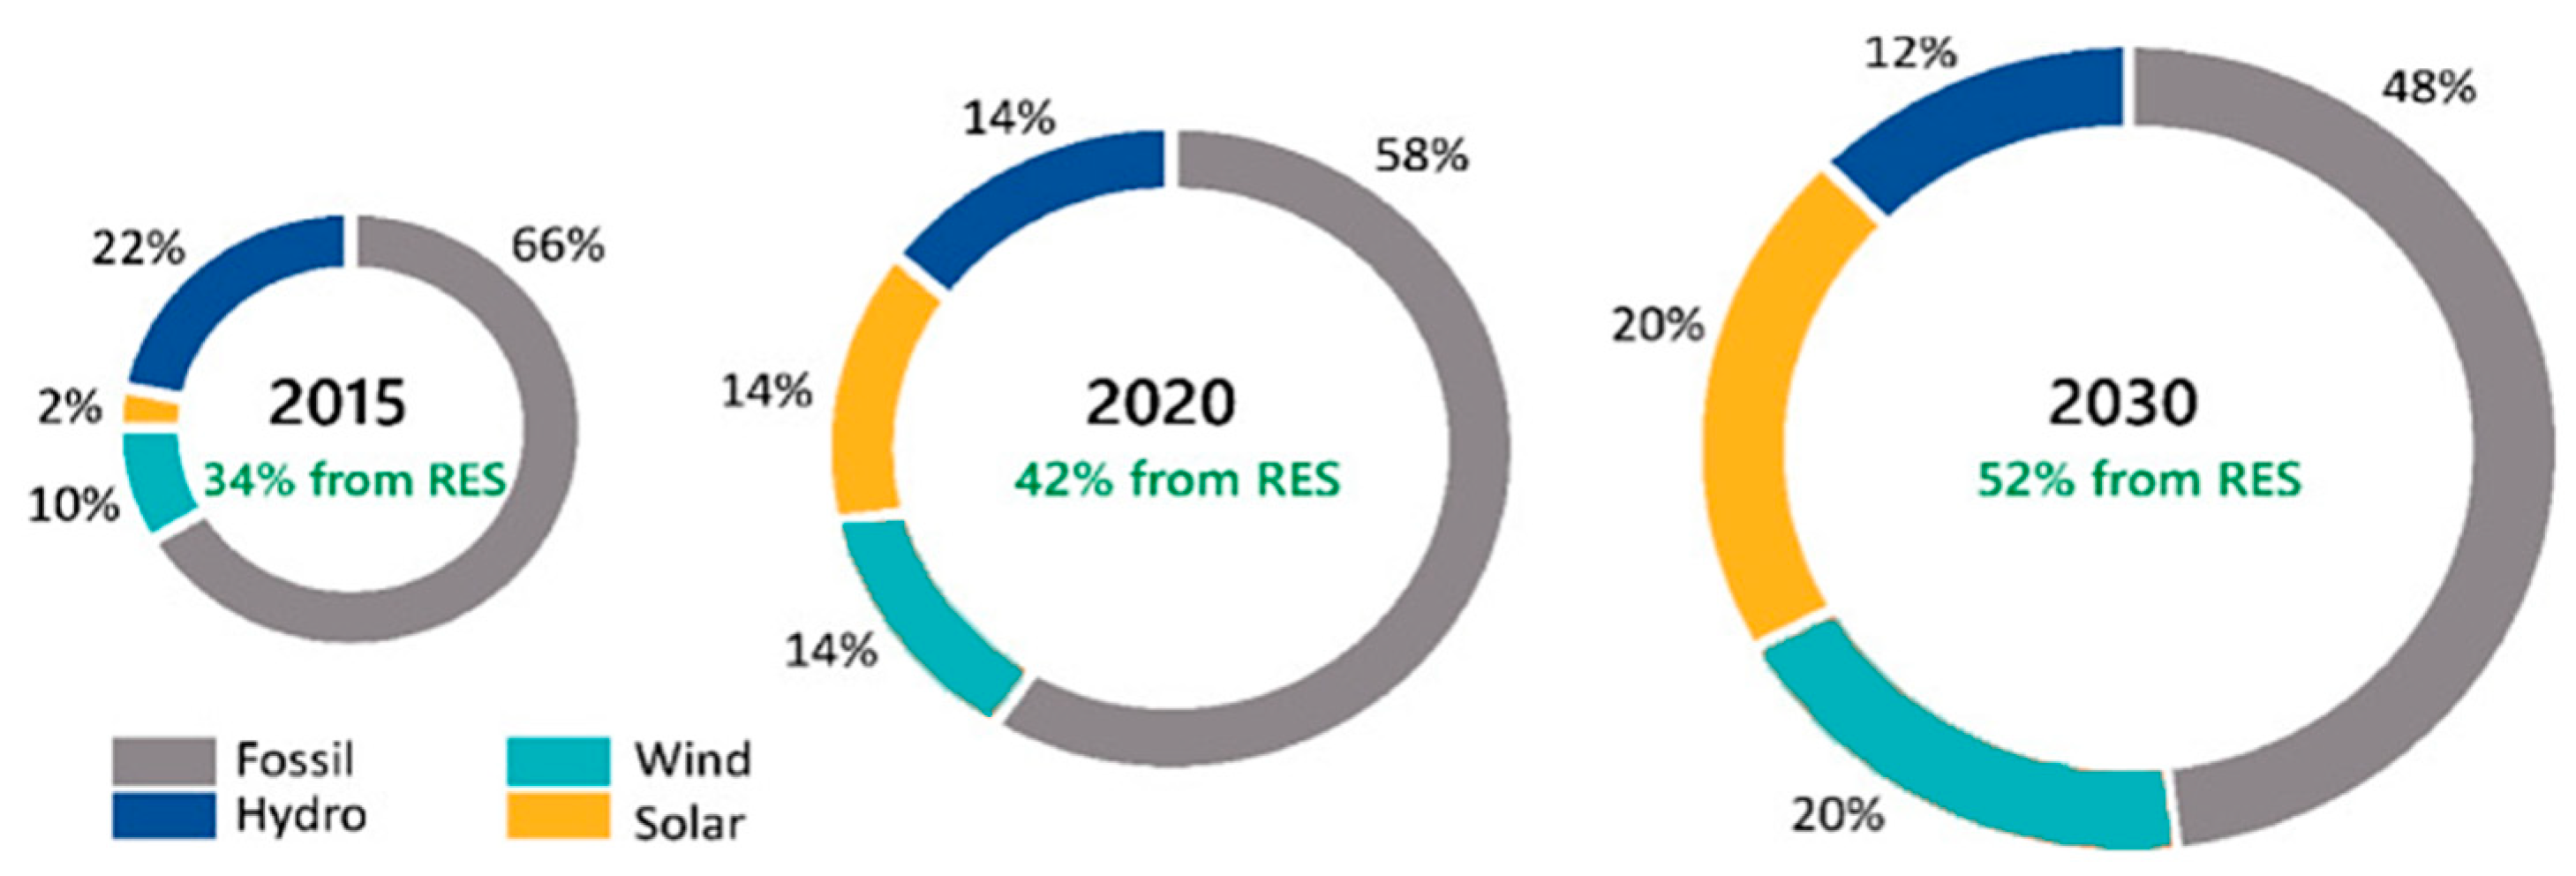
Figure 3.
Outline of research methodology.
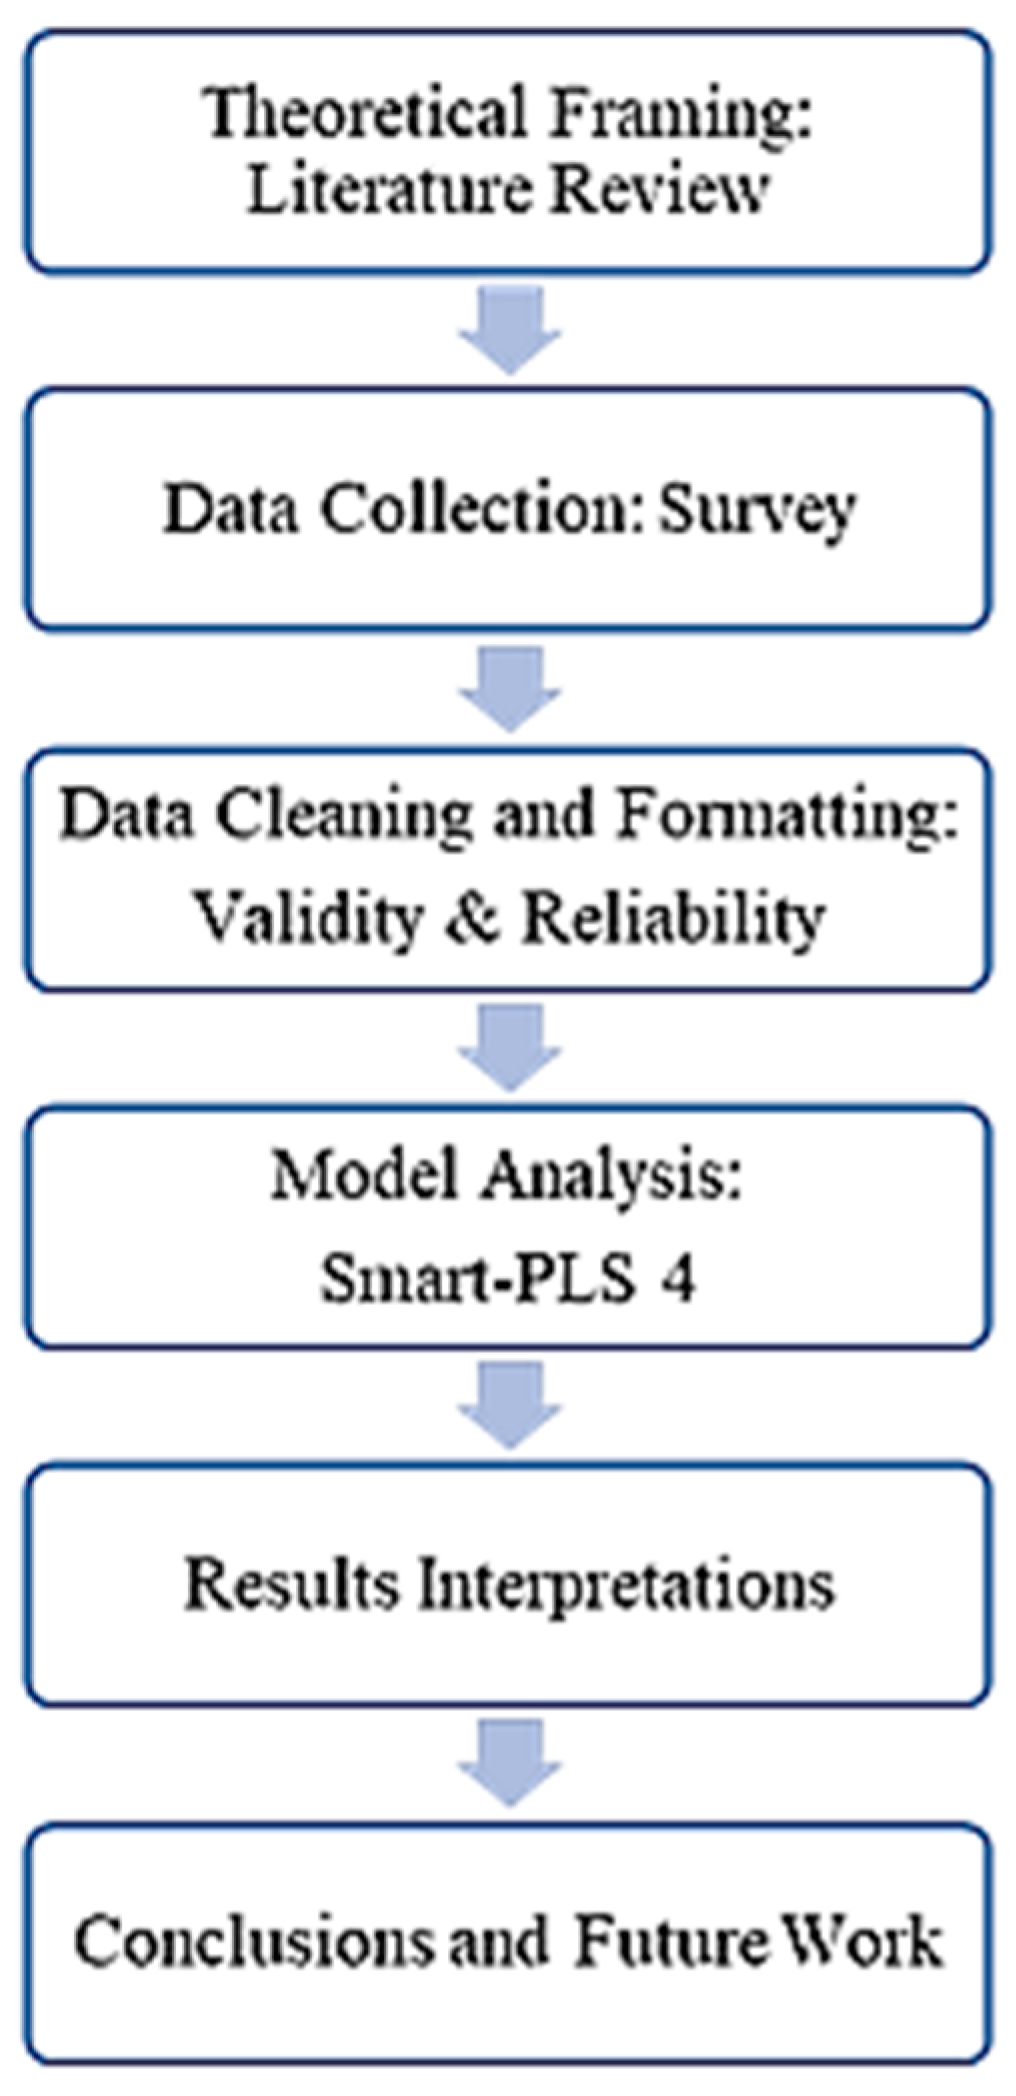
Figure 4.
Proposed research model.
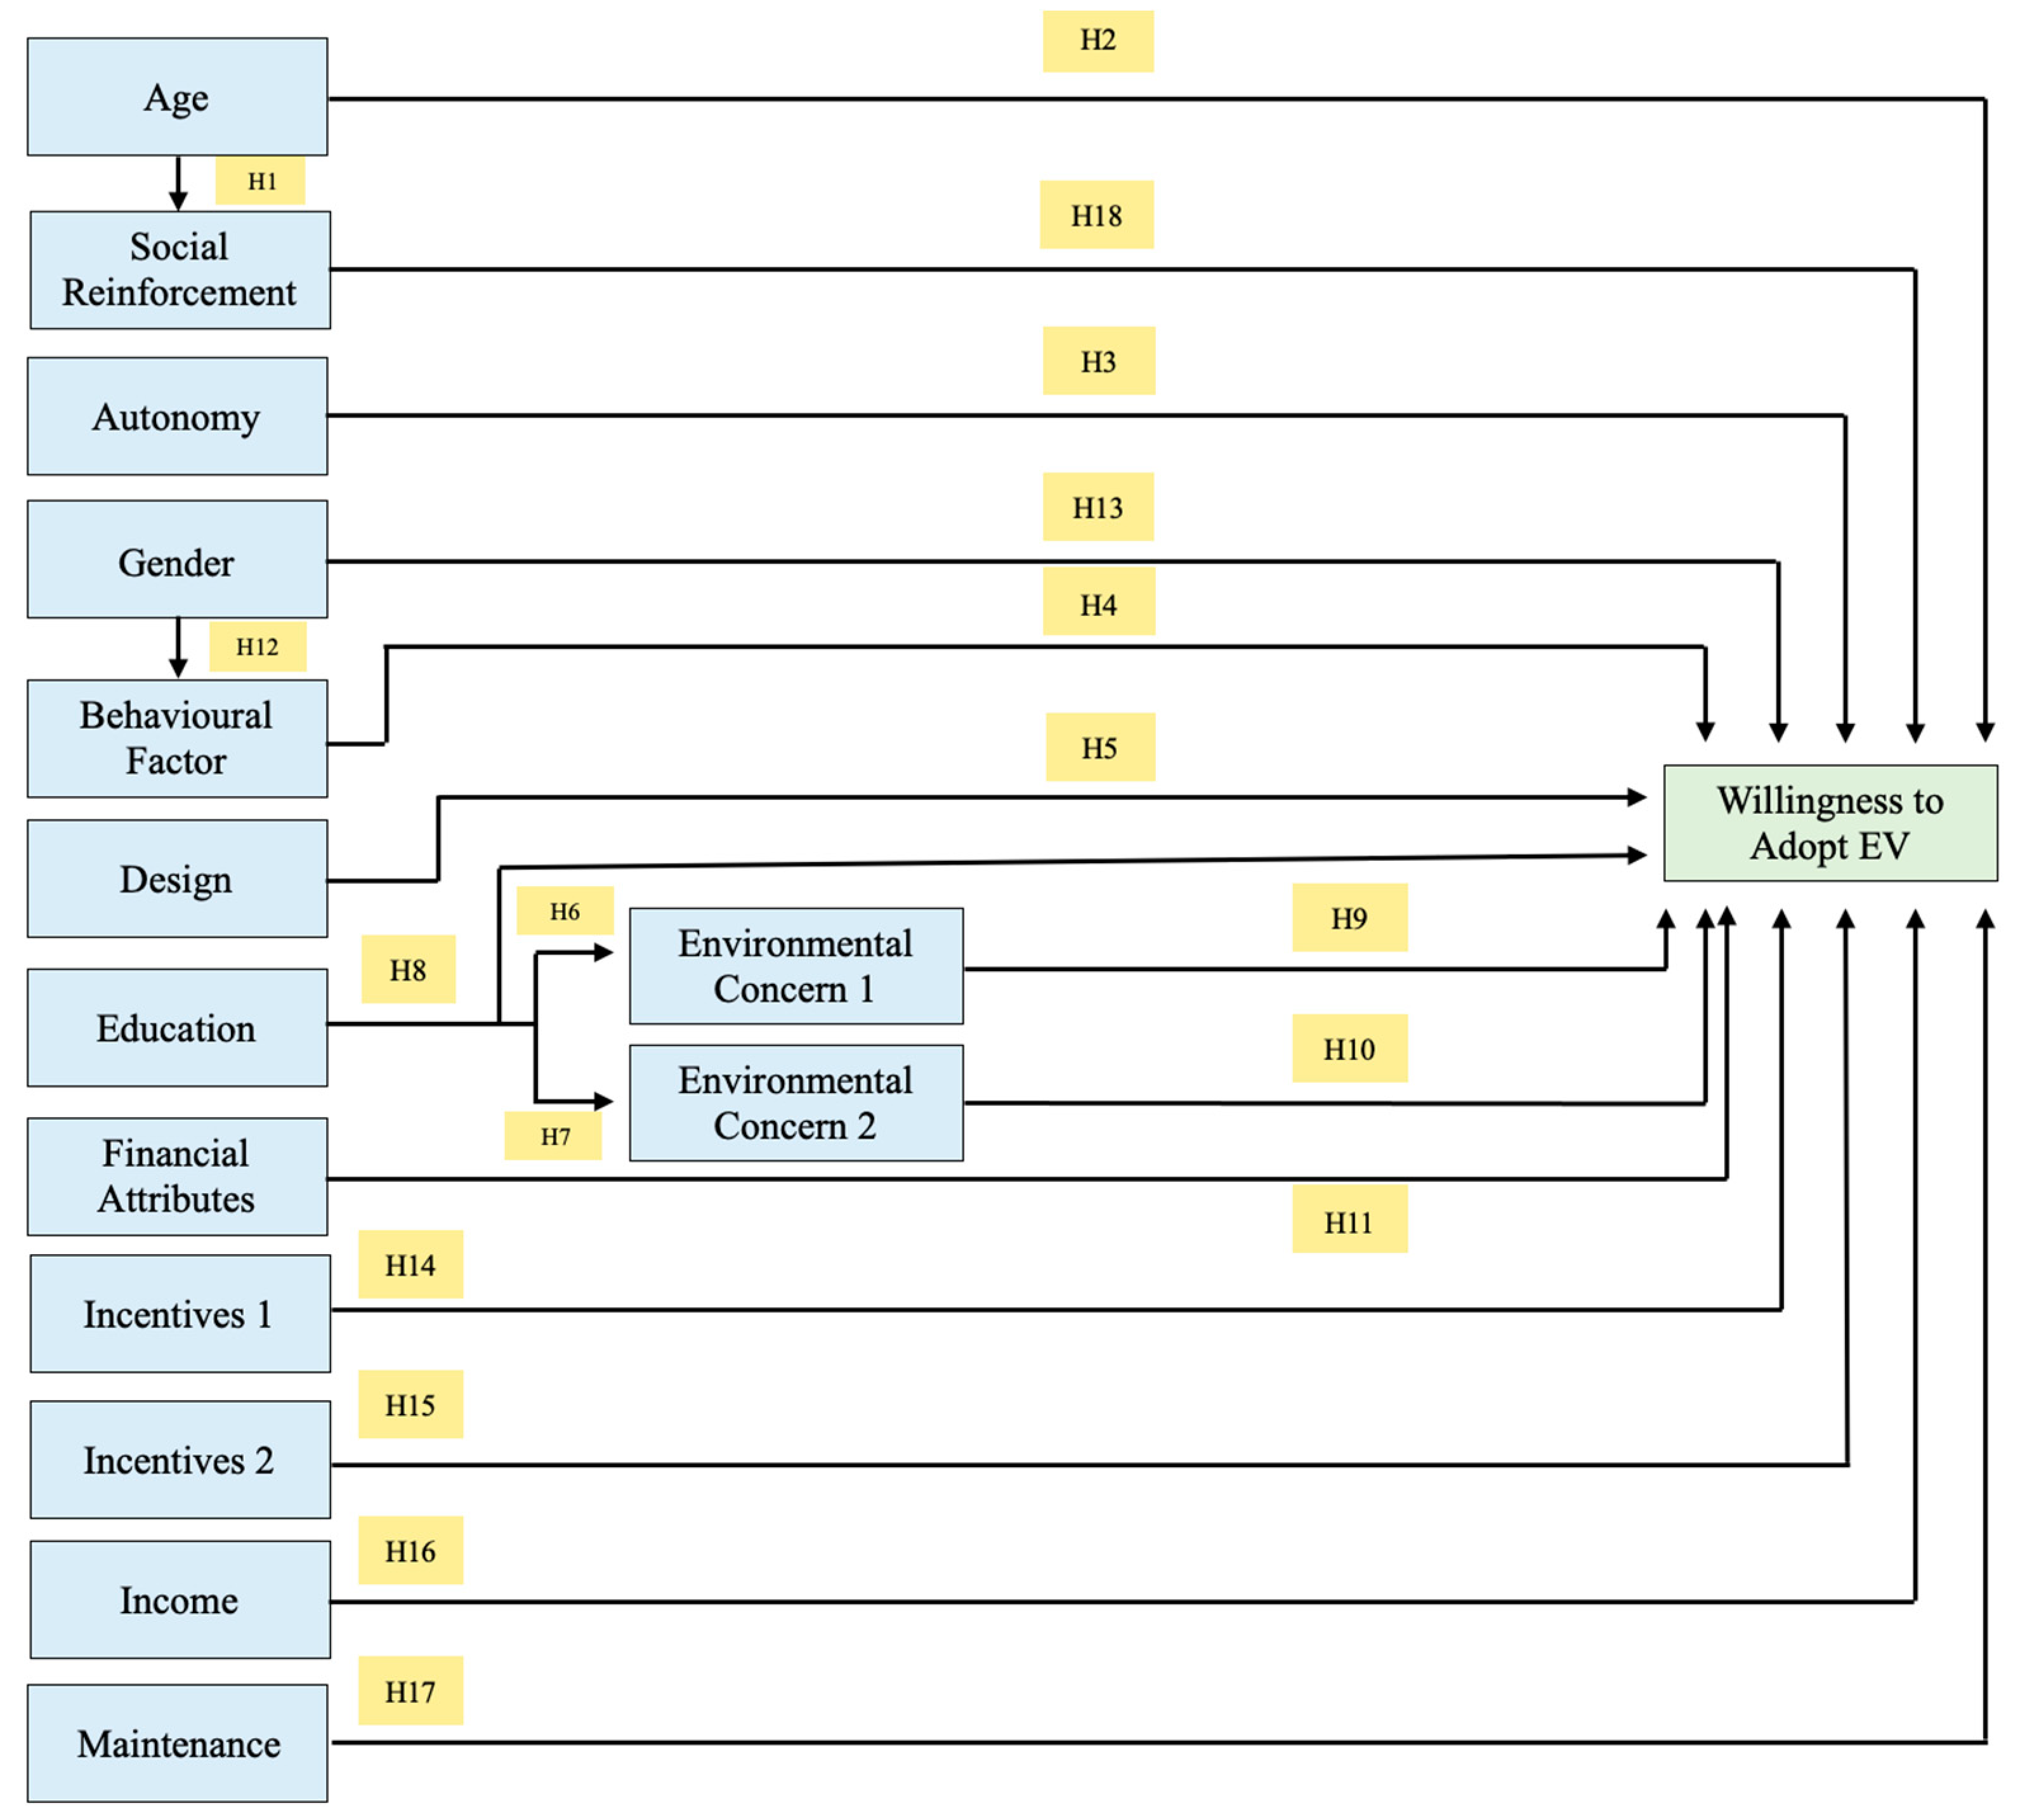
Figure 5.
Likelihood of adoption versus region.

Figure 6.
Likelihood of adoption versus employment category.
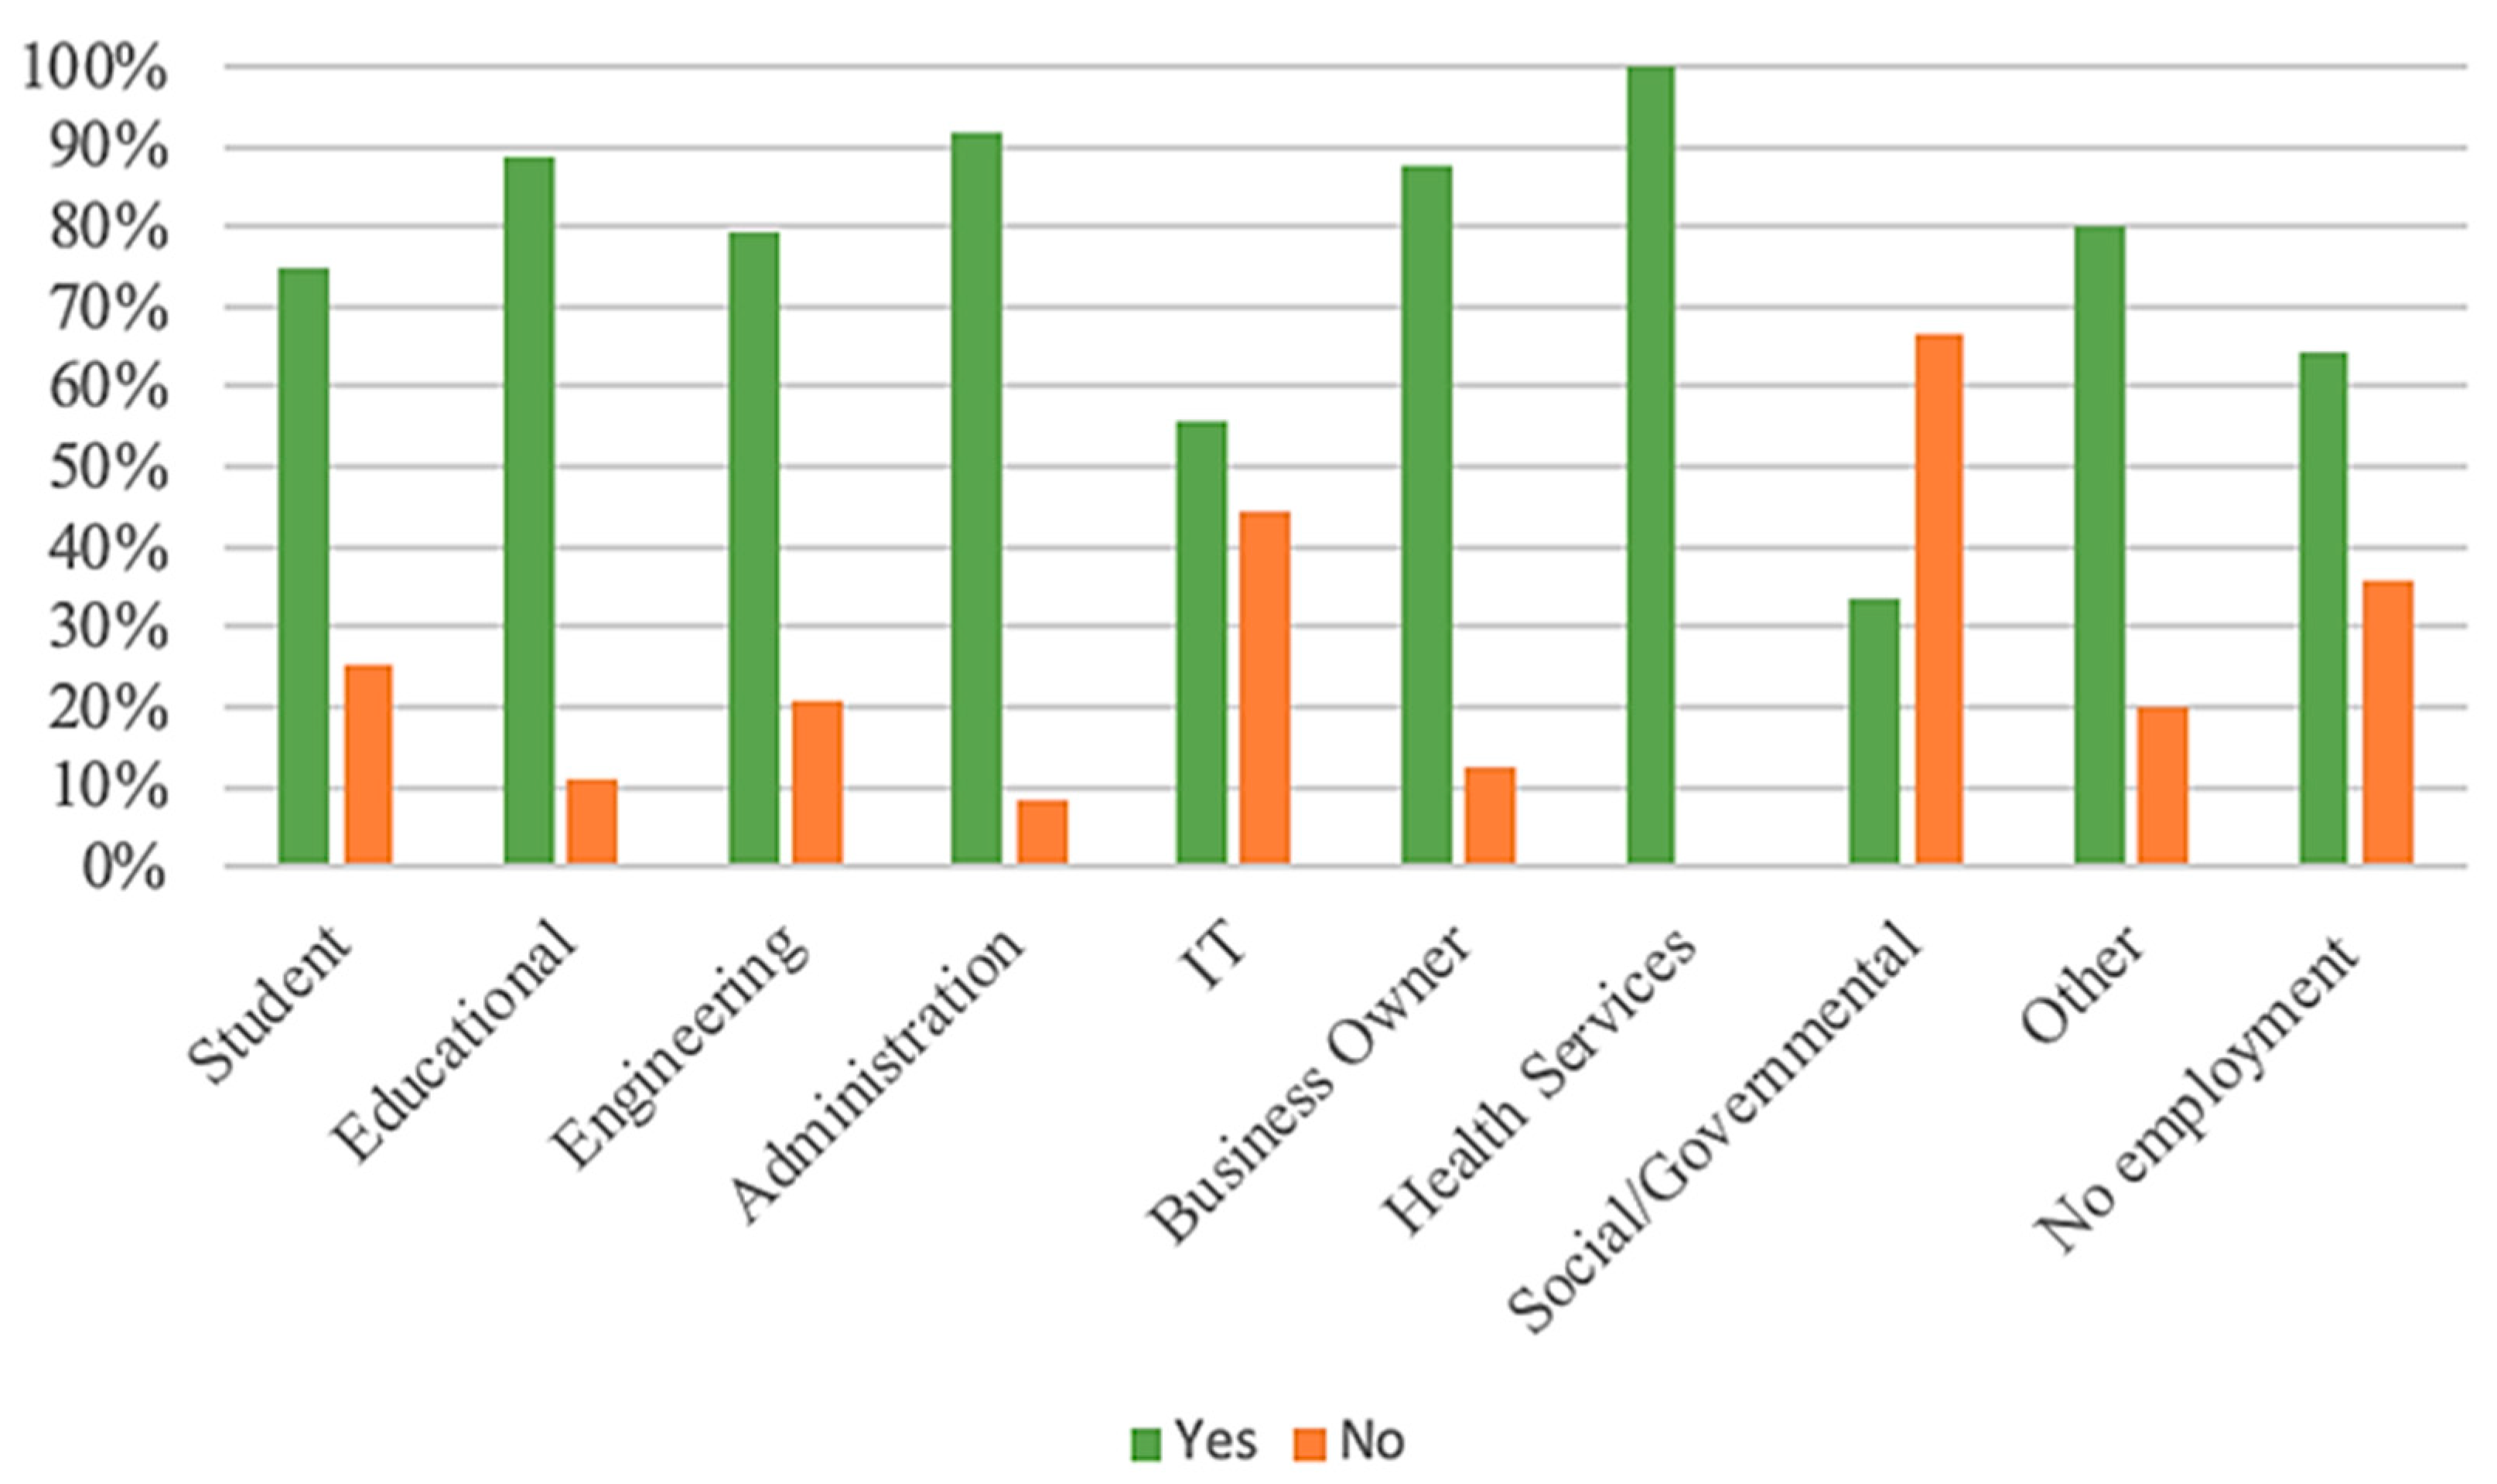
Figure 7.
Results of Behavioral Factor.
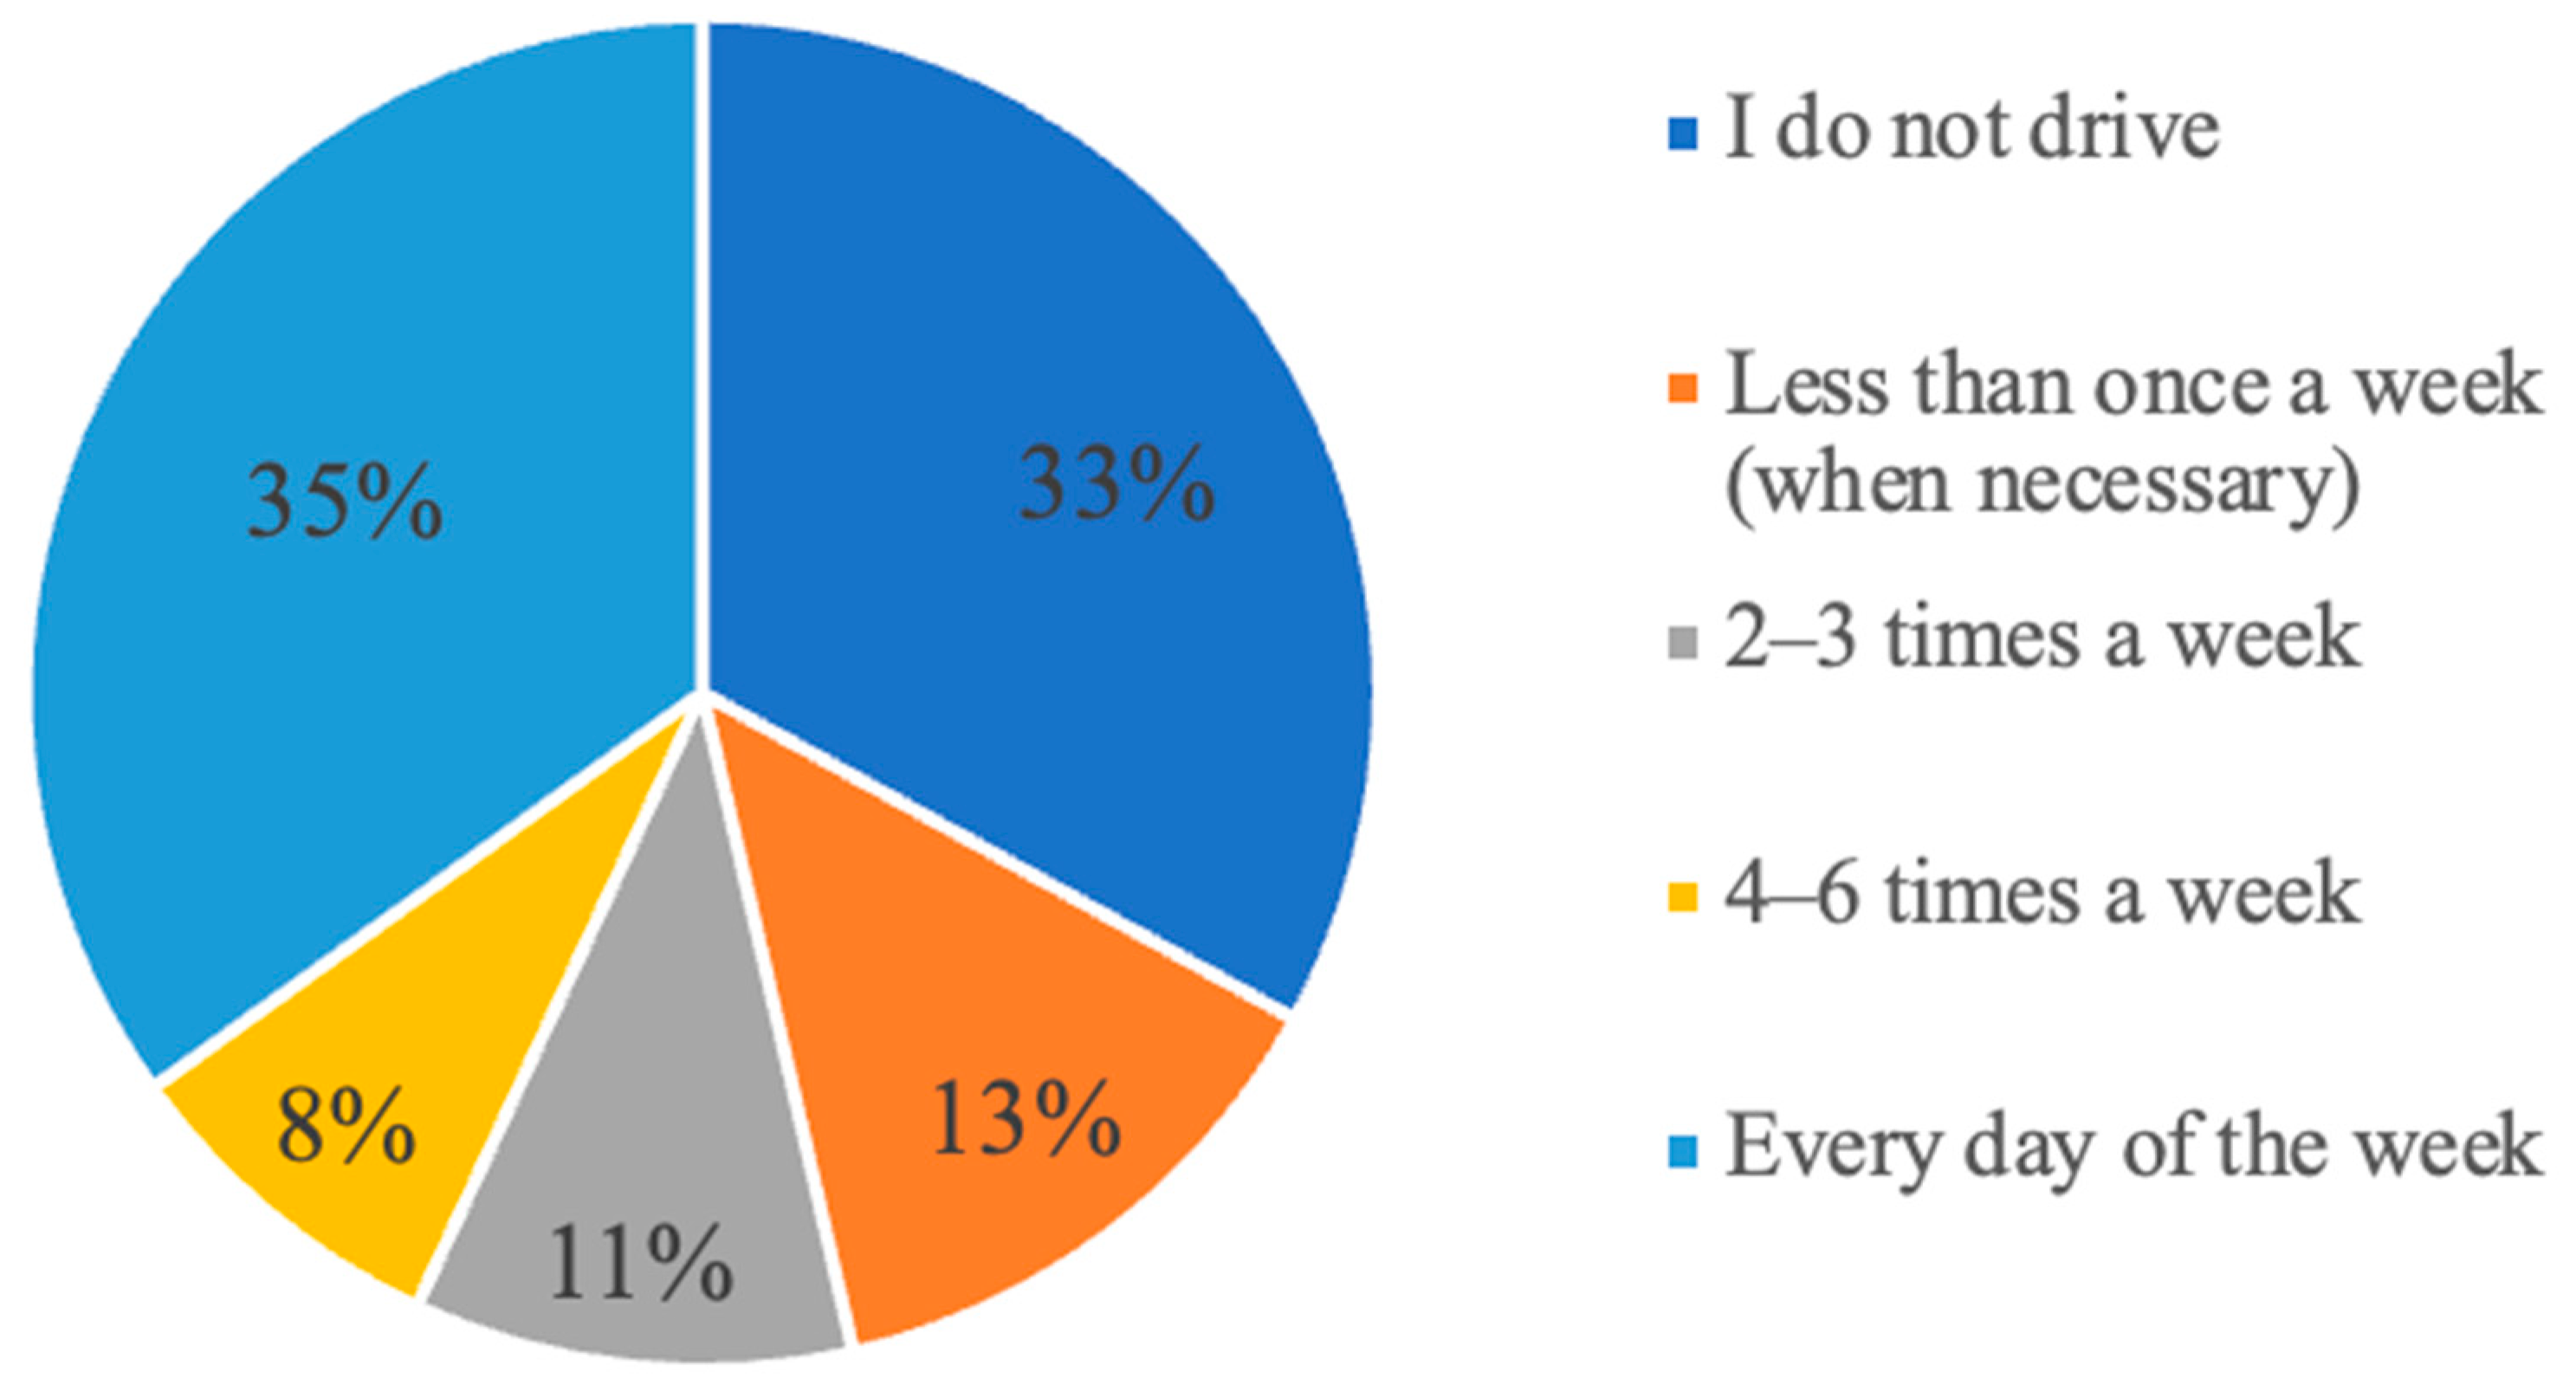
Figure 8.
Results of preconceptions of average BEV costs.
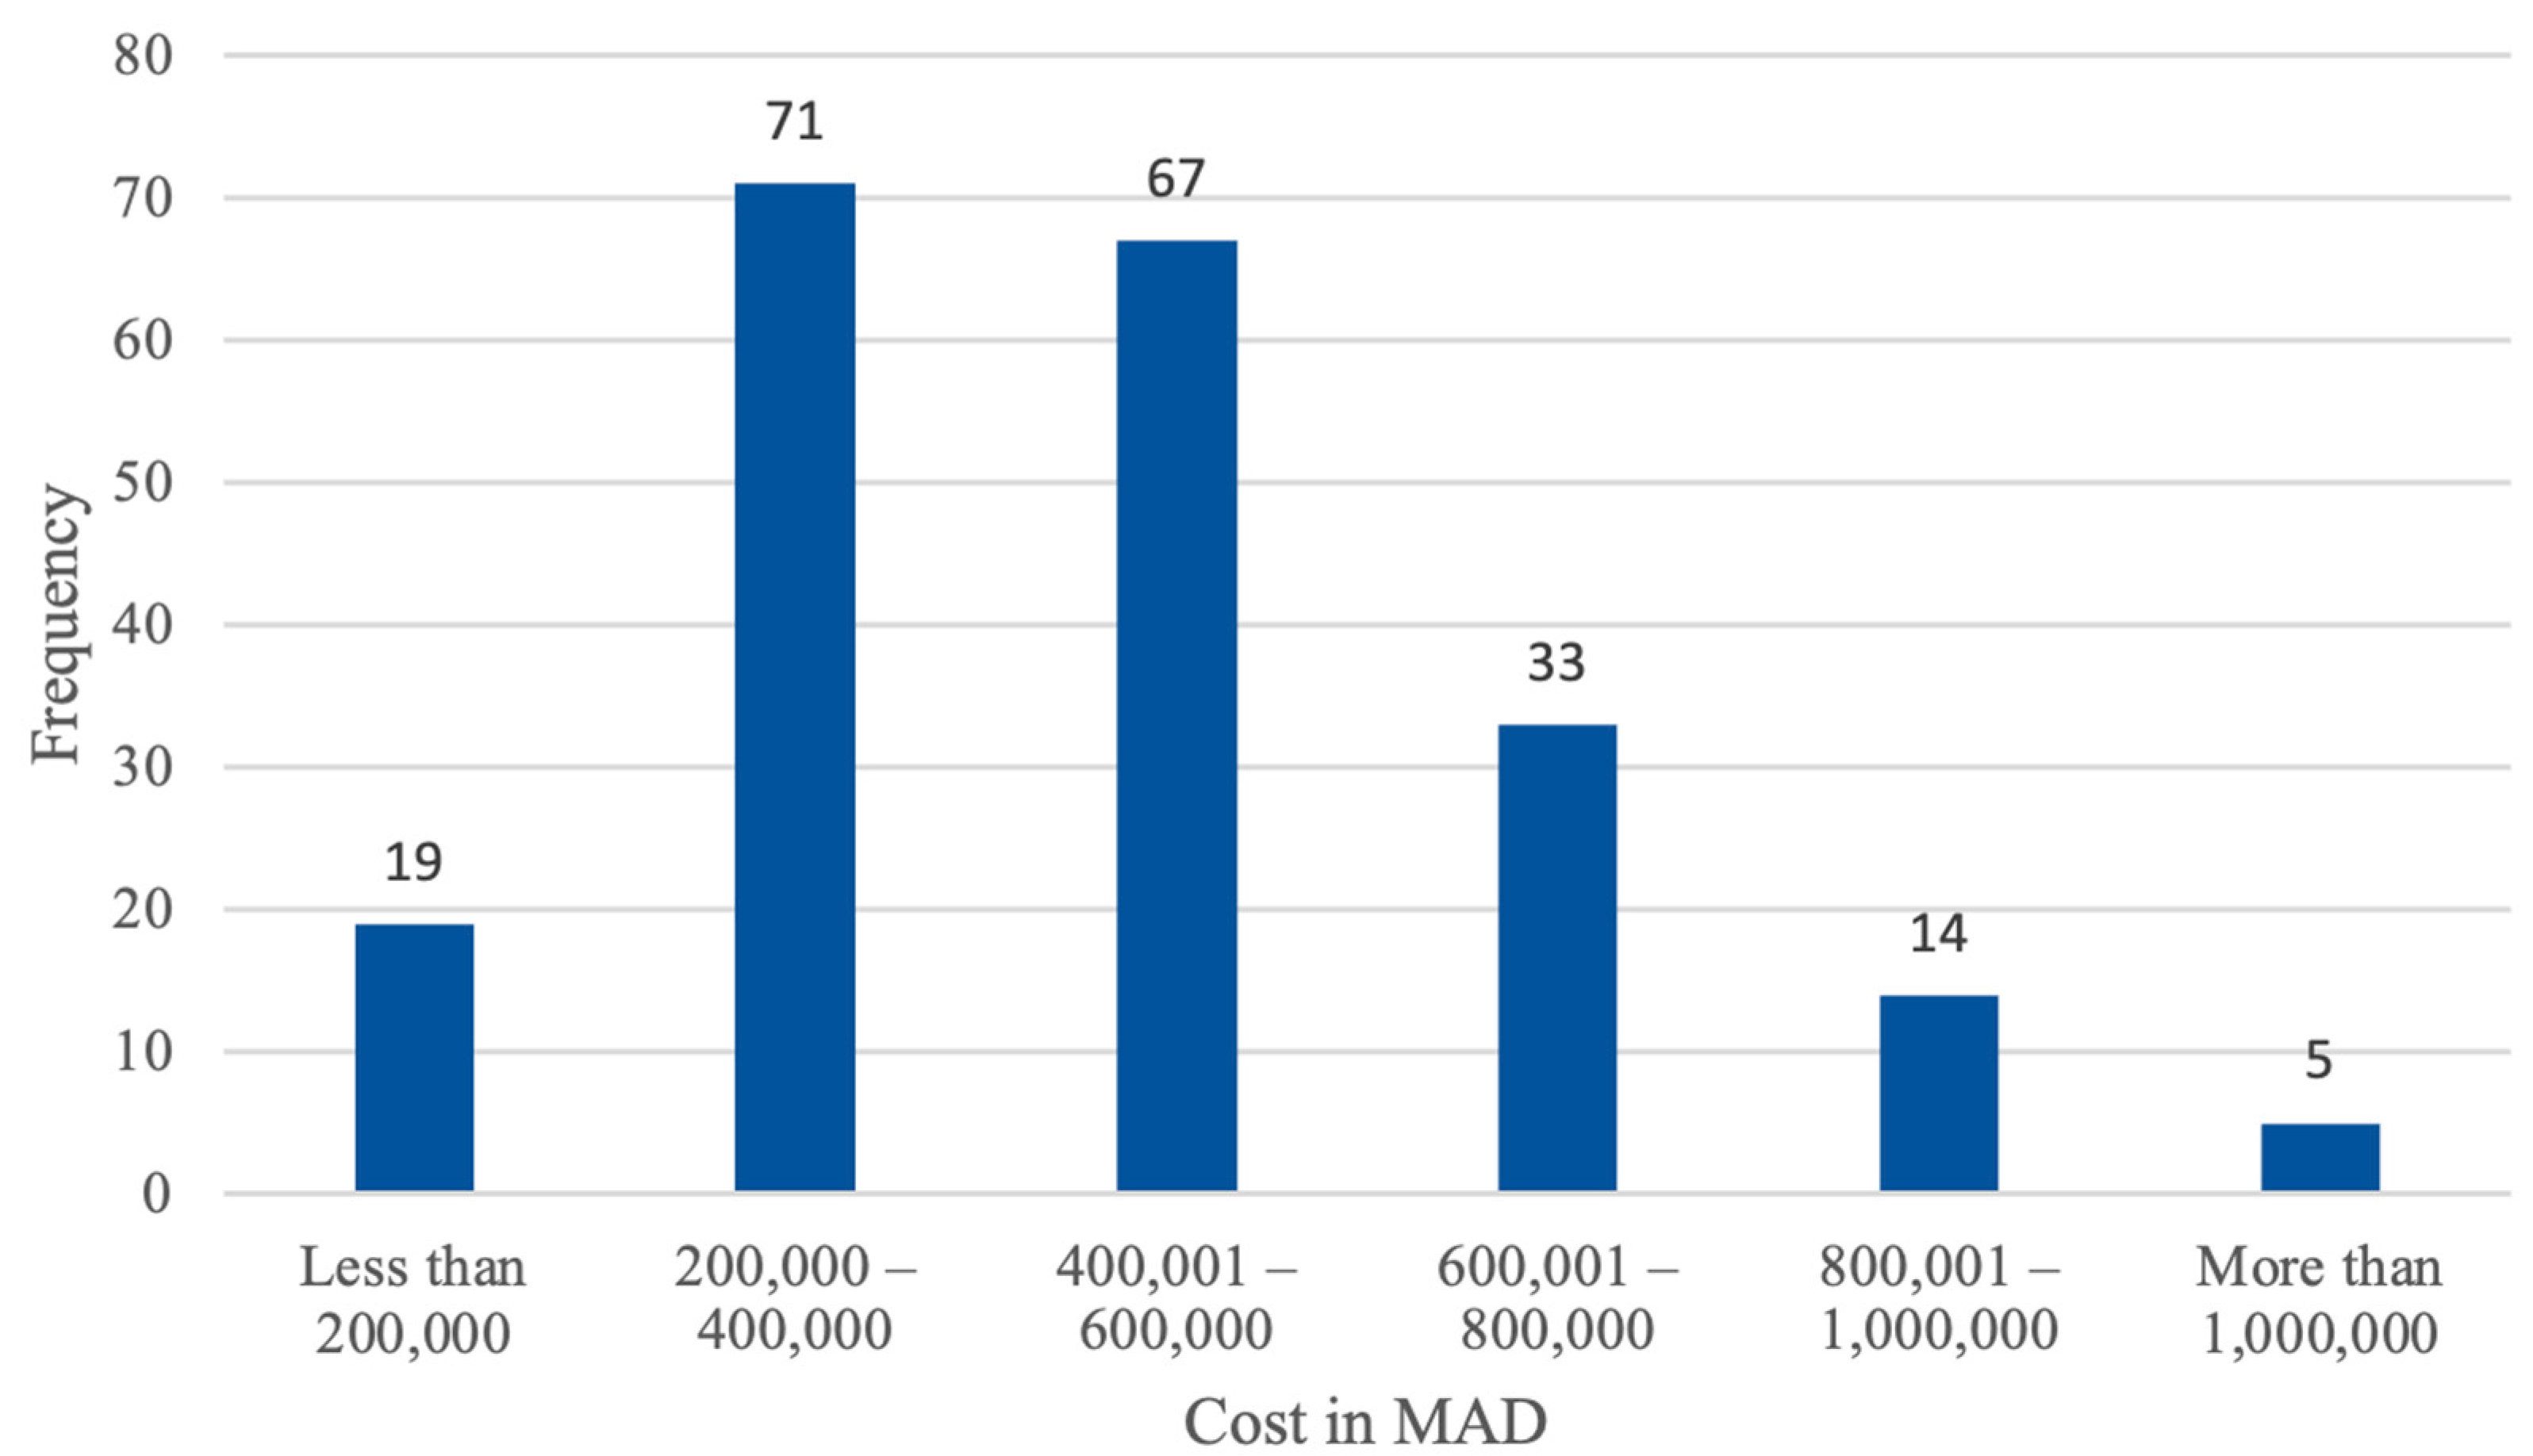
Figure 9.
Results of respondents’ maximum budget for battery electric vehicle purchase.
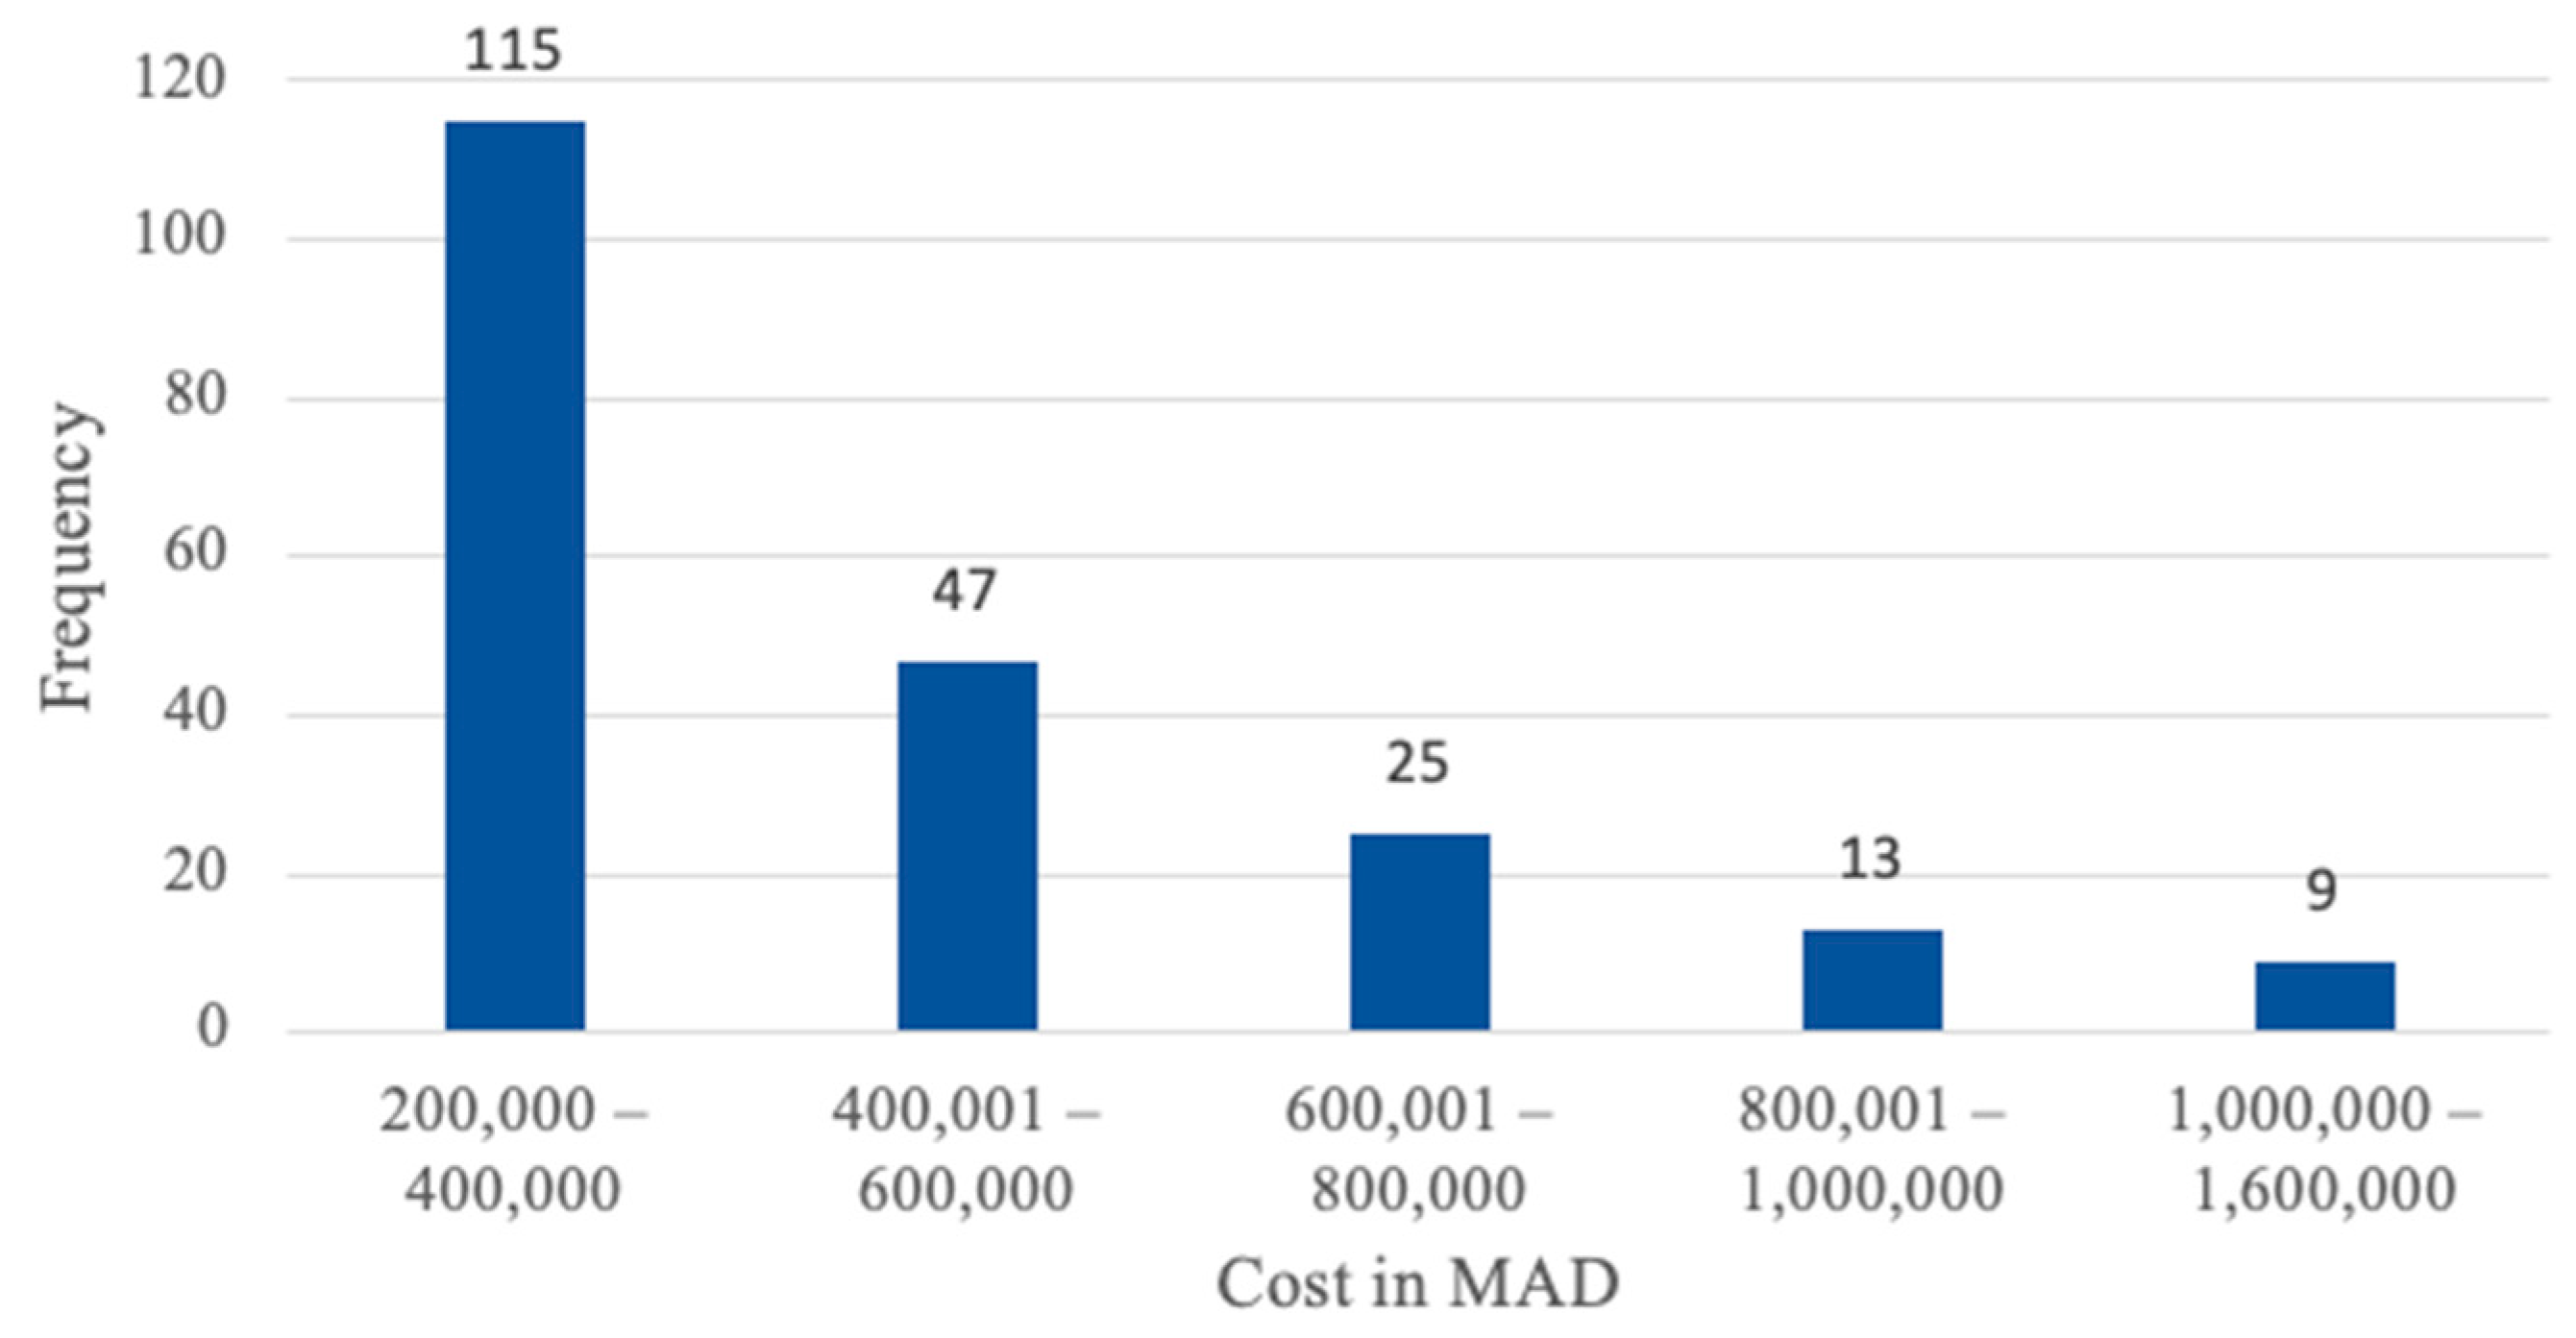
Figure 10.
Assessment of the ease of battery electric vehicle maintenance in Morocco.
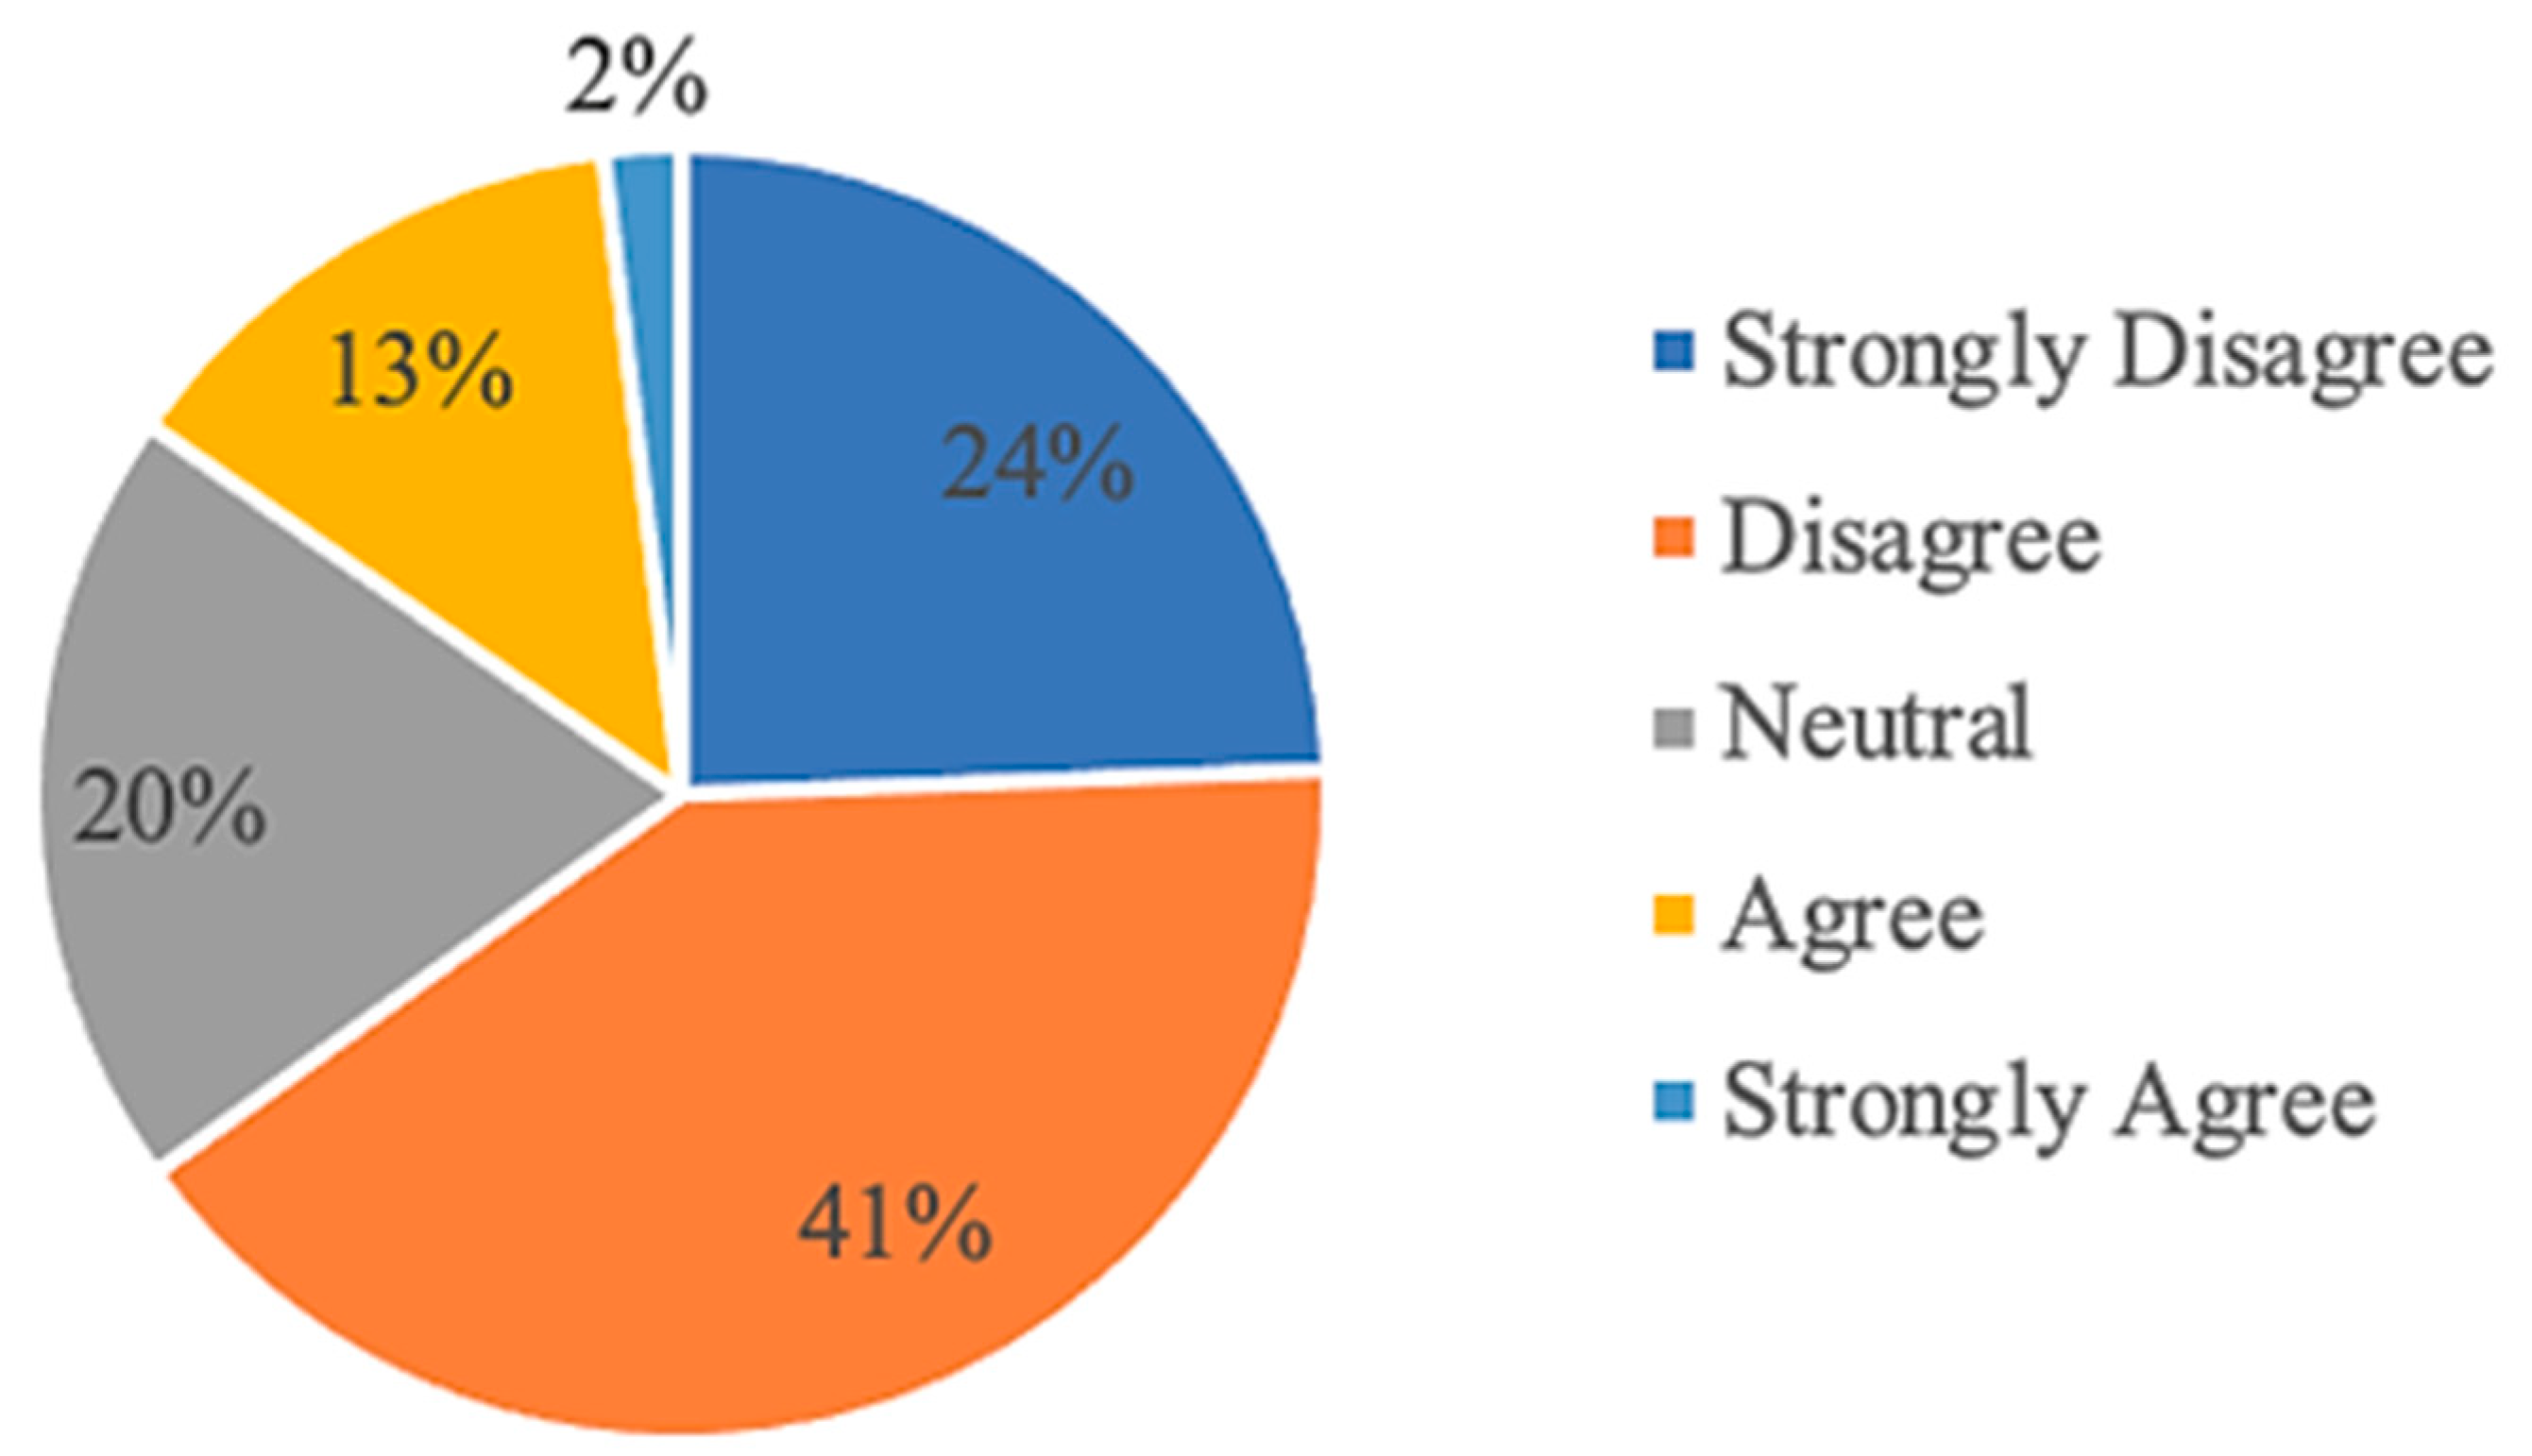
Figure 11.
Impact on social image.
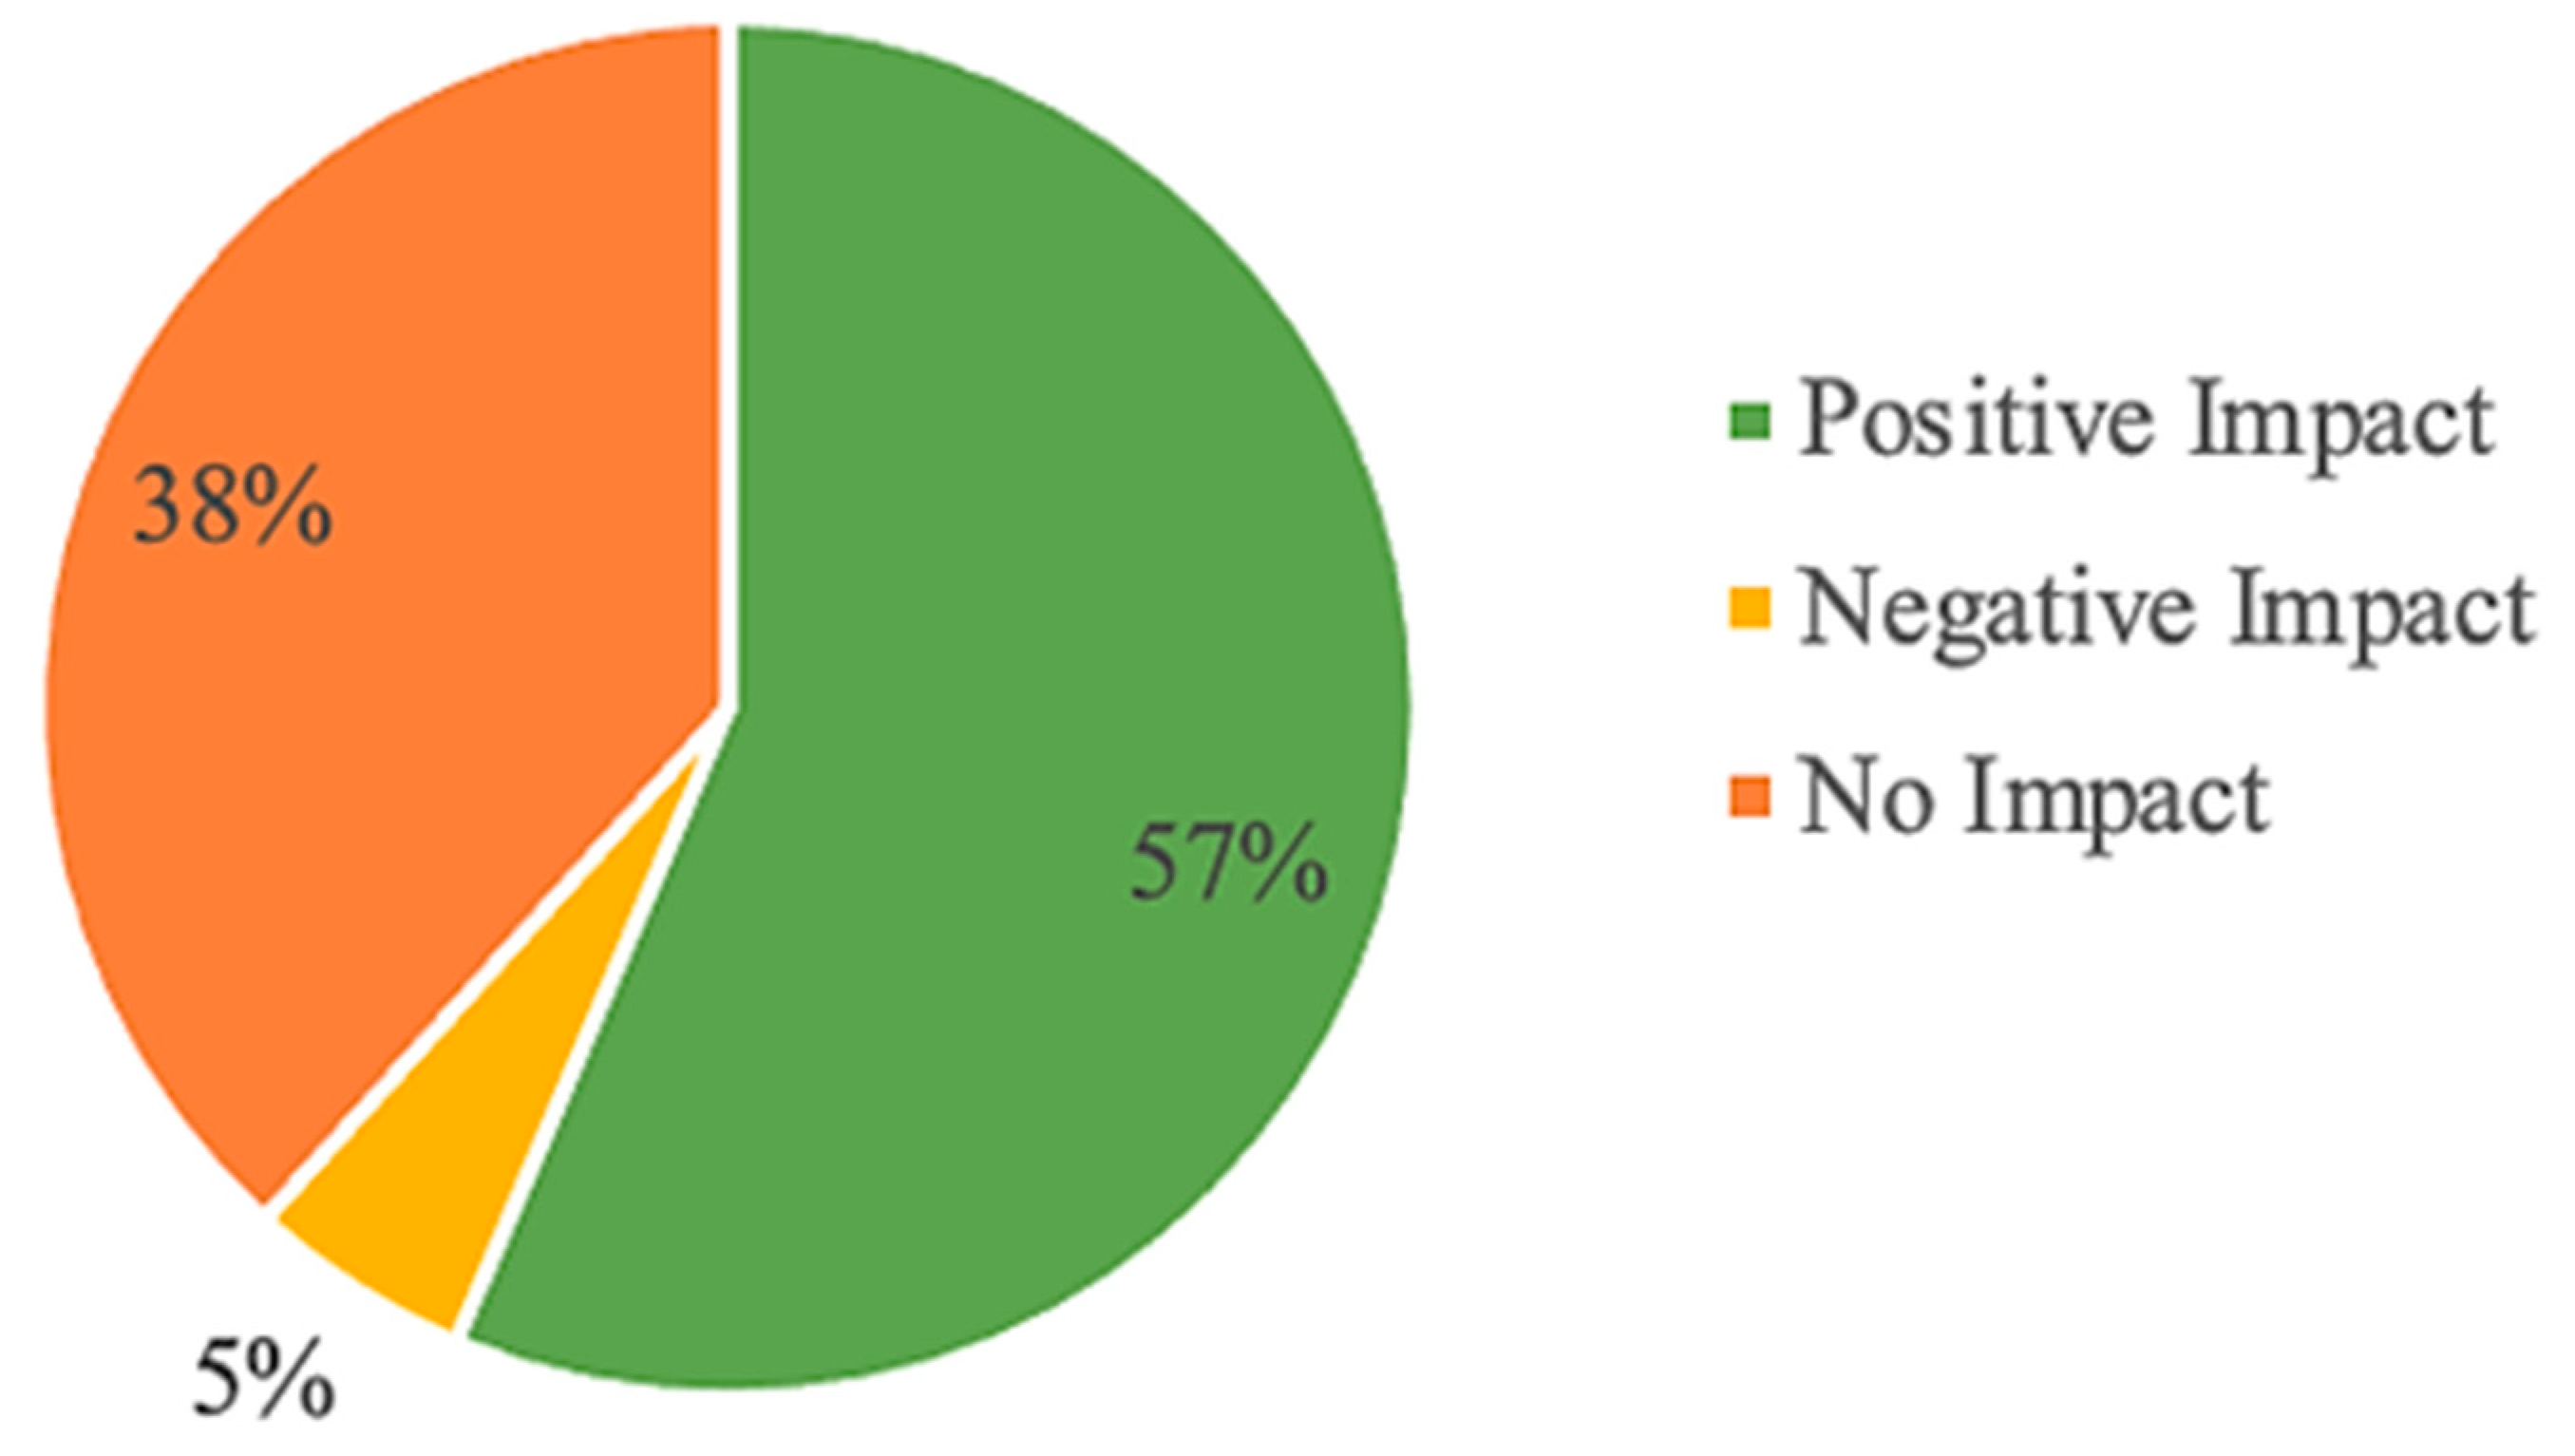
Figure 12.
Environmental importance.

Figure 13.
Governmental support needed.
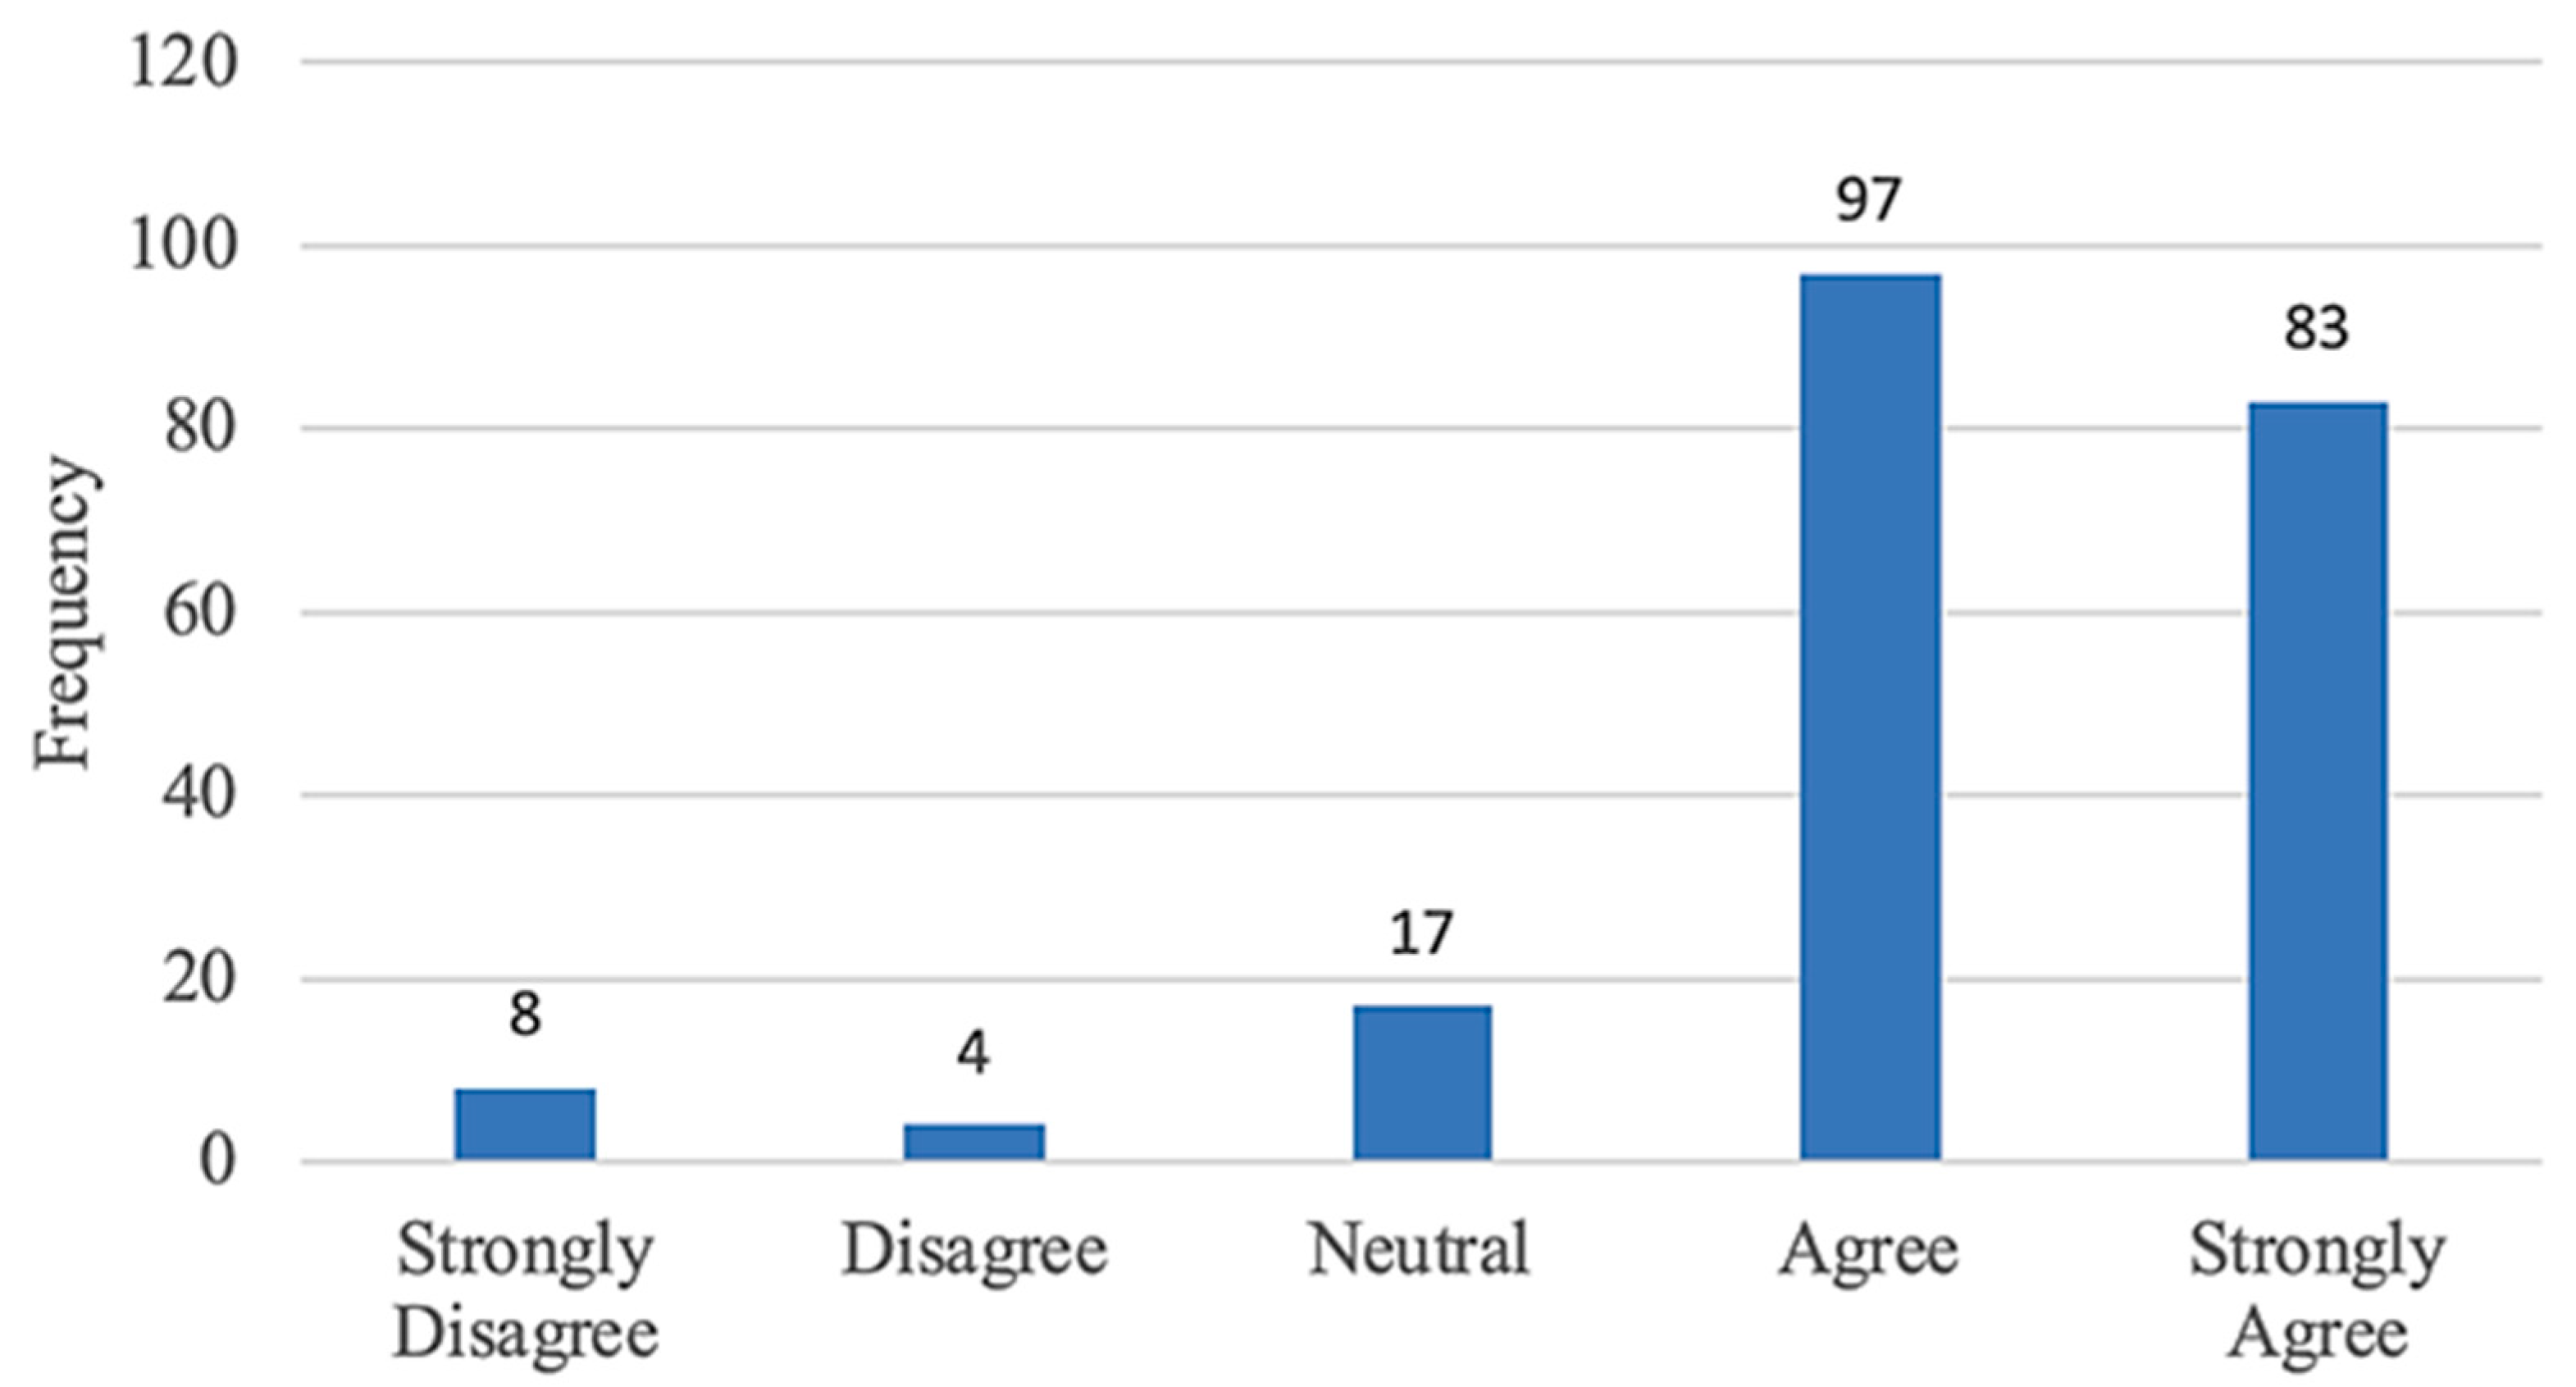
Figure 14.
Heterotrait–Monotrait ratio (HTMT) results using Smart-PLS4.
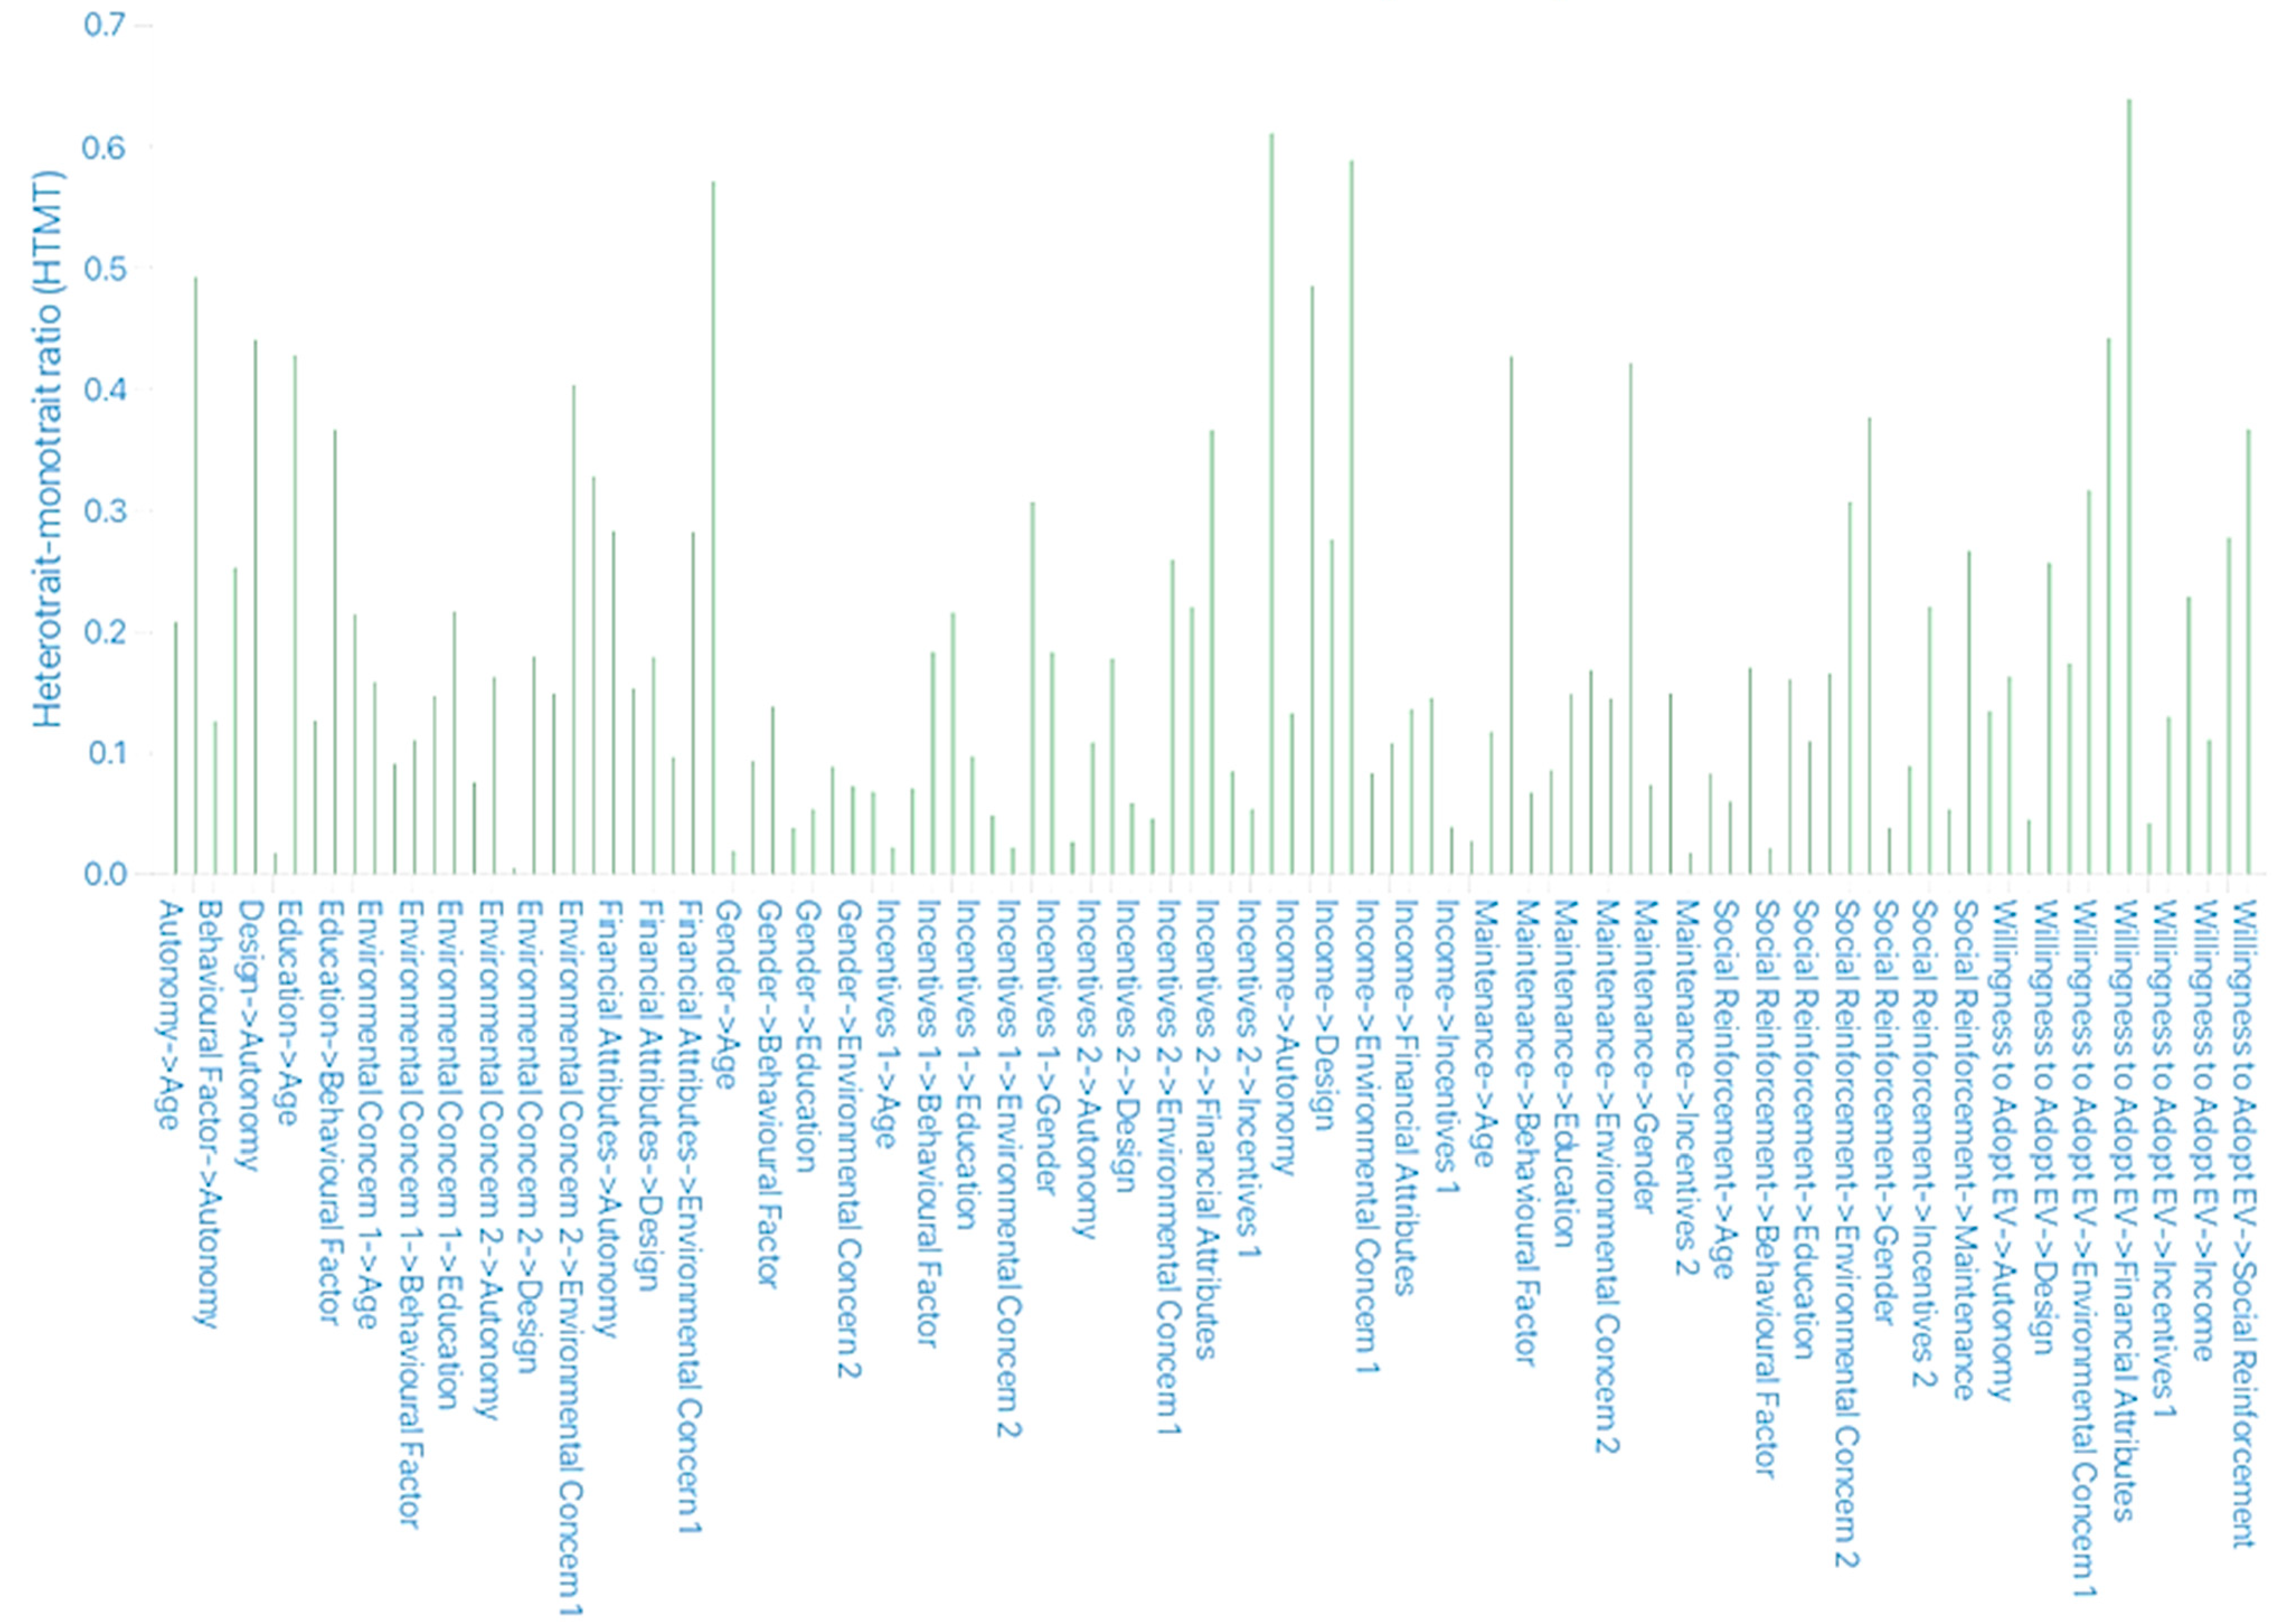
Figure 15.
Results of PLS-SEM analysis on Smart-PLS4.

Figure 16.
Importance–performance map of constructs.
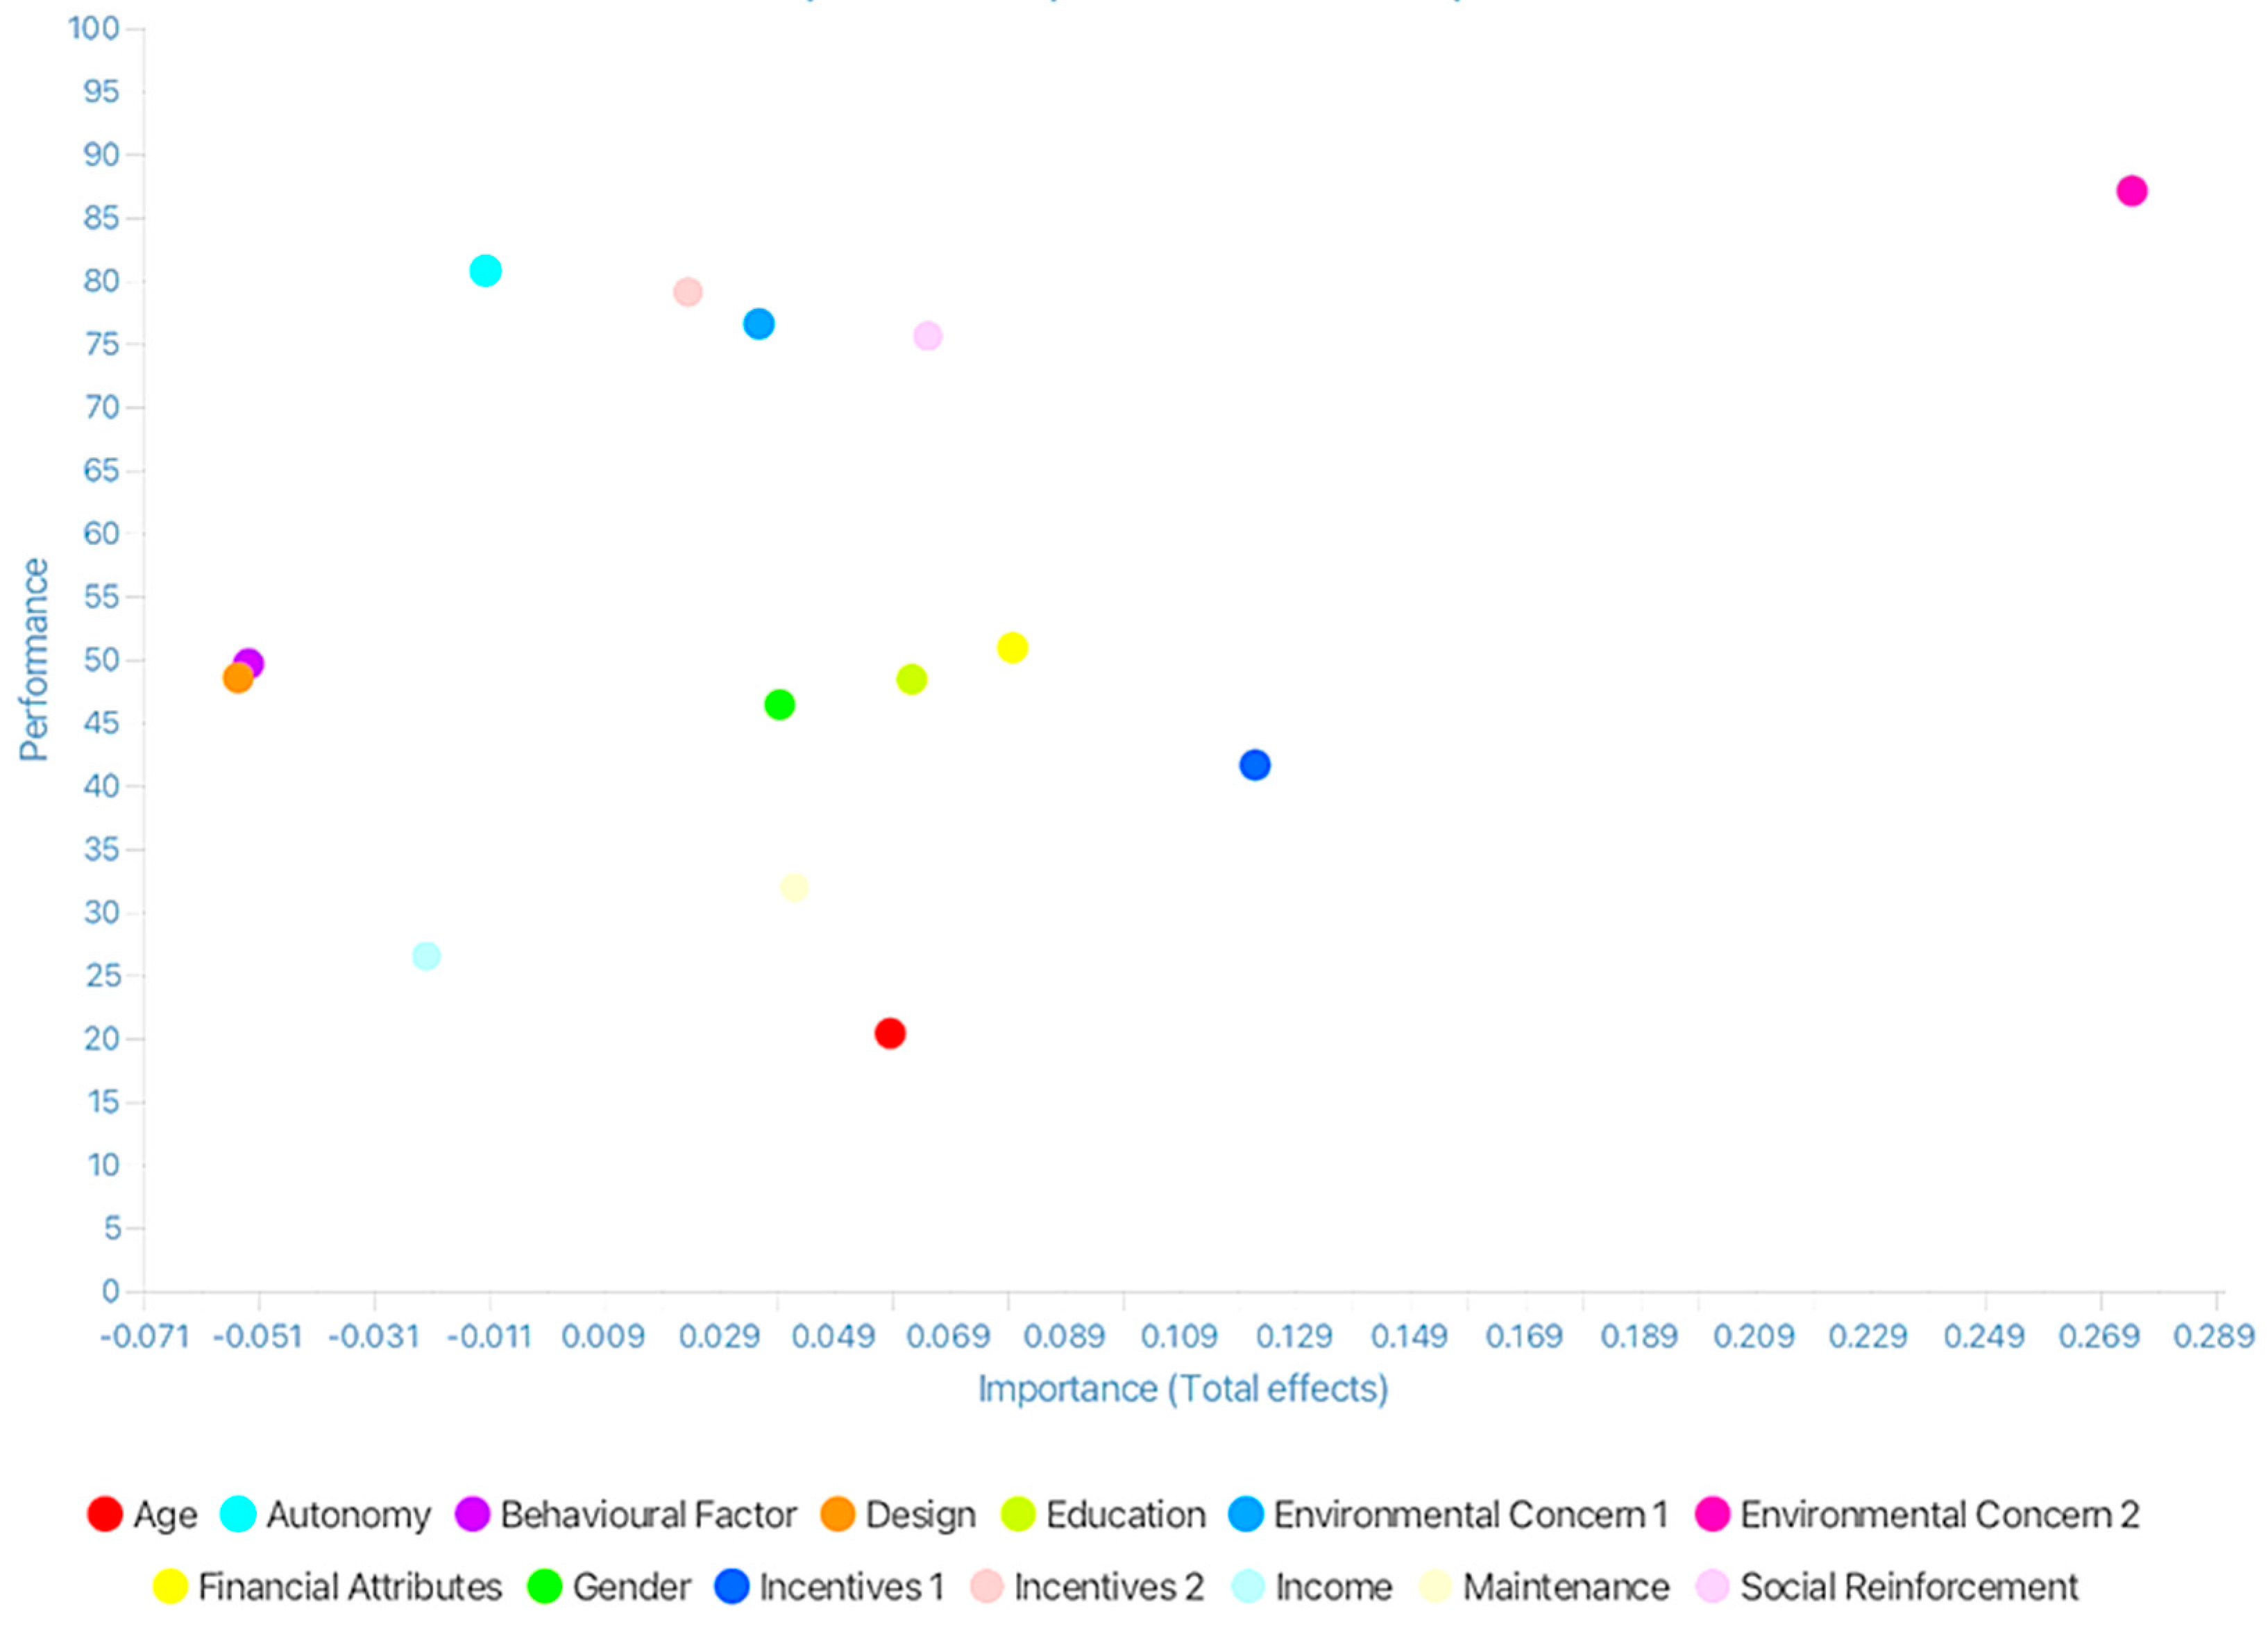

Table 1.
Moroccan Grid Reinforcement (2019–2020) [28].
Table 1.
Moroccan Grid Reinforcement (2019–2020) [28].
| Grid Reinforcement | |
|---|---|
| 2019 | 2020 |
| Installation of a third transformer of 400/225 kV | Setup of a 3-phase line of 400 kV (300 km) |
| Installation of a third autotransformer of 400/225 kV | Setup of a 3-phase line of 400 kV (300 km) |
| Setup of a 3-phase line of 400 kV (55 km) | Setup of a 3-phase line of 400 kV |
| Setup of a 3-phase line of 400 kV (400 km) | Addition of a new post of 400/225 kV |
| Replacement of a 225/60 kV transformer by a 400/225 kV transformer | |
Table 2.
Initial Constructs and Indicators of Study for Smart-PLS4.
| Constructs | Indicators/Items | Question from Survey |
|---|---|---|
| Age | Age | 2 |
| Autonomy | Aut1 | 12.1 |
| Aut2 | 12.2 | |
| Aut3 | 12.7 | |
| Behavioral Factor | BehF | 7 |
| Design | Des1 | 12.5 |
| Des2 | 12.6 | |
| Des3 | 12.8 | |
| Education | Education | 4 |
| Environmental Concern 1 | EnvC1 | 14 |
| Environmental Concern 2 | EnvC2 | 15 |
| Financial Attributes | FinA1 | 8 |
| FinA2 | 9 | |
| FinA3 | 10 | |
| FinA4 | 12.3 | |
| Gender | Gender | 1 |
| Incentive 1 | Inc1 | 16 |
| Incentive 2 | Inc2 | 17 |
| Income | Income | 6 |
| Maintenance | Maint1 | 11 |
| Maint2 | 12.3 | |
| Social Reinforcement | SocR | 13 |
| Willingness to Adopt BEVs | Will | 18 |
Table 3.
Respondents’ Demographic Profiles.
| Variables | Frequency | Percentage |
|---|---|---|
| Gender | ||
| Male | 112 | 54% |
| Female | 97 | 46% |
| Age | ||
| 18–25 | 137 | 65% |
| 26–30 | 12 | 6% |
| 31–40 | 19 | 9% |
| 41–50 | 13 | 6% |
| 60 or more | 28 | 14% |
| Educational Level | ||
| High School Diploma (Baccalaureate) | 57 | 27% |
| Baccalaureate +2 | 15 | 7% |
| Baccalaureate +3 | 11 | 5% |
| Bachelor’s Degree | 58 | 28% |
| Master’s Degree | 45 | 22% |
| Doctorate Degree | 23 | 11% |
| Monthly Income | ||
| No Income | 99 | 47% |
| MAD 3000–8000 | 41 | 20% |
| MAD 8001–13,000 | 26 | 13% |
| MAD 13,000–18,000 | 11 | 5% |
| MAD 18,001–25,000 | 9 | 4% |
| More than MAD 25,000 | 23 | 11% |
Table 4.
Question 12 Results.
| Question | Factors | Affects | Does Not Affect | I Do Not Know |
|---|---|---|---|---|
| 12.1 | Time to change | 151 | 36 | 22 |
| 12.2 | Number of available charging stations | 172 | 20 | 17 |
| 12.3 | Cost of vehicle | 150 | 39 | 20 |
| 12.4 | Maintenance | 159 | 37 | 13 |
| 12.5 | Maximum speed | 69 | 120 | 21 |
| 12.6 | Safety | 155 | 42 | 12 |
| 12.7 | Travel range of vehicle | 165 | 28 | 16 |
| 12.8 | Style and design | 126 | 68 | 15 |
Table 5.
Reliability and Validity Results for Constructs.
| Constructs | Indicators/Items | Factor Loadings | Cronbach’s Alpha | Composite Reliability (ρc) | Average Variance Extracted (AVE) |
|---|---|---|---|---|---|
| Age | Age | 1.000 | 1.000 | 1.000 | 1.000 |
| Autonomy | Aut1 | 0.894 | 0.651 | 0.787 | 0.557 |
| Aut2 | 0.664 | ||||
| Aut3 | 0.656 | ||||
| Behavioral Factor | BehF | 1.000 | 1.000 | 1.000 | 1.000 |
| Design | Des1 | 0.876 | 0.497 | 0.795 | 0.661 |
| Des3 | 0.745 | ||||
| Education | Education | 1.000 | 1.000 | 1.000 | 1.000 |
| Environmental Concern 1 | EnvC1 | 1.000 | 1.000 | 1.000 | 1.000 |
| Environmental Concern 2 | EnvC2 | 1.000 | 1.000 | 1.000 | 1.000 |
| Financial Attributes | FinA2 | 0.589 | 0.306 | 0.725 | 0.580 |
| FinA3 | 0.901 | ||||
| Gender | Gender | 1.000 | 1.000 | 1.000 | 1.000 |
| Incentive 1 | Inc1 | 1.000 | 1.000 | 1.000 | 1.000 |
| Incentive 2 | Inc2 | 1.000 | 1.000 | 1.000 | 1.000 |
| Income | Income | 1.000 | 1.000 | 1.000 | 1.000 |
| Maintenance | Maint1 | 1.000 | 1.000 | 1.000 | 1.000 |
| Maint2 | 1.000 | 1.000 | 1.000 | 1.000 | |
| Social Reinforcement | SocR | 1.000 | 1.000 | 1.000 | 1.000 |
| Willingness to Adopt EVs | Will | 1.000 | 1.000 | 1.000 | 1.000 |
Table 6.
Collinearity Statistics of Indicators (VIF) Outer Model.
| Indicators/Items | VIF |
|---|---|
| Age | 1.000 |
| Aut1 | 1.242 |
| Aut2 | 1.388 |
| Aut3 | 1.251 |
| BehF | 1.000 |
| Des1 | 1.123 |
| Des3 | |
| Education | 1.000 |
| EnvC1 | |
| EnvC2 | |
| FinA2 | 1.034 |
| FinA3 | |
| Gender | 1.000 |
| Inc1 | |
| Inc2 | |
| Income | |
| Maint1 | |
| Maint2 | |
| SocR | |
| Will |
Table 7.
Collinearity Statistics of Constructs (VIF) Inner Model.
| Path of Constructs | VIF |
|---|---|
| Age → Social Reinforcement | 1.000 |
| Age → Willingness to Adopt EV | 1.984 |
| Autonomy → Willingness to Adopt EV | 1.347 |
| Behavioral Factor → Willingness to Adopt EV | 1.701 |
| Design → Willingness to Adopt EV | 1.220 |
| Education → Environmental Concern 1 | 1.000 |
| Education → Environmental Concern 2 | 1.000 |
| Education → Willingness to Adopt EV | 1.718 |
| Environmental Concern 1 → Willingness to Adopt EV | 1.419 |
| Environmental Concern 2 → Willingness to Adopt EV | 1.483 |
| Financial Attributes → Willingness to Adopt EV | 1.358 |
| Gender → Behavioral Factor | 1.000 |
| Gender → Willingness to Adopt EV | 1.110 |
| Incentive 1 → Willingness to Adopt EV | 1.201 |
| Incentive 2 → Willingness to Adopt EV | 1.220 |
| Income → Willingness to Adopt EV | 2.259 |
| Maintenance → Willingness to Adopt EV | 1.425 |
| Social Reinforcement → Willingness to Adopt EV | 1.243 |
Table 8.
The Fornell–Larcker Criterion Results using Smart-PLS4.
| Constructs | Age | Aut | BehF | Des | Education | EnvC1 | EnvC2 | FinA | Gender | Inc 1 | Inc 2 | Income | Maint | SocR | Will |
|---|---|---|---|---|---|---|---|---|---|---|---|---|---|---|---|
| Age | 1.000 | ||||||||||||||
| Aut | −0.156 | 0.746 | |||||||||||||
| BehF | 0.492 | −0.091 | 1.000 | ||||||||||||
| Des | −0.163 | 0.249 | −0.009 | 0.813 | |||||||||||
| Education | 0.427 | −0.091 | 0.366 | −0.144 | 1.000 | ||||||||||
| EnvC1 | 0.158 | 0.047 | −0.110 | −0.059 | 0.216 | 1.000 | |||||||||
| EnvC2 | 0.075 | −0.132 | 0.005 | −0.144 | 0.148 | 0.403 | 1.000 | ||||||||
| FinA | −0.117 | −0.090 | −0.065 | 0.022 | 0.017 | 0.149 | 0.369 | 0.761 | |||||||
| Gender | 0.019 | −0.042 | −0.138 | 0.027 | −0.054 | 0.088 | 0.072 | −0.045 | 1.000 | ||||||
| Inc 1 | −0.022 | 0.067 | 0.183 | 0.145 | −0.097 | −0.048 | −0.022 | 0.164 | −0.183 | 1.000 | |||||
| Inc 2 | 0.027 | 0.082 | −0.178 | 0.003 | 0.046 | 0.259 | 0.220 | 0.224 | 0.084 | −0.054 | 1.000 | ||||
| Income | 0.611 | −0.082 | 0.485 | −0.193 | 0.588 | 0.083 | 0.108 | 0.035 | −0.145 | 0.038 | 0.027 | 1.000 | |||
| Maint | 0.117 | −0.355 | 0.067 | 0.069 | 0.148 | 0.168 | 0.145 | 0.256 | −0.073 | 0.149 | 0.018 | 0.082 | 1.000 | ||
| SocR | 0.059 | −0.117 | 0.021 | −0.122 | 0.109 | 0.165 | 0.307 | 0.217 | 0.038 | 0.089 | 0.220 | 0.053 | 0.266 | 1.000 | |
| Will | 0.134 | −0.157 | −0.045 | −0.184 | 0.174 | 0.316 | 0.442 | 0.374 | 0.042 | 0.129 | 0.229 | 0.111 | 0.277 | 0.367 | 1.000 |
Table 9.
Results of Hypotheses’ Test using Smart-PLS4.
| Hypothesis | Path of Constructs | Hypothesis Test | |||
|---|---|---|---|---|---|
| Path Coefficient | p-Value | t-Statistic | Results | ||
| H1 | Age → SocR | 0.059 | 0.339 | 0.956 | Not supported |
| H2 | Age → Will | 0.055 | 0.116 | 1.574 | Not supported |
| H3 | Aut → Will | −0.011 | 0.624 | 0.491 | Not supported |
| H4 | BehF → Will | −0.052 | 0.118 | 1.563 | Not supported |
| H5 | Des → Will | −0.054 | 0.036 | 2.094 | Supported |
| H6 | Education → EnvC1 | 0.216 | 0.000 | 3.506 | Supported |
| H7 | Education → EnvC2 | 0.050 | 0.031 | 2.154 | Supported |
| H8 | Education → Will | 0.041 | 0.202 | 1.276 | Not supported |
| H9 | EnvC1 → Will | 0.036 | 0.244 | 1.164 | Not supported |
| H10 | EnvC2 → Will | 0.275 | 0.015 | 2.426 | Supported |
| H11 | FinA → Will | 0.080 | 0.006 | 2.767 | Supported |
| H12 | Gender → BehF | −0.276 | 0.047 | 1.989 | Supported |
| H13 | Gender → Will | 0.025 | 0.617 | 0.500 | Not supported |
| H14 | Inc1 → Will | 0.122 | 0.010 | 2.592 | Supported |
| H15 | Inc2 → Will | 0.024 | 0.395 | 0.850 | Not supported |
| H16 | Income → Will | −0.022 | 0.587 | 0.543 | Not supported |
| H17 | Maint → Will | 0.042 | 0.111 | 1.594 | Not supported |
| H18 | SocR → Will | 0.066 | 0.027 | 2.210 | Supported |
Disclaimer/Publisher’s Note: The statements, opinions and data contained in all publications are solely those of the individual author(s) and contributor(s) and not of MDPI and/or the editor(s). MDPI and/or the editor(s) disclaim responsibility for any injury to people or property resulting from any ideas, methods, instructions or products referred to in the content. |
© 2023 by the authors. Licensee MDPI, Basel, Switzerland. This article is an open access article distributed under the terms and conditions of the Creative Commons Attribution (CC BY) license (https://creativecommons.org/licenses/by/4.0/).
Share and Cite
MDPI and ACS Style
Nasreddin, D.; El Hafdaoui, H.; Jelti, F.; Boumelha, A.; Khallaayoun, A. Inhibitors of Battery Electric Vehicle Adoption in Morocco. World Electr. Veh. J. 2024, 15, 6. https://doi.org/10.3390/wevj15010006
AMA Style
Nasreddin D, El Hafdaoui H, Jelti F, Boumelha A, Khallaayoun A. Inhibitors of Battery Electric Vehicle Adoption in Morocco. World Electric Vehicle Journal. 2024; 15(1):6. https://doi.org/10.3390/wevj15010006
Chicago/Turabian StyleNasreddin, Dalal, Hamza El Hafdaoui, Faissal Jelti, Aya Boumelha, and Ahmed Khallaayoun. 2024. "Inhibitors of Battery Electric Vehicle Adoption in Morocco" World Electric Vehicle Journal 15, no. 1: 6. https://doi.org/10.3390/wevj15010006