Article

Prospects of Passenger Vehicles in China to Meet Dual Carbon Goals and Bottleneck of Critical Materials from a Fleet Evolution Perspective

1
Center for Energy and Environmental Policy Research, Beijing Institute of Technology, Beijing 100081, China
2
School of Management and Economics, Beijing Institute of Technology, Beijing 100081, China
3
China Automotive Technology and Research Center Co., Ltd., Tianjin 300300, China
4
Volkswagen (China) Investment Co., Ltd., Beijing 100020, China
*
Author to whom correspondence should be addressed.
World Electr. Veh. J. 2024, 15(1), 14; https://doi.org/10.3390/wevj15010014
Submission received: 8 November 2023 / Revised: 12 December 2023 / Accepted: 15 December 2023 / Published: 2 January 2024

Abstract

:
China has pledged to peak its CO2 emissions by 2030 and achieve carbon neutrality by 2060. To meet these goals, China needs to accelerate the electrification of passenger vehicles. However, the rapid development of electric vehicles may impact the supply of critical raw materials, which may hinder the low-carbon transition. Therefore, the impact of vehicle electrification on CO2 emissions and the corresponding bottlenecks in the supply of critical raw materials should be systematically considered. In this study, we developed the China Automotive Fleet CO2 Model (CAFCM) to simulate a mixed-technology passenger vehicle fleet evolution. We further assessed the impact of energy and CO2 emissions and evaluated the demand for critical battery materials. We designed three scenarios with different powertrain type penetration rates to depict the potential uncertainty. The results showed that (1) the CO2 emissions of passenger vehicles in both the operation stage and the fuel cycle can peak before 2030; (2) achieving the dual carbon goals will lead to a rapid increase in the demand for critical raw materials for batteries and lead to potential supply risks, especially for cobalt, with the cumulative demand for cobalt for new energy passenger vehicles in China being 5.7 to 7.3 times larger than China’s total cobalt reserves; and (3) the potential amount of critical material recycled from retired power batteries will rapidly increase but will not be able to substantially alleviate the demand for critical materials before 2035. China’s new energy vehicle promotion policies and key resource supply risks must be systematically coordinated under the dual carbon goals.

1. Introduction

To cope with climate change and its negative impacts, the 2015 Paris Agreement set long-term goals that included limiting the global temperature increase to 2 °C by the year 2100 and striving to limit the rise even further to 1.5 °C [1]. Against this background, China pledged to strive to peak its CO2 emissions by 2030 and achieve carbon neutrality by 2060 (dual carbon goals) [2]. In response, all relevant central government departments and local governments have actively studied and formulated development paths and implementation plans by fields, industries, and regions, which include putting forward overall requirements for the green and low-carbon development of the Chinese automobile industry [3].
The responsibility boundary regarding CO2 emissions from the automobile industry can be preliminarily defined as including the automobile operation stage (pump-to-wheel stage) and manufacturing stage based on the Intergovernmental Panel on Climate Change (IPCC) principle of “whoever emits is responsible”. In China, 900 million tons of CO2 emissions are emitted from the automobile operation stage and close to 80 million tons from the automobile manufacturing stage, which means the automobile operation stage is the focus of control. The CO2 emitted during the operation stage of passenger vehicles accounts for about half of the total CO2 emissions of automobiles [4]. The annual gasoline consumption of passenger vehicles accounts for more than 95% of China’s total gasoline consumption [4]. However, the stock of passenger vehicles in China is still growing [5,6], so their annual total CO2 emissions have the potential to grow. Hence, passenger vehicle fuel consumption and CO2 emissions must be curbed in China [7].
China has mainly adopted two paths to limit CO2 emissions from the operation stage of passenger vehicles in the current regulations and policies: (1) improving the energy efficiency of new passenger vehicles, with China setting the long-term average fuel consumption rate target of 4.0 L/100 km by 2030 for new passenger vehicles (including conventional and new energy vehicles (NEVs)) [8] and (2) increasing the penetration rate of NEVs, with the target market penetration rate of NEVs set to about 20% in 2025 [9].
However, the fuel consumption target (4 L/100 km) of passenger vehicles in 2025 does not reflect the constraints of the dual carbon goals because the target was proposed prior to the establishment of the dual carbon goal. In addition, the rapid development of vehicle electrification may result in supply–demand imbalance for some critical raw materials, including lithium, cobalt, and nickel [10]. Therefore, understanding passenger vehicle fleet evolution, further assessing vehicle fleet CO2 emissions and their potential risks, and proposing mitigation measures are crucial for future policymaking under the dual carbon goals.
Due to the critical role played by road transport in energy security and climate change, many researchers have paid attention to projecting vehicle fleet energy use and CO2 emissions. Lyu et al. [11] developed two alternative energy scenarios: business as usual (BAU) and integrated policy scenario (IPS). Using the Tsinghua China Automotive Energy Model (TCAEM), the automotive energy consumption and greenhouse gas (GHG) emissions in China were projected for 2050. For Japan, González Palencia et al. [12] developed a two-step approach to assess the optimum market penetration rate of lightweight and electric vehicles. Osei et al. [13] evaluated the real-world impacts of fleet evolution by replacing the existing fleet with electric vehicles and more efficient vehicles in West Midlands, U.K. The above studies all focused on vehicle electrification as the most crucial technological path to control fleet carbon emissions in the future. Unlike Lyu et al. [11], González Palencia et al. [12], and Osei et al. [13], the model we constructed comprehensively considers alternative energy scenarios, market penetration rate, and the real-world impacts of fleet evolution. By setting reasonable input and output variables, the aspects mentioned above are cleverly combined. Thus, systematic consideration of the uncertainty of the election path due to constraints, such as the supply of key raw materials, can be achieved. Furthermore, due to more detailed ownership data (including gasoline vehicles, diesel vehicles, PHEVs, BEVs, and FCEVs), the granularity of the model we constructed is finer compared to the methods mentioned above, allowing more accurate predictions of sales for various powertrain types of new energy vehicles.
Vehicle electrification requires sufficient lithium-ion batteries, and sustainability in the lithium-ion battery industry requires a secure supply of raw materials [14,15,16]. The potential imbalance between the supply and demand of critical raw materials required for batteries is one of the most vital risks in vehicle electrification. Olivetti et al. [17] projected the raw material supply and demand for lithium-ion batteries to 2025. They found that demand may outpace supply for cobalt and even lithium in the short term if electric vehicles are rapidly adopted. Ou et al. [18] quantified the potential impacts of vehicle market dynamics under different technology evolution scenarios. The results showed that the lithium supply is unlikely to limit vehicle electrification in the short term. However, the supply pressure on cobalt and nickel is higher. The above analysis is mainly based on forward market simulation considering constraints regarding vehicle technologies, consumer behavior, and fuel economy regulation. It ignores the external requirements for electrification of Chinese passenger vehicles under the dual carbon goals.
To bridge the gap in the literature, our objectives in this study were to (1) examine the feasibility of achieving the dual carbon targets (mainly the CO2 peak target) under the current available and possible future targets of fuel consumption rate and NEV promotion and (2) assess the significant raw material risks in the implementation of the dual carbon goals. To achieve our purposes, we (1) developed a model of the evolution of China’s passenger vehicle fleet, (2) designed different technology penetration scenarios under the dual carbon targets, (3) identified the contribution and CO2 reduction potential of different scenarios to the total CO2 emissions of passenger vehicles at different time periods, and (4) evaluated the demand and supply risk of critical materials required for batteries.
The remainder of this paper is structured as follows. In Section 2, we introduce the methods. In Section 3, we discuss the results. Section 4 summarizes the research findings and outlines some policy implications.

2. Method

2.1. Fleet CO2 Emission Model for Passenger Vehicles in China

In this study, we developed the China Automotive Fleet CO2 Model (CAFCM) to simulate the electrification evolution of the passenger vehicle fleet, assess the impact of energy and CO2 emissions, and evaluate the demand for key battery materials. We developed the CAFCM based on a bottom-up method. The structure of CAFCM is shown in Figure 1. The CAFCM includes three parts. Part A is the fleet evolution model. Based on the input data, this part obtains vehicle stock projections according to the powertrain type and vehicle age. The input data include historical vehicle stock data, vehicle stock projections, and future powertrain type penetration scenarios. The forecast of vehicle powertrain type penetration is realized in Part B through the multinomial logit model. In Part C, the total energy consumption by fuel type and fleet CO2 emission can be derived by considering the vehicle kilometers traveled (VKT) and energy efficiency data. We developed Part D to evaluate the key battery material supply risks in the process of vehicle electrification. Part D projects the total and key battery material demands for new vehicles, which can also project the number of retired batteries and critical battery material potentially recycled from the retired batteries. The data sources are included below the input box.

2.2. Vehicle Stock Evolution Model

The vehicle stock evolution model is based on the Gompertz model [25] and the material flow analysis model [26,27]. The difference between our model and traditional analysis models is that the granularity of the model we constructed is finer due to more detailed ownership data (including gasoline vehicles, diesel vehicles, PHEVs, BEVs, and FCEVs) used in this work and more accurate predictions of sales for various powertrain types of new energy vehicles. We can first predict ownership through the Gompertz model and then predict sales through the relationship between ownership and sales. The vehicle fleet evolution model details are shown in Equations (1)–(4).
S t o c k i = a · e b · e c · P G D P i · P o p i
T S i = S t o c k i S t o c k i 1 + S c r a p i
S a l e s i , j = T S i · P i , j
T S P i , j = k = 0 σ ( S a l e s i k , j × S R k , j )
where i indicates the target year considered by the model; S t o c k i indicates the total stock of passenger vehicles in year i ;   P G D P i indicates the GDP per capita in year i ;   P o p i indicates the population in year i ;   T S i indicates the total sales of new passenger vehicles in year i ; S c r a p i indicates the number of vehicles scrapped in year i ; j indicates the vehicle powertrain type (including gasoline vehicles, diesel vehicles, PHEVs, BEVs, and FCEVs); S a l e s i , j is the new vehicle sales with powertrain type j in year i ; P i , j is the market penetration rate of vehicles of powertrain type j in year i ; T S P i , j is the total stock of vehicles of powertrain type j in year i ; k indicates vehicle age; σ represents the longest possible lifespan of the vehicles; and S R k , j indicates the survival rate of vehicles with powertrain type j at vehicle age k .
Through Equations (1)–(4), we simulated the dynamic evolution of passenger vehicle fleet composition during the electrification process, the results of which served as the basis for further impact and risk assessment.

2.3. Powertrain Type Penetration Forecast Model

The multinomial logit model has been widely used in the research of the development trend of the automobile market structure based on consumer perspectives [28]. According to the assumptions of the discrete choice model, when a rational individual is faced with a choice, he or she will rely upon the theory of utility maximization outlined in the random utility model [29,30]. The utility function of a consumer buying the powertrain type j model can be expressed as Equation (5).
U i , j = U 0 , j + U i , j + k β k × x i , j , k + ε j , n
where, i represents the target year; j indicates the vehicle powertrain type; U i , j is the total utility brought by powertrain type j to the consumer group in year i considering the combined effect of various factors; U 0 , j means the fixed utility of vehicle powertrain type j , that is, the utility brought by factors other than the powertrain type in the base year (historical data were used for regression calibration in this research); U i , j represents the increment of utility brought by powertrain type j to the consumer group in year i ; x i , j , k represents a series of attributes (k = 1, 2, 3…, K); β k is the marginal utility coefficient of attribute x i , j , k ; and ε j , n is the random error term. This study analyzed the market structure at the macro market level, and the difference in individual attributes was implied according to the distribution hypothesis of the random error term.
The market share of powertrain type j in year i ( P i , j ) can be calculated by Equation (6).
P i , j = e x p ( U i , j ) j e x p ( U i , j )
Factors that affect consumers’ vehicle purchase utility mainly include the purchase cost, use cost, and convenience of vehicle use. Among them, the purchase cost of automobiles is mainly affected by fiscal and tax policies as well as technological progress, such as the power battery system. The use cost is mainly affected by changes in the fuel price and fuel consumption rate. The irrational consumption behavior of consumers is usually considered for a short period of time, and CATARC [31] has found that consumers are more sensitive to the cost of use within 5 years. Therefore, in this research, the use cost of 5 years was considered and discounted from the purchase year. The convenience of vehicle use is mainly affected by the driving range, fast charging time, and the amount of charging infrastructure. Under different scenarios, the setting of the key influencing factors was differentiated.

2.4. Energy Consumption and CO2 Emission Model

The details of fleet energy consumption and the CO2 emission model are shown in Equations (7)–(9).
We used Equations (7) and (8) to calculate the total energy consumption of the passenger vehicle fleet.
T E i , j = V P i , j · A F E i , j · V M T i , j · D e n i , j
A F E i , j = k = 0 σ ( S a l e s i k , j × S R k , j × F E i , k , j ) V P i , j
where T E i , j represents the passenger vehicle fleet’s total consumption of powertrain type j in year i in kg; V P i , j represents the number of vehicles with powertrain type j in year i ; A F E i , j represents the average energy efficiency of vehicles with powertrain type j in year i in L/km; V M T i , j represents the average annual mileage traveled of vehicles with powertrain type j in year i in km; D e n i , j represents the fuel density of vehicles with powertrain type j in year i (0.732 kg/L for gasoline, 0.835 kg/L for diesel); k is the vehicle age; σ represents the longest possible lifespan of the vehicles; S a l e s i k , j indicates the number of vehicle sales of vehicle powertrain type j in year i k ; S R k , j indicates the survival rate of vehicles with powertrain type j at vehicle age k ; and F E i , k , j indicates the energy efficiency of vehicles with powertrain type j at vehicle age k in target year i in L/km.
We further calculated the total CO2 emissions of the passenger vehicle fleet by considering the energy carbon intensity coefficients of different fuel types, as shown in Equation (9).
T C i = j = 1 n ( V P i , j × A F E i , j × V M T i , j × D e n i , j × C i , j )
where T C i represents the total CO2 emissions of the passenger vehicle fleet in year i , and C i , j indicates the energy carbon intensity coefficients by fuel type j in year i .

2.5. Critical Battery Material Demand Model

We developed the critical material demand model for batteries to evaluate the risk of key material supply and demand. The model details are shown in Equations (10) and (11).
Using Equation (10), we projected the total critical battery material demand.
M D i , n = j = 0 J ( S a l e s i , j · B E i , j · B P i , j · B M i , j , n )
where n is the type of critical material; M D i , n is the total demand for critical material n in year i in kg; B E i , j indicates the average battery energy capacity of vehicles with powertrain type j in year i in kWh; B P i , j indicates the market share of different battery types of vehicles of powertrain type j in year i ; B M i , j , n is the average content of the critical material n per kilowatt hour of batteries equipped on vehicles of powertrain type j in year i in kg/kWh.
Using Equation (11), we projected the total number of retired batteries and the critical battery materials that may be recycled from the retired batteries.
M S i , n = j = 0 J k = 0 σ ( S a l e s i k , j · ( 1 S R k , j ) · B E i k , j · B P i k , j · B M i k , j , n )
where M S i , n is the total critical material n from the retired batteries that are potentially recycled in year i .

3. Key Data and Scenario Design

The vehicle stock and sales, vehicle powertrain type penetration, vehicle energy efficiency, vehicle travel intensity, energy carbon intensity, and technology path for batteries are the six most important factors determining vehicle fleet CO2 emissions and the demand for critical battery materials. Therefore, we engaged in detailed discussions and designed scenarios considering these six factors.

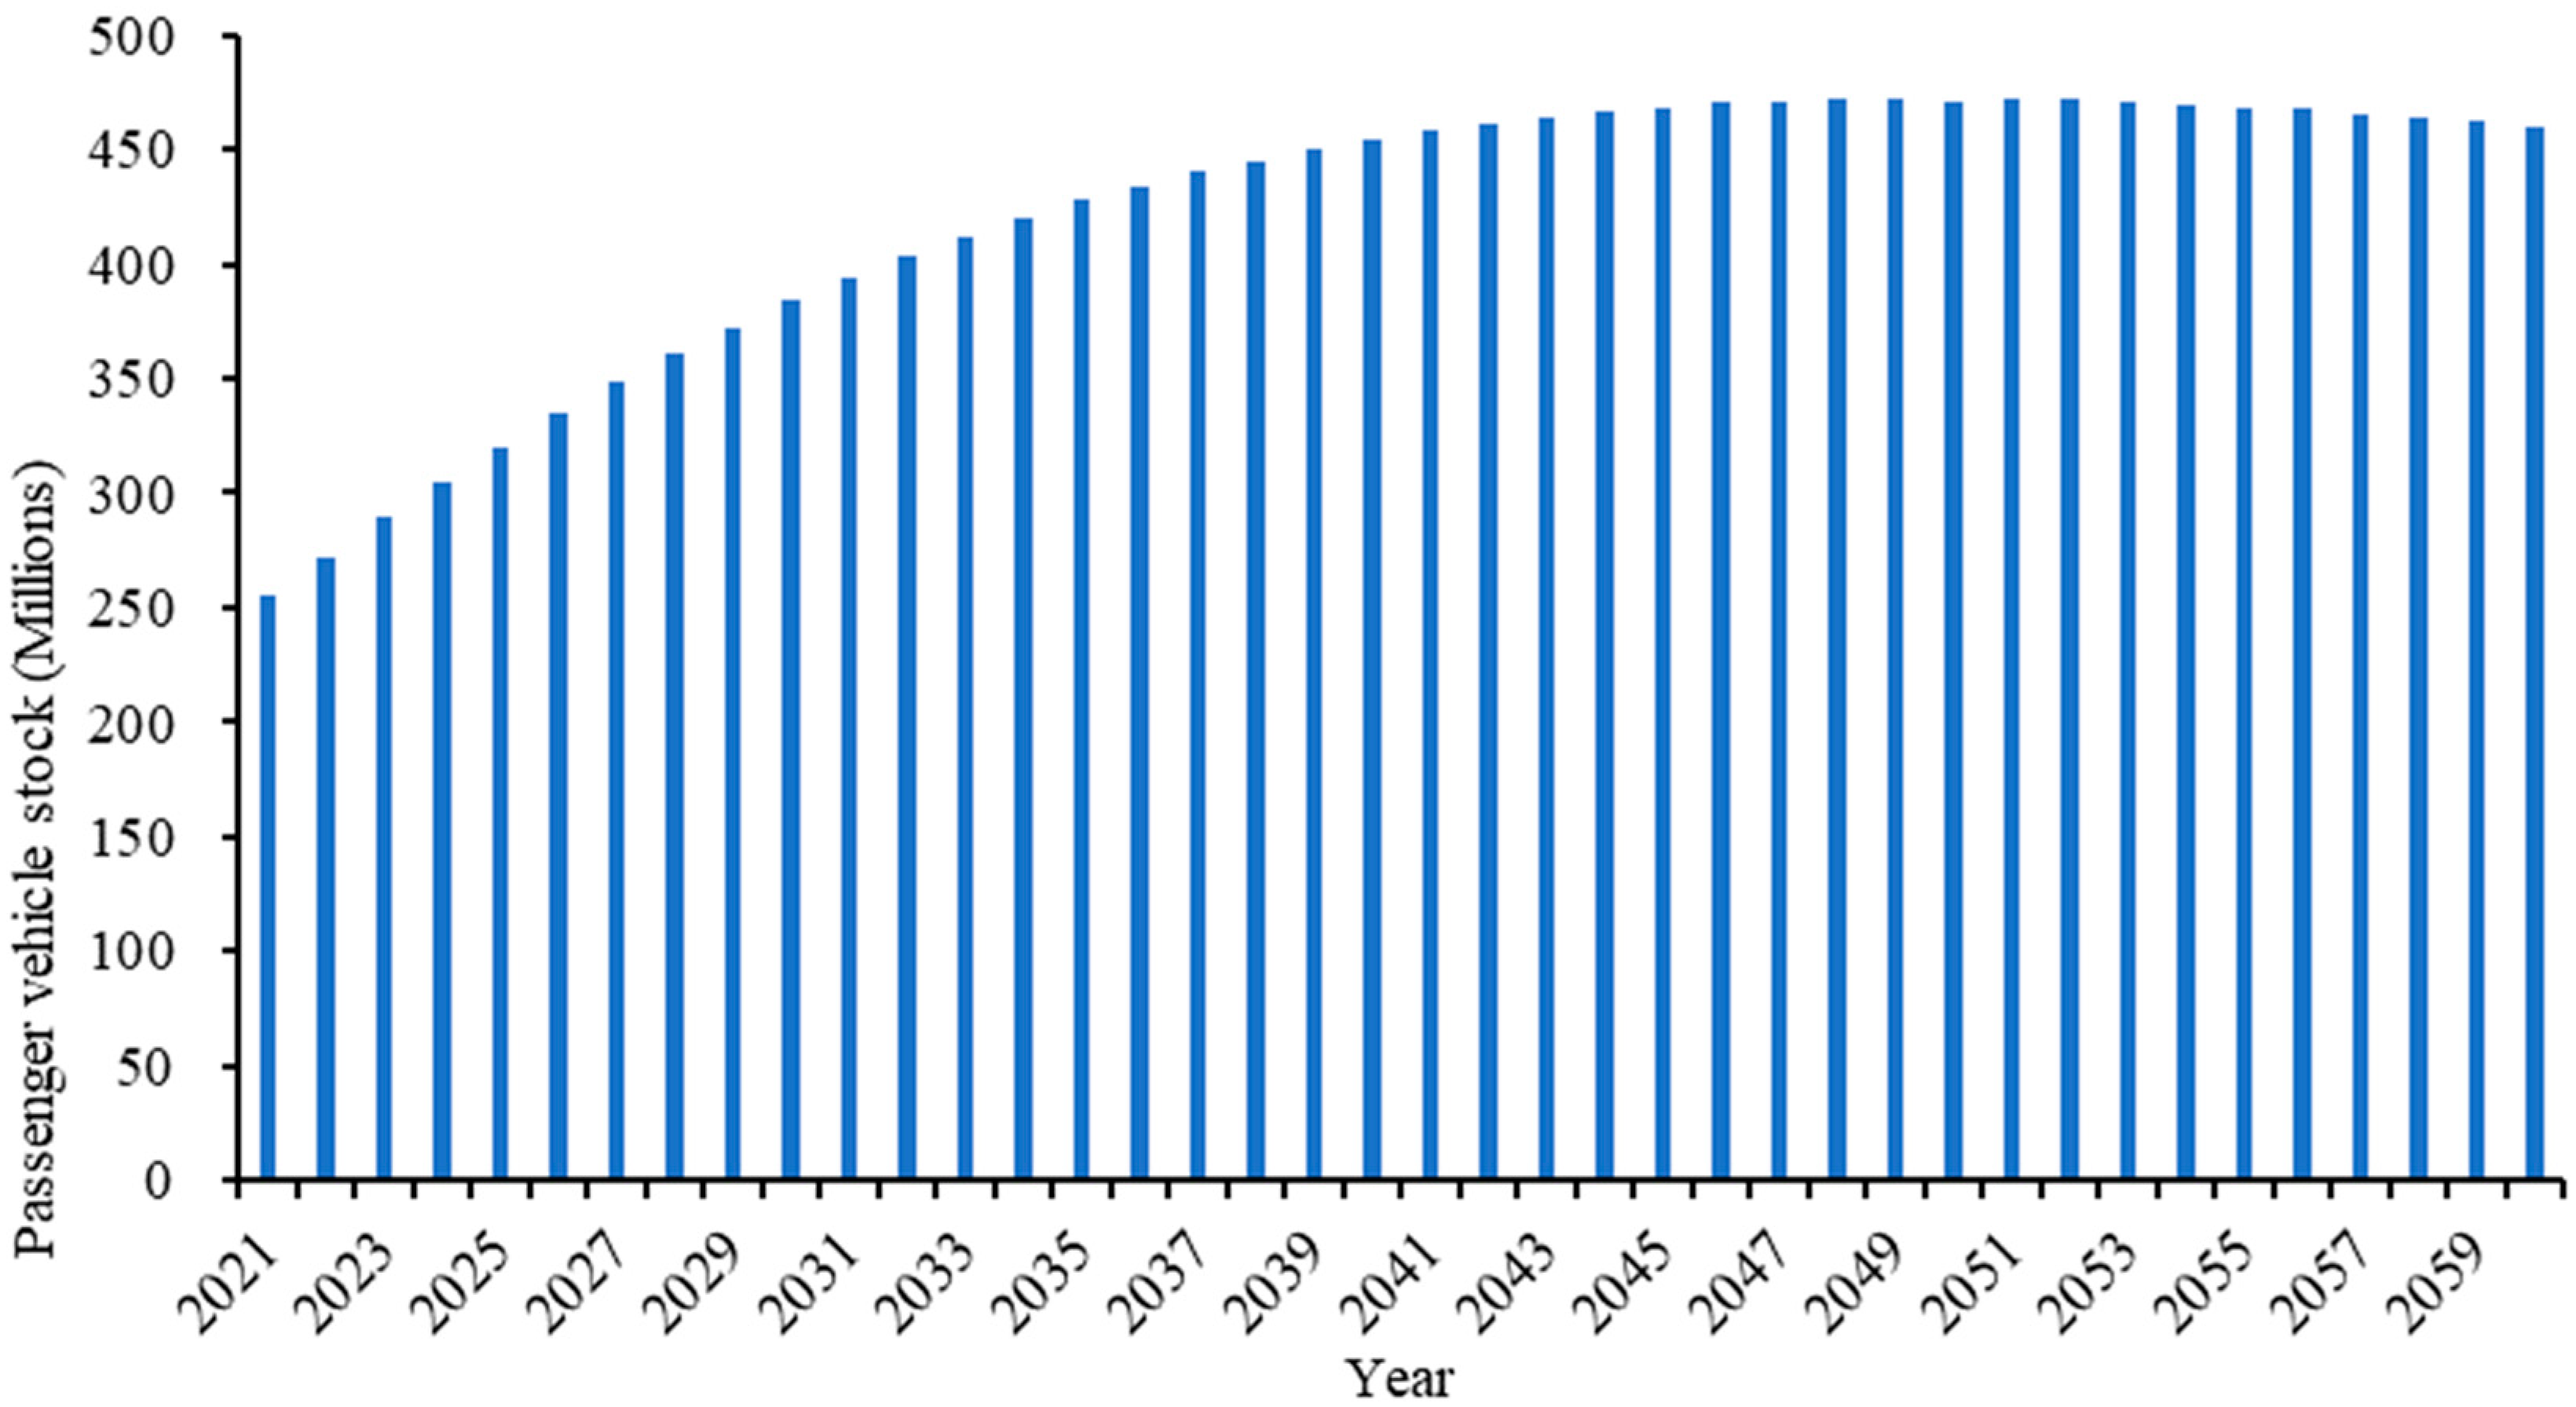
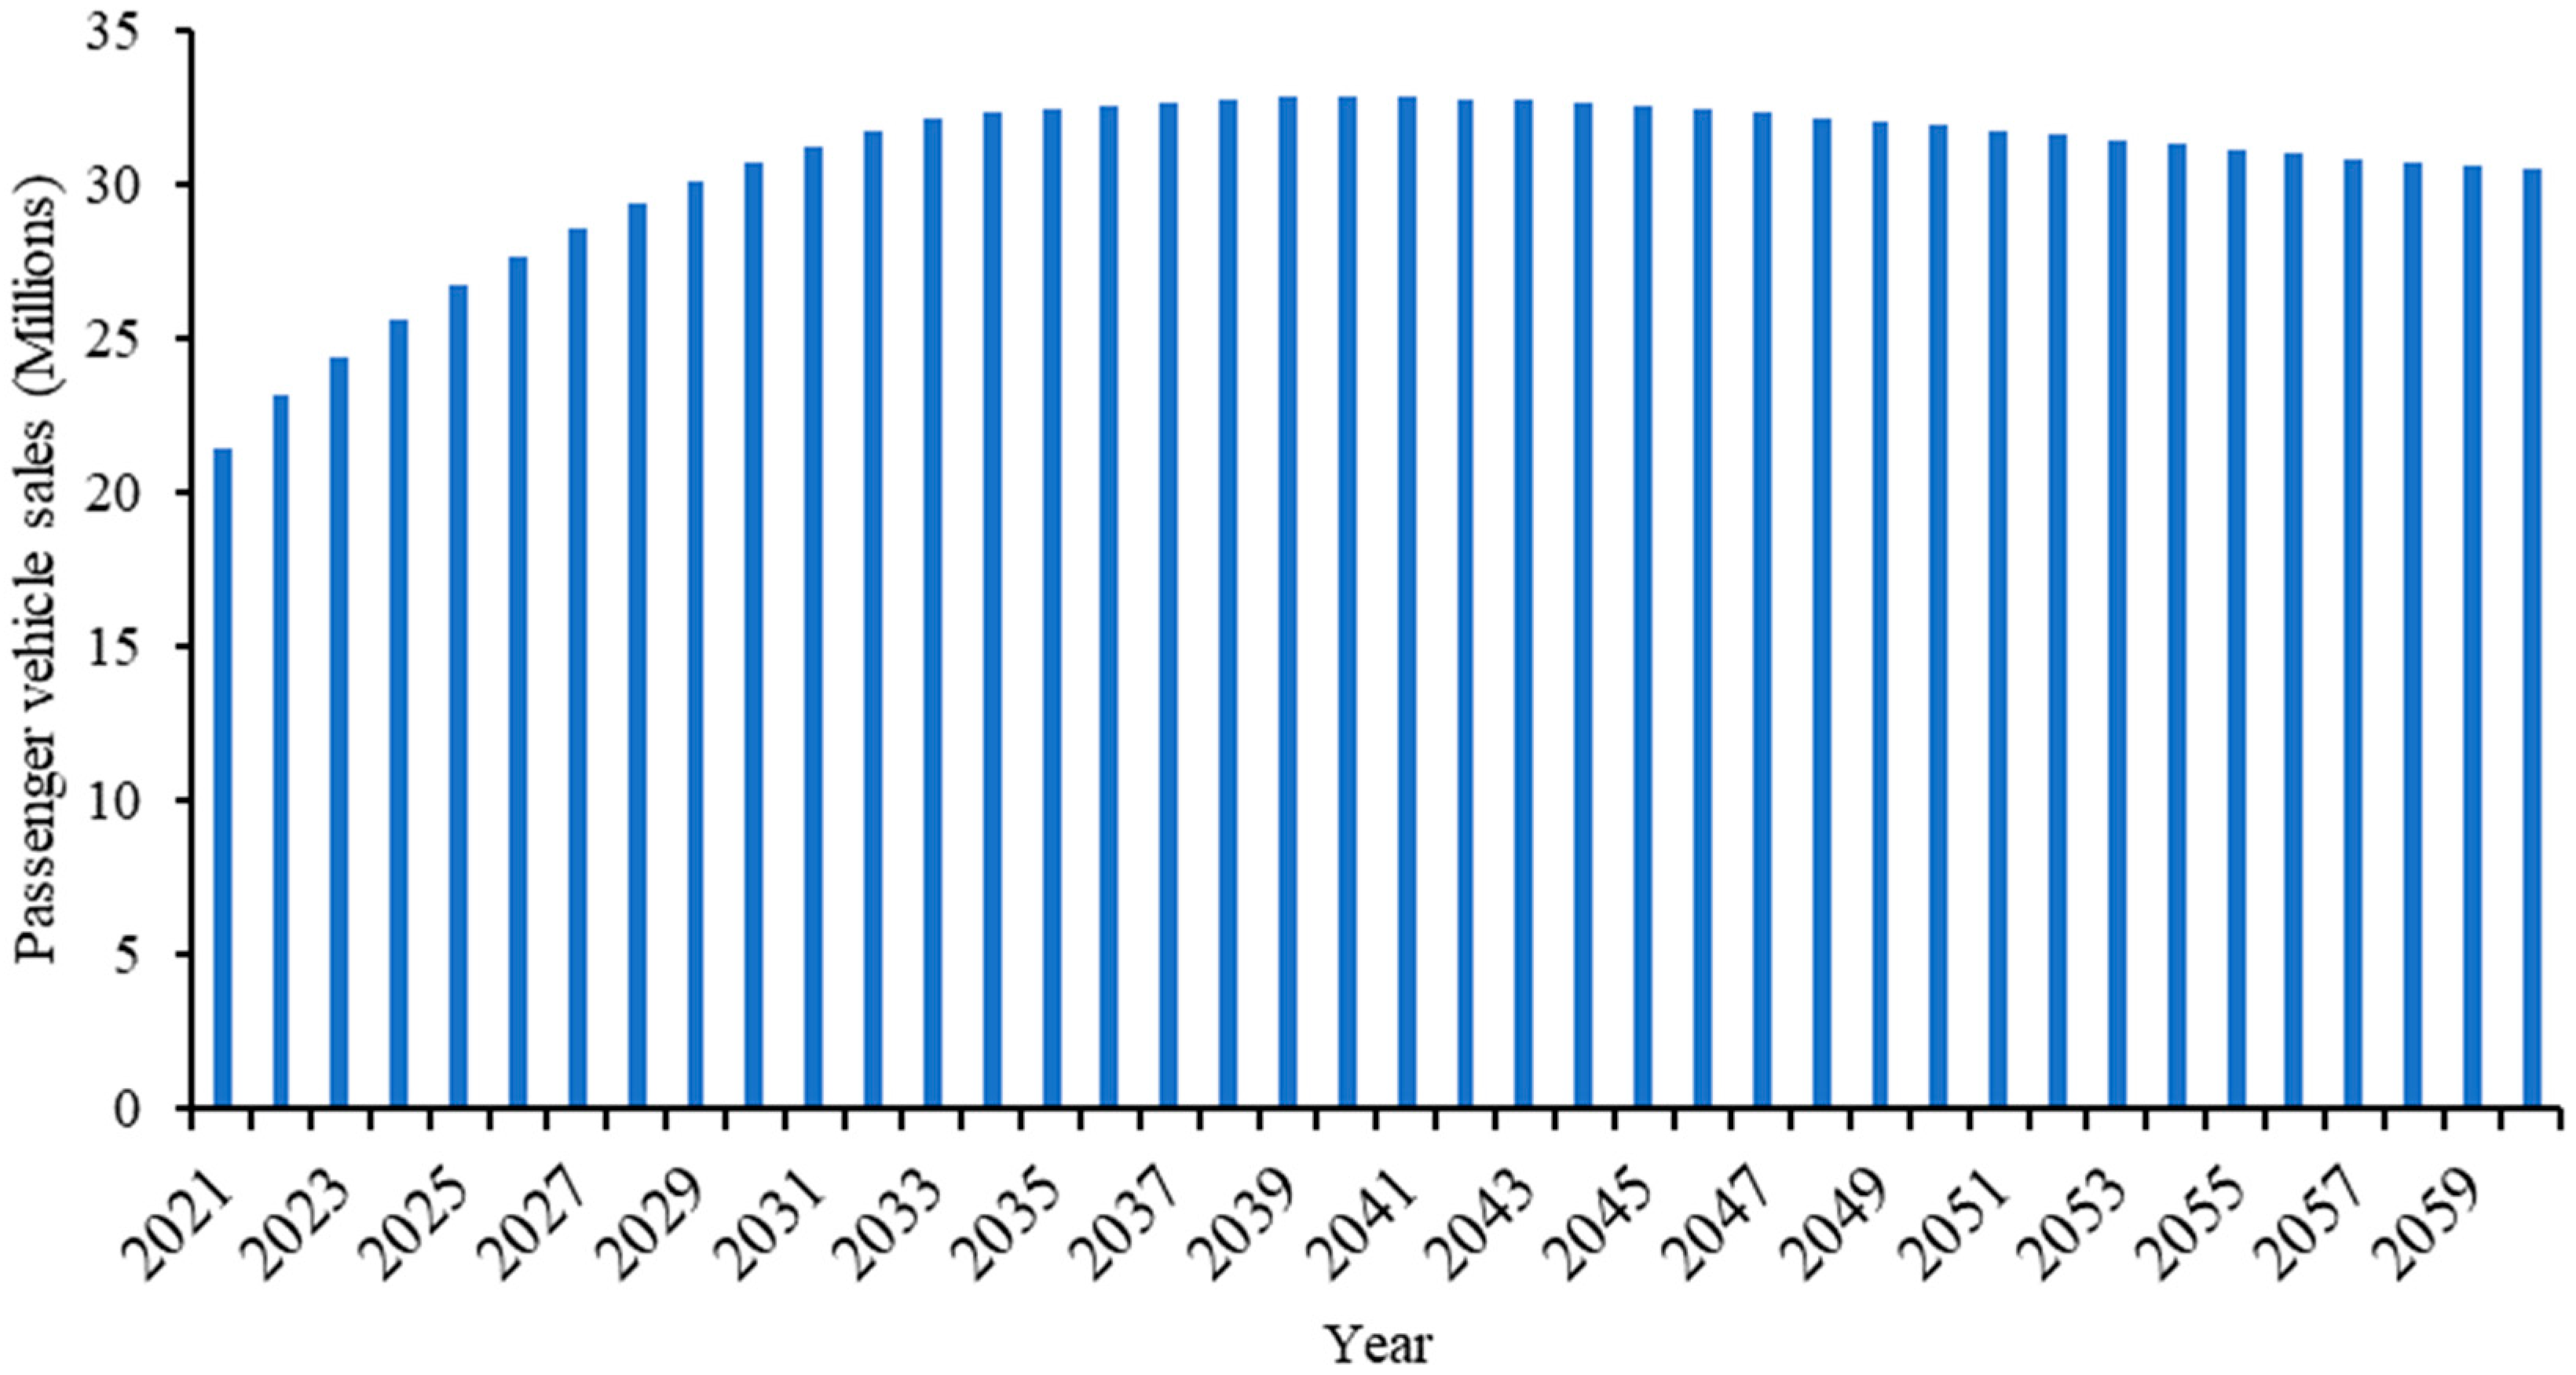
3.1. Vehicle Stock and Sales

The growth pattern of passenger vehicle ownership per thousand people is usually S-shaped with three stages: (1) initial stage with slow increase, (2) rapid development stage with steep increase, and (3) stable stage with gradual growth approaching a saturation level [32]. The relationship between GDP per capita and per capita population in different countries is shown in Figure 2 [31].
Figure 2 shows that the change in passenger vehicle ownership per thousand people generally shows an “S” curve. After the GDP per capita reaches USD 20–30 thousand, passenger vehicle ownership per thousand people reaches a relatively stable level. Based on this, the Gomperz model was adopted based on historical data of China’s passenger vehicle ownership per thousand people and predicted values of passenger vehicle ownership per thousand people in 2050 to obtain the trend of changes in passenger vehicle ownership per thousand people in China. China’s current passenger vehicle market is rapidly developing, with 158 passenger vehicles owned per thousand people in 2019. The saturation level is projected to range from 300 to 380 vehicles per thousand people. CATARC [31] has found that GDP per capita, population density, household size, and the proportion of passenger vehicles in transportation are the main factors affecting the number of passenger vehicles per thousand people. Based on the future development of these key factors, it is projected that the peak ownership rate of passenger cars per thousand people in China will be 350. In this study, based on the historical passenger vehicle registration data from CATARC and the assumption that the saturation level will reach 350 in 2050 and remain stable by 2060, the saturation value of passenger car ownership per thousand people in China appears when the GDP per capita reaches about RMB 20,000 to 150,000, which is consistent with international experience. The results are shown in Figure 3. In Figure 3, the circular scatter plot represents historical data, while the square scatter plot represents predicted data. Furthermore, by combining these results with the projections of China’s population [33], we projected China’s passenger vehicle stock. As shown in Figure 4, the passenger vehicle stock will peak at 473 million around 2050.
Based on the estimated passenger vehicle stock projections and vehicle survival rates [19], we used Equation (2) to project the annual sales of passenger vehicles in China. The results are shown in Figure 5. The results of the estimation indicated that annual passenger vehicle sales will increase from 20.2 million in 2020 to 32.5 million in 2035 and stabilize at over 30 million from 2035 to 2060.

3.2. Vehicle Powertrain Type Penetration

In 2020 in China, the NEV market penetration rate (the ratio of NEV sales to the total sales of all kinds of vehicles) reached 5.4% [34] and is planned to reach 20% by 2025 [35] and 40% by 2030 [36]. However, because of the bottlenecks in the supply chain of critical battery materials, the future penetration rate of China’s NEVs is still uncertain.
We designed the following three scenarios for powertrain type penetration to evaluate the impact of the CO2 emitted through passenger vehicle electrification:
  • Conservative scenario (CS): In this scenario, the future penetration rate of alternative powertrain type remains unchanged from the 2020 level. Even though this scenario is unlikely, it provides the likely upper limits for CO2 emissions and lower limits for the key battery materials needed.
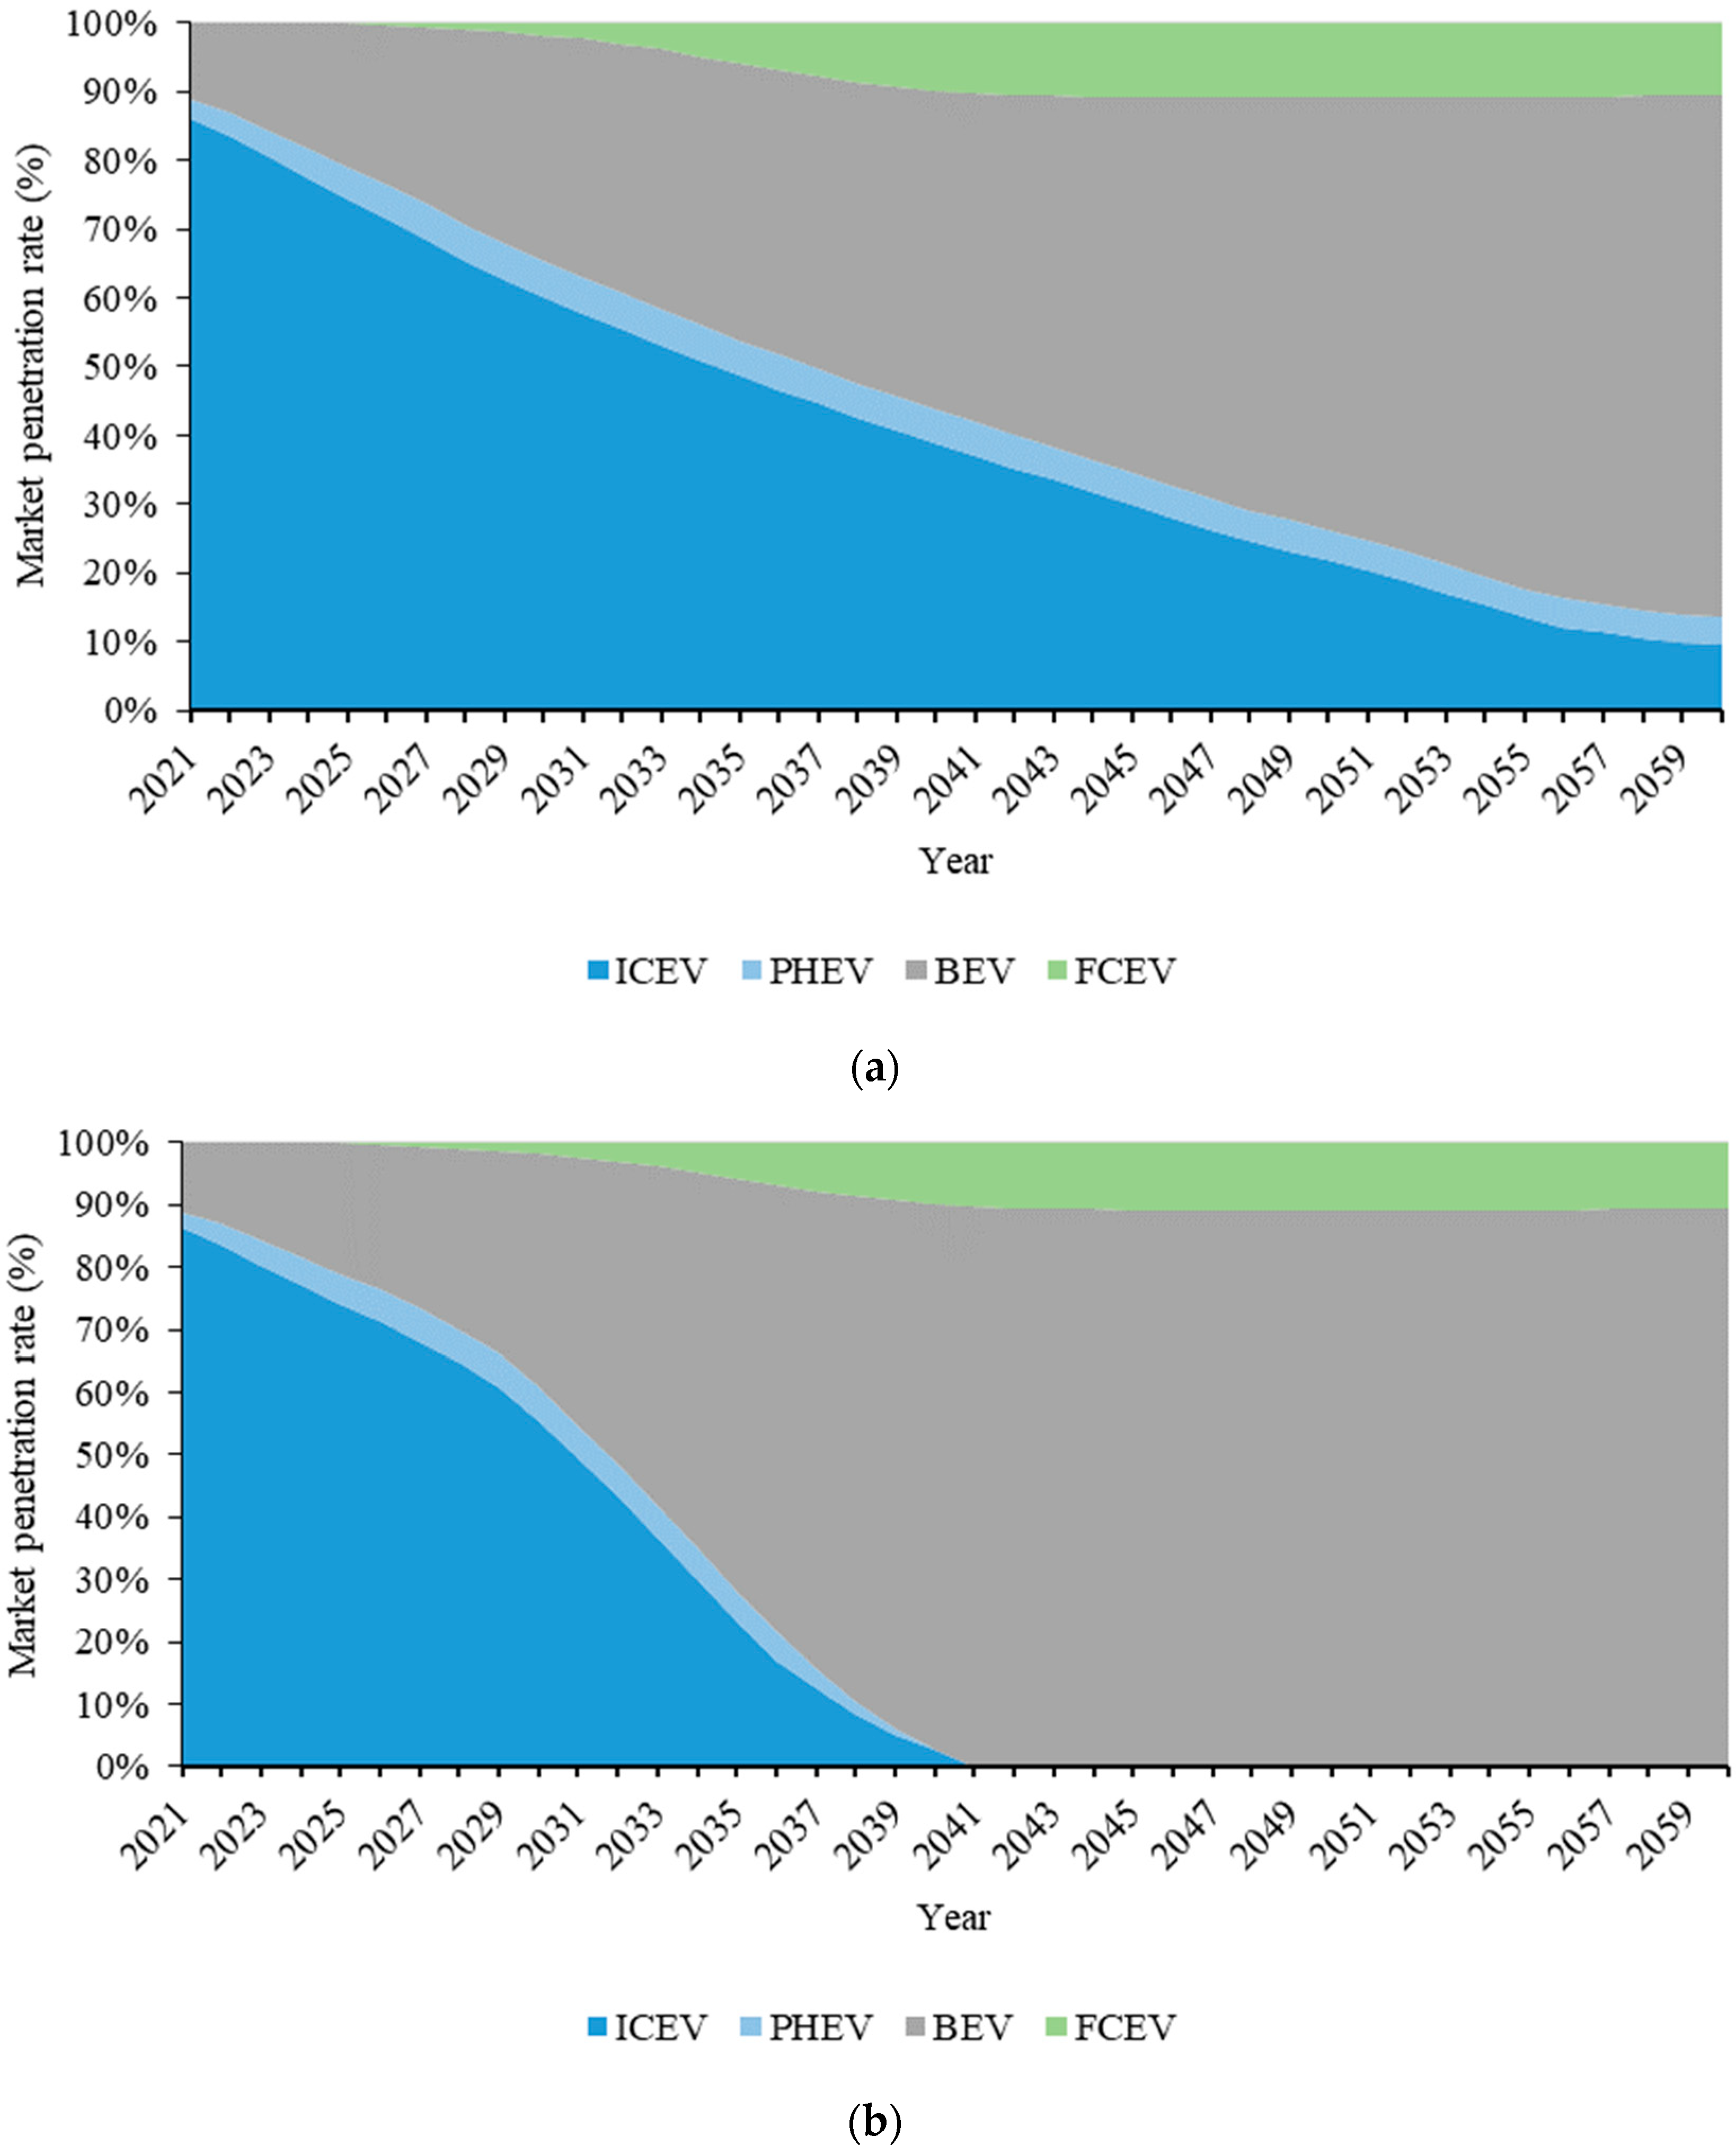
  • Business as usual (BAU): The BAU scenario follows the national plans and historical development trends. In this scenario, the market penetration rate of NEVs in 2025, 2030, and 2035 will be 20%, 40%, and 50%, respectively, based on the relevant industry plan. We further forecasted the market penetration rates of NEVs after 2035 based on Equations (4) and (5). As for the subdivided powertrain type penetration, with the progress in technology, the comprehensive cost advantage of BEVs will further appear and the market share will reach 75% in 2060. FCEVs will start to develop in scale after 2030 and stabilize at about 10% around 2040. The market share of PHEVs is stable at around 5%.
  • Strengthening scenario under dual carbon goals (ST): Under this scenario, policies need to be designed to ensure that CO2 emitted from the operation stage of passenger vehicles is near-zero by 2060, which means the passenger vehicle fleet will be nearly 100% NEVs by 2060. The new passenger vehicle sales need to reach almost 100% NEVs by 2040 because the maximum lifespan of most conventional passenger vehicles is between 15 and 20 years [19]. With the implementation of the policy requirements for near-zero emissions goals, the comprehensive cost of BEVs decreases rapidly, the convenience of use increases significantly, and the proportion of BEVs will reach about 90% by 2045. At the same time, PHEVs will be considerably less attractive than BEVs and will gradually exit the market entirely.
The results of three kinds of scenarios of powertrain type penetration rate are shown in Figure 6. In Figure 6, the x-axis is year, and the y-axis is the market penetration rate of different powertrain types.

3.3. Vehicle Energy Efficiency

We obtained the historical data on passenger vehicle fuel efficiency from CATARC [4], based on which the three scenarios of future passenger vehicle fuel efficiency were set.
  • CS: In this scenario, the vehicle energy efficiency is unchanged from the 2020 level, as shown in Table 1.
  • BAU scenario: The BAU scenario follows the regulation requirements and historical development trends. We set the future fuel consumption rate of ICEVs to 5.6 L/100 km in 2025, 4.8 L/100 km in 2030, and 4.0 L/100 km in 2035 under WLTP. We assumed that the fuel consumption rate of ICEVs will not change after 2035 because most carmakers plan to stop the development of new internal combustion engines. We set the annual improvement in the electricity consumption rate for passenger vehicles to 1% [37], which will remain unchanged after 2035. We used hydrogen consumption rates of 1.0 kg/100 km in 2025 and 0.8 kg/100 km in 2040, which will remain unchanged after 2040 [37].
  • ST: In the ST scenario, under the dual carbon goals, the current national plan and regulation for vehicle fuel efficiency targets are further strengthened. The fuel consumption rate of ICEVs will continue to improve to 3.7 L/100 km by 2040. We set the annual improvement in the electricity consumption rate to 1% before 2035 and to 0.5% from 2036 to 2060. We used hydrogen consumption rates of 1.0 kg/100 km in 2025 and 0.8 kg/100 km in 2030, which will remain unchanged after 2030 [37].

3.4. Vehicle Travel Intensity

Vehicle travel intensity (annual vehicle kilometers traveled (AVKTs)) is vital for assessing automotive fuel use and CO2 emissions. Huo et al. [20] collected AVKT survey data between 2004 and 2010. They found that the AVKT of private passenger vehicles decreased from 18,000 km in 2002 to 16,900 km in 2009. They also projected that the AVKT of personal passenger vehicles will fall to 10,000 km by 2050 in the low scenario [20]. Ou et al. [38] collected 169,292 privately owned passenger vehicle samples. They estimated that the average AVKT for passenger vehicles was 12,377 km, which is close to the low scenario by Huo et al. The estimation results also showed that newer vehicles are driven more than older vehicles [38].
In this study, we followed the low scenario described by Huo et al. [20], assuming the AVKT of passenger vehicles will decrease to 10,000 km in 2050 from 124,000 km in 2020.

3.5. Energy Carbon Intensity

China’s transition to clean energy is the fundamental path to achieve near-zero emissions in the transportation sector [39]. We set three scenarios for China’s vehicle energy transition to clean energy, as described in Table 2.
  • CS: In this scenario, we assumed the carbon intensities of vehicle fuels will remain unchanged from the current level.
  • BAU scenario: This scenario follows IEA’s Announced Pledges Scenario [36], which aims to reflect the announced ambitions and targets.
  • ST: The ST scenario in this study followed IEA’s Sustainable Development Scenario (SDS) [40]. As a “well below 2 °C” pathway, this scenario represents a gateway to the outcomes targeted by the Paris Agreement.

3.6. Technology Roadmap for Power Batteries

We summarized the development of NEV traction batteries in China into three stages. The first stage was from 2011 to 2016. With the release of China’s Energy-Saving and New Energy Vehicle Industry Development Plan (2012–2020) [41], China began to encourage market promotion of electric vehicles through a series of policies. Lithium–iron–phosphate (LFP) batteries have apparent advantages in terms of safety, lifespan, and cost, so LFP batteries were in a strong leading position in China during that period. LFP batteries are mainly used in new energy buses and passenger vehicles. The second stage was from 2017 to 2019. With the updated subsidy policy for NEVs released at the end of 2016, the government included the battery packs’ energy density and electric range in the indicators used for calculating the purchase subsidy for a specific vehicle model [42]. NEV carmakers gradually abandoned LFP batteries and switched to nickel–cobalt–manganese (NCM) batteries for higher subsidies. In that stage, the market share of NCM batteries continued to increase, accounting for 65.2% in 2019, while the market share of LFP batteries dropped to 33.4%. The third stage ranges from 2020 to now. As China’s NEV subsidies began to decline in 2019, mainstream carmakers paid more attention to cost control. The energy density of LFP batteries has further improved and is now close to that of mainstream NCM batteries owing to module structure improvement. Hence, the LFP market share has rapidly increased, reaching 50% in 2021.
In the future, we assumed that NCM batteries will be the main direction of power battery development for passenger vehicles, mainly because (1) in terms of cost, as the energy density of NCM batteries increases, the cost per watt will gradually be closer to that of LFP batteries and the price performance advantage of LFP batteries will no longer exist and (2) regarding performance, the LFP battery energy density is close to its limit, so it will not improve much in the future.
However, forecasting the specific technical path for future batteries is difficult, especially after 2030. The potential emergence of new power battery technology will change the foreseeable path of battery technology. However, the bottleneck of available critical raw materials will also affect the future path of battery technology. We estimated the market share of various power battery types from 2015 to 2021 based on the data from CATARC. Our distribution projections from 2022 to 2060 were based on historical data and a literature review [24]. Figure 7 shows the distribution of different power battery types for passenger vehicles from 2015 to 2060. As shown in Figure 7, NCM and NCA batteries will account for 90% in 2030 and 100% after 2035 in passenger vehicles in China.
We collected the data on critical material intensity for different cathode chemistries, as shown in Table 3. We used these data as input for calculating the critical raw material demand and amount of potentially recyclable materials.

4. Results and Discussion

4.1. Projections of Passenger Vehicle Energy Demand and CO2 Emissions

Based on the CAFCM model and the three Chinese passenger vehicle development scenarios we developed in this study, we projected the demand for electricity, gasoline, and hydrogen energy for Chinese passenger vehicles from 2020 to 2060. The results are shown in Figure 8.
Figure 8 shows that gasoline will dominate the Chinese passenger vehicle energy demand under the CS. The gasoline demand from passenger vehicles will increase from 191 million tons of coal equivalent in 2020 to 325 million tons of coal equivalent in 2035 and 361 million tons of coal equivalent in 2060. Electricity demand from passenger vehicles will increase from 0.8 million tons of coal equivalent in 2020 to 4.9 million tons of coal equivalent in 2035 and 5.6 million tons of coal equivalent in 2060. The gasoline demand will surge and peak at 372 million tons of coal equivalent in 2049 under the CS. This result indicates that if the electrification process of China’s passenger vehicles is not effectively promoted, China’s demand for crude oil and its energy security risks will further increase.
Under the BAU scenario, the demand for electricity for passenger vehicles rapidly rises, reaching 20 and 38 million tons of coal equivalent in 2035 and 2060, respectively, accounting for 2.1% and 4.0% of China’s total power generation in 2020, respectively [46]. Compared to the CS, the peak gasoline demand under the BAU scenario will be substantially earlier, i.e., in 2026, corresponding to a peak value of 219.9 million tons of coal equivalent.
Compared to the BAU scenario, the electrification process of passenger cars is accelerated under the ST scenario, and the impact on vehicle energy will appear after 2030. Under the ST scenario, passenger car electricity demand rapidly rises, increasing to 23.7 million tons of coal equivalent in 2035 and 51.7 million tons of coal equivalent in 2060. Electricity demand in 2035 and 2060 will account for 2.5% and 5.4% of China’s total power generation in 2020, respectively. Gasoline demand will peak around 2026 and decline rapidly to near zero by 2050. Hydrogen demand will rapidly rise after 2030 and remain above 1.4 million tons of coal equivalent per year after 2055.
Based on the energy demand projection of passenger vehicles, we further evaluated CO2 emissions under different development scenarios from 2020 to 2060. Figure 9a shows the direct CO2 emissions produced at the operation stage. Under the CS, China’s direct CO2 emissions from passenger vehicles will peak in 2049 at 769 million tons, far less than the national requirement for carbon peaking in 2030, and remain relatively flat after the peak. Under the BAU and ST scenarios, the direct CO2 emissions of passenger vehicles will peak around 2026 at 454 million tons, and rapidly drop thereafter to near zero.
We included the upstream energy CO2 emissions in the research scope and further projected the fleet CO2 emissions of China passenger vehicles in the fuel cycle, as shown in Figure 9b. The fuel cycle CO2 emissions will peak in 2049 at 999 million tons under the CS. Under the BAU and ST scenarios, passenger vehicle fuel cycle CO2 emissions will peak in 2027 and 2026, respectively, achieving the carbon peak goal by 2030.

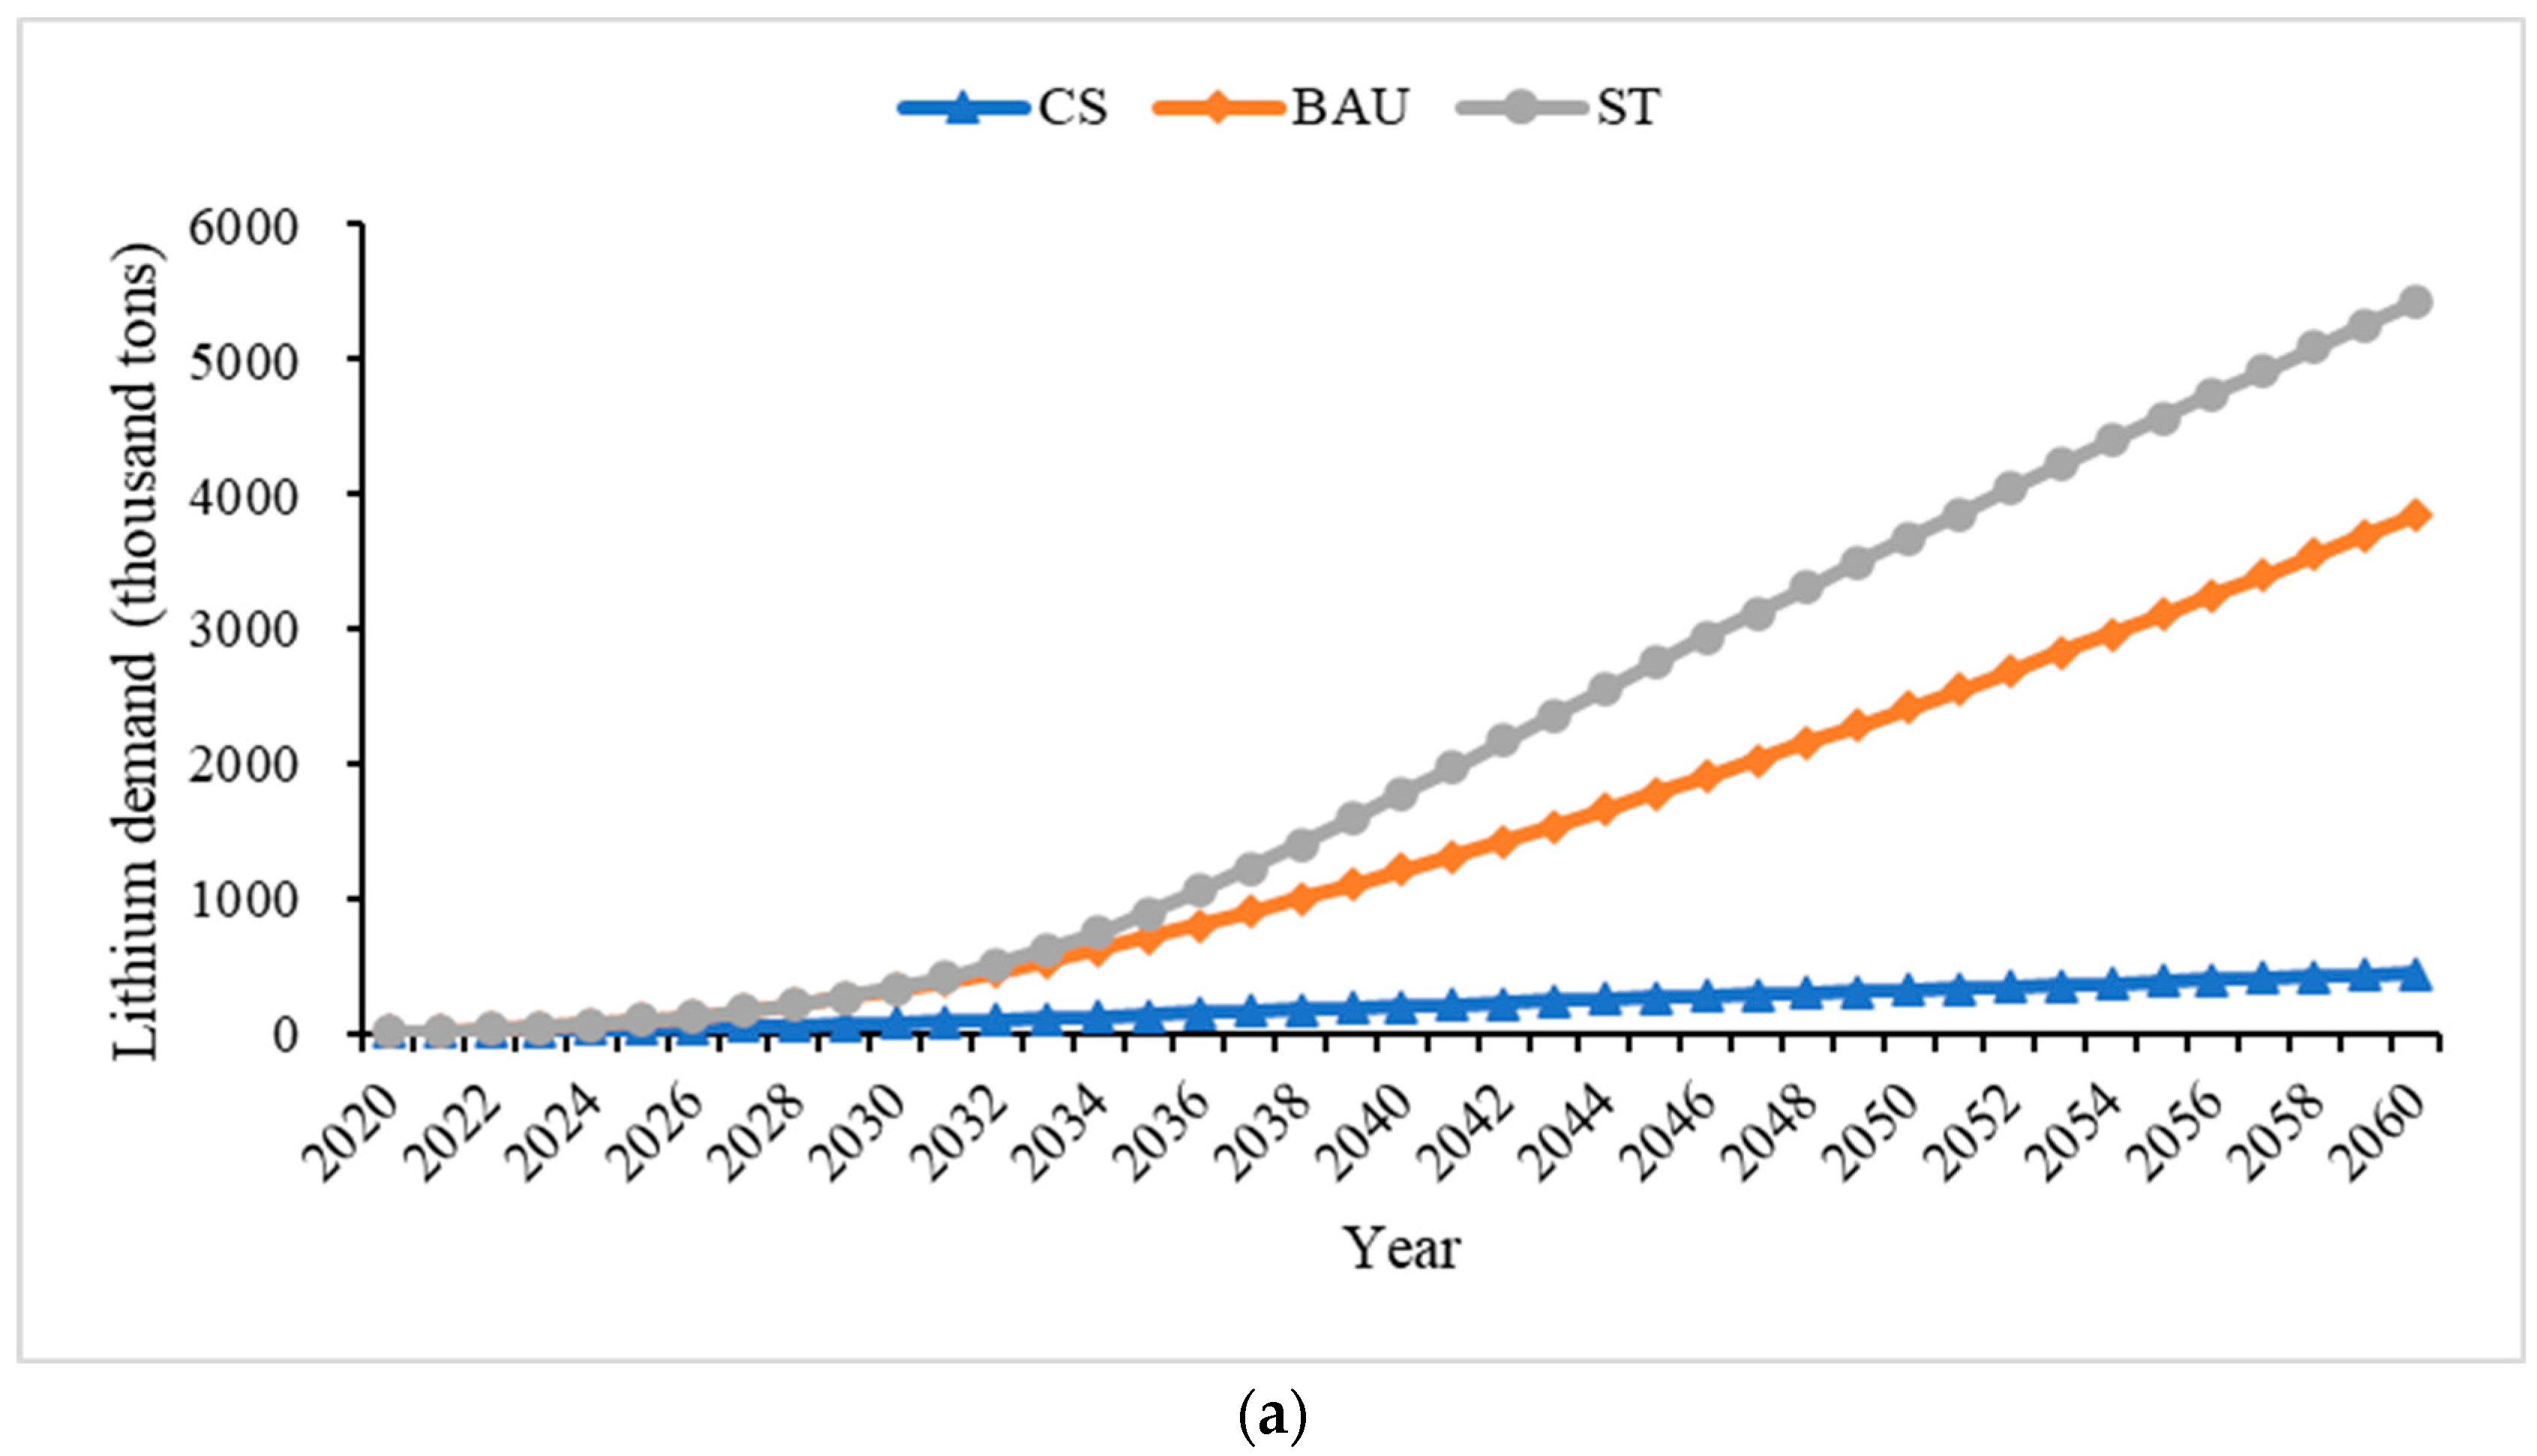
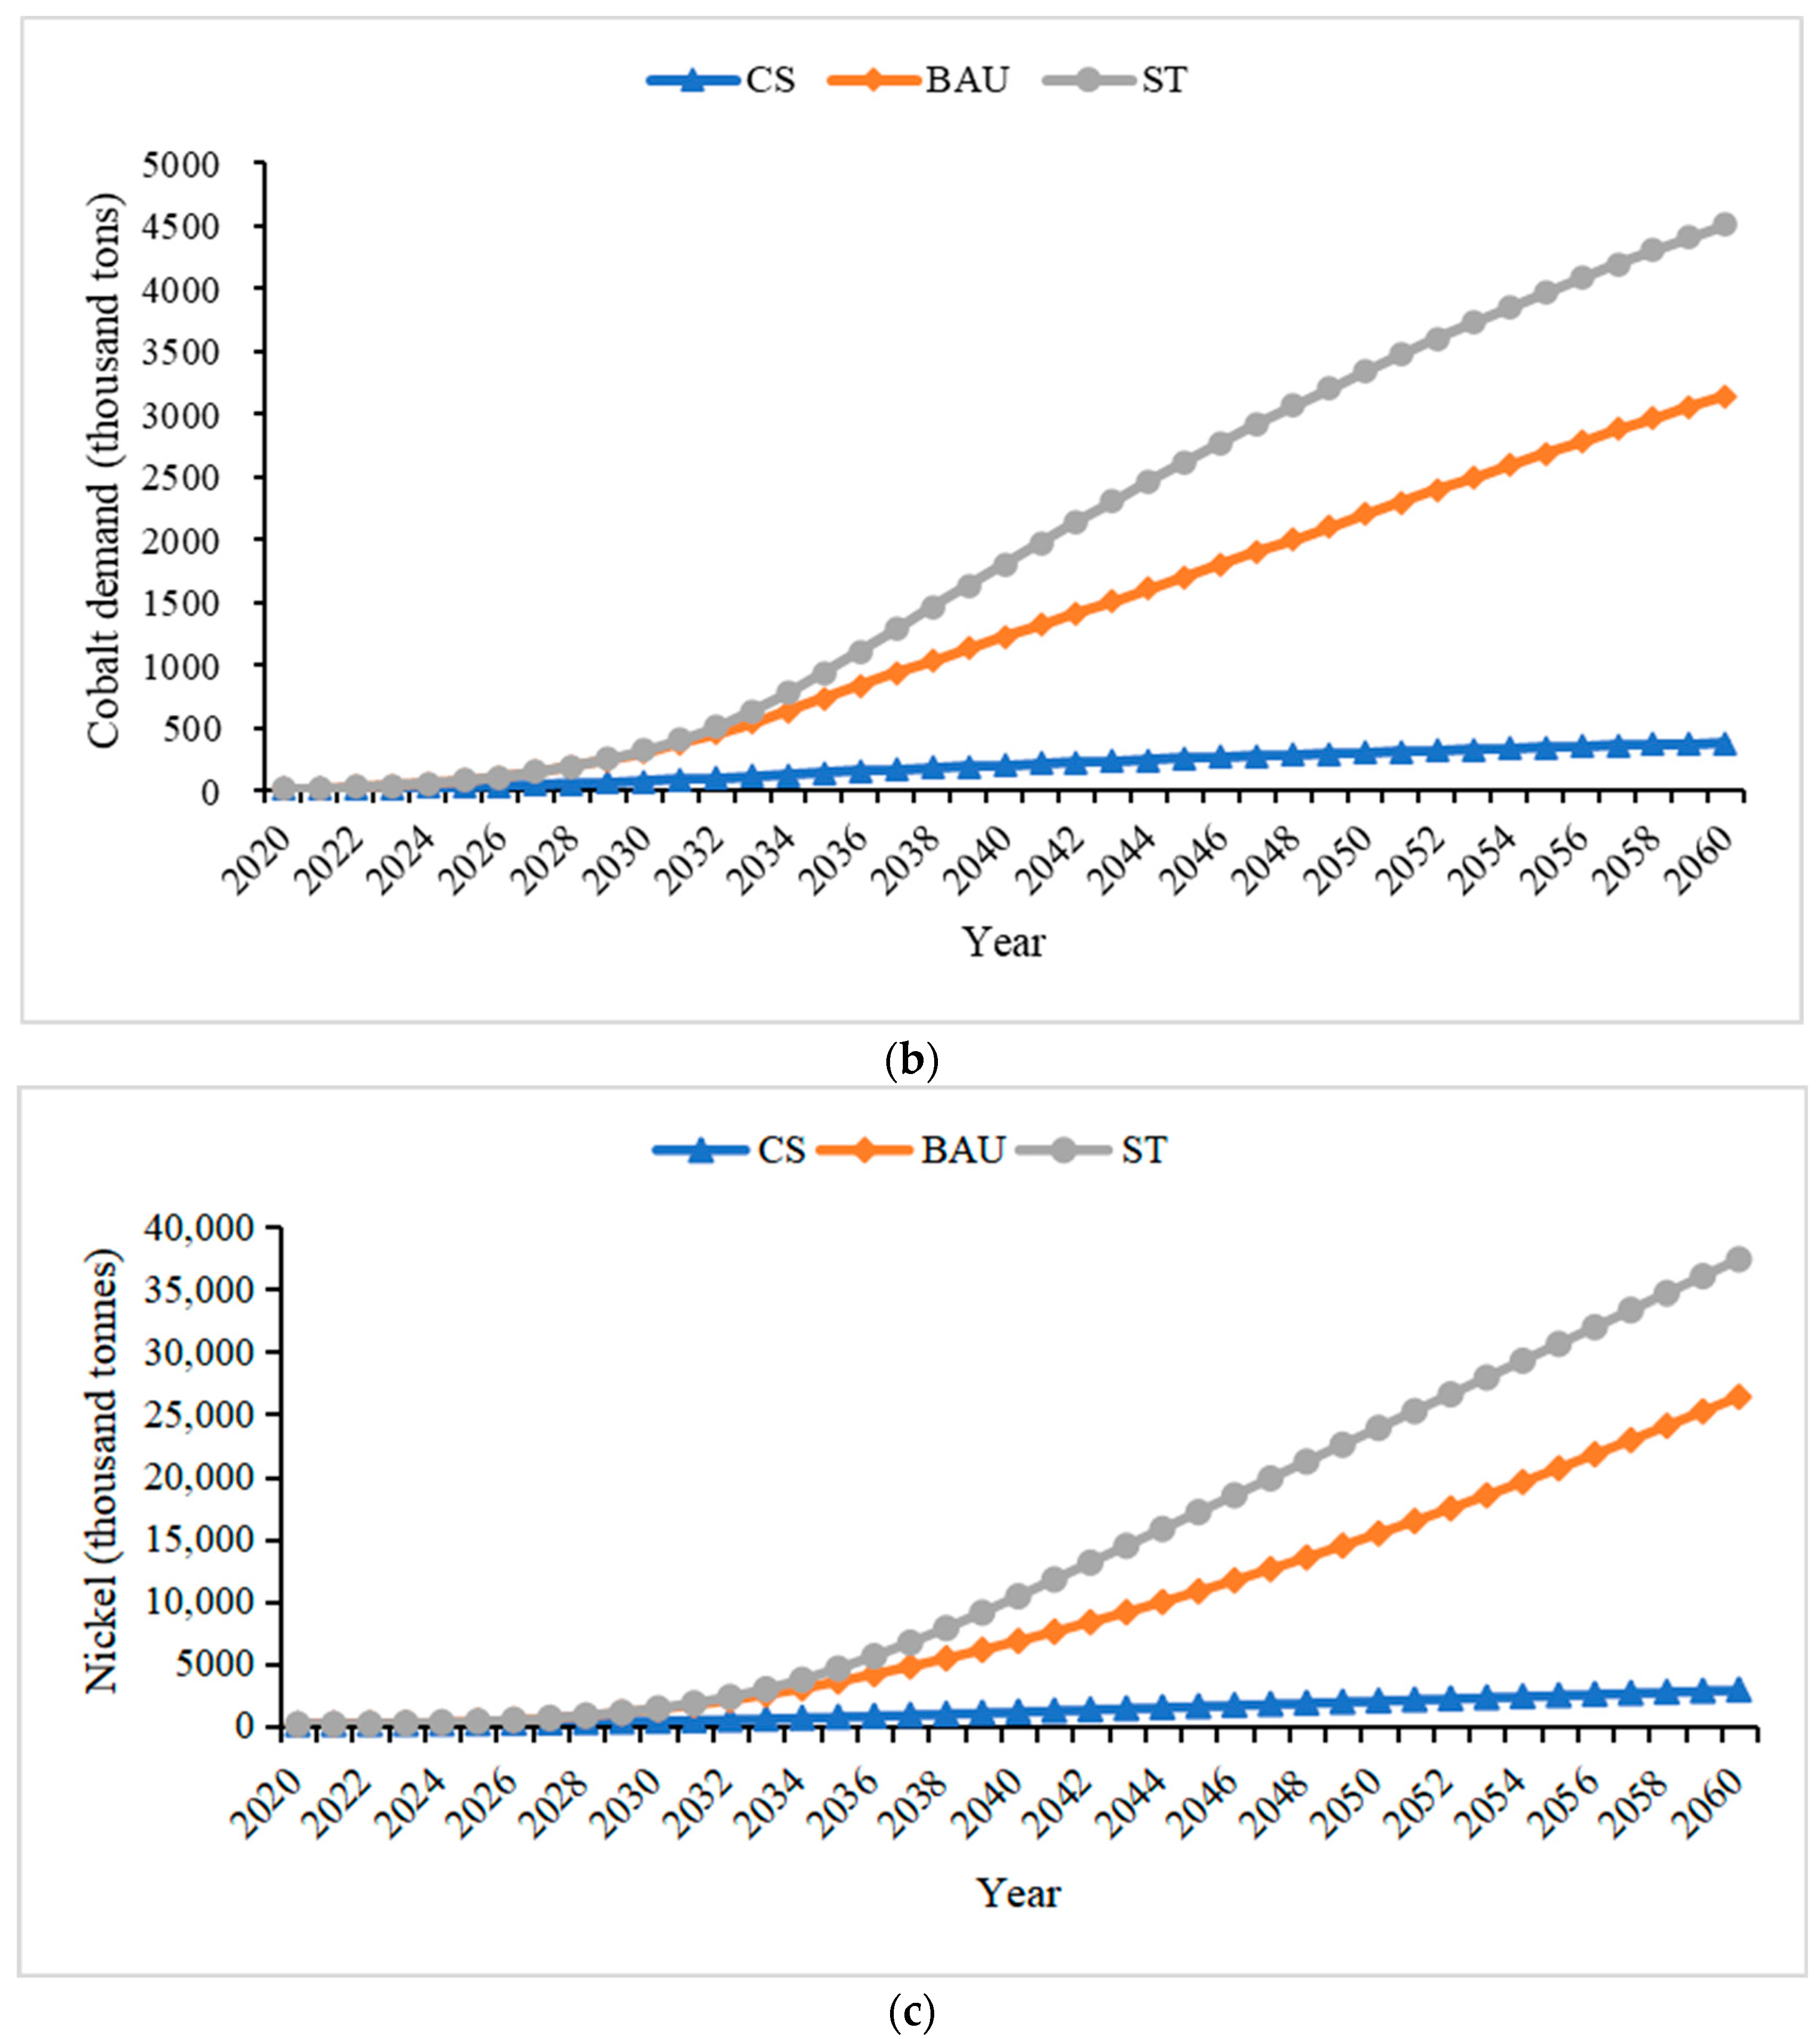
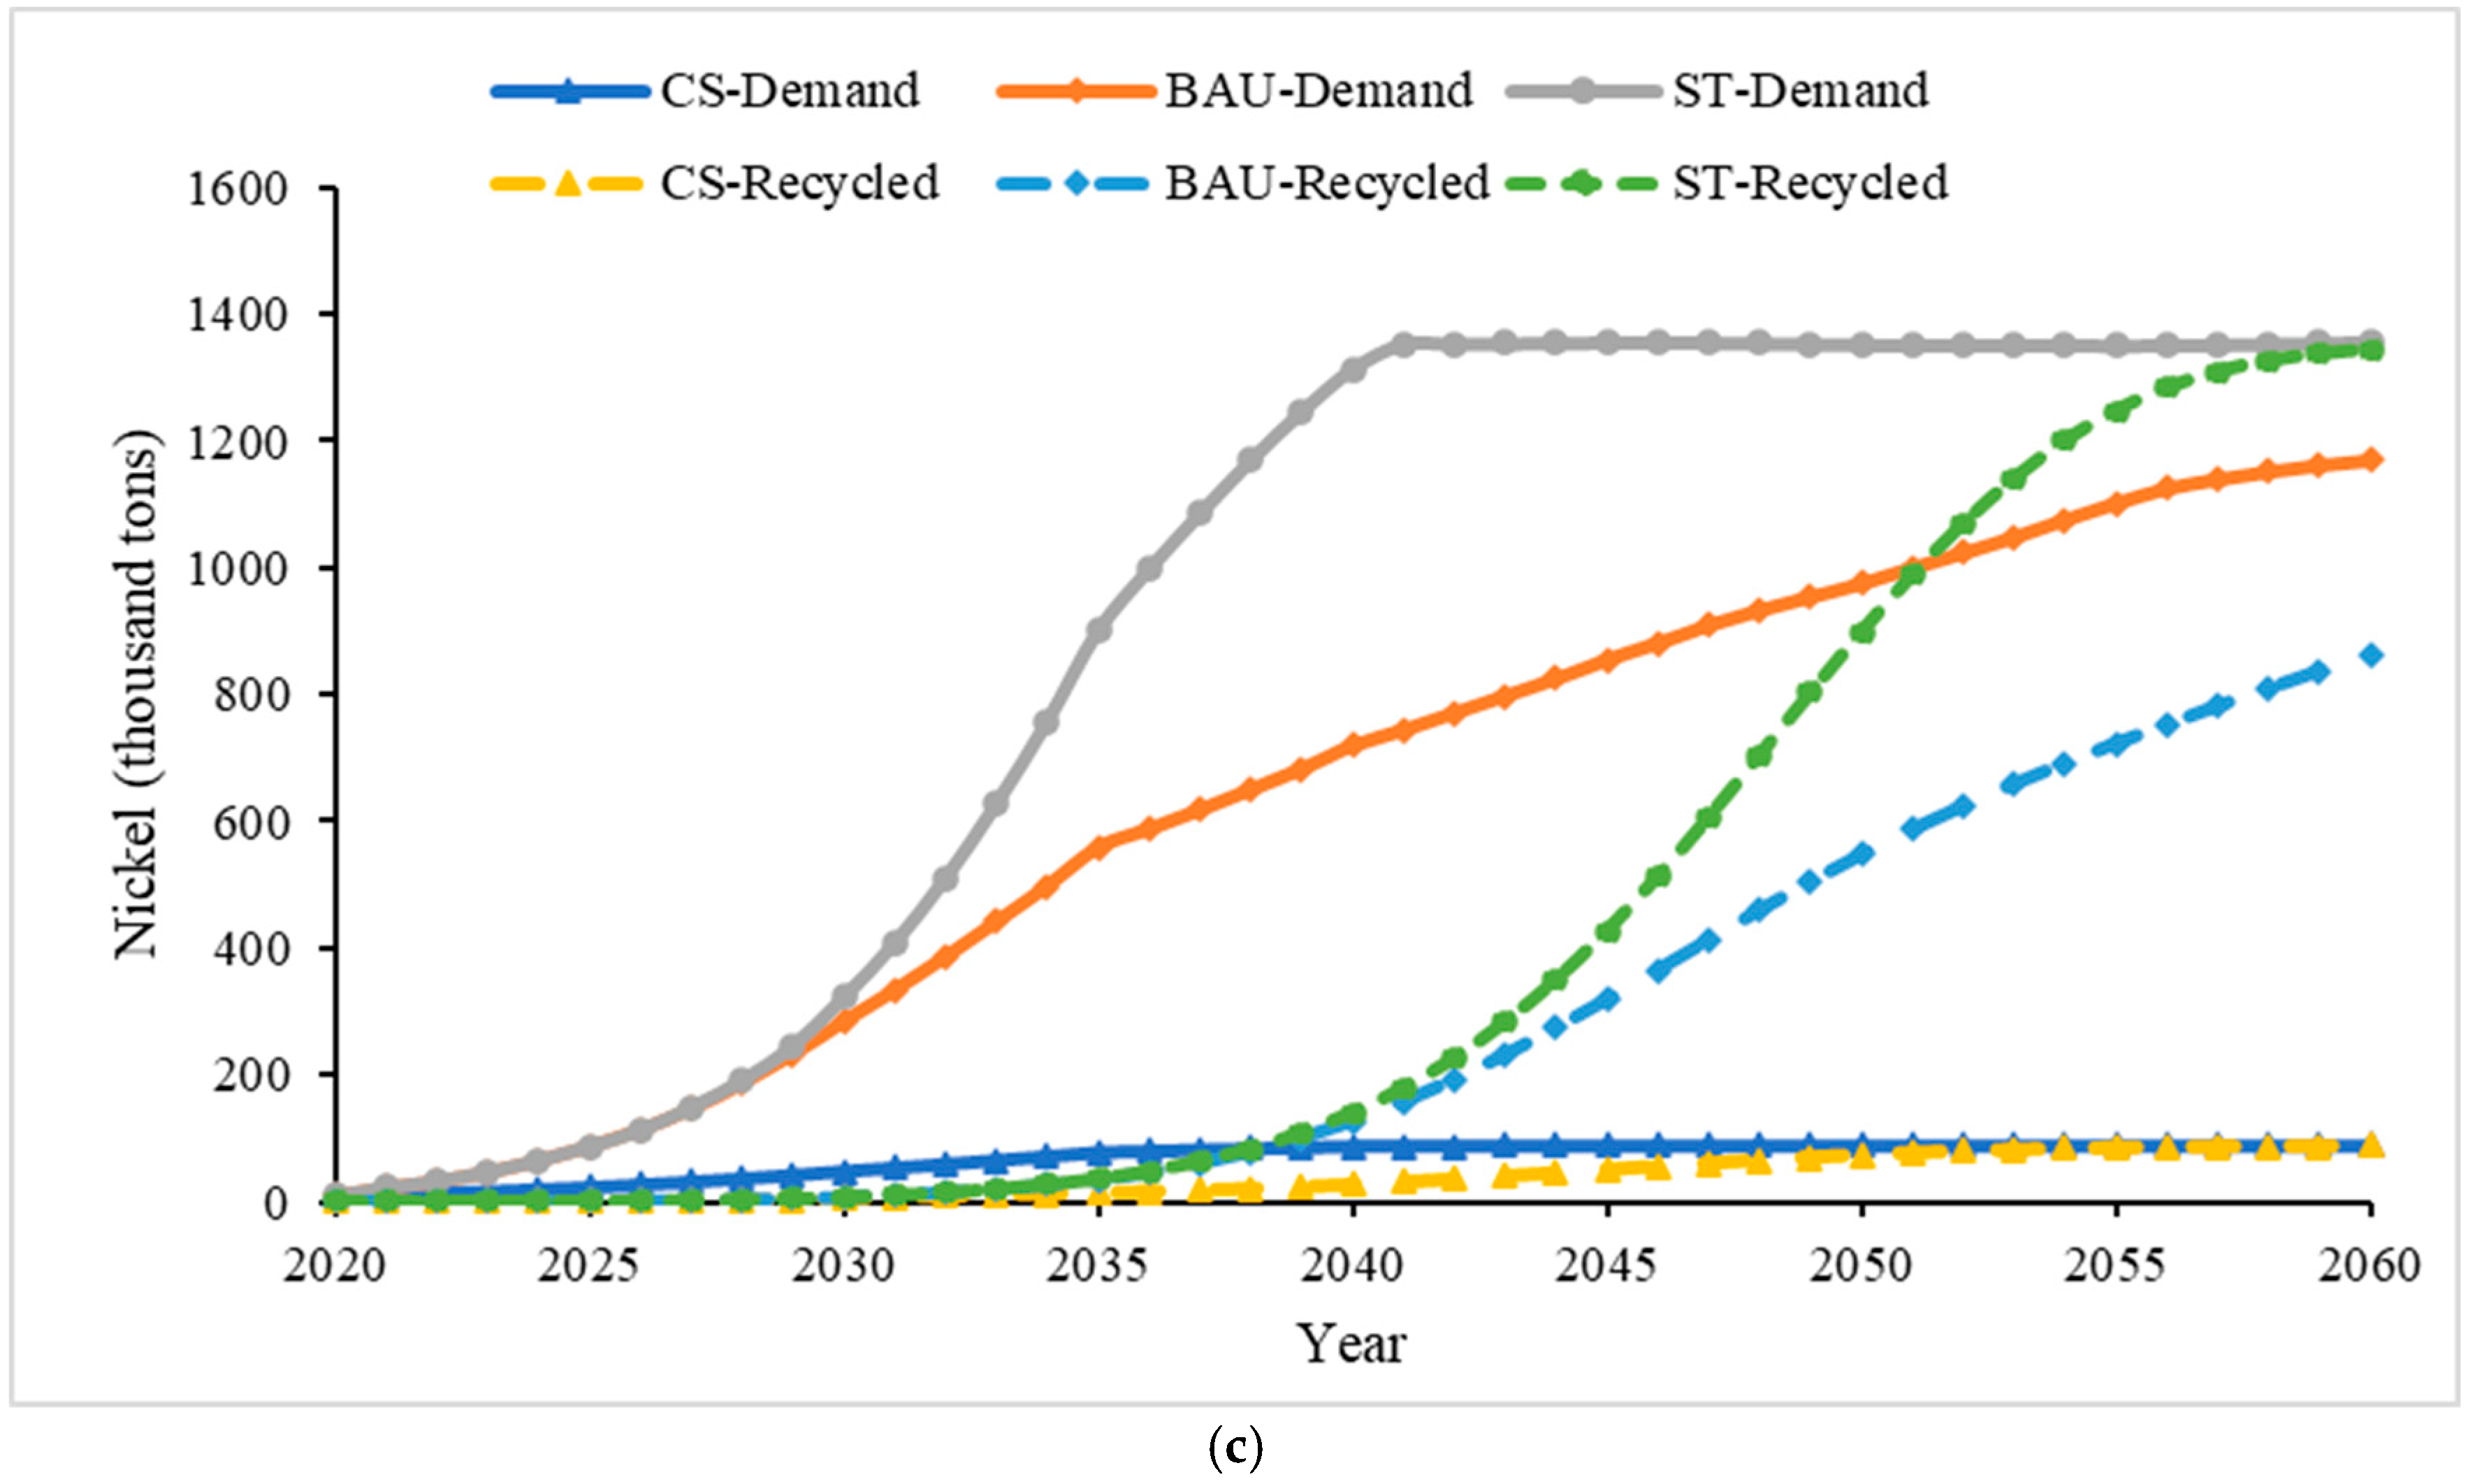
4.2. Critical Battery Material Demand and Material Potentially Recycled from Retired Batteries

The rapid penetration rate of NEVs under China’s dual carbon goals has increased the demand for critical materials, especially lithium, cobalt, and nickel, in automotive batteries. We systematically evaluated the market and critical battery materials that can potentially be recycled from retired batteries, then further assessed the potential bottleneck of critical materials in China.
Figure 10 shows the projections of cumulative demand for critical materials for passenger vehicle power batteries in China.
The result shows that by 2035, the cumulative demand for lithium will be 722 and 905 thousand tons under the BAU and ST scenarios, respectively. The global lithium reserves are relatively high, reaching 22 million tons by 2021, showing a rapid growth trend. China’s lithium reserves are also relatively rich, with 1.5 million tons in 2021 [47]. The lithium reserves can basically meet the increased demand for batteries, but the potential risks of short-term supply and demand imbalance still need attention.
Regarding cobalt resources, we estimated that by 2035, the cumulative demand for cobalt for new energy passenger vehicles will be 743 and 944 thousand tons under the BAU and ST scenarios, respectively. However, the cobalt reserves in China were only 130 thousand tons in 2020, and the cobalt reserves worldwide were 7.6 million tons. This indicates that by 2035, the cumulative demand for cobalt from new energy passenger vehicles in China will be 5.7 to 7.3 times larger than China’s total cobalt reserves and account for 10% to 12% of the world’s total cobalt reserves [47]. By 2060, the cumulative cobalt demand for new energy passenger vehicles will surge to 3.150 million tons under the BAU scenario and 4.515 million tons under the ST scenario. The geographical distribution of cobalt resources is also highly uneven. The cobalt reserves in the Congo (Kinshasa) account for 46% of the world’s total, and its production in 2021 accounted for 70% of the global output [47]. The imbalance in geographical cobalt distribution is a risk to the automotive battery supply chain.
The cumulative demand for nickel from new energy passenger vehicles will be 3.495 million tons under the BAU scenario and 4.536 million tons under the ST scenario by 2035. By 2060, the cumulative demand for nickel from new energy passenger vehicles will be 26.389 million tons under the BAU scenario and 37.415 million tons under the ST scenario. However, the world’s nickel reserves are plentiful, and the global reserves in 2021 was over 95 million tons.
Figure 11 shows our projections of annual demand and critical material that will potentially be recycled from retired batteries for China’s new energy passenger vehicles.
Developing new energy passenger vehicles in China will substantially increase the demand for lithium resources. Compared to the CS, by 2025, the annual new demand for lithium will reach 20 thousand tons. By 2035, the yearly new demand for lithium by NEVs will expand to 78 to 134 thousand tons. However, China’s lithium production in 2020 was only 13.3 thousand tons. Figure 11 shows that the extra annual demand for lithium produced by NEVs far exceeds the current annual production of lithium in China. Compared to the CS, the potential lithium that can be recycled from retired power batteries will rapidly increase. By 2035, the potential lithium recycled from retired power batteries will increase to 11 thousand tons annually, but this will only account for 8–12% of the annual demand. By 2050, the potential lithium recycled from retired power batteries will increase to 67–79% of the yearly demand.
In the future, the demand for cobalt from NEVs will steadily grow. Compared to the CS, by 2025, the annual new demand for cobalt will reach 17 thousand tons and increase to 88 to 151 thousand tons by 2035, which is far more than China’s 80,000 tons of reserves. China has a severe shortage of cobalt resources, with small reserves and annual production and weak domestic resource security. Before 2050, to meet the domestic consumption demand for cobalt resources and meet the gap between supply and demand, China will need to rely on imports, showing a high degree of external cobalt dependence.
In 2035 and 2050, the new demand for nickel from new energy passenger vehicles will be 481 to 823 and 886 to 1263 thousand tons, respectively, far exceeding the current annual demand. However, the world’s nickel reserves are plentiful, with over 95 million tons in 2021, which will support the medium- and long-term development of NEVs.

5. Conclusions and Policy Implications

5.1. Conclusions

This study evaluated the feasibility of achieving near-zero emissions by 2060 in the passenger vehicle operation stage and fuel cycle to help achieve the national carbon neutrality target and the bottleneck of critical materials from a fleet evolution perspective. First, we developed a CAFCM model of the evolution of China’s passenger vehicle fleet. Then, we designed different scenarios covering the upper and lower limits under the dual carbon targets. Under these scenarios, we assessed the total CO2 emitted by China’s passenger vehicles, the critical battery material demand, and the critical battery material that could be recycled from retired batteries from 2020 to 2060. The following are our conclusions:
  • Compared to the CS, the CO2 emissions in both the operation stage and the fuel cycle can achieve the goal of peak CO2 emissions by 2030. This result further verifies the rationality of the fuel consumption of Chinese passenger vehicles and the NEV development targets. Under the BAU scenario, the passenger vehicle CO2 emissions in the operation stage will be nearly zero by 2060. If the near-zero emissions target is achieved by 2050, the new vehicles sold must be almost 100% electric vehicles before 2040.
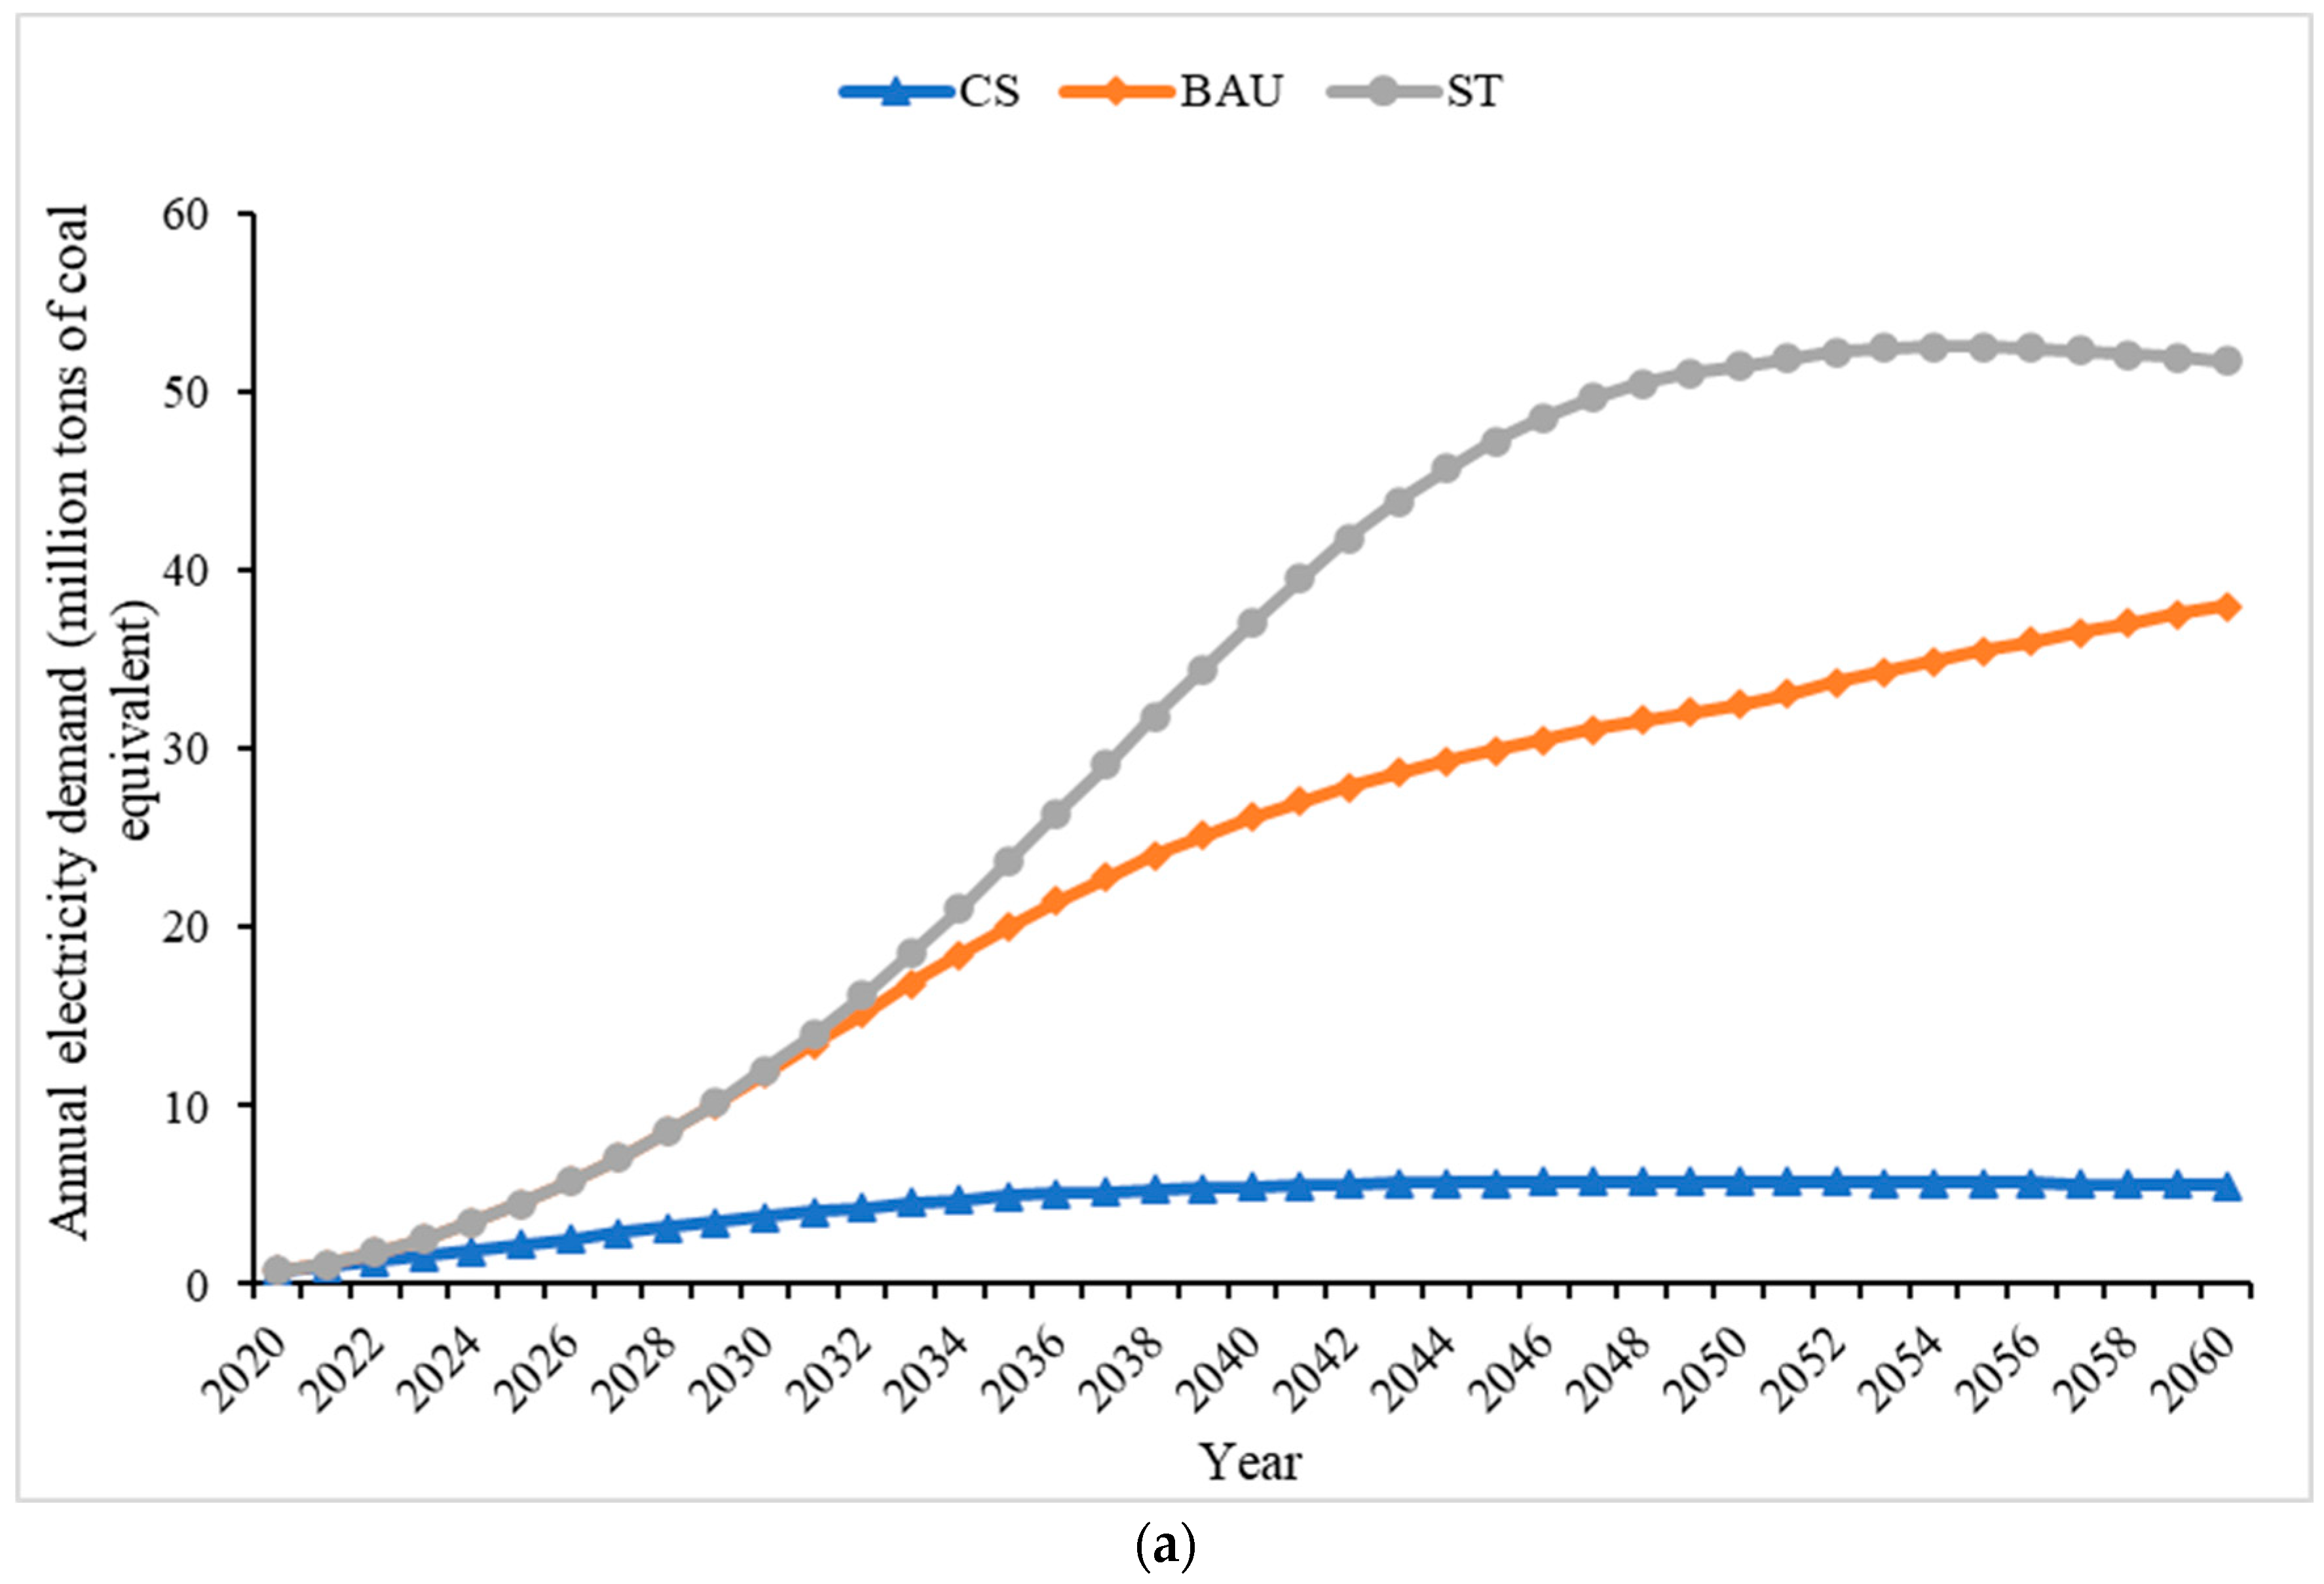
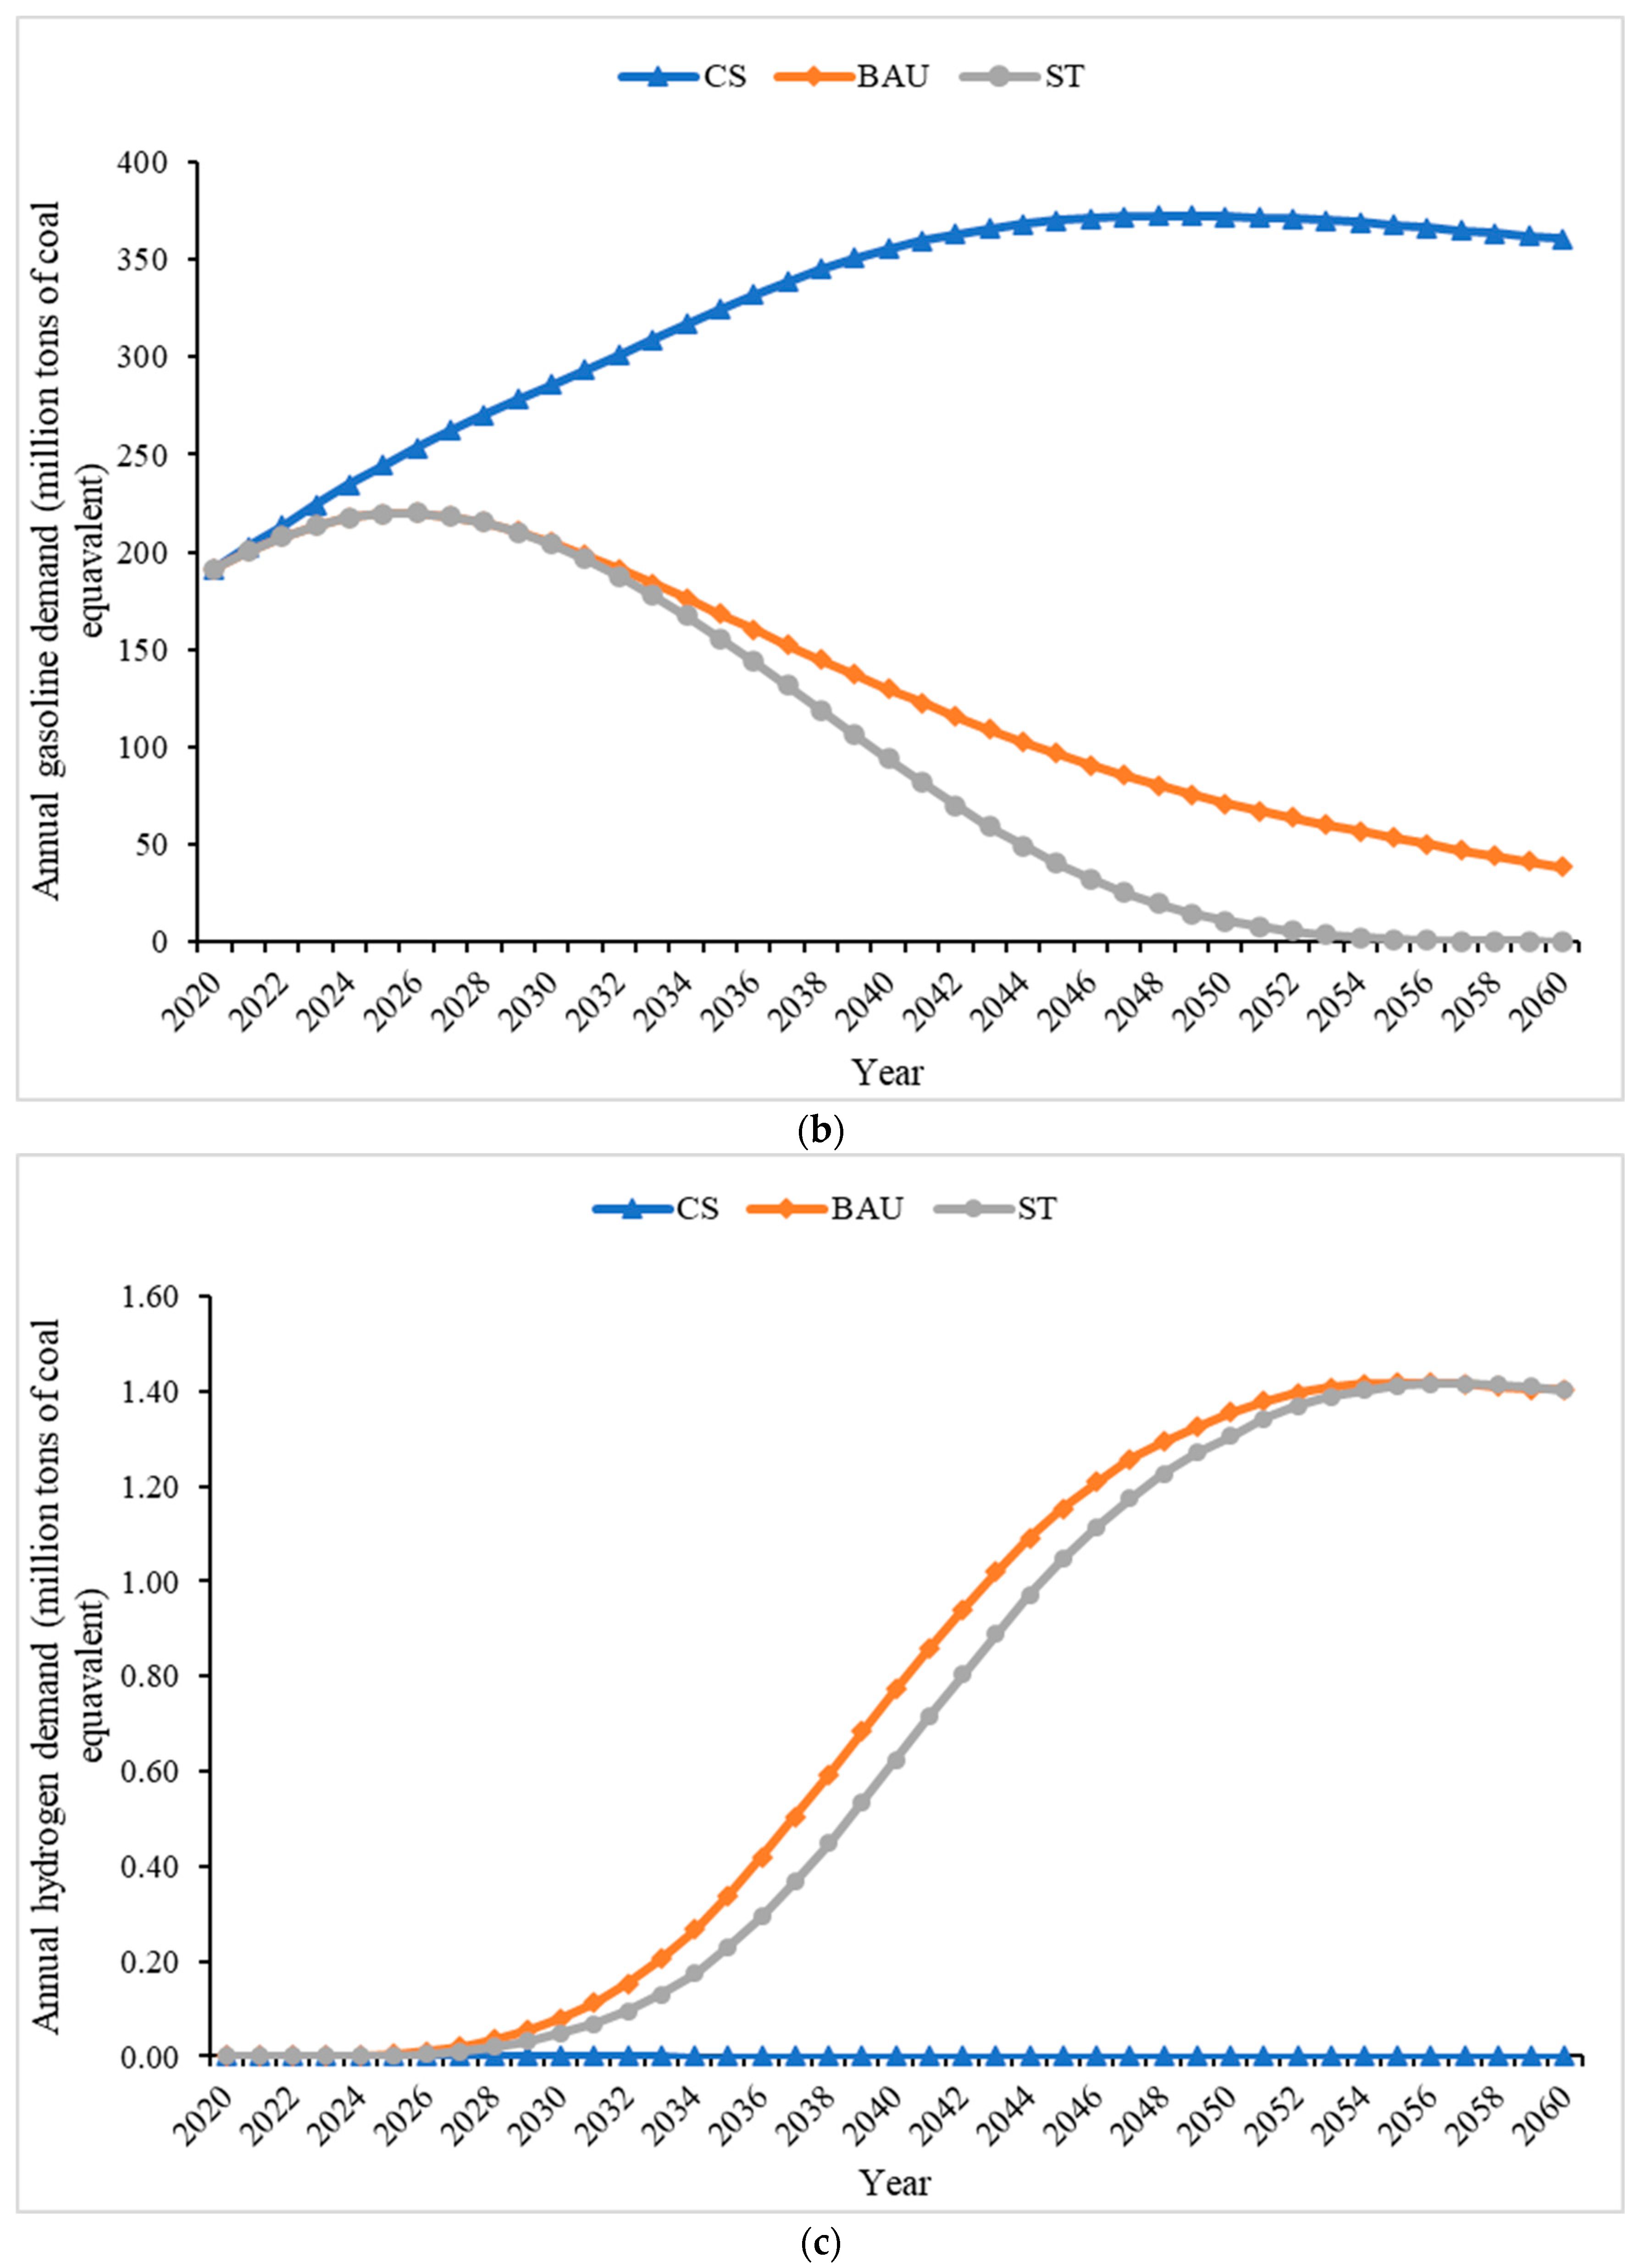
  • The realization of achieving near-zero carbon emissions from the vehicle operation stage by 2060 will quickly change the energy structure of vehicles from gasoline to electricity based. We found that China’s passenger vehicle gasoline demand will peak around 2026 and rapidly decline thereafter. The electricity demand from passenger vehicles will soon rise. Under the ST scenario, electricity demand in 2035 and 2060 will account for 2.1% and 4.0% of China’s total power generation in 2020, respectively. Hydrogen demand will rapidly rise after 2030 and remain above 3.8 million tons annually after 2055.
  • We found that achieving the dual carbon goals will further lead to a rapid increase in the demand for critical raw materials required for batteries. We identified potential risks in the supply of some raw materials, such as cobalt. We found that the lithium and nickel reserves can meet the increasing demand for power batteries, but the potential risks caused by short-term supply and demand imbalance still need attention. However, the cumulative demand for cobalt for new energy passenger vehicles in China will be 5.7 to 7.3 times larger than China’s total cobalt reserves. The imbalance in geographical cobalt distribution poses risks for the automotive battery supply chain.
  • The amount of critical materials that can be recycled from retired power batteries will rapidly increase in the future. However, new demand for critical battery materials will grow faster. The potential recycling of critical raw materials from retired power batteries will not substantially help meet the need for critical materials before 2035.

5.2. Policy Implications

The following are the policy implications:
  • The current Chinese passenger vehicle fuel consumption rate and NEV penetration targets are sufficient to meet the 2030 carbon peak goal. The achievement of the macroplanning goals requires the support of specific standards and policies. Therefore, China needs to improve passenger vehicle fuel consumption standards and fiscal and tax subsidies for NEVs and strengthen the role of standards and regulations in ensuring the implementation of planning goals.
  • China’s NEV promotion policies and key resource supply risks must be systematically coordinated under the dual carbon goals. NEVs are an essential aspect of achieving the dual carbon goals in the transportation sector but will lead to demand growth for critical raw materials. Our findings show that the electrification of passenger vehicles in China will produce a rapid increase in the demand for lithium, cobalt, and nickel and that the new demand for critical raw materials, such as cobalt, will far exceed the current reserves. The dependence on foreign critical raw materials is relatively high, even more than that for oil in China.
Therefore, we suggest (a) adopting a technology-neutral NEV fiscal policy to avoid policy intervention in battery technology advancements. Before 2020, fiscal subsidy policies mainly affected the evolution of battery technology in China. With the decline in subsidies and technological progress, battery technology will gradually shift from being policy to market led, (b) systematically plan the global distribution of China’s critical resources, (c) improve the ability to guarantee vital resources by systematically formulating medium- and long-term resource planning and strengthening the battery recycling system, and (d) vigorously innovate cobalt resource substitution technologies and intensify efforts to develop low-cobalt or cobalt-free cathode materials to reduce the demand for cobalt resources.

Author Contributions

Conceptualization, R.Y., L.C. and Y.L.; methodology, R.Y., L.C., Y.L. and C.R.; software, L.C.; formal analysis, R.Y. and L.C.; data curation, R.Y. and L.C.; writing—original draft, R.Y.; writing—review and editing, Y.L., C.R., D.Z. and P.L.; visualization, R.Y. All authors have read and agreed to the published version of the manuscript.

Funding

This research received no external funding.

Data Availability Statement

Data are contained within the article.

Conflicts of Interest

R.Y., L.C., Y.L., C.R., D.Z. and P.L. are employees of the China Automotive Technology and Research Center Co., Ltd. L.C. is an employee of Volkswagen (China) Investment Co., Ltd. The paper reflects the views of the scientists and not the company.

References

  1. United Nations (UN). The Paris Agreement. 2021. Available online: https://www.un.org/en/climatechange/paris-agreement (accessed on 17 September 2022).
  2. China’s Pledge to Cut CO2 Emissions Boosts Global Confidence in Climate Change. China Daily, 2020. Available online: https://www.chinadaily.com.cn/a/202009/25/WS5f6d9edfa31024ad0ba7be3f.html(accessed on 17 September 2022).
  3. Zahoor, A.; Yu, Y.; Zhang, H.; Nihed, B.; Afrane, S.; Peng, S.; Mao, G. Can the new energy vehicles (NEVs) and power battery industry help China to meet the carbon neutrality goal before 2060? J. Environ. Manag. 2023, 336, 117663. [Google Scholar] [CrossRef] [PubMed]
  4. China Automotive Technology and Research Center (CATARC). Annual Report on Energy-Saving and New Energy Vehicle in China 2022; China Automotive Technology and Research Center: Beijing, China, 2022. [Google Scholar]
  5. Jiao, Y.; Yu, L.; Wang, J.; Wu, D.; Tang, Y. Diffusion of new energy vehicles under incentive policies of China: Moderating role of market characteristic. J. Clean. Prod. 2022, 353, 131660. [Google Scholar] [CrossRef]
  6. Wang, X.; Dai, M.; Wang, W.; Gao, Y.; Qi, T.; Dong, X.; Ding, N. Greenhouse gas emissions and peak trend of commercial vehicles in China. J. Environ. Manag. 2023, 331, 117262. [Google Scholar] [CrossRef] [PubMed]
  7. Zheng, J.; Sun, X.; Jia, L.; Zhou, Y. Electric passenger vehicles sales and carbon dioxide emission reduction potential in China’s leading markets. J. Clean. Prod. 2020, 243, 118607. [Google Scholar] [CrossRef]
  8. MIIT (Ministry of Industry and Information Technology). Medium and Long-Term Development Plan for the Automotive Industry. 2017. Available online: https://www.miit.gov.cn/jgsj/zbys/wjfb/art/2020/art_a4bbca490fdd47209293e04ec811dae8.html (accessed on 17 September 2022).
  9. State Council. Notice of the General Office of the China State Council on Issuing the Development Plan for the New Energy Automobile Industry (2021–2035). 2020. Available online: http://www.gov.cn/zhengce/content/2020-11/02/content_5556716.htm (accessed on 17 September 2022).
  10. Tang, Y.; Tao, Y.; Li, Y. Collection policy analysis for retired electric vehicle batteries through agent-based simulation. J. Clean. Prod. 2023, 382, 135269. [Google Scholar] [CrossRef]
  11. Lyu, C.; Ou, X.; Zhang, X. China automotive energy consumption and greenhouse gas emissions outlook to 2050. Mitig. Adapt. Strateg. Glob. Chang. 2015, 20, 627–650. [Google Scholar] [CrossRef]
  12. González Palencia, J.C.; Otsuka, Y.; Araki, M.; Shiga, S. Scenario analysis of lightweight and electric-drive vehicle market penetration in the long-term and impact on the light-duty vehicle fleet. Appl. Energy 2017, 204, 1444–1462. [Google Scholar] [CrossRef]
  13. Osei, L.K.; Ghaffarpasand, O.; Pope, F.D. Real-World Contribution of Electrification and Replacement Scenarios to the Fleet Emissions in West Midland Boroughs, UK. Atmosphere 2021, 12, 332. [Google Scholar] [CrossRef]
  14. Simon, B.; Ziemann, S.; Weil, M. Potential metal requirement of active materials in lithium-ion battery cells of electric vehicles and its impact on reserves: Focus on Europe. Resour. Conserv. Recycl. 2015, 104, 300–310. [Google Scholar] [CrossRef]
  15. Martins, L.; Guimarães, L.; Junior, A.; Tenório, J.; Espinosa, D. Electric car battery: An overview on global demand, recycling and future approaches towards sustainability. J. Environ. Manag. 2021, 295, 113091. [Google Scholar] [CrossRef]
  16. Du, S.; Gao, F.; Nie, Z.; Liu, Y.; Sun, B.; Gong, X. Assessing resource depletion of NCM lithium-ion battery production for electric vehicles: An exergy-based perspective. J. Clean. Prod. 2023, 420, 138415. [Google Scholar] [CrossRef]
  17. Olivetti, E.A.; Ceder, G.; Gaustad, G.G.; Fu, X. Lithium-Ion Battery Supply Chain Considerations: Analysis of Potential Bottlenecks in Critical Metals. Joule 2017, 1, 229–243. [Google Scholar] [CrossRef]
  18. Ou, S.; Hsieh, I.Y.L.; He, X.; Lin, Z.; Yu, R.; Zhou, Y.; Bouchard, J. China’s vehicle electrification impacts on sales, fuel use, and battery material demand through 2050: Optimizing consumer and industry decisions. iScience 2021, 24, 103375. [Google Scholar] [CrossRef] [PubMed]
  19. Zheng, J.; Zhou, Y.; Yu, R.; Zhao, D.; Lu, Z.; Zhang, P. Survival rate of China passenger vehicles: A data-driven approach. Energy Policy 2019, 129, 587–597. [Google Scholar] [CrossRef]
  20. Huo, H.; Zhang, Q.; He, K.; Yao, Z.; Wang, M. Vehicle-use intensity in China: Current status and future trend. Energy Policy 2012, 43, 6–16. [Google Scholar] [CrossRef]
  21. IEA. Carbon Intensity of Electricity Generation in Selected Regions in the Announced Pledges and Net Zero Scenarios, 2000–2040; IEA: Paris, France, 2020. [Google Scholar]
  22. IEA. Carbon Intensity of Electricity Generation in Selected Regions in the Sustainable Development Scenario, 2000–2040; IEA: Paris, France, 2020. [Google Scholar]
  23. CCG (China City Greenhouse Gas Working Group) (Ed.) China Products Carbon Footprint Factors Database; China Environmental Science Press: Beijing, China, 2022. [Google Scholar]
  24. The Faraday Institution. Lithium, Cobalt and Nickel: The Gold Rush of the 21st Century; The Faraday Institution: London, UK, 2020. [Google Scholar]
  25. Winsor, C.P. The Gompertz curve as a growth curve. Proc. Natl. Acad. Sci. USA 1932, 18, 1–8. [Google Scholar] [CrossRef]
  26. Hawkins, T.; Hendrickson, C.; Higgins, C.; Matthews, H.S.; Suh, S. A mixed-unit input-output model for environmental life-cycle assessment and material flow analysis. Environ. Sci. Technol. 2007, 41, 1024–1031. [Google Scholar] [CrossRef]
  27. Islam, M.T.; Huda, N. Material flow analysis (MFA) as a strategic tool in E-waste management: Applications, trends and future directions. J. Environ. Manag. 2019, 244, 344–361. [Google Scholar] [CrossRef]
  28. Sierzchula, W.; Bakker, S.; Maat, K.; Van Wee, B. The influence of financial incentives and other socio-economic factors on electric vehicle adoption. Energy Policy 2014, 68, 183–194. [Google Scholar] [CrossRef]
  29. Mcfadden, D.L. Condition Logit Analysis of Qualitative Choice Behavior; Academic Press: Cambridge, MA, USA, 1974; pp. 105–142. [Google Scholar]
  30. Manski, C.F. The structure of random utility models. Theory Decis. 1977, 8, 229. [Google Scholar] [CrossRef]
  31. China Automotive Technology and Research Center (CATARC). Research on the Development Trend of Conventional and New Energy Vehicles to 2050; China Automotive Technology and Research Center: Beijing, China, 2019. [Google Scholar]
  32. Lu, Z.; Zhou, Y.; Cai, H.; Wang, M.; He, X.; Przesmitzki, S. China Vehicle Fleet Model: Estimation of Vehicle Stocks, Usage, Emissions, and Energy Use—Model Description, Technical Documentation, and User Guide; Argonne National Laboratory: Lemont, IL, USA, 2018.
  33. UN (United Nations) (Ed.) World Population Prospects 2019. 2019. Available online: https://population.un.org/wpp/ (accessed on 17 September 2022).
  34. MIIT-EIDC (Ministry of Industry and Information Technology Eauipment Industry Development Center). China Automobile Industry Development Annual Report (2021); MIIT-EIDC: Beijing, China, 2021.
  35. State Council. Carbon Peak Action Plan by 2030. 2021. Available online: http://www.gov.cn/zhengce/content/2021-10/26/content_5644984.htm (accessed on 17 September 2022).
  36. Marotta, A.; Pavlovic, J.; Ciuffo, B.; Serra, S.; Fontaras, G. Gaseous Emissions from Light-Duty Vehicles: Moving from NEDC to the New WLTP Test Procedure. Environ. Sci. Technol. 2015, 49, 8315–8322. [Google Scholar] [CrossRef] [PubMed]
  37. CSAE (China Society of Automotive Engineers). Energy-Saving and New Energy Vehicle Technology Roadmap 2.0; China Machine Press: Beijing, China, 2021. [Google Scholar]
  38. Ou, S.; Yu, R.; Lin, Z.; Ren, H.; He, X.; Przesmitzki, S.; Bouchard, J. Intensity and daily pattern of passenger vehicle use by region and class in China: Estimation and implications for energy use and electrification. Mitig. Adapt. Strateg. Glob. Chang. 2020, 25, 307–327. [Google Scholar] [CrossRef]
  39. IEA. An Energy Sector Roadmap to Carbon Neutrality in China; IEA: Paris, France, 2021. [Google Scholar]
  40. IEA. World Energy Model; IEA: Paris, France, 2021. [Google Scholar]
  41. State Council. Energy-Saving and New Energy Vehicle Industry Development Plan (2012–2020). 2012. Available online: http://www.gov.cn/zwgk/2012-07/09/content_2179032.htm (accessed on 17 September 2022).
  42. State Council. Notice of the Four Ministries and Commissions on Adjusting the Fiscal Subsidy Policy for the Promotion and Application of New Energy Vehicles. 2016. Available online: http://www.gov.cn/xinwen/2016-12/30/content_5154971.htm#1 (accessed on 17 September 2022).
  43. Baars, J.; Domenech, T.; Bleischwitz, R.; Melin, H.E.; Heidrich, O. Circular economy strategies for electric vehicle batteries reduce reliance on raw materials. Nat. Sustain. 2021, 4, 71–79. [Google Scholar] [CrossRef]
  44. Wentker, M.; Greenwood, M.; Leker, J. A Bottom-Up Approach to Lithium-Ion Battery Cost Modeling with a Focus on Cathode Active Materials. Energies 2019, 12, 504. [Google Scholar] [CrossRef]
  45. IEA (International Energy Agency). Global EV Outlook 2018; IEA: Paris, France, 2018. [Google Scholar]
  46. NBS (National Bureau of Statistics). China’s 2020 Year National Economic and Social Development of Statistical Bulletin. 2021. Available online: http://www.stats.gov.cn/tjsj/zxfb/202102/t20210227_1814154.html (accessed on 17 September 2022).
  47. USGS (U.S. Geological Survey). Mineral Commodity Summaries 2022, Mineral Commodity Summaries; U.S. Geological Survey: Reston, VA, USA, 2022; p. 202.
Figure 1. Structure of CAFCM [4,19,20,21,22,23,24].
Wevj 15 00014 g001
Figure 2. The relationship between GDP per capita and passenger vehicle ownership per thousand people in different countries.
Wevj 15 00014 g002
Figure 3. Historical and projections of the relationship between GDP per capita and passenger vehicle ownership per thousand people in China.
Wevj 15 00014 g003
Figure 4. Projections of China’s yearly passenger vehicle stock from 2020 to 2060.
Wevj 15 00014 g004
Figure 5. Projections of annual passenger vehicle sales in China from 2020 to 2060.
Wevj 15 00014 g005
Figure 6. Scenarios of yearly powertrain type penetration rate. Note: ICEV, internal combustion engine vehicle; PHEV, plug-in hybrid electric vehicle; BEV, battery electric vehicle; FCEV, fuel cell electric vehicle. (a) Powertrain type market penetration rate under the BAU scenario. (b) Powertrain type market penetration rate under the ST scenario.
Wevj 15 00014 g006
Figure 7. Historical and projected distribution of different power battery types for passenger vehicles from 2015 to 2060 in China. Note: NCA, nickel–cobalt–aluminum.
Wevj 15 00014 g007
Figure 8. Projections of yearly demand for different types of energy for passenger vehicles under different scenarios from 2020 to 2060. (a) Electricity. (b) Gasoline. (c) Hydrogen.
Wevj 15 00014 g008aWevj 15 00014 g008b
Figure 9. Projections of yearly CO2 emissions for passenger vehicles under different scenarios from 2020 to 2060. Note: The fuel cycle includes both the upstream fuel well-to-pump stage and on-road pump-to-wheel stage. (a) CO2 emissions in the operation stage. (b) CO2 emissions in the fuel cycle.
Wevj 15 00014 g009
Figure 10. Projections of cumulative yearly demand for critical materials for passenger vehicle batteries in China from 2020 to 2060. (a) Cumulative demand for lithium. (b) Cumulative demand for cobalt. (c) Cumulative demand for nickel.
Wevj 15 00014 g010aWevj 15 00014 g010b
Figure 11. Projections of annual demand and critical battery materials potentially recycled from retired batteries for China’s new energy passenger vehicles. (a) Lithium. (b) Cobalt. (c) Nickel.
Wevj 15 00014 g011aWevj 15 00014 g011b
Table 1. Vehicle energy efficiency under CS.
ParameterICEVsBEVsPHEVsFCEVs
Energy efficiency6.88 L/100 km in WLTP [4]
Converted to 6.91 L/100 km in WLTP [36]
12.45 kWh/100 km [4]Charge depletion mode: 14.25 kWh/100 km
Charge sustaining mode: 4.3 L/100 km
1.2 kg/100 km
Note: Charge-depletion mode assumes that battery electricity is used as the primary energy source; charge-sustaining mode assumes that the vehicle is using energy from the tank only and any secondary means of energy storage is not depleted; WLTP, Worldwide Harmonized Light Vehicle Test Procedure.
Table 2. CO2 intensity by fuel type.
ScenarioFuel TypeStageCurrent203020402060
CSGasoline (kg CO2/kg) [23]Upstream0.810.810.810.81
Downstream3.043.043.043.04
Electricity (kg CO2/kWh)Upstream0.530.530.530.53
Downstream0000
Hydrogen (kg CO2/kg) [23]Upstream24.6724.6724.6724.67
Downstream0000
BAUGasoline (kg CO2/kg) [23]Upstream0.810.810.810.81
Downstream3.043.043.043.04
Electricity (kg CO2/kWh) [21]Upstream0.530.4160.200.10
Downstream0000
Hydrogen (kg CO2/kg) [23]Upstream24.6720.0010.778.25
Downstream0000
STGasoline (kg CO2/kg) [23]Upstream0.810.810.810.81
Downstream3.043.043.043.04
Electricity (kg CO2/kWh) [22]Upstream0.530.340.1010.05
Downstream0000
Hydrogen (kg CO2/kg) [23]Upstream24.6710.008.006.00
Downstream0000
Note: Upstream, well-to-tank; downstream, tank-to-wheel.
Table 3. Critical material intensity of key cathode chemistries (kg/kWh).
LithiumNickelCobalt
NCA0.100.670.13
NMC 1110.150.400.40
NMC 4330.140.470.35
NMC 5320.140.590.23
NMC 6220.130.610.19
NMC 8110.110.750.09
NMC 9.5.50.100.860.05
LFP0.10××
Note: Metal content values in different chemistries for NCM 9.5.5 were derived from Baars et al. [43] and Wentker et al. [44]. Other values were derived from IEA [45].
Disclaimer/Publisher’s Note: The statements, opinions and data contained in all publications are solely those of the individual author(s) and contributor(s) and not of MDPI and/or the editor(s). MDPI and/or the editor(s) disclaim responsibility for any injury to people or property resulting from any ideas, methods, instructions or products referred to in the content.

