Article

Parameter Optimization of the Power and Energy System of Unmanned Electric Drive Chassis Based on Improved Genetic Algorithms of the KOHONEN Network

1
Department of Traffic Information Engineering, Henan College of Transportation, Zhengzhou 451460, China
2
School of Mechanical and Electrical Engineering, Xi’an University of Architecture and Technology, Xi’an 710054, China
3
Vehicle Electrical Branch Company, Jianglu Machinery Electronics Group Co., Ltd., Xiangtan 411101, China
*
Author to whom correspondence should be addressed.
World Electr. Veh. J. 2023, 14(9), 260; https://doi.org/10.3390/wevj14090260
Submission received: 9 June 2023 / Revised: 1 September 2023 / Accepted: 4 September 2023 / Published: 14 September 2023
(This article belongs to the Topic Advanced Electric Vehicle Technology)

Abstract

:
For unmanned electric drive chassis parameter optimization problems, an unmanned electric drive chassis model containing power systems and energy systems was built using CRUISE, and as the traditional genetic algorithm is prone to falling into the local optima, an improved isolation niche genetic algorithm based on KOHONEN network clustering (KIGA) is proposed. The simulation results show that the proposed KIGA can reasonably divide the initial niche populations. Compared with the traditional genetic algorithm (GA) and the isolation niche genetic algorithm (IGA), KIGA can achieve faster convergence and a better global search ability. The comprehensive performance of the unmanned electric drive chassis in terms of power and economy was increased by 8.26% with a set of better solutions. The results show that simultaneous power system and energy system parameter optimization can enhance unmanned electric drive chassis performance and that KIGA is an efficient method for optimizing the parameters of unmanned electric drive chassis.

1. Introduction

With the worsening energy crisis and environmental crisis, the development of electric vehicles has attracted the attention of governments, enterprises, and research institutions around the world. However, due to the bottleneck of energy storage technology, which is difficult to break through in a short period of time, the large-scale application of electric vehicles in the field of passenger vehicles is limited. Therefore, current electric vehicles have been developed rapidly and promoted on a large scale in the field of urban public transportation, with fixed operating lines and the convenience of fast charging and swapping. Urban unmanned electric drive chassis have also attracted the attention of many automobile companies and research institutions. The performance of the unmanned electric drive chassis power system has a great influence on the performance of the car, so parameter matching and the optimization of the electric vehicle power system have become important directions of electric vehicle research [1].
Liang Li et al. [2] combined the enhanced genetic algorithm with the simulated annealing algorithm to optimize the power system parameters and control parameters of the plug-in hybrid bus, such that the power and economy of the vehicle under urban conditions were greatly improved. Hegazy, O [3], and others used the particle swarm optimization algorithm to optimize the design parameters and energy flow control strategy of a fuel cell/supercapacitor hybrid electric vehicle and fuel cell/battery hybrid electric vehicle under NEDC and FTP75 conditions, which reduced the size of the vehicle components and reduced the cost and fuel consumption of the whole vehicle. Morteza Montazeri-Gh [4] used a genetic algorithm to optimize the control strategy of a parallel hybrid electric vehicle. Under the three working conditions of ECE-EUDC, FTP, and TEH-CAR, it can reduce FC and emissions while ensuring power performance. Based on the equivalent circuit model of the RC-H battery, the energy control strategy based on fuzzy logic is established, and the energy consumption of the whole vehicle is optimized by dynamic programming. Finally, the efficiency of the battery is improved, and the power and economy of the pure electric vehicle are improved [5]. By designing the CFA6470HEV energy assembly control system, Deng Yuanwang optimized the energy assembly control system with the design parameters of the engine throttle and the vehicle gear, verified the optimization strategy through the battery SOC estimation model, and finally improved the energy utilization rate of HEV under the mild hybrid control strategy [6]. Fei Lei mainly used hierarchical analysis, analyzing performance step by step from the vehicle level and subsystem level, transforming the three performances of the whole vehicle into the optimization of the efficiency and quality of the hub motor. Finally, using the genetic algorithm, the Pareto optimal solution is reasonably selected to optimize the electric vehicle transmission system within a suitable range [7]. Morozov A. analyzed and optimized the drivetrain of a two-speed class-4 electric delivery truck. They compared different powertrain layouts and proposed four new traction motor designs for medium-duty electric trucks. The study found that a single-speed gearbox and a permanent magnet synchronous motor was the most efficient powertrain combination for the e-truck [8]. David conducted a systematic review of the technologies, control methods, and optimization techniques for extended-range electric vehicles, covering their architecture, key components, and interactions, as well as methods for finding optimal system-level designs, and discussed the most commonly used configurations and the cost of implementing energy recovery and autonomy-increasing technologies [9].
Most of the above research separates the power system optimization from the energy system optimization. However, due to the close coupling relationship between the unmanned electric drive chassis power system and the energy system, it is difficult to achieve the optimal performance of the whole vehicle only from a single perspective. Therefore, it is necessary to combine power system optimization with energy system optimization to collaboratively optimize the performance of the unmanned electric drive chassis.
However, the parameter optimization of unmanned electric drive chassis is a typical multi-objective, non-differentiable, discontinuous, conditional constraint, and represents a highly nonlinear complex system optimization problem [2]. There are two kinds of optimization algorithms: gradient algorithms and non-gradient algorithms. Among them, non-gradient algorithms, represented by the genetic algorithm, are more suitable for unmanned electric drive chassis parameter optimization because they do not require the gradient information of the objective function and have a strong global search ability. However, due to the existence of local extreme points in the genetic algorithm, if the parameter setting is unreasonable, it is easy to fall into the local optimum in the optimization process. Therefore, researchers have proposed a variety of measures to improve the performance of the genetic algorithm.
At present, most of the research on unmanned electric drive chassis aims to reduce energy consumption by optimizing motor efficiency, and using high-power, high-torque motors for direct drive. In this case, power will be wasted, which is not conducive to energy conservation and emission reduction. Most of the current research is focused on direct drive, and there is little research on the optimization of the transmission ratio of electric vehicle transmission [10]. Most of the research on the optimization of transmission ratios is aimed at dynamic performance, and less consideration is given to the impact of economy [11]. For unmanned electric drive chassis, their driving conditions and driving speeds are more complex than simple city buses and require transmissions.
The above research has achieved good results in the optimization of power and energy systems, but there is still a lack of in-depth research on the influence of the coupling relationship between the power system and energy system on vehicle performance improvement, and there is also a lack of sufficient research on the adverse effects of genetic algorithm limitations on optimization results. Therefore, this paper uses CRUISE to establish a model for the power system and energy system of unmanned electric drive chassis. Aiming at the shortcomings of the isolated niche genetic algorithm (IGA) [12], which struggles to reasonably divide the original niche population, an improved isolated niche genetic algorithm (KIGA) based on the KOHONEN network is proposed, which is used to optimize the parameters of unmanned electric drive chassis. To sum up, the highlights of this paper include the following two points:
(1) By analyzing the mutual coupling relationship between the power system and energy system of unmanned electric drive chassis, a comprehensive performance optimization model for electric vehicles that includes both the power system and energy system is proposed;
(2) To overcome the disadvantage of traditional genetic algorithms being prone to falling into local optima, an improved isolated niche genetic algorithm based on the KOHONEN network is proposed, which effectively improves the optimization speed and results.

2. Establishment of the Simulation Model and Optimization Model

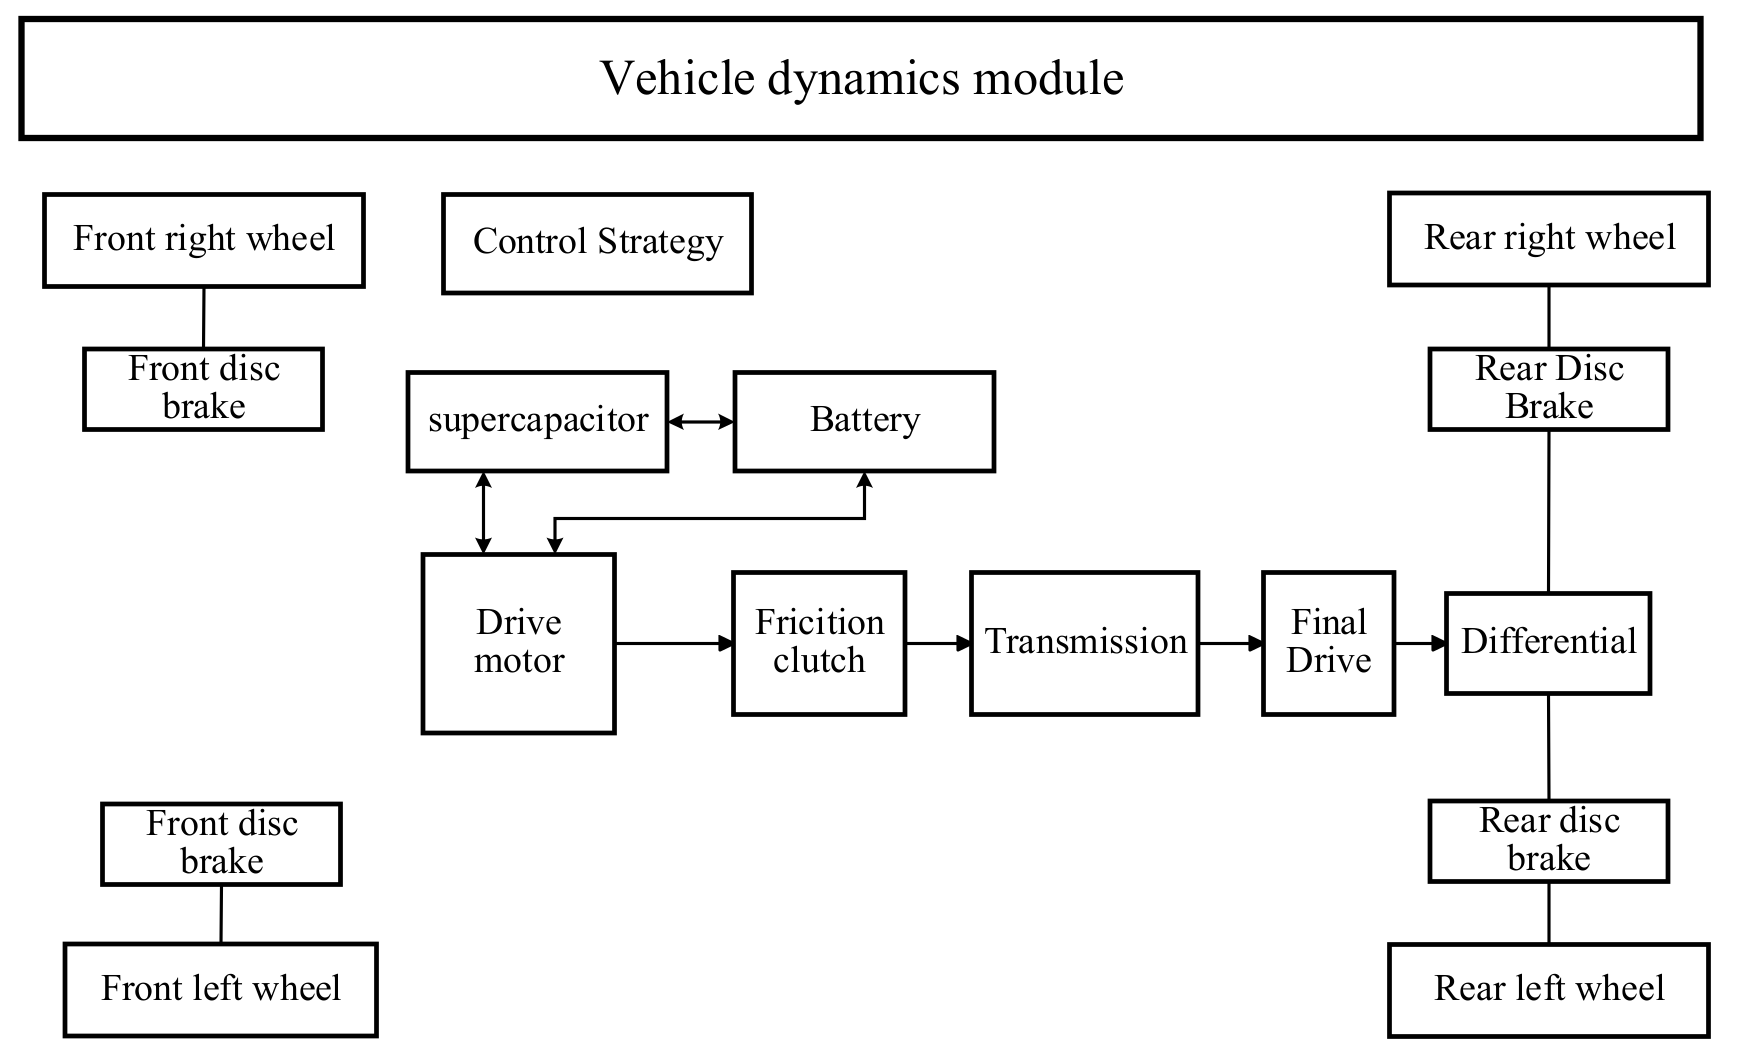
2.1. Establishment of Unmanned Electric Drive Chassis Simulation Model Based on AVL CRUISE

As a complex system, automobile performance is restricted by many factors, and it is difficult to predict using a simple mathematical model. Therefore, professional automobile performance simulation software has become an important tool for automobile performance research [13]. Among the various pieces of software, the vehicle performance simulation analysis software CRUISE developed by the AVL company can realize the forward and reverse dynamic optimization operation, which is close to the actual operation, and the result is more accurate [14]. Based on the technical parameters of the first-generation unmanned electric drive chassis, the basic parameters of the first-generation unmanned electric drive chassis are shown in Table 1, and these parameters are used as initial values for subsequent optimizations. Additionally, the dynamic analysis model of the unmanned electric drive chassis is established by CRUISE software, guided by the modeling schematic diagram in Figure 1. The model uses a composite energy source composed of a battery and a supercapacitor to provide energy for the unmanned electric drive chassis, and the control strategy of the composite energy system is shown in Figure 2.

2.2. Modeling of Power System and Energy System

Different from traditional fuel vehicles, the voltage, and capacity of the battery of the unmanned electric drive chassis also determine the power performance of the vehicle (more specifically, the engine system of the traditional fuel vehicle is basically equivalent to the sum of the energy storage system and the motor drive system of the unmanned electric drive chassis). Therefore, there is a coupling relationship between the power system and the energy system of the electric vehicle. The coupling connection variables are voltage and current.
The electric vehicle power system includes a drive motor and a transmission system. Of the two, the transmission ratio in the transmission system has a greater impact on the vehicle’s power performance. By reasonably optimizing the transmission ratio of the transmission system, the vehicle can attain a larger climbing degree and acceleration energy. Additionally, a reasonable transmission ratio can enable the motor to work in a high-efficiency range for a long time, thereby improving the economy of the vehicle and improving the efficiency of the energy system.

2.2.1. Motor Model

The motor is the core component of a pure unmanned electric drive chassis. During the driving process, the motor works in the electric operation state, converting the electric energy of the battery into mechanical energy to drive the vehicle [15]; during the braking process, the motor works in the power generation state, converting the mechanical energy of the vehicle into electrical energy and storing it in the battery [16]. In this paper, the permanent magnet DC motor is used as the model, and the DC motor model is established by combining the theoretical analysis of the voltage balance equation with the motor efficiency test.
Armature voltage balance equation of a permanent magnet DC motor [17]:
U d = E + R a i d + L a d i d d t
E = K e ω
Motor torque equation:
T e T L = J d ω d t + B ω
T e = K T i d
In the formula, Ud is the motor armature voltage; E is the armature-induced electromotive force; Ra is the armature circuit resistance; La is the armature circuit inductance; id is the armature circuit current; Ke is the motor electromotive force constant; ω is the motor speed (r/min); Te is the electromagnetic torque; TL is the load torque; J is the moment of inertia (kg/m2); B is the viscous friction coefficient; and KT is the motor torque constant.

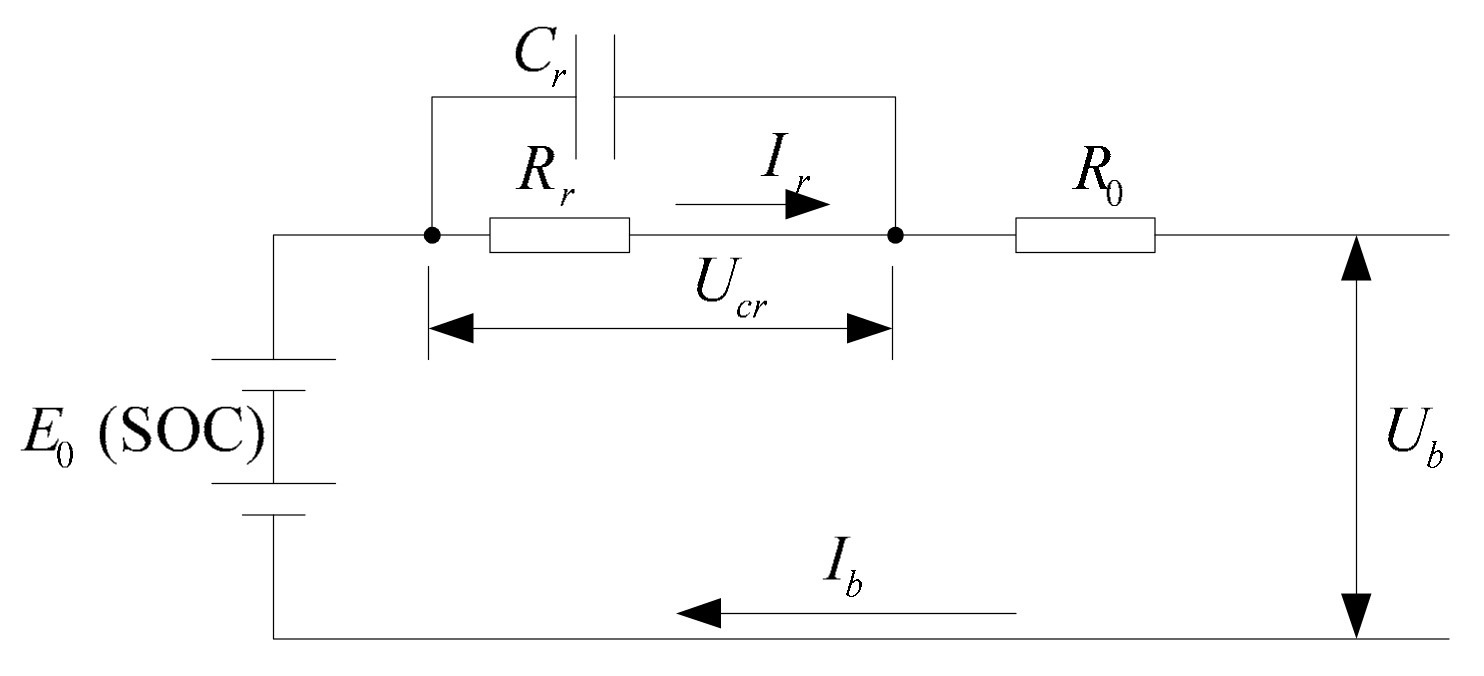
2.2.2. Battery Model

The battery charge and discharge characteristics result in a complex process, and the battery model should be able to reflect these characteristics. In this paper, the equivalent circuit simulation method is used to establish the lithium iron phosphate battery model. The equivalent circuit structure diagram is shown in Figure 3. This model equates the battery to a physical model and then determines the relevant parameters in the model through formula derivation and the battery charge and discharge test.
In the model, E0 is the battery static open circuit voltage; R0 is the ohm polarization resistance, which is mainly affected by the concentration of sulfuric acid in the electrolyte; Rr is the concentration polarization and electrochemical polarization resistance of the storage battery; the RC circuit is formed by Rr; and the capacitor Cr affects the transition process when the working condition of the battery changes.
The model parameters of the lithium iron phosphate battery are affected by factors such as the battery state of charge, ambient temperature, battery charge and discharge current, and number of cycles [18]. In this paper, when establishing a lithium iron phosphate battery model, the influence of environmental temperature, battery charge–discharge current, and the number of cycles on the model is ignored. The battery state of charge is used as the only factor affecting the battery model parameters, and the battery model is established.
According to the battery resistance capacitance model, the mathematical model of the charging and discharging of a lithium iron phosphate battery can be described as follows:
E 0 I b R 0 I r R r U b = 0
d U c r / d t = ( I b I r ) / C r
In the above formula, Ub is the battery terminal voltage; U0 is the static open circuit voltage of the storage battery; R0 is the polarization internal resistance; Rr is the battery concentration polarization and electrochemical polarization resistance; and Cr is the equivalent capacitance.
During charging and discharging, the battery SOC has a great influence on the battery terminal voltage Ub and polarization internal resistance R0 [19]. Therefore, the battery terminal voltage Ub and polarization internal resistance R0 are expressed as functions of SOC, and their mathematical expressions are as follows:
U b ( S O C ) = f ( S O C )
R 0 ( S O C ) = g ( S O C )
The concentration polarization and electrochemical polarization resistance of storage battery Rr are quite different during charging and discharging, so the mathematical models [17,20,21] should be established during charging and discharging, respectively, as the following formula:
R r ( S O C ) = R r _ c h arg e ( S O C ) R r _ d i s c h arg e ( S O C )
The polarization voltage recovery time τ = Cr·Rr is related to the service life of the battery, which is considered a constant in practical applications.
SOC is one of the most important parameters used to describe the battery state. SOC is calculated using the ratio of residual capacity to total capacity Qi of the battery at a certain discharge rate. Generally, the calculation of SOC adopts the ampere time integration method, which is the following formula:
S O C = S O C 0 0 t i ( t ) d t Q i
In the formula, SOC0 is the initial state of charge of the battery; i(t) is the instantaneous discharge current; and Qi is the total capacity of the storage battery.

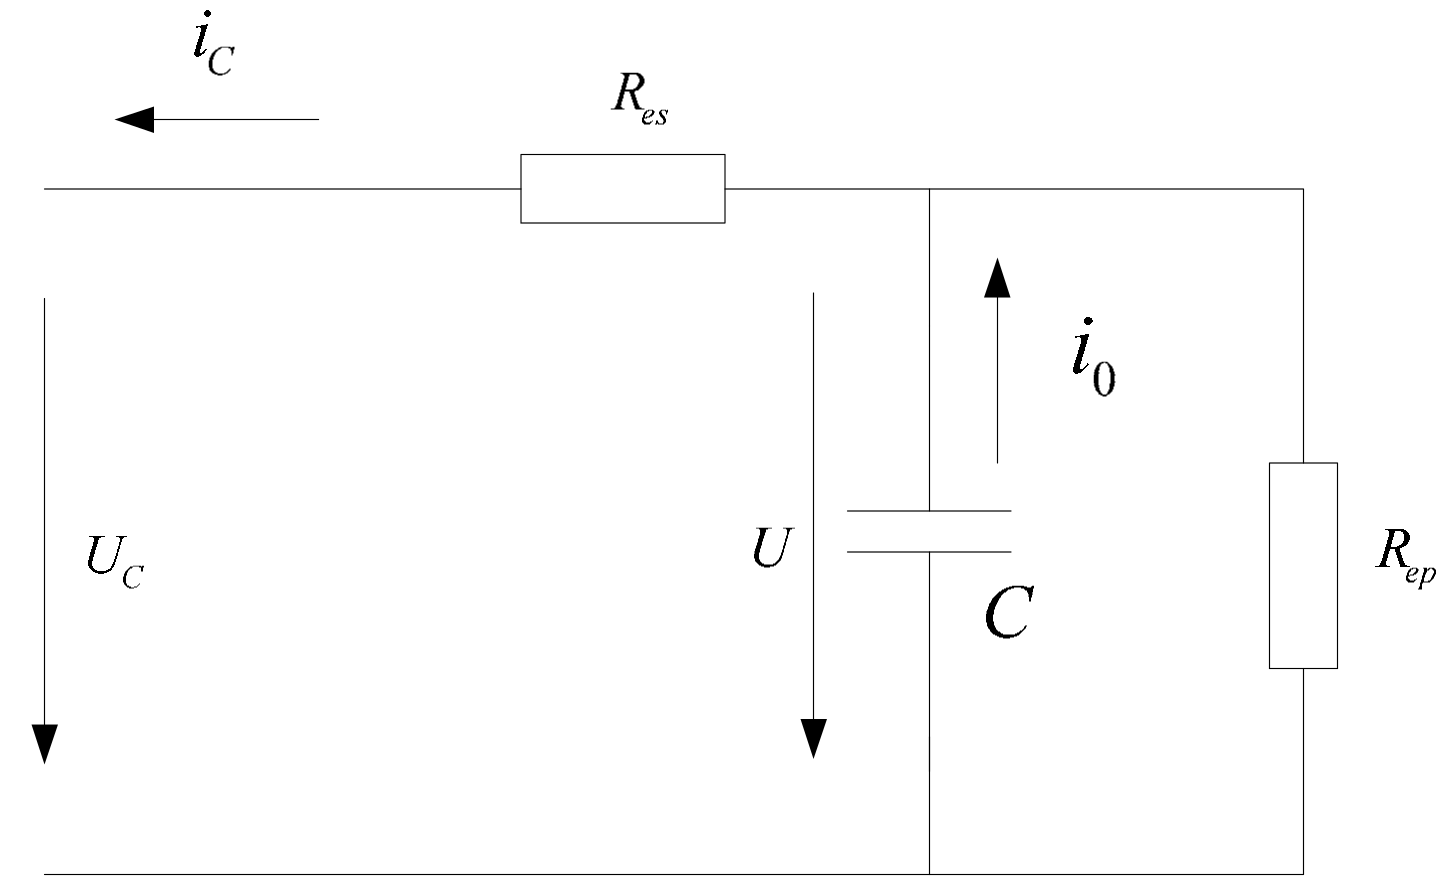
2.2.3. Supercapacitor Model

As a new type of energy storage element, supercapacitors have the advantages of high specific power, high ampere–hour efficiency, large storage capacity, wide operating voltage range, long cycle life, short charging time, large discharge power, small internal resistance, and high reliability [22]. These advantages make up for the shortcomings of the battery as a single energy source for electric vehicles. Therefore, the combined use of batteries and supercapacitors as a dual-energy source for electric vehicles has become a trend in the development of electric vehicle energy sources [23].
In this paper, the supercapacitor model is equivalent to an ideal capacitor C in parallel with a large resistance Rep and then in series with a small resistance Res. The equivalent circuit structure diagram is shown in Figure 4. The equivalent series resistance Res represents the charge–discharge loss resistance, representing the energy loss during the charge–discharge process of the supercapacitor, and is related to the charge–discharge voltage loss. The equivalent parallel resistance Rep represents the leakage loss resistance; iC is the current flowing through the supercapacitor; C is the ideal equivalent capacitor; i0 is the current flowing through the ideal capacitor C; UC is the terminal voltage of supercapacitor; and U is the voltage at both ends of ideal capacitor C.
According to the equivalent circuit of the model, the current flowing through the ideal capacitor is
i 0 = i C + U R e p = i C + 1 R e p C 0 t i 0 d t
The terminal voltage of the supercapacitor is
U C = R e s i C + U = R e s i C + 1 C 0 t i 0 d t
Because the equivalent parallel resistance Rep is large and the resistance leakage loss is small, the equivalent resistance can be ignored in modeling. The supercapacitor simulation model mainly includes the supercapacitor bank internal resistance module, supercapacitor bank SOC module, and supercapacitor bank voltage module.

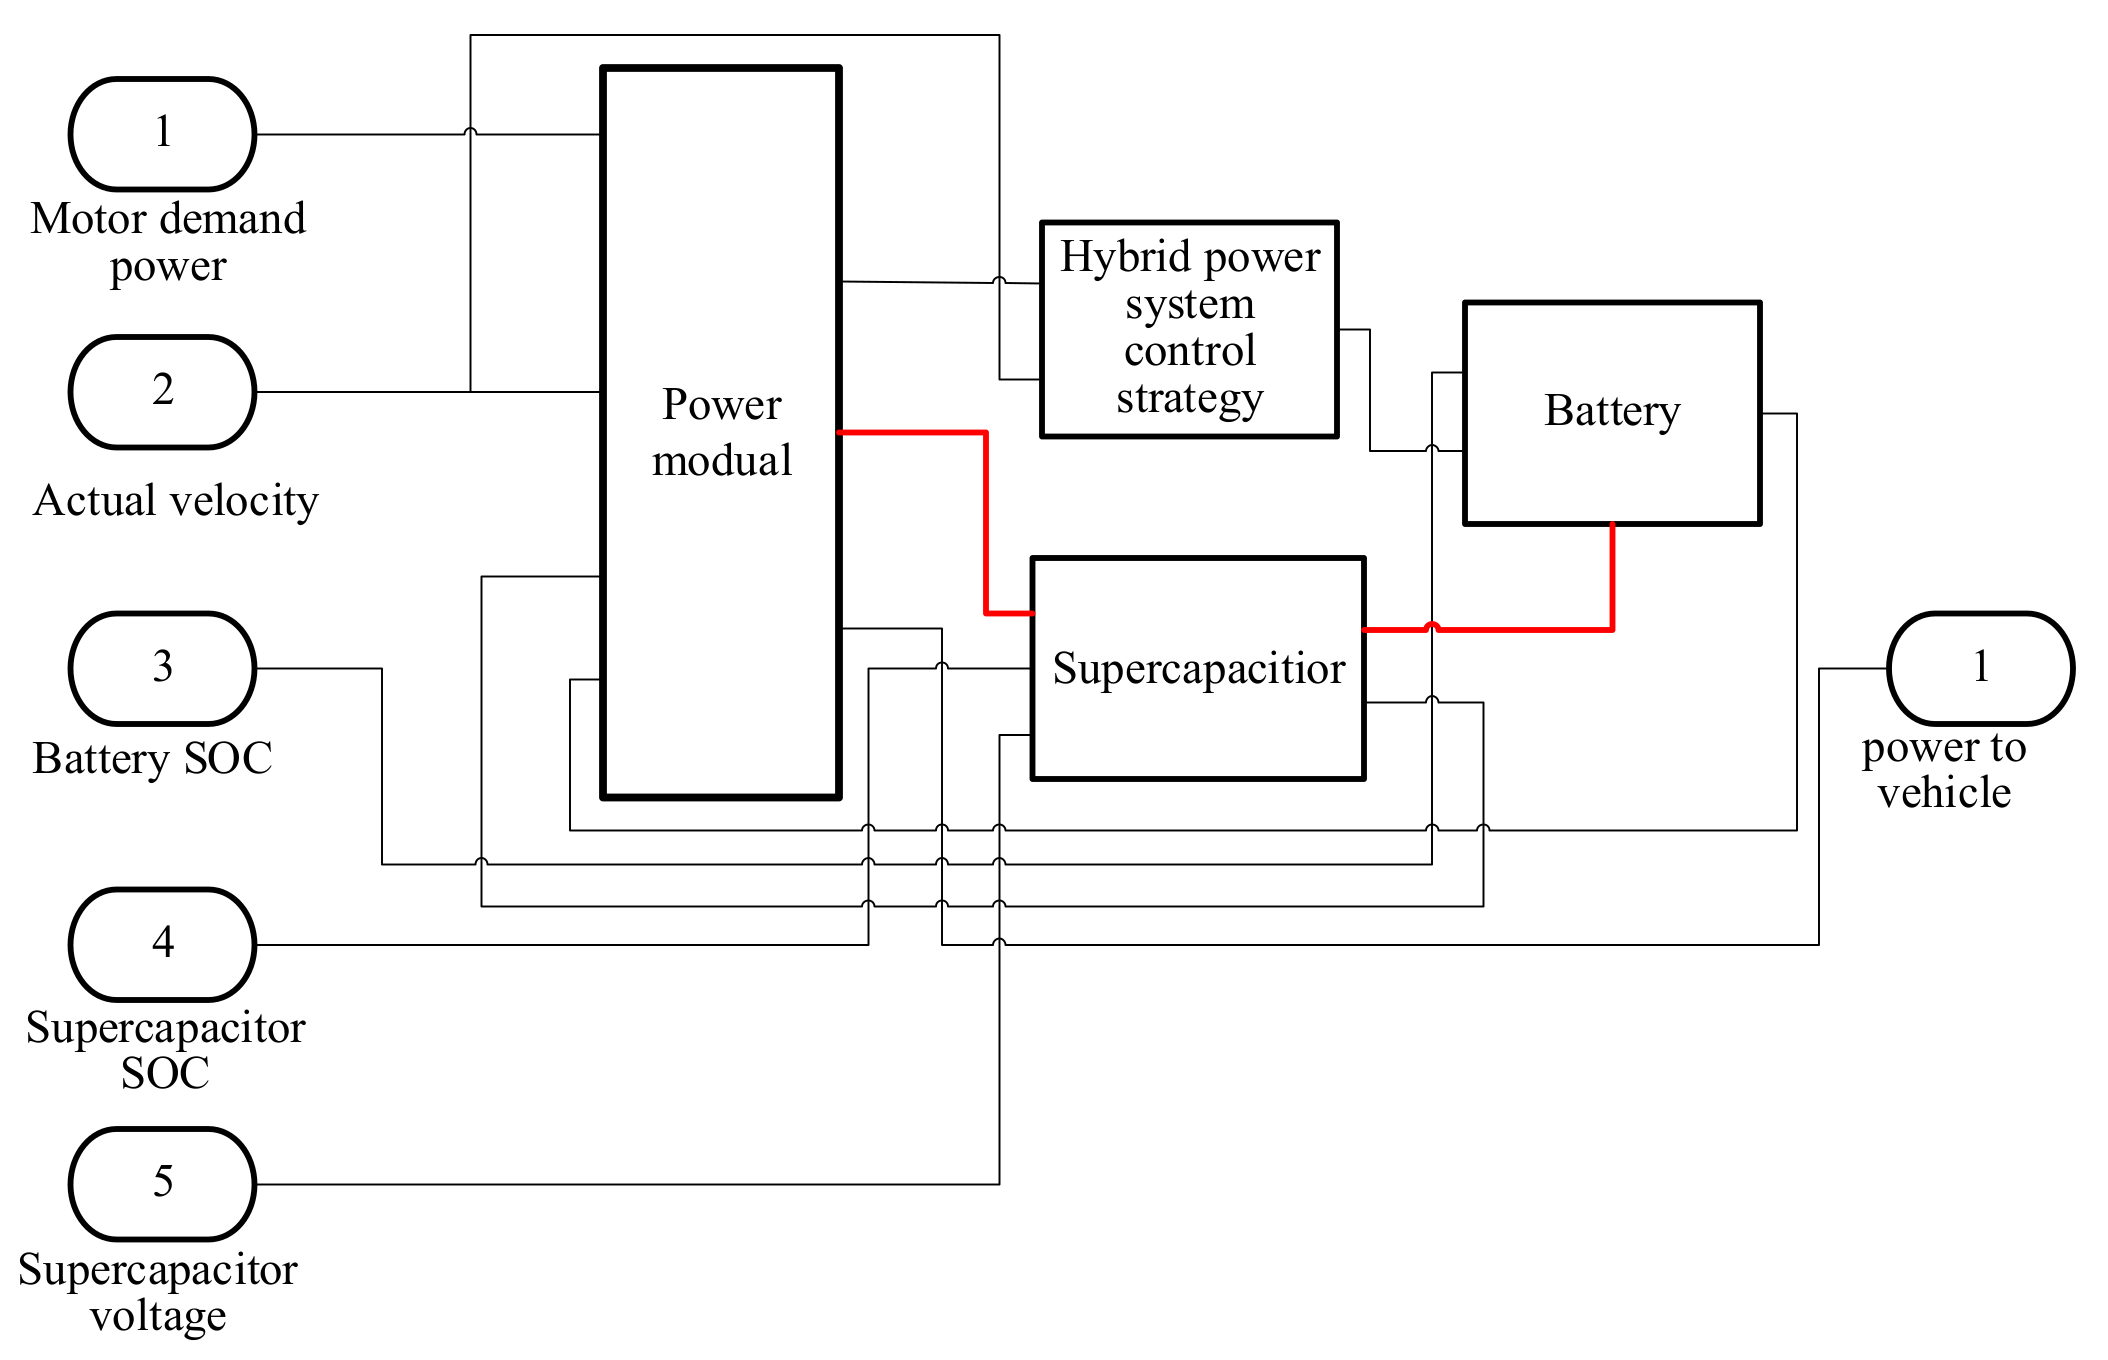
2.3. Parameter Optimization of Unmanned Electric Drive Chassis with Power-Energy Coupling

The parameter optimization of unmanned electric drive chassis is a multi-objective optimization problem. However, compared with traditional cars, the performance of energy system components such as the battery power and supercapacitor power of unmanned electric drive chassis affects the performance of power system components such as motors to a large extent. Therefore, the power performance of unmanned electric drive chassis is greatly affected by the performance of the energy system. The coupling relationship between the power system and energy system determines the overall performance of unmanned electric drive chassis. Therefore, combined with the requirements of relevant national standards for electric vehicles, this paper selects an acceleration time of 0~50 km/h as the dynamic objective function f1(x) and selects 100 km power consumption under Chinese urban bus conditions and EUDC conditions as the economic objective function f2(x). According to the coupling relationship between the composite energy source composed of the CHD-EV1 battery-supercapacitor and the power system, the key parameters of the power system and the energy system are selected as the optimization variables, and the maximum speed, climbing ability, and driving range are used as constraints to optimize the parameters of the unmanned electric drive chassis. The optimization problem is described as follows:
min x Ω s . t . F ( x ) = f ( f 1 ( x i ) , f 2 ( x i ) ) t j ( x ) 0 j = 1 , 2 , , m x i L x i x i H i = 1 , 2 , , n
In the above formula, F(x) is the objective function, tj ≥ 0 is the constraint condition, and m is the number of constraints. In this paper, m = 5, x is the optimization parameter, x i L and x i H are the lower bound value and upper bound value of the i-th parameter, respectively, and n is the number of optimization parameters.

2.4. Optimization Objective

The power system and energy system of the unmanned electric drive chassis are coupled with each other, and the coordinated optimization of the two is needed to optimize the economy and power performance. In this paper, an acceleration time f1(xi) of 0~30 km/h is selected as the dynamic evaluation target. Because the electric medium bus studied in this paper frequently needs to travel in the suburbs, it is faster. Therefore, the power consumption per hundred kilometers f2(xi) under Chinese urban bus conditions and EUDC conditions is selected as the economic evaluation target, and the weight coefficient change method is used to transform the multi-objective problem. Finally, the objective function is obtained as follows:
F ( x ) = w 1 f 1 ( x i ) f 1 t a r + w 2 f 2 ( x i ) f 2 t a r
In the above formula, w1 and w2 are the weight coefficients of the dynamic target and the economic target, respectively. f1tar and f2tar are the standard optimization target values of the vehicle acceleration time of 0~30 km/h and the power consumption of 100 km, respectively. By dividing the obtained f1(xi) and f2(xi) by the defined target values f1tar and f2tar, the target function units and quantity levels are standardized. The objective values of the optimization criteria set in this paper are f1tar = 12 s and f2tar = 35 kWh/100 km, respectively.

2.5. Optimization Variables

Due to a large number of parameters of the power system and energy system components of the unmanned electric drive chassis, it is difficult to optimize all parameters. Therefore, it is necessary to reasonably select the key parameters according to the design requirements of optimization [24]. In this paper, by analyzing the influence of various parameters on the performance of unmanned electric drive chassis, the motor power in the power system, the transmission ratio of each gear of the transmission, the transmission ratio of the main reducer, the battery capacity in the energy system and the storage energy of the supercapacitor are selected as the optimization variables, and the upper and lower limits of each variable are set. The specific values are shown in Table 2.

2.6. Constraint Condition

The constraints of the unmanned electric drive chassis parameter optimization problem [25] mainly include the requirements for speed following errors under operating conditions, maximum speed, maximum gradient, and driving range. The constraints are as follows:
  • The difference between the simulated speed at any moment and the speed required by the working condition shall be ≤2 km/h;
  • Maximum speed requirement: vmax ≥ 90 km/h;
  • Driving range: ≥100 km;
  • Variation range of supercapacitor’s SOC: 20~90%;
  • Variation range of battery’s SOC: 30~80%.

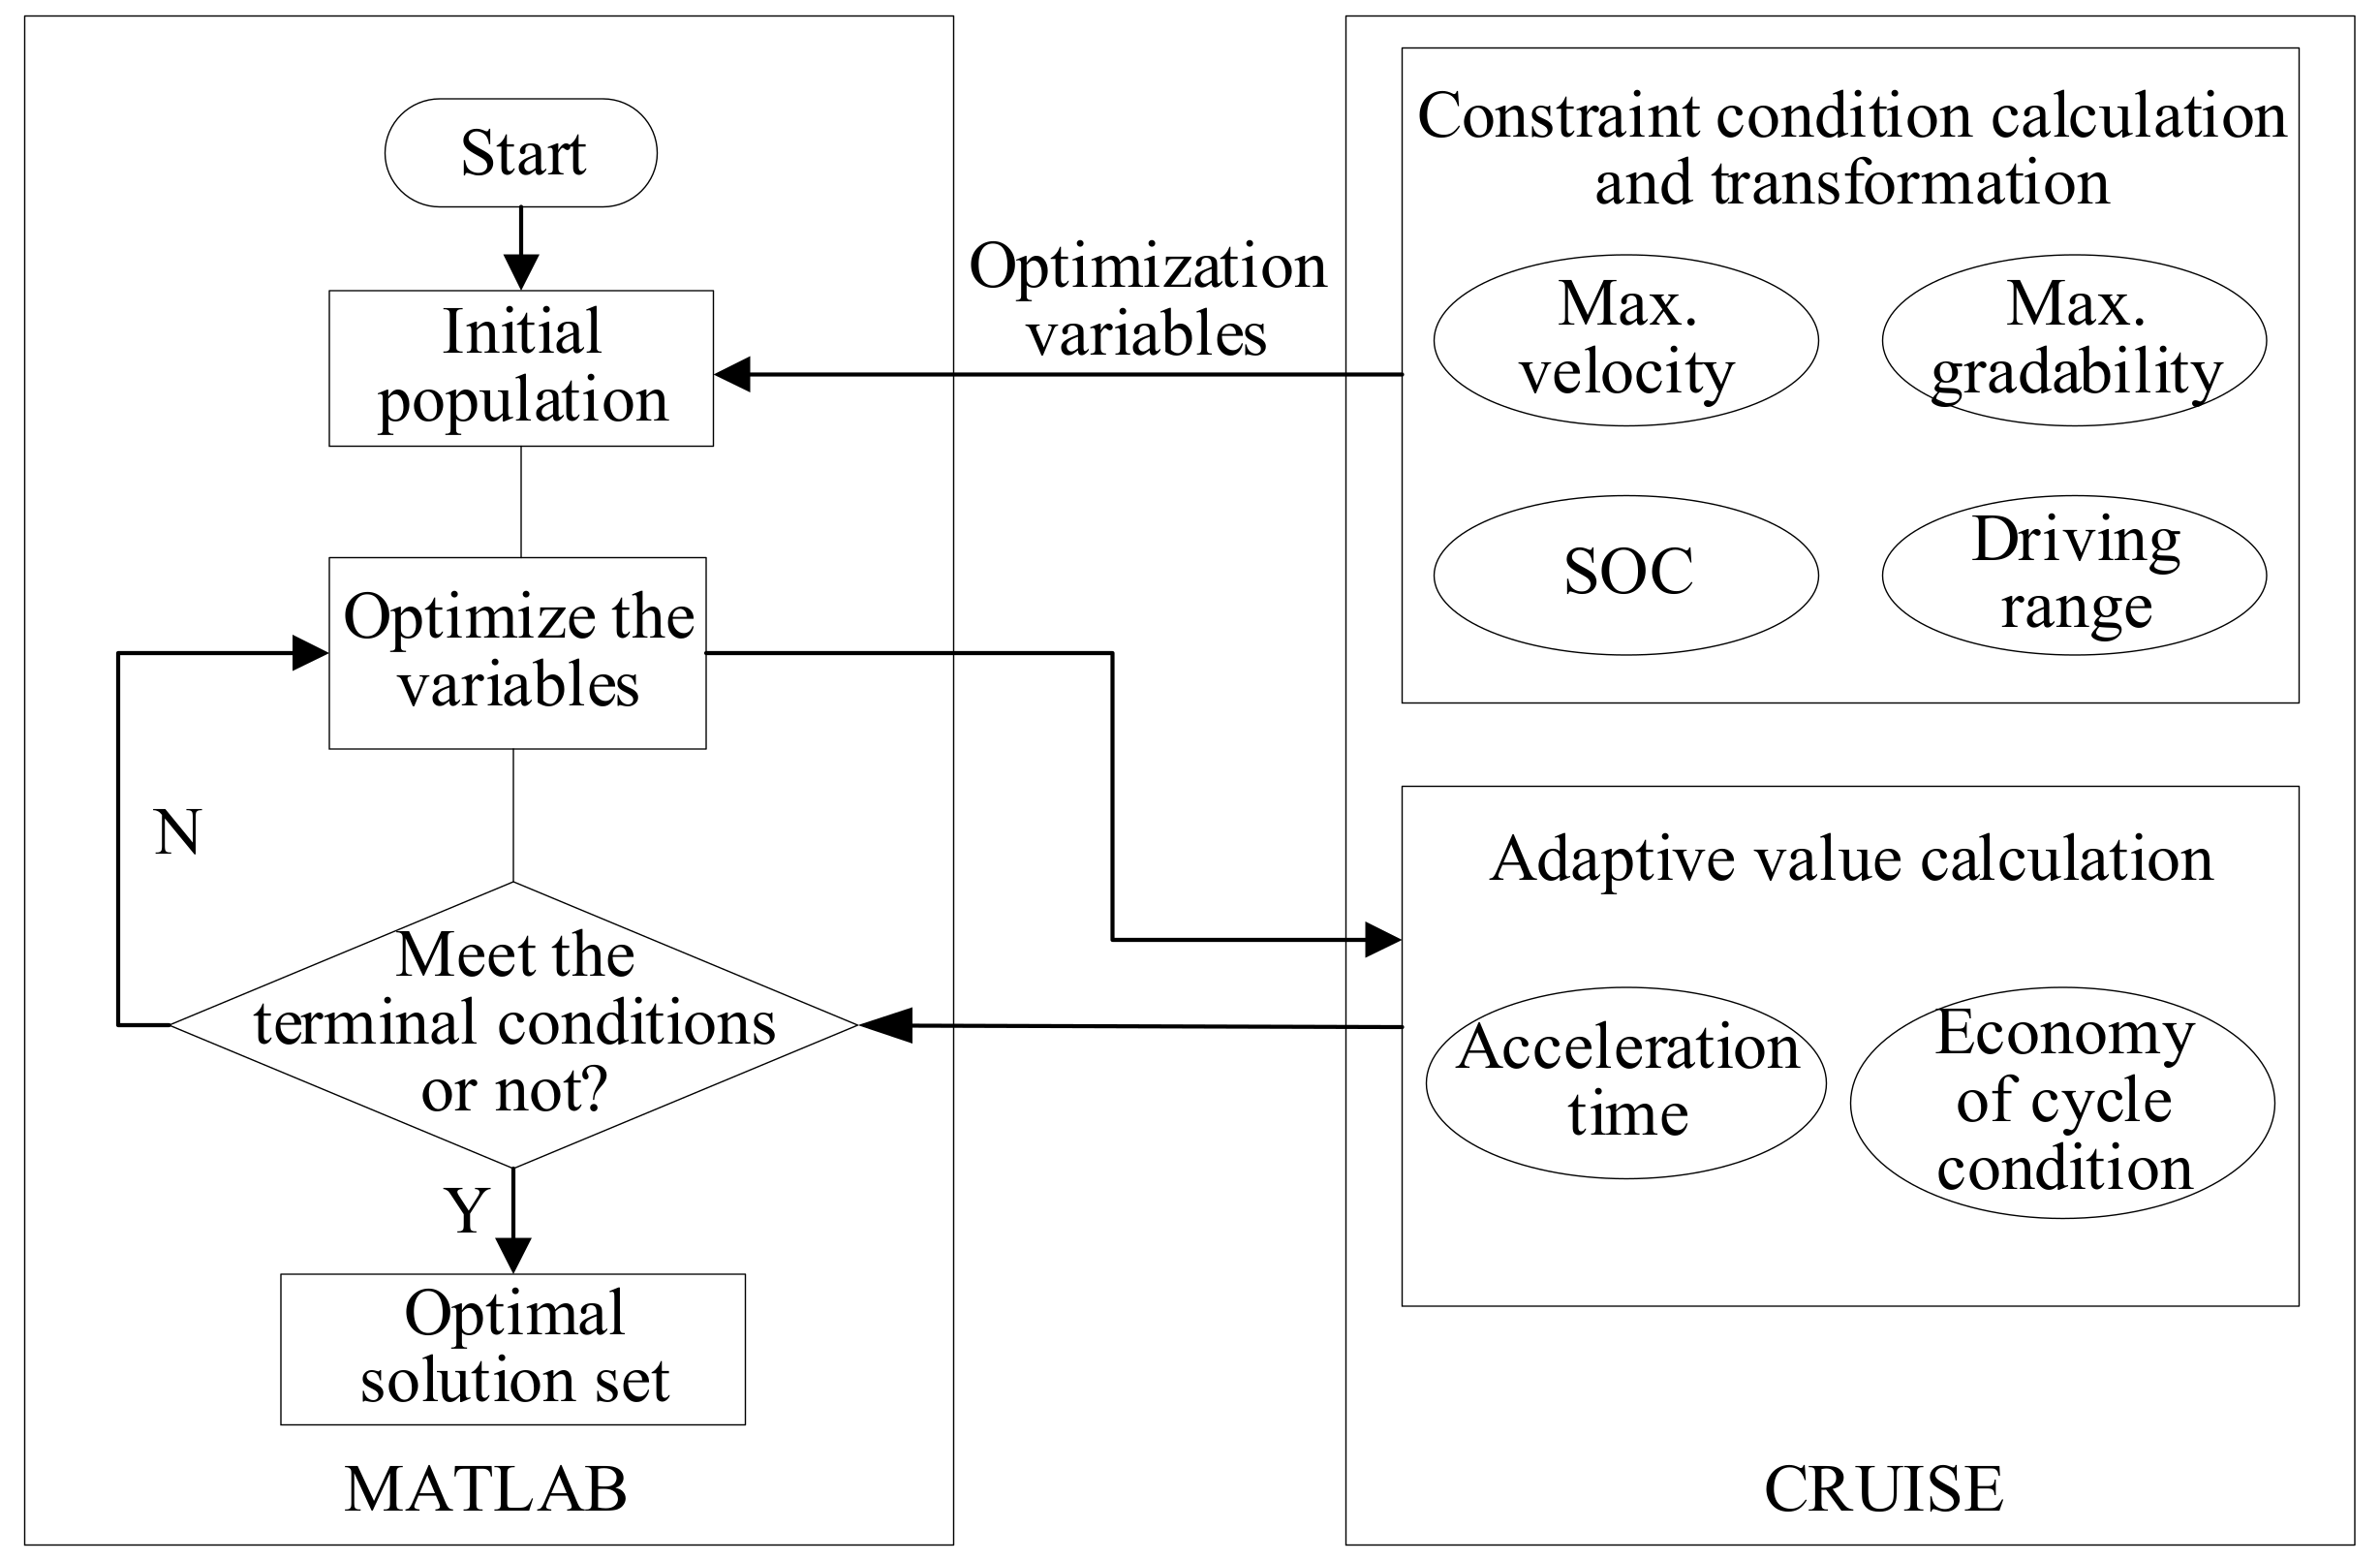
3. Process Design of Model-in-the-Loop Optimization

In order to improve the optimization efficiency, the model-in-the-loop optimization method is used to design the parameter optimization process of unmanned electric drive chassis, as shown in Figure 5. Among them, the KIGA optimization algorithm is implemented in MATLAB, the vehicle model is established in CRUISE, and the vehicle model is embedded into the whole optimization algorithm cycle. At the initial time of optimization, the vehicle model is simulated under the initial value, from which a set of objective function values can be obtained. Then, the obtained objective function is fed back to the optimization algorithm, and a set of new values are generated by the optimization algorithm. These data are used as optimization variables to assign and simulate the vehicle model again. The obtained objective function value is compared with the objective function value obtained under the initial conditions to select the winner, and then the process is iterated until the termination condition is reached. During the whole simulation process, all of the design variables change within their boundary ranges and constraints.

4. An Improved Isolated Niche Genetic Algorithm Based on the KOHONEN Network (KIGA)

4.1. General Overview of KIGA

The genetic algorithm is usually prone to falling into the local optimal solution when solving multi-peak complex function optimization problems in engineering. Niche technology can enhance the global search ability of the genetic algorithm by maintaining the diversity of solution groups [26]. Isolation in nature acts to prevent hybridization between isolated small populations, cutting off gene exchange so that small populations with the ability to differentiate can evolve in different directions, with the differences between each population gradually increasing. The same species gradually differentiate into different species, resulting in the ever-changing species found in nature [27,28]. The IGA proposed in reference [7] draws on the role of natural isolation and generates isolated niches by evenly distributing the initial population number. However, the algorithm may not be able to accurately divide the individuals with the same traits in the initial population into the same niche, and the evolution process may slow down the convergence speed. Therefore, based on IGA as a reference, combined with the requirements of multi-objective optimization problems, this paper proposes an improved isolated niche genetic algorithm (KIGA) based on the KOHONEN network. The main improvements are as follows:
(a)
The KOHONEN network clustering algorithm is used to divide the initial subpopulation to achieve a more reasonable division of the initial niche;
(b)
Two external archives are established to store the individual with the highest fitness and the Pareto solution set found at the initial stage, respectively, to guide the direction of evolution of the algorithm;
(c)
The weight of the subobjective function is determined by using the combination method based on the least squares method, and the Pareto solution set is optimized.
The KIGA proposed in this paper divides the initial population of the genetic algorithm into several subpopulations through the KOHONEN network. Each subpopulation evolves independently, and the average adaptation level of each subpopulation is used to determine the evolution speed and scale of the subpopulation. In the process of population evolution, when the inferior population is eliminated, the individual with the highest fitness is used as the center of the search space to establish a new solution. Compared with the ordinary genetic algorithm, KIGA adds the following rules [12]: (a) Subpopulation size limit: The subpopulation size is positively correlated with the average fitness value of the subpopulation, and the larger the average fitness value of the subpopulation, the larger the scale, and vice versa. Therefore, we can limit the maximum allowable size Smax of some subpopulations to ensure the diversity of species in the population and limit the minimum survival size Smin of some subpopulations to avoid these subpopulations being prematurely eliminated. (b) Inactivation of inferior species: In order to speed up the algorithm, the subpopulation with the worst performance in the specified algebra during the evolution process becomes extinct, and the subpopulation is replaced by a new solution in the search space. (c) Homogeneous mutual exclusion: By deleting one of the two similar or identical subpopulations that appear during evolution and replacing it with a new solution in the search space. (d) Weak protection: New subpopulations generally cannot compete with evolved subpopulations in the early stage of evolution, so new populations need to be protected. (e) New and old replacement: When the subpopulation is close to the local optimal solution, the subpopulation is deleted with a certain probability and replaced with a new solution in the search space. In this paper, the probability of new and old replacements is Pn = 0.7. (f) Preferred species retention: In order to ensure that the best performance of the subpopulation can fully evolve, the new and old replacements do not act on the best performance of the subpopulation. The operating parameters of KIGA are shown in Table 3.
KIGA uses the Hamming distance measure [29] to calculate the shared function sh(xi, xj):
s h ( x i , x j ) = 1 d 1 ( x i , x j ) σ 1 ; d 1 ( x i , x j ) < σ 1   &   d 2 ( x i , x j ) σ 2 1 d 2 ( x i , x j ) σ 2 ; d 1 ( x i , x j ) σ 1   &   d 2 ( x i , x j ) < σ 2 1 d 1 ( x i , x j ) d 2 ( x i , x j ) σ 1 σ 2 ; d 1 ( x i , x j ) < σ 1   &   d 2 ( x i , x j ) < σ 2 0 , O t h e r s
where d1(xi, xj) is the Hamming distance of any two individuals xi and xj, A is the fitness distance, and niche radii B and C represent the maximum distance of genotype individuals and phenotype individuals, respectively.
After determining the shared function, the individual fitness function can be expressed as
f ' ( x i ) = f ( x i ) / j = 1 M s h ( x i , x j )
The average fitness of the subpopulation is
f k a ( t ) = i = 1 n k ( t ) f k i ( t ) / n k ( t )
In the above formula, f k a t   is the average fitness of the k-th subpopulation of the t generation; fki(t) is the fitness value of the i-th individual in the k-th subpopulation of the t generation; and nk(t) is the size of the kth subpopulation of t generation.
The scale nk(t + 1) of the k-th subpopulation of t + 1 generation is
n k ( t + 1 ) = N f k a ( t ) / i = 1 K f i a ( t )
In the above formula, N is the number of individuals in the initial population.

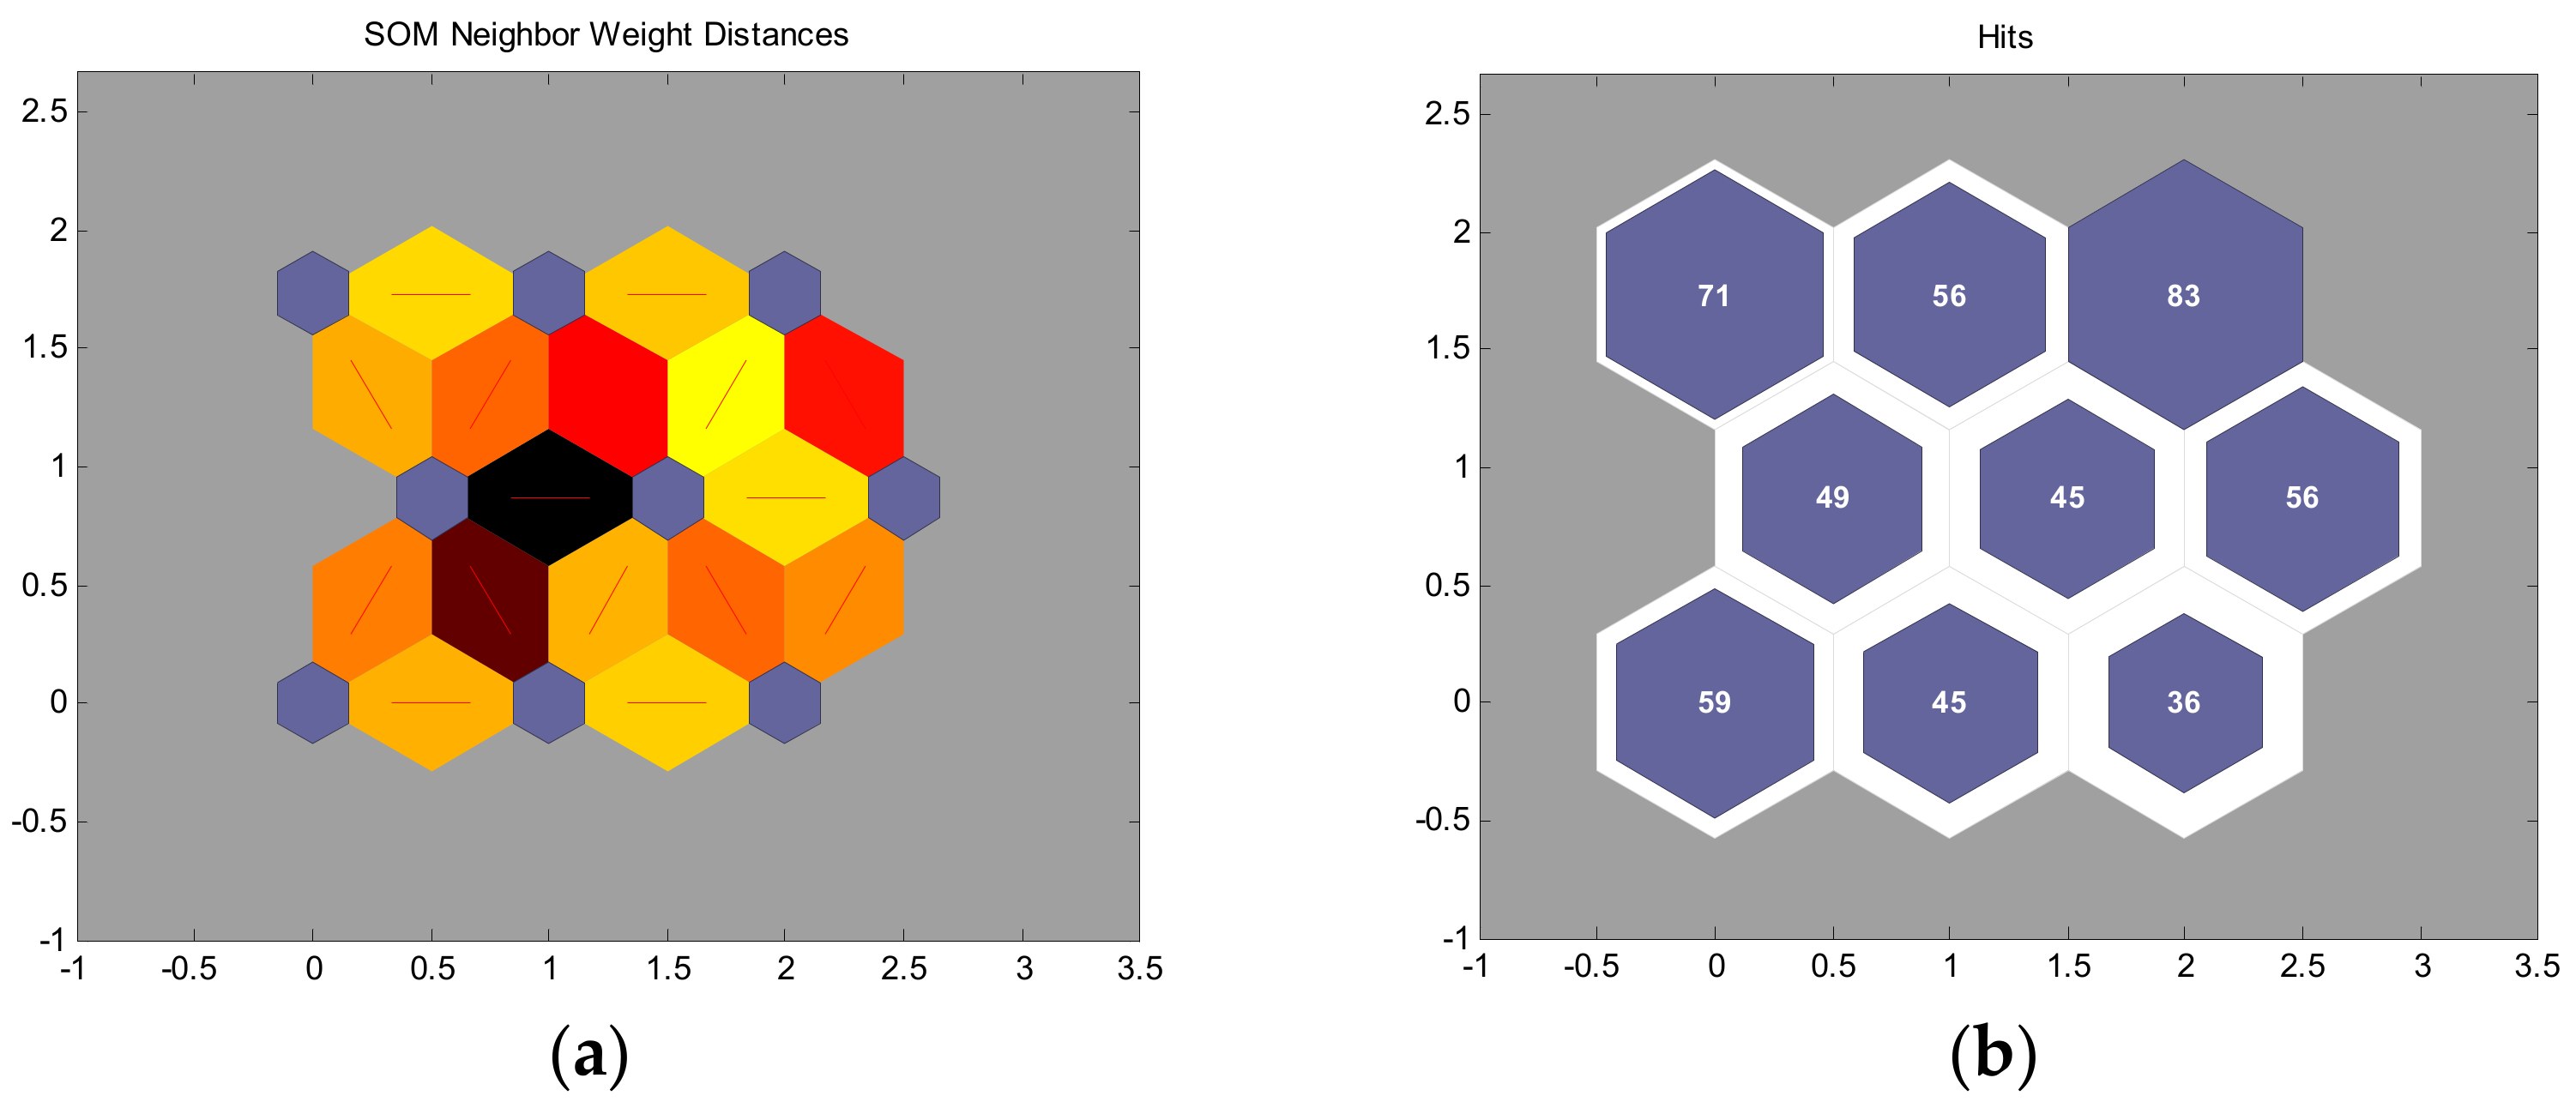
4.2. Establishment of the Initial KIGA Niche Subpopulation Based on KOHONEN Network Clustering

How best to reasonably divide the initial niche according to individual similarity in the process of KIGA initial subpopulation generation has an important influence on the convergence speed and final result of the algorithm. There are many local extreme points in the process of unmanned electric drive chassis parameter optimization. Only by accurately dividing the initial niche population can we increase the global search ability and avoid falling into the local optimum. In this paper, the KOHONEN network clustering algorithm is used to cluster the initial population so that the individuals with a high degree of similarity are divided into the same initial niche subpopulation, thus speeding up the calculation speed and improving the optimization accuracy.
The KOHONEN network is a kind of unsupervised, self-organizing, and self-learning network. The whole network is composed of a fully connected neuron array. When one of the neurons receives external stimuli, that is, input, neurons in different regions will produce different response regions and different response characteristics according to their different divisions of labor and then cluster the input according to these characteristics [30]. As shown in Figure 6, the KOHONEN network topology consists of two layers of neurons: input and output. Each neuron in the input layer is connected to each neuron in the output layer through variable weights, and the output neurons form a two-dimensional planar array.
As shown in Figure 7, the KOHONEN network can simultaneously learn the distribution characteristics of the input vector of the training data and the topological structure of the input vector data. The competition mechanism is as follows: the neurons in the winning neuron C and its surrounding neighborhood Nc are excited to varying degrees, and the degree of excitement decreases with the increase in distance, while the neurons outside Nc are inhibited. The structure of the KOHONEN network will change after each execution due to the different neurons excited each time, but no matter which neurons are activated, the final clustering result will not change.
Combined with the parameter optimization model of unmanned electric drive chassis, the KOHONEN network design in this paper mainly focuses on the following aspects:

4.2.1. Selection of Sample Feature Vectors

The key to the clustering process is the selection of sample feature vectors, which determine the quality of the clustering results. The selected sample feature vectors should be able to comprehensively reflect the essential characteristics of the samples. In similar samples, the feature vectors should be selected from points closer to each other in the corresponding multi-dimensional space, and in samples with large differences, the feature vectors should be selected from points farther away in the multi-dimensional space. Before clustering the initial population of the genetic algorithm using the KOHONEN network, sample feature vectors should be extracted. Therefore, in this paper, the sample feature vector is the vector composed of seven optimization variables reflecting the performance of the unmanned electric drive chassis that each individual in the initial population has. We select the initial population of the algorithm as the input sample set X = (X1,X2,…,Xi,… Xm)T, 1 ≤ im. For each individual in the sample, we select the feature vector X i = x i 1 , x i 2 , , x i k , where k is the dimension of the feature vector and 1 ≤ k ≤ 7. Subsequently, in order to improve the training efficiency, it is necessary to normalize the data and convert the output function value into a value between 0 and 1.

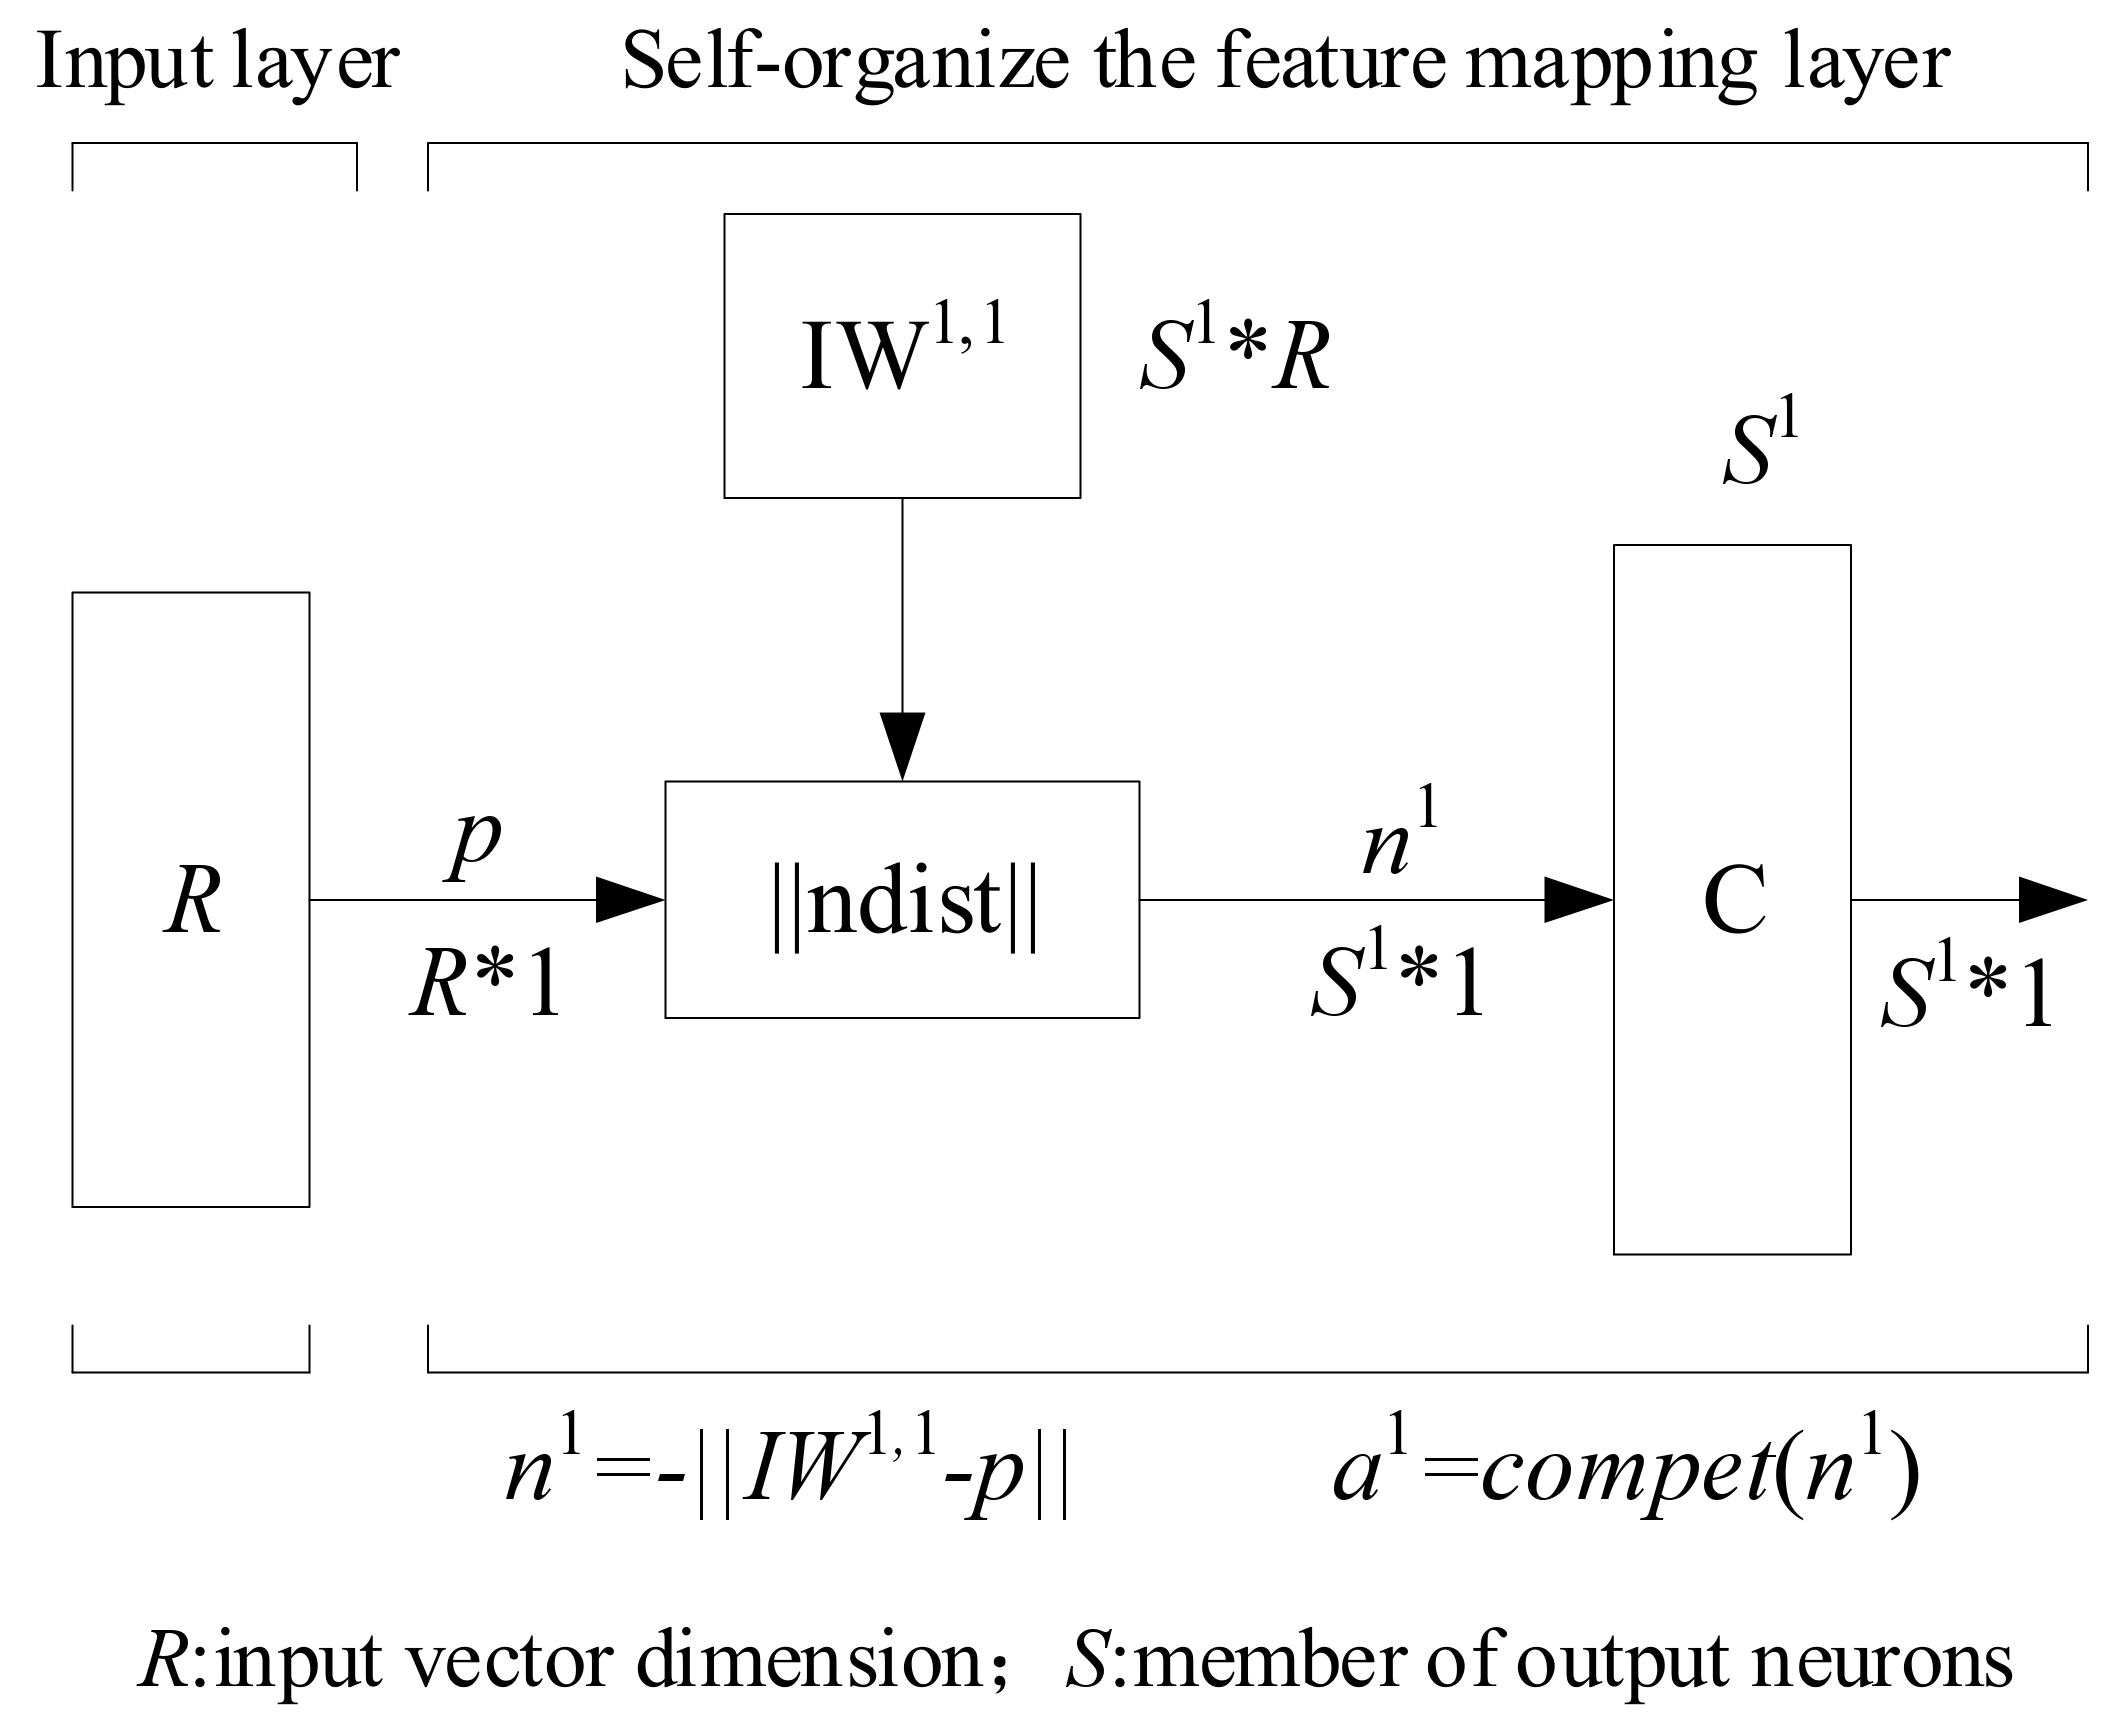
4.2.2. Design of the Output Layer

The number of nodes in the output layer is related to the characteristics of the training set samples. The number of nodes should be close to the number of pattern categories. In the case where there is no exact information on the number of categories, some more nodes should be set appropriately to facilitate more accurate mapping of the topology of the sample. According to the initial population size of the genetic algorithm and the dimension characteristics of the sample feature vector, the number of neurons in the input layer is selected as 500, and the neurons in the output layer are set as a 3 × 3 order node matrix.

4.2.3. Design of the Learning Rate

In the initial stage of network training, in order to speed up the training speed, the learning rate should select a larger value; after that, in order to quickly capture the approximate structure of the input vector, the learning rate should be reduced at a faster rate; then, the learning rate slowly drops to 0 at a smaller value. By setting the variable learning rate above, the network weights can be finely adjusted to make them more in line with the sample distribution structure of the input space. In this paper, the learning rate is
h ( t ) = C ( 1 t t m )
In the above formula, h(t) is the learning rate, C is the initial learning rate, t is the training times, and tm is the pre-selected maximum training times.

4.3. Establishment of External Archives

The niche technology used in this paper assumes that the environment in which the species is located is generally conducive to the survival of organisms. All populations with strong viability can reproduce, and the total amount of resources in the entire environment is fixed. Once a population is extinct, a population with strong adaptability will soon occupy the resources originally belonging to the extinct population. Therefore, this paper establishes an external file I to preserve the individual with the highest fitness and establishes a new solution with the individual as the search space center to replace the extinct population so as to better guide the direction of evolution.
The key to solving multi-objective problems is to search for as many Pareto optimal solutions as possible to provide a complete search space for the final decision. For this reason, an external file II is established to save the Pareto optimal solutions searched in each niche [31]. In this process, it is necessary to compare the individuals in the t − 1 generation external file II with the individuals in the various groups in the t generation after the Pareto comparison and replace the winning Pareto optimal set with the external file II of the t − 1 generation, so as to obtain the Pareto solution set that meets the conditions.

4.4. Pareto Selection Based on Least Squares Combination Weighting

After obtaining the Pareto solution set, it is necessary to search for the optimal solution of the unmanned electric drive chassis parameter combination that meets the actual performance requirements. Because there are many solutions in the solution set, it is difficult to take into account the vehicle economy and power performance goals via simple weighting alone. Therefore, this paper first uses the analytic hierarchy process to give the subjective weight coefficient, and then, according to the difference in the evaluation index in different evaluated objects, the coefficient of variation method is used to obtain the weight coefficient reflecting the objective characteristics of the index. Finally, based on the least squares method, the subjective and objective weight coefficients are obtained [32], and the obtained Pareto solution set is selected. The specific steps are as follows:
  • Using the AHP (analytic hierarchy process) to determine the subjective weight of each index;
  • The determination of objective weight by the coefficient of variation method;
  • Combining the weight of each index;
  • Standardizing the scheme set with n schemes and m evaluation indicators to obtain the decision matrix. Then, the evaluation value of the i-th evaluation object is
    f i = i = 1 m w j z i j , ( i = 1 , 2 , , n )
    The optimal combination model obtained by the least squares method is as follows:
    min i = 1 n j = 1 m { [ ( w j u j ) z i j ] 2 + [ ( w j v j ) z i j ] 2 } , s . t . j = 1 m w j = 1 , w j 0 , ( j = 1 , 2 , , m )
  • The objective function in this model is taken as a Lagrangian function, and then the partial derivatives of wj and λ (λ is a Lagrangian operator) are calculated, respectively, to calculate the comprehensive evaluation value of each scheme. The best scheme is the one with the highest comprehensive evaluation value. The comprehensive evaluation value is
W = A 1 [ B + 1 e T A 1 B e T A 1 e e ]
In the above formula, A = d i a g i = 1 n Z i 1 2 , i = 1 n Z i 2 2 , L , i = 1 n Z i m 2 λ , e = [ 1 , 1 , l , 1 ] T , B = [ i = 1 n 1 2 ( u 1 + v 1 ) z i 1 2 , i = 1 n 1 2 ( u 2 + v 2 ) z i 2 2 , , i = 1 n 1 2 ( u m + v m ) z i m 2 ] T The Pareto solution set is taken as the solution set with 500 schemes and 2 evaluation indexes. After standardization, the combined weight is W = (0.412, 0.588)T.

4.5. Algorithm Flow

The KIGA algorithm process is as follows:
Step 1: Code. The optimized parameters are coded with the real number coding method.
Step 2: The genetic algorithm generates the initial population.
G = X 1 , X 2 , , X i , , X m T , 1 i m , where m is the number of individuals in the initial population.
Step 3: KOHONEN network initialization.
The random number is used to assign a small initial weight between the input layer and the output layer, and the set of j adjacent neurons of the output layer is selected as Sj:
S j = { S j ( 0 ) , S j ( 1 ) , S j ( 2 ) , , S j ( t ) , }
where Sj represents the set of adjacent neurons at time t;
S j ( t ) = S j ( t 1 ) δ ( t )
where δ(t) is the reduction given by the initial weight assignment at time t.
Step 4: KOHONEN network input vector. The initial population generated by heredity in Step 2 is taken as the input vector of the KOHONEN network.
Step 5: The distance between the weight vector of the mapping layer and the input vector is calculated. The Euclidean distance is used to calculate the distance between the j-th neuron in the mapping layer, and the neuron in the input layer, and the minimum neuron j* is obtained; that is, a certain unit k is determined:
d k = min j ( d j ) , j
Step 6: Weight learning. After obtaining the neuron j* with the minimum distance, the following formula is used to modify the weight of the output neuron and its adjacent neurons:
Δ w i j = w i j ( t + 1 ) w i j ( t ) = η ( t ) ( x i ( t ) w i ( t ) ) ,   η ( t ) = 1 t [ 0 , 1 ]
Step 7: Calculation output.
o k = f ( min j | | X W j | | ) ,   f ( * ) = 1 , 0 , j = j * j j *
Step 8: Establish the subpopulation of the final initial niche. According to the requirements of algorithm accuracy and maximum iteration times, we set the termination condition of KOHONEN network learning in advance. If the calculation result reaches the termination condition, the algorithm will be terminated; otherwise, we return to Step 4 for re-iteration. Finally, individuals with similar characters are divided into several initial subpopulations, namely initial niches:
{ G 1 , G 2 , , G p , , G q } G
Step 9: Calculating fitness values: we use CRUISE v2014 software to calculate the objective function value of all individuals in each subpopulation, convert it into fitness value, and save the individual with the highest fitness value in the external file I.
Step 10: We determine the protection of the KIGA algorithm, the survival of inferior subpopulations, the mutual exclusion of similar subpopulations, and the replacement rules of new and old subpopulations, and ensure that the subpopulations meet the size limit requirements during the evolution process.
Step 11: Recalculating the fitness value: we calculate the fitness value of the newly generated subpopulation and apply the juvenile protection measures.
Step 12: Subpopulation evolution: The size of the subpopulation changes with its average performance level in the population. According to the size of the subpopulation determined by Formula (6), we select the individual with the best fitness in the niche, take the individual as the center, and take the distance between the center of the subpopulation and the individual as the radius to randomly generate several new individuals as the parent individuals, and use the new solution generated by crossing and variation to generate the next generation of solutions.
Step 13: Convergence judgment. If the convergence condition is met or the specified number of iterations has been evolved, the algorithm will be terminated; otherwise, we return to Step 9.
Step 14: We save the Pareto solution set that meets the conditions to external file II.
Step 15: We extract the saved Pareto solution set from external file II, and according to the combination weight obtained by using the combination weighting method, assign the combination weight value to select the best Pareto.

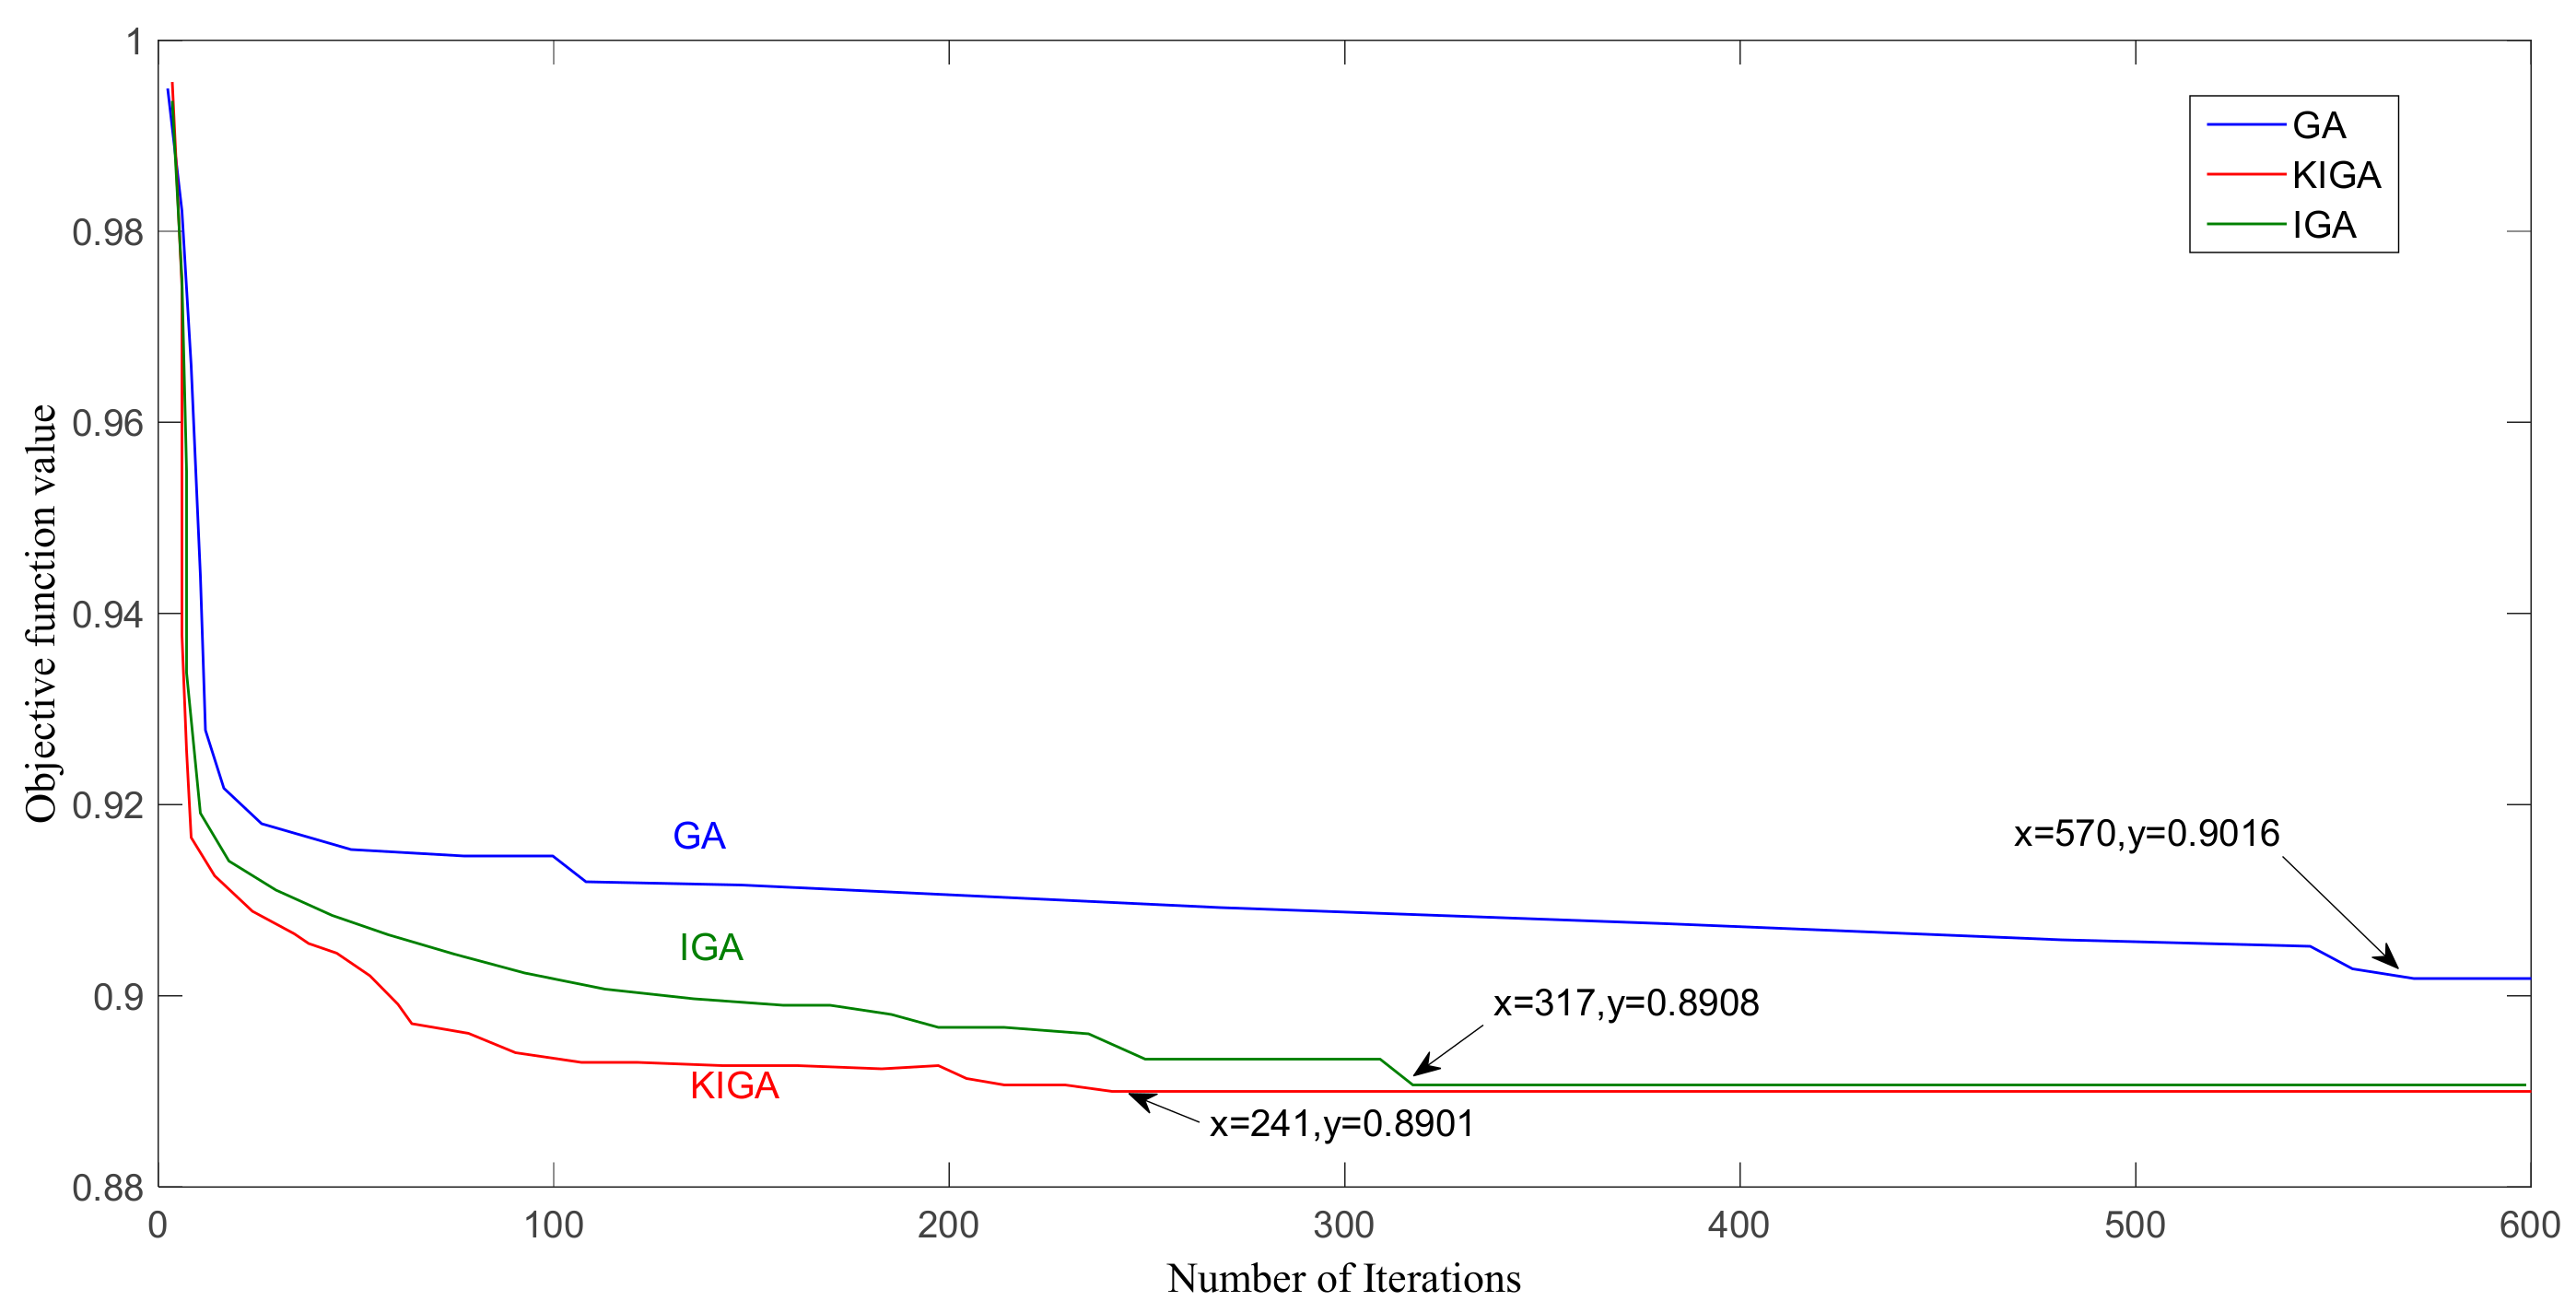
5. Optimization Results and Analysis

After experimental comparison, the number of iterations of the KOHONEN network in the KIGA algorithm is finally selected as 1000, and the number of categories is 9. Figure 8a is the distance distribution map between the competition layer neurons and their adjacent neurons of the KIGA initial population after KOHONEN network clustering. The color depth of the filling area between adjacent neurons indicates the distance between neurons. From yellow to black, the deeper the color, the farther the distance. By analyzing the distance between neurons in Figure 8, it can be seen that the distance between neurons 4 and 5 is the farthest, followed by the distance between neurons 2 and 4. Similarly, the similarity between the remaining neurons, that is, the similarity of the input sample data, can be judged. Figure 8b is the statistical map of winning neurons. The order of neuron numbering is from left to right, from bottom to top, and the number of neurons gradually increases. From this, we can know the number of classifications of the original population data samples and the neurons that are excited to become the cluster centers. The blue hexagon in the figure represents the neuron that wins the competition, and the number indicates the number of times the input neuron is excited by the corresponding competition layer neuron. It can be seen from Figure 8 that after KOHONEN network clustering, the initial population of KIGA is divided into nine subpopulations, that is, nine initial niche populations, according to the similarity between individuals.
In order to verify the results of the combination weighting, the subjective weight, the objective weight, and the combination weight based on the least squares method are given to the objective function for Pareto optimization. The normalized comparison of the target values of the optimal solution under the three weights is shown in Figure 9. It can be seen from Figure 9 that after standardization, the dynamic target value of the optimal solution obtained by the combination weighting method is the smallest, and the economic target value is between the subjective weighting and the objective weighting, but the dynamic and economic comprehensive target values obtained by the combination weighting method are the smallest, which proves that the combination weighting method has better compatibility with each target.
Under the premise of the same control parameters and test methods, the parameters of unmanned electric drive chassis are optimized by GA, IGA, and KIGA, respectively, and the changes in the objective function values with the number of iterations in the evolution process of the three algorithms are compared. The results are shown in Figure 10. It can be seen from the figure that the convergence speed of GA is faster in the early stage of evolution but slower in the later stage. The main reason is that the population diversity is low, while IGA and KIGA show a stable evolution speed. Even when the search is close to the global optimal solution, it can maintain a high population diversity, which provides a potential driving force for further evolution. GA needs to run 570 generations to search for the minimum value of 0.9016, IGA needs 317 generations to search for the minimum value of 0.8908, and KIGA only needs 241 generations to search for the minimum value of 0.8901. It can be seen that IGA and KIGA are significantly better than GA in terms of global convergence reliability and convergence speed, and KIGA has the fastest convergence speed. By comparing the objective function values obtained after optimization, it can be seen that the objective function value searched by the GA algorithm is greater than that of IGA and KIGA, indicating that the GA algorithm may fall into the local optimal solution during optimization. Secondly, by comparing IGA and KIGA, it can be seen that the convergence speed of KIGA is 67 generations faster than that of IGA; in the initial stage of evolution, the objective function value of KIGA decreases faster than that of IGA, that is, the convergence speed is faster. The main reason is that the initial subpopulation generated by KIGA using the KOHONEN network clustering algorithm can divide the initial niche population according to the similarity of traits in the initial population at the initial stage of evolution, which increases the similarity of individuals in the niche. This is conducive to isolation in the subsequent evolution process, thus increasing the population diversity and accelerating the evolution speed. The optimization result of KIGA is 0.0007 smaller than that of IGA, which is approximately 0.08% higher than that of IGA. The main reason is that KIGA in this paper adds an external archive so that excellent individuals can be saved and guided in the process of searching for an optimal solution. The direction of evolution makes evolution more effective and the search of the optimization objective function more accurate.
Figure 11 is the speed-following curve of the electric chassis under the CBC driving condition. From the diagram, it can be seen that the actual speed can follow the expected speed well, whether it is in the uniform driving stage or the acceleration stage. It is proved that the dynamic performance of the unmanned electric drive chassis optimized by KIGA can meet the requirements of fast response conditions. Figure 12 shows the comparison of the energy consumption of unmanned electric drive chassis before and after the optimization of GA, IGA, and KIGA algorithms under CBC conditions. From the figure, it can be seen that the energy consumption of the whole vehicle is reduced after the optimization of the three algorithms, among which the energy consumption reduction after KIGA optimization is the largest, which proves that the unmanned electric drive chassis optimized by KIGA has better economy.
Table 4 shows the changes in the optimization variables and the dynamic and economic indexes of the electric chassis before and after optimization with GA, IGA, and KIGA. It can be seen from Table 4 that compared with GA and IGA optimization, KIGA can search for a better set of optimization variable parameters and achieve the best optimization effect, whether it is the dynamic or economic single-objective optimization or the multi-objective optimization of both. After KIGA optimization, the motor power, transmission ratio (except for the second gear), main reducer transmission ratio, and battery capacity of the unmanned electric drive chassis decreased to a certain extent, while the dynamic and economic indexes of the vehicle improved, except for the maximum climbing degree, which proves that the optimized vehicle parameters were more reasonably configured and the comprehensive performance of the vehicle was improved. However, the capacity of the supercapacitor was increased to a certain extent, mainly because the storage energy of the supercapacitor improved after the use of the composite energy source, thus improving the motion characteristics and energy output characteristics of the unmanned electric drive chassis under the conditions of climbing and acceleration, and the performance of the whole vehicle was further improved.

6. Conclusions

In this study, by analyzing the coupling relationship between the power system and the energy system of the electric vehicle, CRUISE was used to establish the electric vehicle model, including the power system and the energy system. In view of the shortcomings of the traditional genetic algorithm, which is prone to falling into the local optimal solution, an improved isolated niche genetic algorithm based on the KOHONEN network is proposed. The algorithm can use the KOHONEN network to classify the initial population of the genetic algorithm, divide the individuals with similar traits into the corresponding niches, and then combine the various operations of the isolated niche genetic algorithm to optimize the parameters of the unmanned electric drive chassis.
The optimization results show that the KIGA algorithm proposed in this paper can effectively improve the power and economy of the vehicle under the constraint conditions. Compared with GA and IGA, KIGA has a faster convergence speed and better optimization objectives. Therefore, the KIGA algorithm proposed in this paper can achieve better results for the parameter optimization of unmanned electric drive chassis and provide an effective method for the performance optimization of an unmanned electric drive chassis. The operating parameters of KIGA in this paper were selected based on the general value range of the algorithm. However, for the specific electric vehicle optimization problem, the algorithm should also have more suitable operating parameters. In future research, the selection of the optimal operating parameters of the algorithm will be studied through further simulation and experiments, combined with the characteristics of electric vehicle optimization, so as to further improve the optimization effect of electric vehicle parameters.

Author Contributions

Conceptualization, W.W. and S.X.; methodology, S.X.; software, W.W.; validation, W.W., S.X. and H.O.; formal analysis, H.O.; investigation, X.Z.; re-sources, S.X.; data curation, W.W.; writing—original draft preparation, W.W.; writing—review and editing, X.Z.; visu-alization, X.Z.; supervision, H.O.; project administration, S.X.; funding acquisition, S.X. All authors have read and agreed to the published version of the manuscript.

Funding

This research was funded by [Natural Science Foundation Project of Shaanxi Province] grant number [2020JQ-669].

Data Availability Statement

All data generated or analysed during this study are included in this published article.

Conflicts of Interest

The author declares no conflict of interest.

References

  1. Çağatay Bayindir, K.; Gözüküçük, M.A.; Teke, A. A comprehensive overview of hybrid battery vehicle: Powertrain configurations, powertrain control techniques and electronic control units. Energy Convers. Manag. 2011, 52, 1305–1313. [Google Scholar] [CrossRef]
  2. Li, L.; Zhang, Y.; Yang, C.; Jiao, X.; Zhang, L.; Song, J. Hybrid genetic algorithm-based optimization of powertrain and control parameters of plug-in hybrid electric bus. J. Frankl. Inst. 2015, 352, 776–801. [Google Scholar] [CrossRef]
  3. Hegazy, O.; Van Mierlo, J.; Barrero, R.; Omar, N.; Lataire, P. PSO algorithm-based optimal power flow control of fuel cell/supercapacitor and fuel cell/battery hybrid battery vehicles. Compel-Int. J. Comput. Math. Electr. Electron. Eng. 2013, 32, 86–107. [Google Scholar] [CrossRef]
  4. Montazeri-Gh, M.; Poursamad, A.; Ghalichi, B. Application of genetic algorithm for optimization of control strategy in parallel hybrid battery vehicles. J. Frankl. Inst. 2006, 343, 420–435. [Google Scholar] [CrossRef]
  5. Dong, B. Energy Management System Control Strategy and Optimization for Battery Vehicle Based on the Lithium-Ion Power Battery; Jilin University: Changchun, China, 2014. [Google Scholar]
  6. Deng, Y.-w.; Gong, J.-k.; Wang, Y.-n. Energy Optimization and Simulation of HEV Using Mild Hybrid Control Strategy. China J. Highw. Transp. 2008, 21, 114–120. [Google Scholar]
  7. Lei, F.; Bai, Y.; Zhu, W.; Liu, J. A novel approach for electric powertrain optimization considering vehicle power performance, energy consumption and ride comfort. Energy 2019, 167, 1040–1050. [Google Scholar] [CrossRef]
  8. Morozov, A.; Humphries, K.; Rahman, T.; Zou, T.; Angeles, J. Drivetrain Analysis and Optimization of a Two-Speed Class-4 Electric Delivery Truck. SAE Tech. Paper 2019. [Google Scholar] [CrossRef]
  9. Puma-Benavides, D.S.; Izquierdo-Reyes, J.; Calderon-Najera JD, D.; Ramirez-Mendoza, R.A. A Systematic Review of Technologies, Control Methods, and Optimization for Extended-Range Electric Vehicles. Appl. Sci. 2021, 11, 7095. [Google Scholar] [CrossRef]
  10. Tan, S.; Yang, J.; Zhao, X.; Hai, T.; Zhang, W. Gear ratio optimization of a multi-speed transmission for electric dump truck operating on the structure route. Energies 2018, 11, 1324. [Google Scholar] [CrossRef]
  11. Kwon, K.; Jo, J.; Min, S. Multi-objective gear ratio and shifting pattern optimization of multi-speed transmissions for electric vehicles considering variable transmission efficiency. Energy 2021, 236, 121419. [Google Scholar] [CrossRef]
  12. Lin, Y.; Hao, J.M.; Ji, Z.S.; Dai, Y.S. A study of genetic algorithm based on isolation niche technique. J. Syst EMS Eng. 2000, 15, 86–91. [Google Scholar]
  13. Chen, X.-D.; He, R.; Yang, Z.-L. Development of hybrid battery vehicles (HEV) performance simulation software. J. Traffic Transp. Eng. 2002, 2, 114–117. [Google Scholar]
  14. Wang, Q.-N.; Yu, Y.-T.; Zeng, X.-H.; Yu, Y.-B. Development of forward-looking simulation platform for hybrid battery vehicle based on software CRUISE. J. Jilin Univ. (Eng. Technol. Ed.) 2009, 39, 1413–1419. [Google Scholar]
  15. Qiao, H.M. Research on Two-Wheel Drive Electric Vehicle Motor Control System; Shandong University of Technology: Zibo, China, 2008. [Google Scholar]
  16. Sun, X.X.; Wang, Y.C.; Xiang, L.Y.; Wang, R. A Research on the Braking Control Strategy with Energy Consuming Braking for Power-split HEV. Automot. Eng. 2012, 34, 46–50. [Google Scholar]
  17. BimaI, K. Bose Modern Power Electronics And AC Drives; Prentice Hall PTR: Hoboken, NJ, USA, 2001. [Google Scholar]
  18. Li, B.; Chen, Q. Research on battery characteristics in hybrid electric vehicles. Automob. Technol. 1999, 10, 11–14. [Google Scholar]
  19. Massimo, C. New Dynamical Models of Leads-Acid Batteries. IEEE Trans. Power Syst. 2000, 15, 1184–1190. [Google Scholar]
  20. Wang, H.; Cui, S. Modeling of the characteristics of charge and discharge of lead-acid battery based on test. Chin. Labat Man 2005, 42, 38–41. [Google Scholar]
  21. Zhang, B.Y. Battery Inner Resistance Test during Battery Maintenance. Telecom Power Technol. 2002, 2, 26–29. [Google Scholar]
  22. Endo, M.; Takeda, T.; Kim, Y.J. High Power Electric Double Layer Capacitor (EDLC’s) from Operation Principle to Pore Size Control in Advanced Activated Carbons. Carbon Sci. 2001, 1, 117–128. [Google Scholar]
  23. Wendy, G.; Pell, B.E.; Conway, W.A. Electrochemical efficiency in multiple discharge/recharge cycling of super capacitors in hybrid EV applications. J. Power Sources 1999, 80, 134–141. [Google Scholar]
  24. Liu, X.-B.; Ma, J.; Hao, R.-R.; Song, Q.-S. Design of regenerative braking energy feedback system for ultracapacitor heavy-duty tractor. J. Traffic Transp. Eng. 2013, 13, 60–65. [Google Scholar]
  25. Zhou, Y.; Jia, J. Parameters optimization of hybrid battery vehicle based on orthogonal experimental design and multi-objective genetic algorithm. J. Automot. Saf. Energy 2014, 5, 324–330. [Google Scholar]
  26. Xu, J.; Liu, J. A new genetic algorithm based on niche technique. Pattern Recognit. Artif. Intell. 1999, 12, 104–108. [Google Scholar]
  27. Jiang, J.-G.; Li, J.; Long, X.-P.; Shen, J.-L.; Tian, M. A shuffled frog leaping algorithm using niche technology. Chin. J. Comput. Mech. 2012, 29, 960–965. [Google Scholar]
  28. Cheol, G.L.; Cho, D.-H.; Jung, A.H.-K. Niching Genetic Algorithm with Restricted Competition Selection for Multimodal Function Optimization. IEEE Trans. Magn. 1999, 35, 1722–1725. [Google Scholar] [CrossRef]
  29. Ban, S.-H.; Yang, H.-Z. Niche genetic algorithms applied in inversion of pore media. Pet. Explor. Dev. 2005, 32, 78–81. [Google Scholar]
  30. Dragomir, O.E.; Dragomir, F.; Radulescu, M. Matlab Application of Kohonen Self-organizing Map to Classify Consumers’ Load Profiles. Procedia Comput. Sci. 2014, 31, 474–479. [Google Scholar] [CrossRef]
  31. Zhang, J.; Sanderson, A.C. JADE: Adaptive differential evolution with optional external archive. Evol. Comput. IEEE Trans. 2009, 13, 945–958. [Google Scholar] [CrossRef]
  32. Ma, J.; Jia, X. Comprehensive Evaluation of Power Quality Based on the Method of Consistent between Subjective and Objective in the Least-squares Sense. Electr. Power Sci. Eng. 2013, 29, 18–23. [Google Scholar]
Figure 1. Dynamic analysis model of unmanned electric drive chassis based on CRUISE.
Wevj 14 00260 g001
Figure 2. Hybrid energy system control strategy.
Wevj 14 00260 g002
Figure 3. Structure diagram of the resistance-capacitance model of a lead acid battery.
Wevj 14 00260 g003
Figure 4. Structural diagram of the supercapacitor equivalent model.
Wevj 14 00260 g004
Figure 5. Model-in-the-loop optimization process.
Wevj 14 00260 g005
Figure 6. Two-dimensional array model of the KOHONEN network.
Wevj 14 00260 g006
Figure 7. The structure of KOHONEN.
Wevj 14 00260 g007
Figure 8. Clustering graph of neurons in the KOHONEN network. (a) Distance between neighboring neurons. (b) Statistics chart of winning neuron.
Wevj 14 00260 g008
Figure 9. Optimal target-normalized value in different weights. A: Dynamics target. B: Economic objectives. C: Power performance + economic objectives.
Wevj 14 00260 g009
Figure 10. Dynamic evolution curve of objective function value for 3 algorithms.
Wevj 14 00260 g010
Figure 11. Vehicle following curve conditions in China’s urban bus cycle.
Wevj 14 00260 g011
Figure 12. Unmanned electric drive chassis energy consumption compared using three algorithms in CBC.
Wevj 14 00260 g012
Table 1. Basic parameters of the chassis of the first-generation unmanned electric drive chassis.
ParametersNumerical ValueUnit
Total mass5244m/kg
Air drag coefficient0.6CD
Windward area6.0168A/m2
Rolling resistance coefficient0.019f
Wheel radius0.357r/m
Driveline efficiency85ηT/%
Transmission ratio[5.568, 2.360, 1.634, 1]ign
Final drive ratio6.43i0
Rated power of motor40Pe/kW
Maximum power of motor70 Pm/kW
Rated torque of motor124 Te/N·m
Maximum torque of motor300 Tm/N·m
Rated speed of motor3000ne/(r·min−1)
Maximum speed of motor5000 nm/(r·min−1)
Battery capacity120C/Ah
Table 2. Optimization variables and upper/lower limits.
Variable NameOptimization ParametersLower LimitUpper Limit
x1Motor power/kW3060
x2First-gear transmission ratio2.85.7
x3Second-gear transmission ratio1.52.6
x4Third-gear transmission ratio0.91.1
x5Final drive ratio3.57.5
x6Battery capacity100 Ah200 Ah
x7Supercapacitor energy storage100 Wh300 Wh
Table 3. Operating parameters of KIGA.
ParameterNumeric Value
Number of variables7
Population size500
Iterations to terminate evolution600
Crossover probability/Pc0.4
Mutation probability/Pm0.01
Maximum allowable size of subpopulation/Smax80
Minimum allowable size of subpopulation/Smin30
Table 4. Unmanned electric drive chassis performance comparison before and after parameter optimization.
Optimization ProjectBefore and after Optimization
Before OptimizationGAIGAKIGA
Optimization ValueRate of ChangeOptimization ValueRate of ChangeOptimization ValueRate of Change
Optimization variablesFirst-gear transmission ratio5.5685.384−3.30%5.352−3.88%5.352−3.88%
Second-gear transmission ratio2.6052.7144.18%2.6521.80%2.6431.46%
Third-gear transmission ratio110.00%0.984−1.60%0.984−1.60%
Final drive ratio6.436.32−1.71%6.24−2.95%6.24−2.95%
Battery capacity/Ah132126−4.55%120−9.09%120−9.09%
Supercapacitor energy storage/Wh1621789.88%18614.81%18916.67%
PowerMaximum speed
(km/h)
9192.21.32%92.51.65%92.51.65%
Maximum gradient/%36.2235.37−2.35%35.14−2.98%35.14−2.98%
0~50 km/h
Acceleration time/s
11.511.12−3.30%11.04−4.0%11.04−4.0%
Economy100 km power consumption
(kWh/100 km)
34.2530.94−9.66%30.46−11.07%30.42−11.18%
Driving range/km106.3109.73.20%113.97.15%114.77.90%
Comprehensive performanceAcceleration time + 100 km power consumption0.9700.902−7.07%0.891−8.18%0.890−8.26%
Disclaimer/Publisher’s Note: The statements, opinions and data contained in all publications are solely those of the individual author(s) and contributor(s) and not of MDPI and/or the editor(s). MDPI and/or the editor(s) disclaim responsibility for any injury to people or property resulting from any ideas, methods, instructions or products referred to in the content.

