Article

Sensitivity Analysis of Electric Energy Consumption in Battery Electric Vehicles with Different Electric Motors

1
Department of Mechanical and Aerospace Engineering, Turin Polytechnic University in Tashkent, Tashkent 10095, Uzbekistan
2
Department of Mechanical and Aerospace Engineering, Politecnico di Torino, 10129 Torino, Italy
3
Department of Vehicle Engineering, Tashkent State Transport University, Tashkent 10047, Uzbekistan
*
Author to whom correspondence should be addressed.
World Electr. Veh. J. 2023, 14(2), 36; https://doi.org/10.3390/wevj14020036
Submission received: 5 January 2023 / Revised: 24 January 2023 / Accepted: 28 January 2023 / Published: 30 January 2023
(This article belongs to the Special Issue Recent Advances in Electric Motor Drives for Electrified Mobility)

Abstract

:
In the last decade, a number of research works in electrified vehicles have been devoted to the analysis of the electric consumption of battery electric vehicles and the evaluation of the main influencing factors. The literature analysis reveals that the electric motor size, efficiency, and driving condition substantially affect the electric energy stored in the vehicle battery. This paper studies the degree of sensitivity of energy consumption to electric motor size and to its efficiency map characteristics. In order to accomplish this task, three electric motors whose parameters are re-scaled to fit the maximum power torque and speed with different efficiency maps are simulated by installing them on two commercially available battery electric vehicles. This allows for isolating the influence of the efficiency map on electricity consumption. The original characteristics of the motors are then used to evaluate the influence on the electricity consumption of both the size and the efficiency characteristics. The results of the simulation revealed that the influences of the efficiency map and the electric motor size can be around 8–10% and 2–11%, respectively. When both factors are taken into account, the overall difference in electricity consumption can be around 10–21%.

1. Introduction

Battery Electric Vehicles (BEVs) are considered one of the main solutions for the reduction of the environmental impact of the transportation sector [1]. In the context of banning internal combustion engine-powered vehicles starting in 2025, the BEVs seem to be the main solution for private mobility to long distances [2]. This type of vehicle can achieve carbon-neutral mobility provided that the electricity they utilize is generated from renewable sources [3]. However, the wide customer acceptance of BEVs is still limited due to the drivers’ range anxiety [4,5], comparably longer recharge time [6] and higher cost [7]. Chakraborty et al. have investigated the possibility of using sustainable mobility solutions to reduce the negative impact of the transportation to the environment. Furthermore, they have highlighted different aspects limiting the wider implementation of such means of mobility [8]. A wide range of technologies are being implemented to reduce the charging time by using fast charging methods and to optimize the cost of the electric components [1,3,4,5,6,7]. The issue related to the drivers’ range anxiety is being addressed by researchers in two ways: (1) by increasing the battery energy density using different chemistry and production technologies and (2) by improving the efficiency of energy utilization acting on the main influencing factors [9]. In this context, a majority of literature covers studies on the modeling of the electric energy consumption of BEVs to determine the main factors influencing overall energy efficiency. Mruzek et al. [10] investigated the influence of drive cycle (speed and acceleration), vehicle weight and body shape, battery size, and electric motor (EM) size and efficiency on the BEV range. Considering two electric motors with peak powers of 30 kW and 60 kW, they concluded that the BEV with a smaller EM size can achieve a 25% longer range on real driving cycles. The main reason is that EM with smaller power works at higher efficiency regions compared to the larger motor. As the work considered real driving scenarios, the comparison of these two cases was not performed in the same driving condition. Koch et al. [11] used the Dynamic Programming method to optimize the efficiency of EM by constructing a driving speed profile that allows for reducing the electric energy consumption while following the homologation cycles. However, for each drive cycle, the efficiency map has to be different. This approach can be used in the design phase of electric motors. The powertrain size for an electric bus was defined by Pathak et al. [12] using the realistic driving speed and road profiles. The energy consumption reduction was achieved by powertrain topology optimization using two electric motors. Similarly, Yildirim and Kurt [13] considered the powertrain configuration with two electric motors combined with the multi-speed gearbox. They studied the influence of the number of speeds in the gearbox and operation modes of two electric motors on the electricity consumption. The results showed that 7% less energy can be consumed for the multi-speed gearbox compared to the fixed ratio configuration. This improvement is mainly linked to the flexibility in operating at higher efficiency regions when the multi-speed gearbox is used. Moreover, they discussed the possibility to improve the performance using the powertrain in multi-mode operation including the load shifting mode where the second electric machine is used as a generator. However, this feature is peculiar to two motors configuration, which cannot be used with single-motor configurations. Pume-Benavides et al. [14] studied the influence of the final gear ratio on the electric energy consumption for commercial vehicles. Ramakrishnan et al. [15] proposed a model to scale the geometry and consequently the performance of the electric motor while optimizing energy efficiency. The electric motor geometry with the lowest energy consumption on a given cycle was chosen based on the iterative method. The approach to design the electric motor size and efficiency map using the working points on a driving cycle was presented by Pastellides et al. [16]. Around 1.6% energy consumption reduction was achieved by properly designing the EM efficiency map in order to have higher values in the frequently used regions during the operation on drive cycles. The required EM efficiency map was obtained by modifying the geometry of the rotor and the stator of the interior permanent magnet machine. Stipetic et al. [17] analyzed six motors, three having the same rated power outputs, however, having different maximum torque values, and the remaining three having the same rated torque but with different powers. The efficiency maps for these motors were created by using a finite element analysis approach. The variation of the efficiency map for considered electric motors is widely discussed. Nevertheless, the change in energy consumption over the driving cycle is not highlighted. Analysis of the existing literature reveals that the reduction of the energy consumption of the BEVs can be achieved by acting on the electric motor in such ways as (1) reducing the size of the electric motor, (2) designing its efficiency map based on driving cycles and (3) using the multi-speed gearboxes. Although, in all these scenarios, the reduction is mainly achieved by allowing the electric motor to operate at higher efficient regions in most of the operation period. Nevertheless, the available works do not evidence the degree of sensitivity of the BEV electric energy consumption to the changes in EM efficiency maps that possess the same power and torque. Furthermore, there is a gap in the analysis of using different electric motors on the same vehicle using the same transmission. To analyze the influence of the electric motor size and efficiency on electricity consumption, electric motors with various power and efficiency maps are required to be used. Due to the lack of a wide range of data on electric motors, the re-scaling of the parameters of available motors is performed. Obviously, this procedure might not carry physical meaning; however, it allows for understanding the sensitivity of the electricity consumption on such EM parameters. Therefore, the present work aims to assess, both qualitatively and quantitatively, the influence of the efficiency map of the electric motor on BEV energy consumption. For this purpose, the original characteristics of commercially available electric motors such as BMW i3 EM, Kia Soul EM, and YASA 400 EM are used to investigate the influence of EM parameters (maximum power and efficiency maps) on energy consumption. These electric motors are re-scaled to have the same maximum power and maximum torque during the simulations. The simulation results are validated by comparing them with the experimental results of publicly open data from Argonne National Laboratory [18] available online for BMW i3 and Kia Soul.

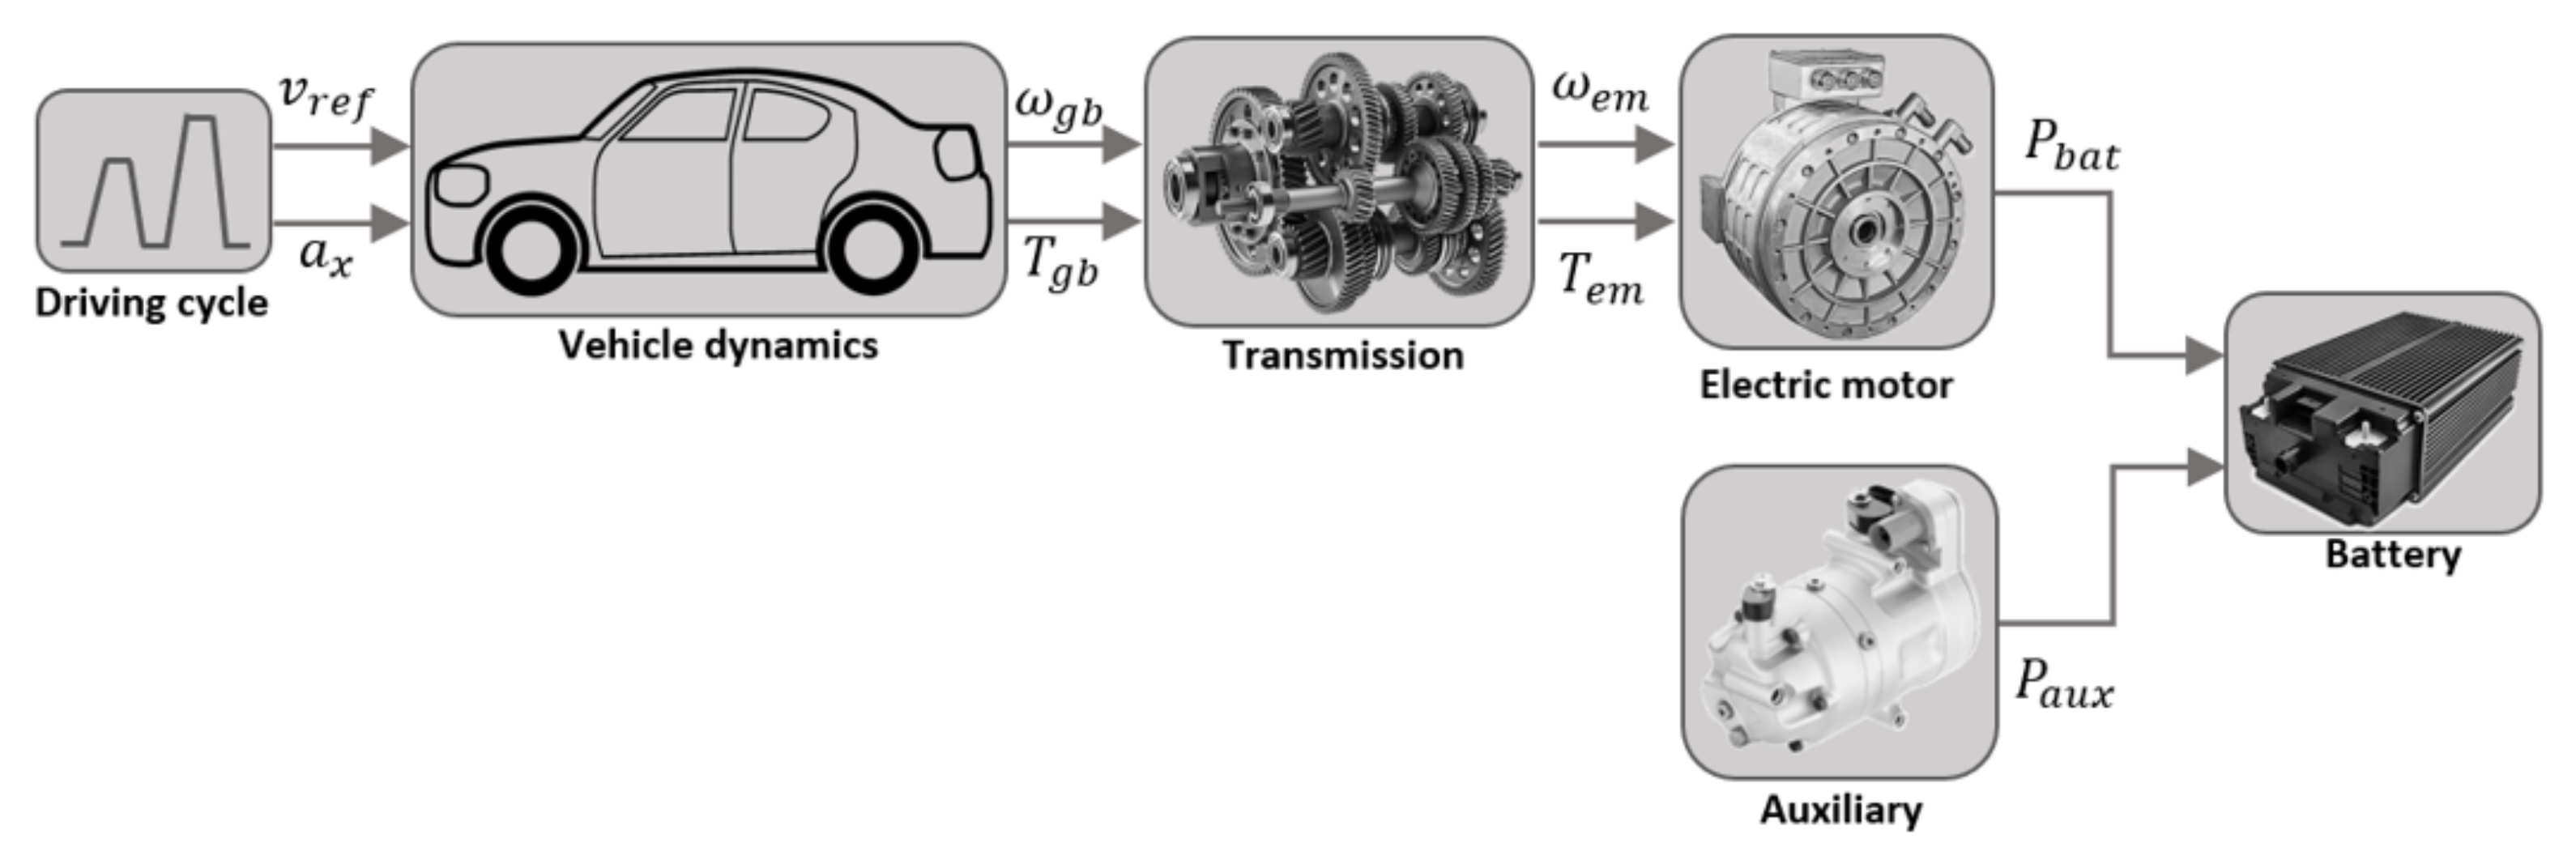
2. Electric Vehicle Modelling

This section describes the complete model of the BEV for evaluation of energy consumption based on the backward modeling approach [19,20] shown in Figure 1. This model determines the amount of energy consumed during the homologation driving cycle using the maps and the characteristics of the powertrain components obtained experimentally.
To validate the model, the experimental data for two commercially available BEVs as BMW i3 2014 and Kia Soul 2015 are used. The detailed experimental data for the complete vehicles generated at the Advanced Powertrain Research Facility (APRF) at Argonne National Laboratory are publicly available at [18,21,22]. The data are obtained in a dynamometric test bench [23] on different driving cycles [24,25,26] and varying auxiliary loads. The vehicles’ technical specifications are given in Table 1.
The inputs to the model are the speed profile, vehicle specifications, powertrain components’ maps, and the time history of the accessory loads. The main monitored model outputs are the battery current, voltage, and SOC. The model accounts for the regenerative braking energy which increases the overall efficiency of the powertrain [27]. The value of auxiliary power is mainly derived from the power requirement of the air conditioner.
A brief description of the simulation model is given below. More detailed information about Matlab/Simulink implementation of the backward model can be found in [28].

2.1. Longitudinal Vehicle Dynamics Model

The longitudinal vehicle dynamics model computes the resistance forces (aerodynamic resistance F a , rolling resistance F r and inertia) acting on the vehicle and the required traction force F t on the wheels to overcome these resisting forces [19,20,28,29]. Then, the traction force is:
F t ( t ) = M v e h · d V v e h d t + 1 2 · ρ · A f · C x · V v e h 2 + f r · M v e h · g
where ρ —air density, [kg/m 3 ]; A f —vehicle frontal area, [m 2 ]; C x —aerodynamic drag coefficient, [-]; f r —rolling resistance coefficient, [-]; V v e h —vehicle speed, [m/s]; M v e h —vehicle mass, [kg]; and g—gravitational acceleration, [m/s 2 ].
The required torque T r e q on the wheels can be evaluated by multiplying the traction force F t to the wheel radius R w :
T r e q = F t · R w
Hence, the mechanical power P m e c h on the vehicle wheels is computed as follows:
P m e c h = T r e q · V v e h R w

2.2. Speed Reducer

In modern BEVs, single-ratio speed reducers are widely used. The speed reducer model is used to change the value of input angular speed ω g b , angular acceleration ω ˙ g b and torque T g b at the wheels to the outputs at EM input shaft level (see Figure 1). These outputs i.e., the angular speed ω e m , angular acceleration ω ˙ e m and motor torque T e m are calculated taking into account the final gear ratio U f and gear efficiency η g b of the speed reducer.
ω e m = ω g b · U f
ω ˙ e m = ω ˙ g b · U f
The value of T e m depends on the sign of T g b (i.e., on the mode of operation) and is calculated by using the following equation [19,20,28,29]:
T e m = T g b U f · 1 η g b Traction mode , ( T g b > = 0 ) T g b U f · η g b Braking mode , ( T g b < 0 )

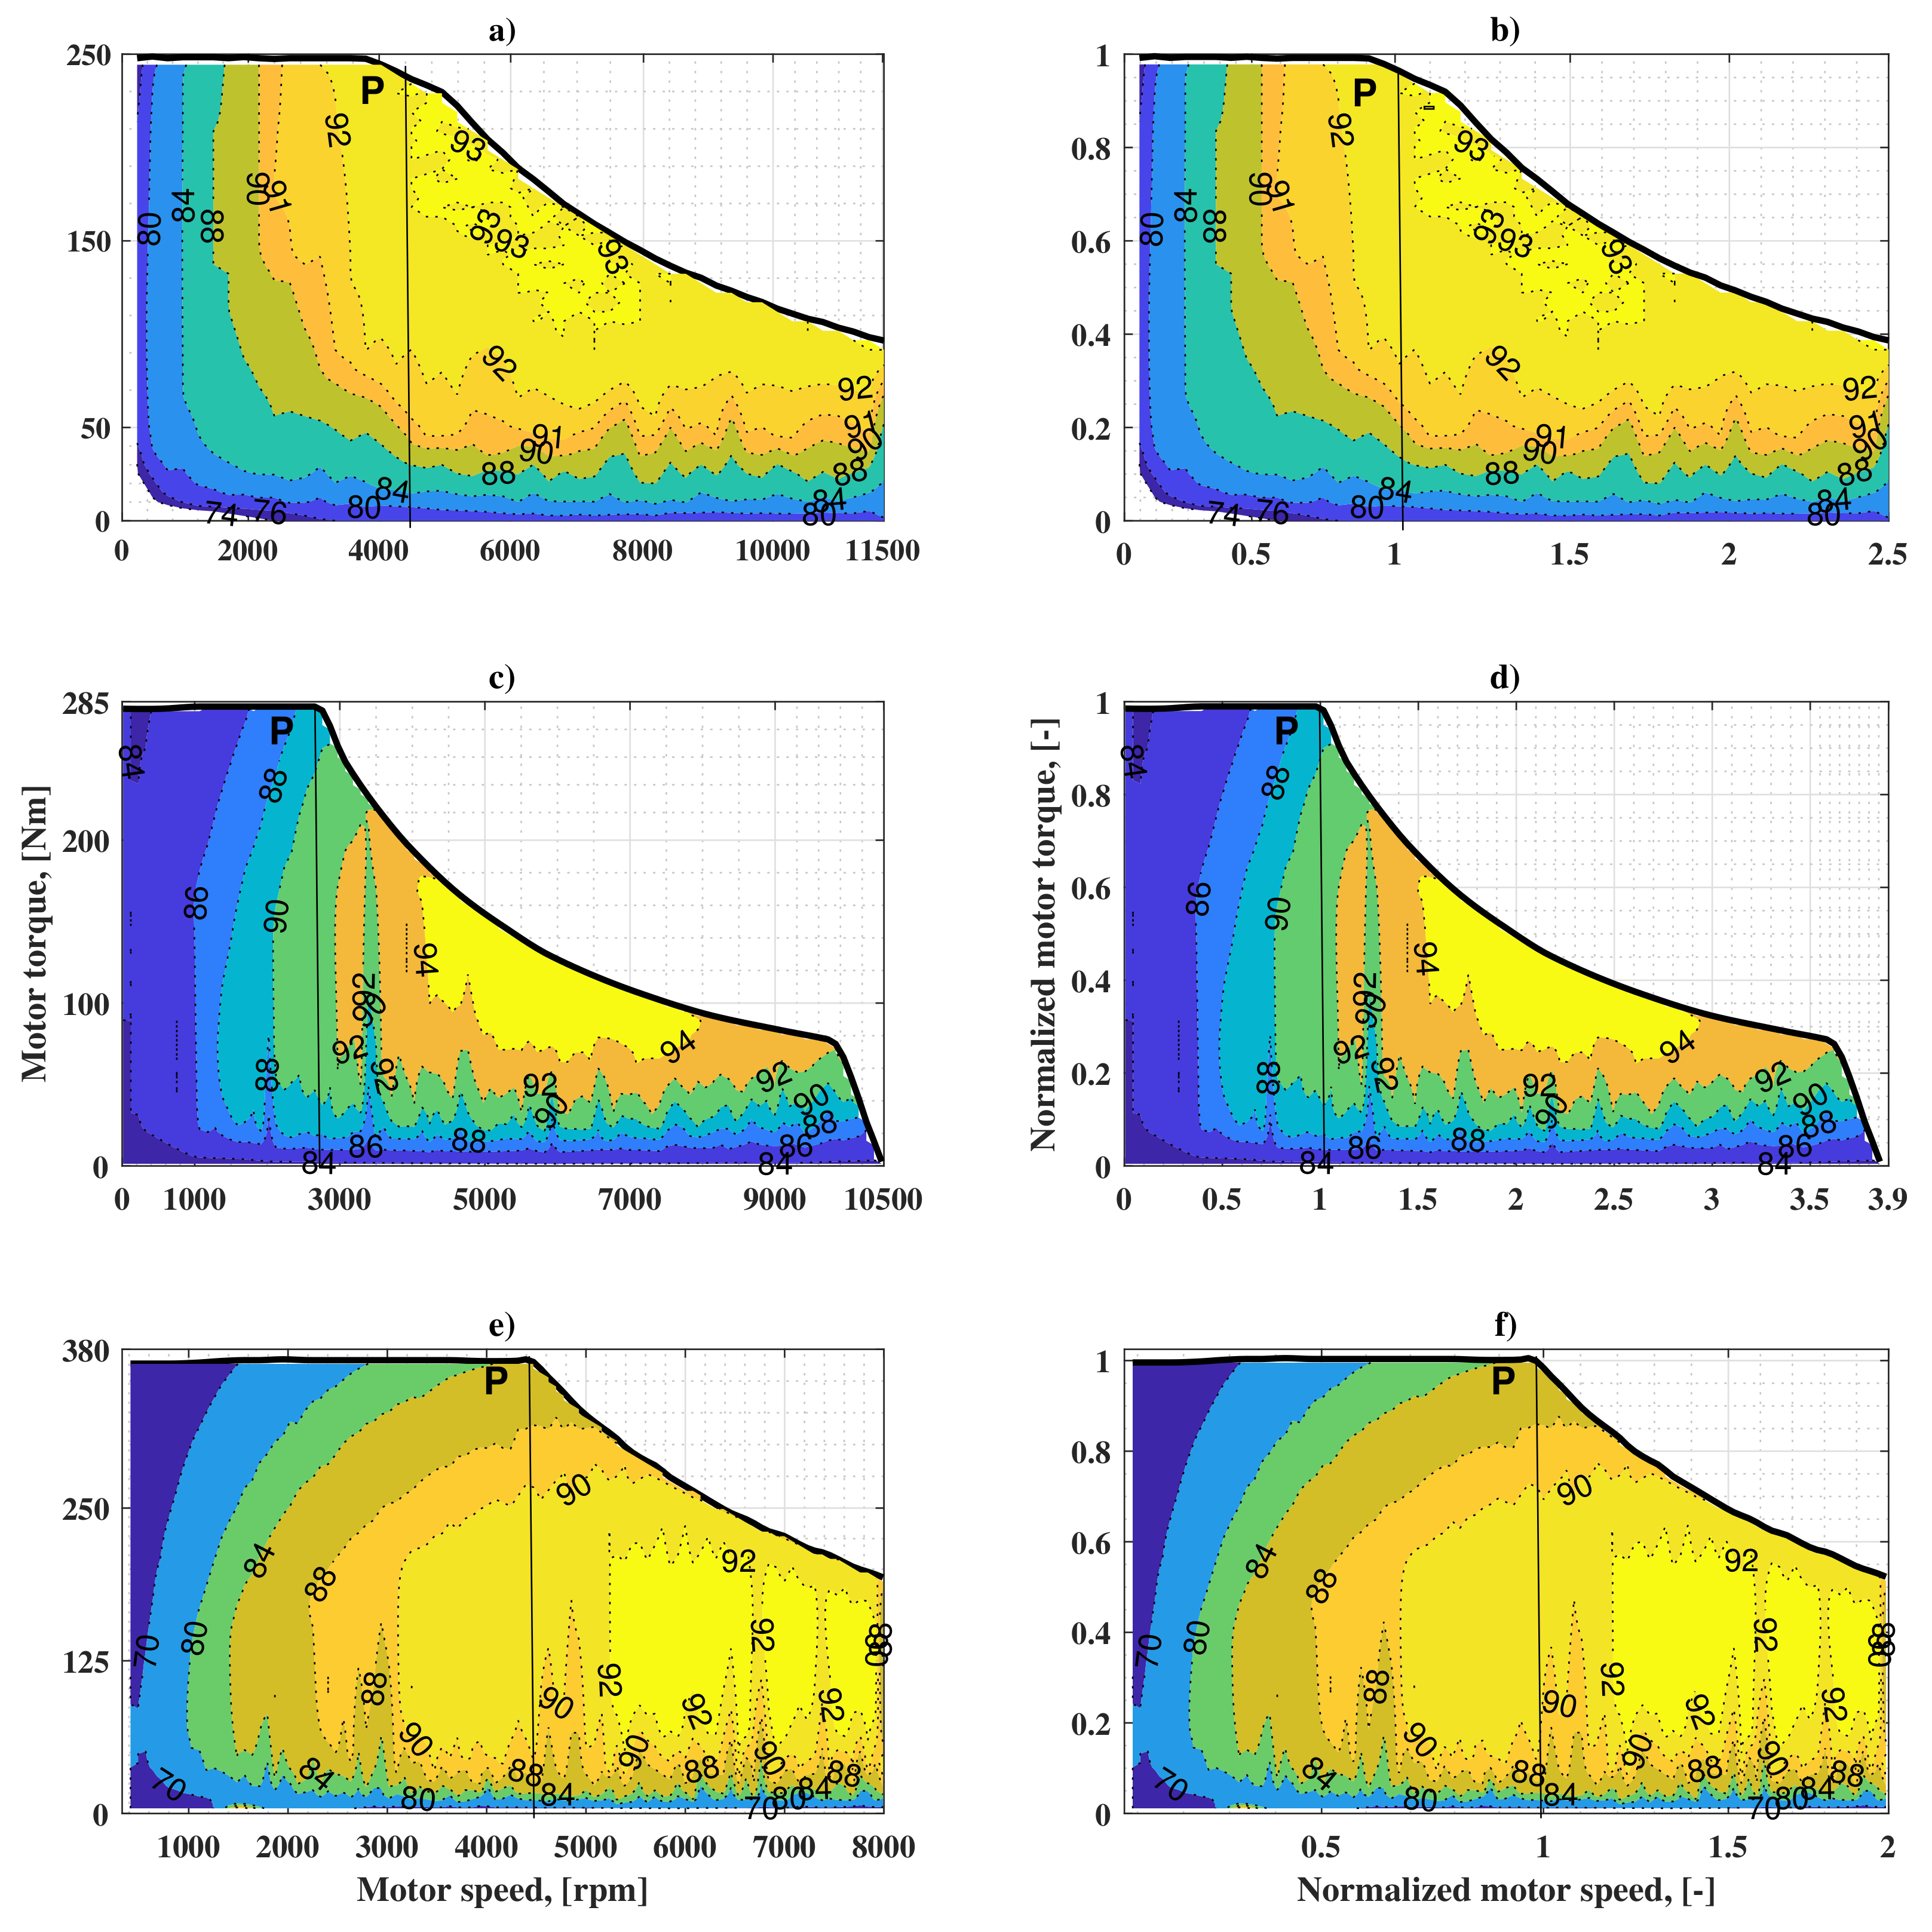
2.3. Electric Machine

The electric machine model converts the mechanical torque and speed requirement (hence, the power P e m ) to an electrical energy requirement from the battery by means of its efficiency map. The input parameters of the EM block are outputs of the transmission model, and the output is the power required from the battery P b a t , which is positive in traction mode and negative in braking. The EM’s mechanical power is calculated as follows:
P e m = ω e m · T e m
The maximum torque characteristics and efficiency maps of three EMs (BMW i3 [30], Kia Soul [31], and YASA [32]), used in commercially available BEVs, are depicted in Figure 2. The left column of the figure shows the original characteristics of the motors, while the right column contains the set of normalized ones. The normalization of the torque and speed is performed using the maximum power points P ( ω e m , P m a x , T e m , P m a x ) of the characteristics. The coordinates of these points for each motor are given in Table 2. The normalization of the EM characteristics allows for re-scaling it using maximum power points of other EMs. Therefore, the analysis of the influence of different efficiency maps of the EM on the electric energy consumption can be performed, keeping the maximum power point coordinates unchanged. The EM’s efficiency η e m can be represented as a function of ω e m and T e m or their normalized values ω n , e m and T n , e m . A polynomial equation of two variables (Equation (8)) is used to define the efficiency contour lines shown in Figure 2.
η e m = f ( ω n , e m , T n , e m ) = p 00 + p 10 · ω n , e m + p 01 · T n , e m + p 20 · ω n , e m 2 + p 11 · ω n , e m · T n , e m + p 02 · T n , e m 2 + + p 30 · ω n , e m 3 + p 21 · ω n , e m 2 · T n , e m + p 12 · ω n , e m · T n , e m 2 + p 03 · T n , e m 3 + + p 31 · ω n , e m 3 · T n , e m + p 22 · ω n , e m 2 · T n , e m 2 + p 13 · ω n , e m · T n , e m 3 + p 04 · T n , e m 4 + + p 32 · ω n , e m 3 · T n , e m 2 + p 23 · ω n , e m 2 · T n , e m 3 + p 14 · ω n , e m · T n , e m 4 + p 05 · T n , e m 5
where p i j is the coefficient of polynomial equation with i = 3 and j = 5 . The simulation data were approximated by a 5th-degree polynomial fit carried out employing the MATLAB Curve Fitting Toolbox. The choice of degree of the polynomial is based on having a coefficient of determination close to unity (with R 2 = 0.9981) while keeping the nature of change of the efficiency contour lines.
The maximum torque line of the EM T e m , m a x is calculated using the polynomial equation of the 6th order as given in Equation (9). The polynomial coefficients a i are derived using the normalized values of the torque and the speed. Hence, it is obvious that, by multiplying the equation by T e m , P m a x , the re-scaled characteristics can be obtained. The polynomial coefficients of efficiency maps and maximum torque characteristics are found for each motor separately:
T e m , m a x = T e m , P m a x · ( a 1 · ω n , e m 6 + a 2 · ω n , e m 5 + a 3 · ω n , e m 4 + ω n , e m 3 + + a 4 · ω n , e m 2 + a 5 · ω n , e m + a 6 )

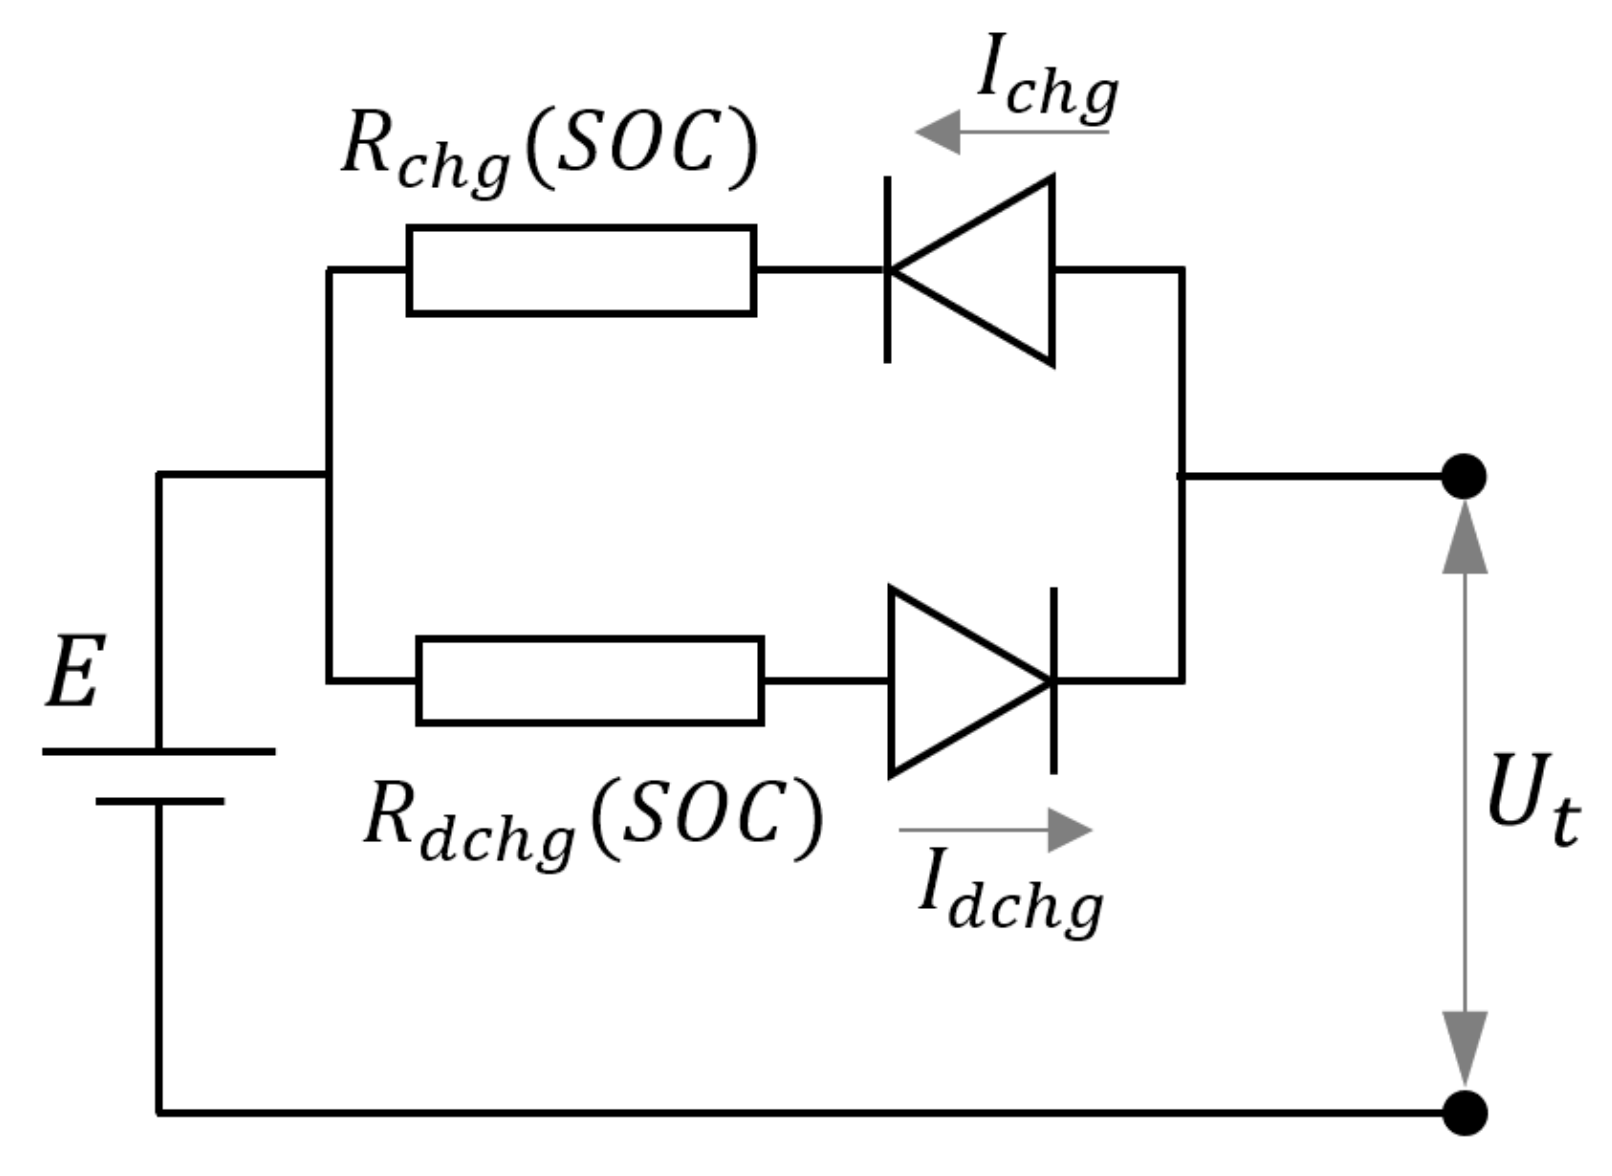
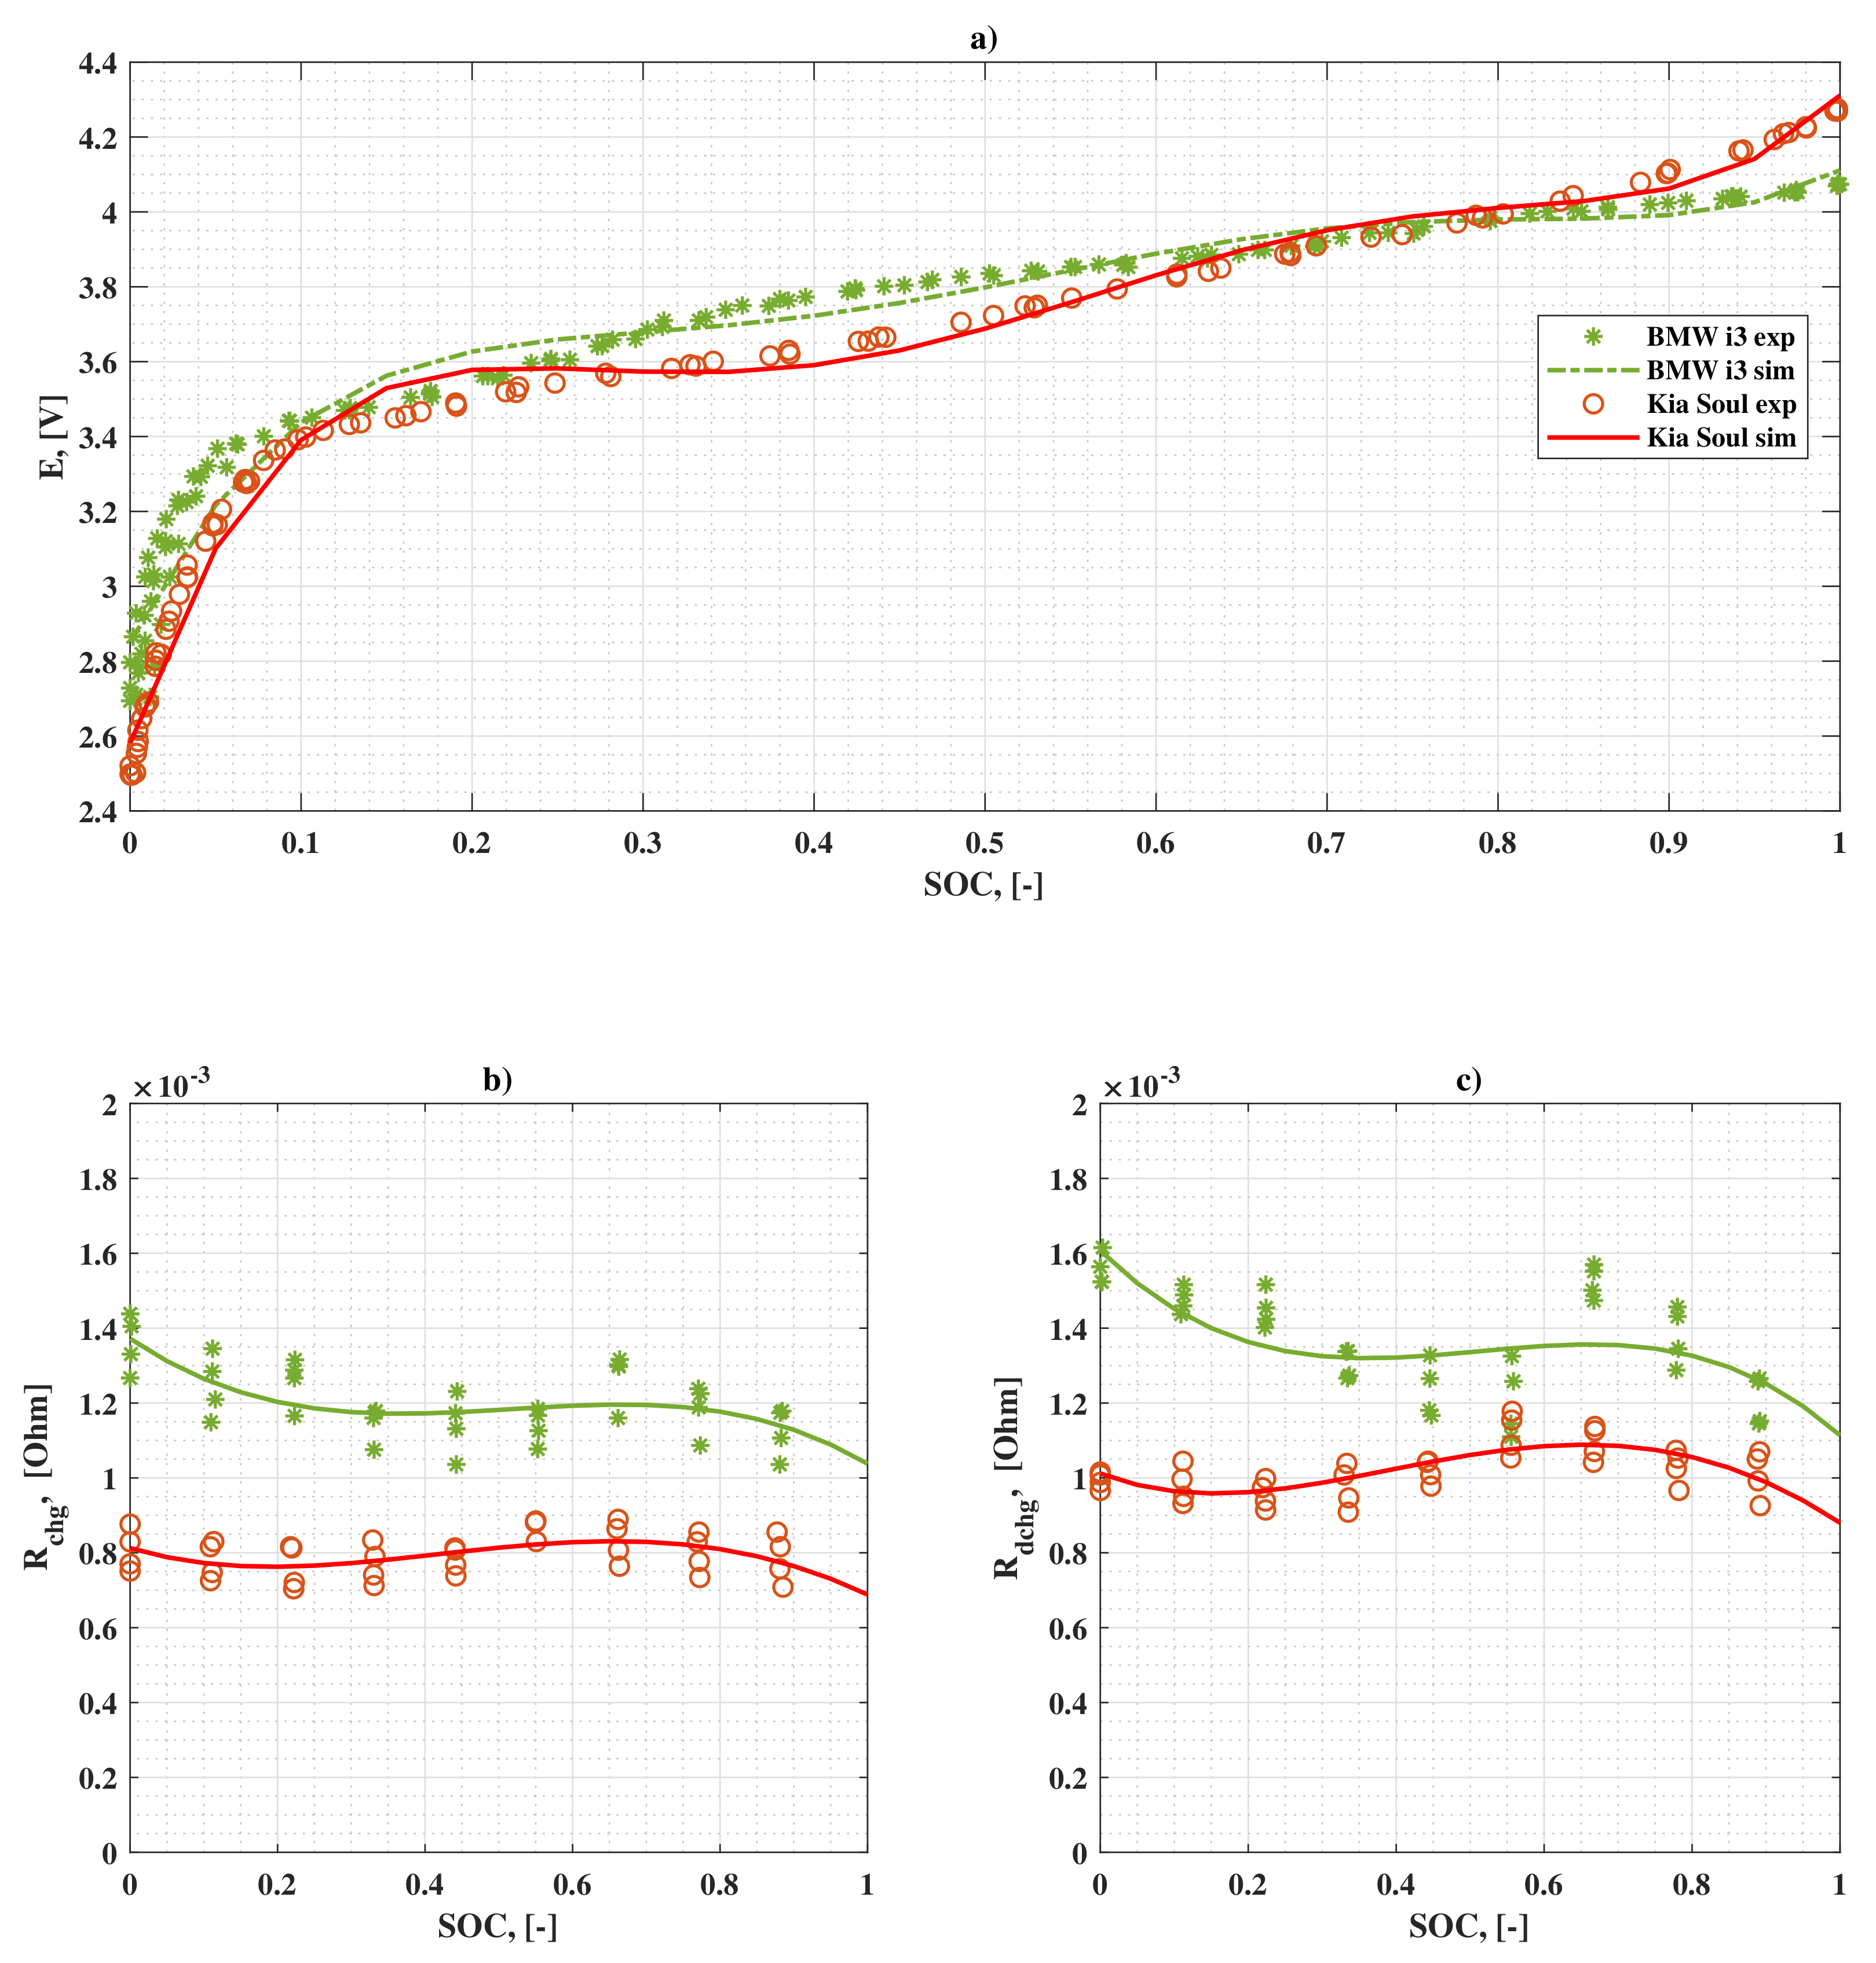
2.4. Electric Battery

The electric battery is modeled using Thevenin’s equivalent circuit model shown in Figure 3. Open circuit voltage (OCV) E, charging R c h g and discharging R d c h g resistances are expressed as functions of the state of charge (SOC). The expressions are derived by analyzing the experimental data made publicly available online by the Advanced Vehicles and Infrastructure team of Idaho National Laboratory (INL) [33] for lithium-ion batteries.
The polynomial functions E = f ( S O C ) , R c h g = f ( S O C ) and R d c h g = f ( S O C ) derived from the experimental data are described in Equations (10)–(12).
The simulated values of E are obtained from experimental values [34,35] and approximated with a 5th-degree polynomial (Equation (10)). The higher degree of the polynomial equation causes some oscillations in the range of SOC 0.1 and 0.5 (Figure 4a). However, it does not influence the results and guarantees an accurate fit in the range where the characteristics are nonlinear:
E = b 1 , V b a t · S O C 5 + b 2 , V b a t · S O C 4 + b 3 , V b a t · S O C 3 + b 4 , V b a t · S O C 2 + b 5 , V b a t · S O C + b 6 , V b a t
R c h g = c 1 , b a t · S O C 4 + c 2 , b a t · S O C 3 + c 3 , b a t · S O C 2 + c 4 , b a t · S O C + c 5 , b a t
R d c h g = d 1 , b a t · S O C 4 + d 2 , b a t · S O C 3 + d 3 , b a t · S O C 2 + d 4 , b a t · S O C + d 5 , b a t
where b i , V b a t , c i , b a t and d i , b a t are the coefficients of polynomial equations of corresponding order.
Figure 4 shows the dependence of the main battery parameters on SOC for one battery cell of two different electrified vehicles, Kia Soul BEV [34] and BMW i3 BEV [35]. Figure 4a depicts that the open circuit voltage in the usable region of the battery SOC (0.1–0.9) for both batteries has similar behavior. The battery cell resistances in charging (Figure 4b) and discharging (Figure 4c) modes have relatively constant behavior over the working range of SOC.

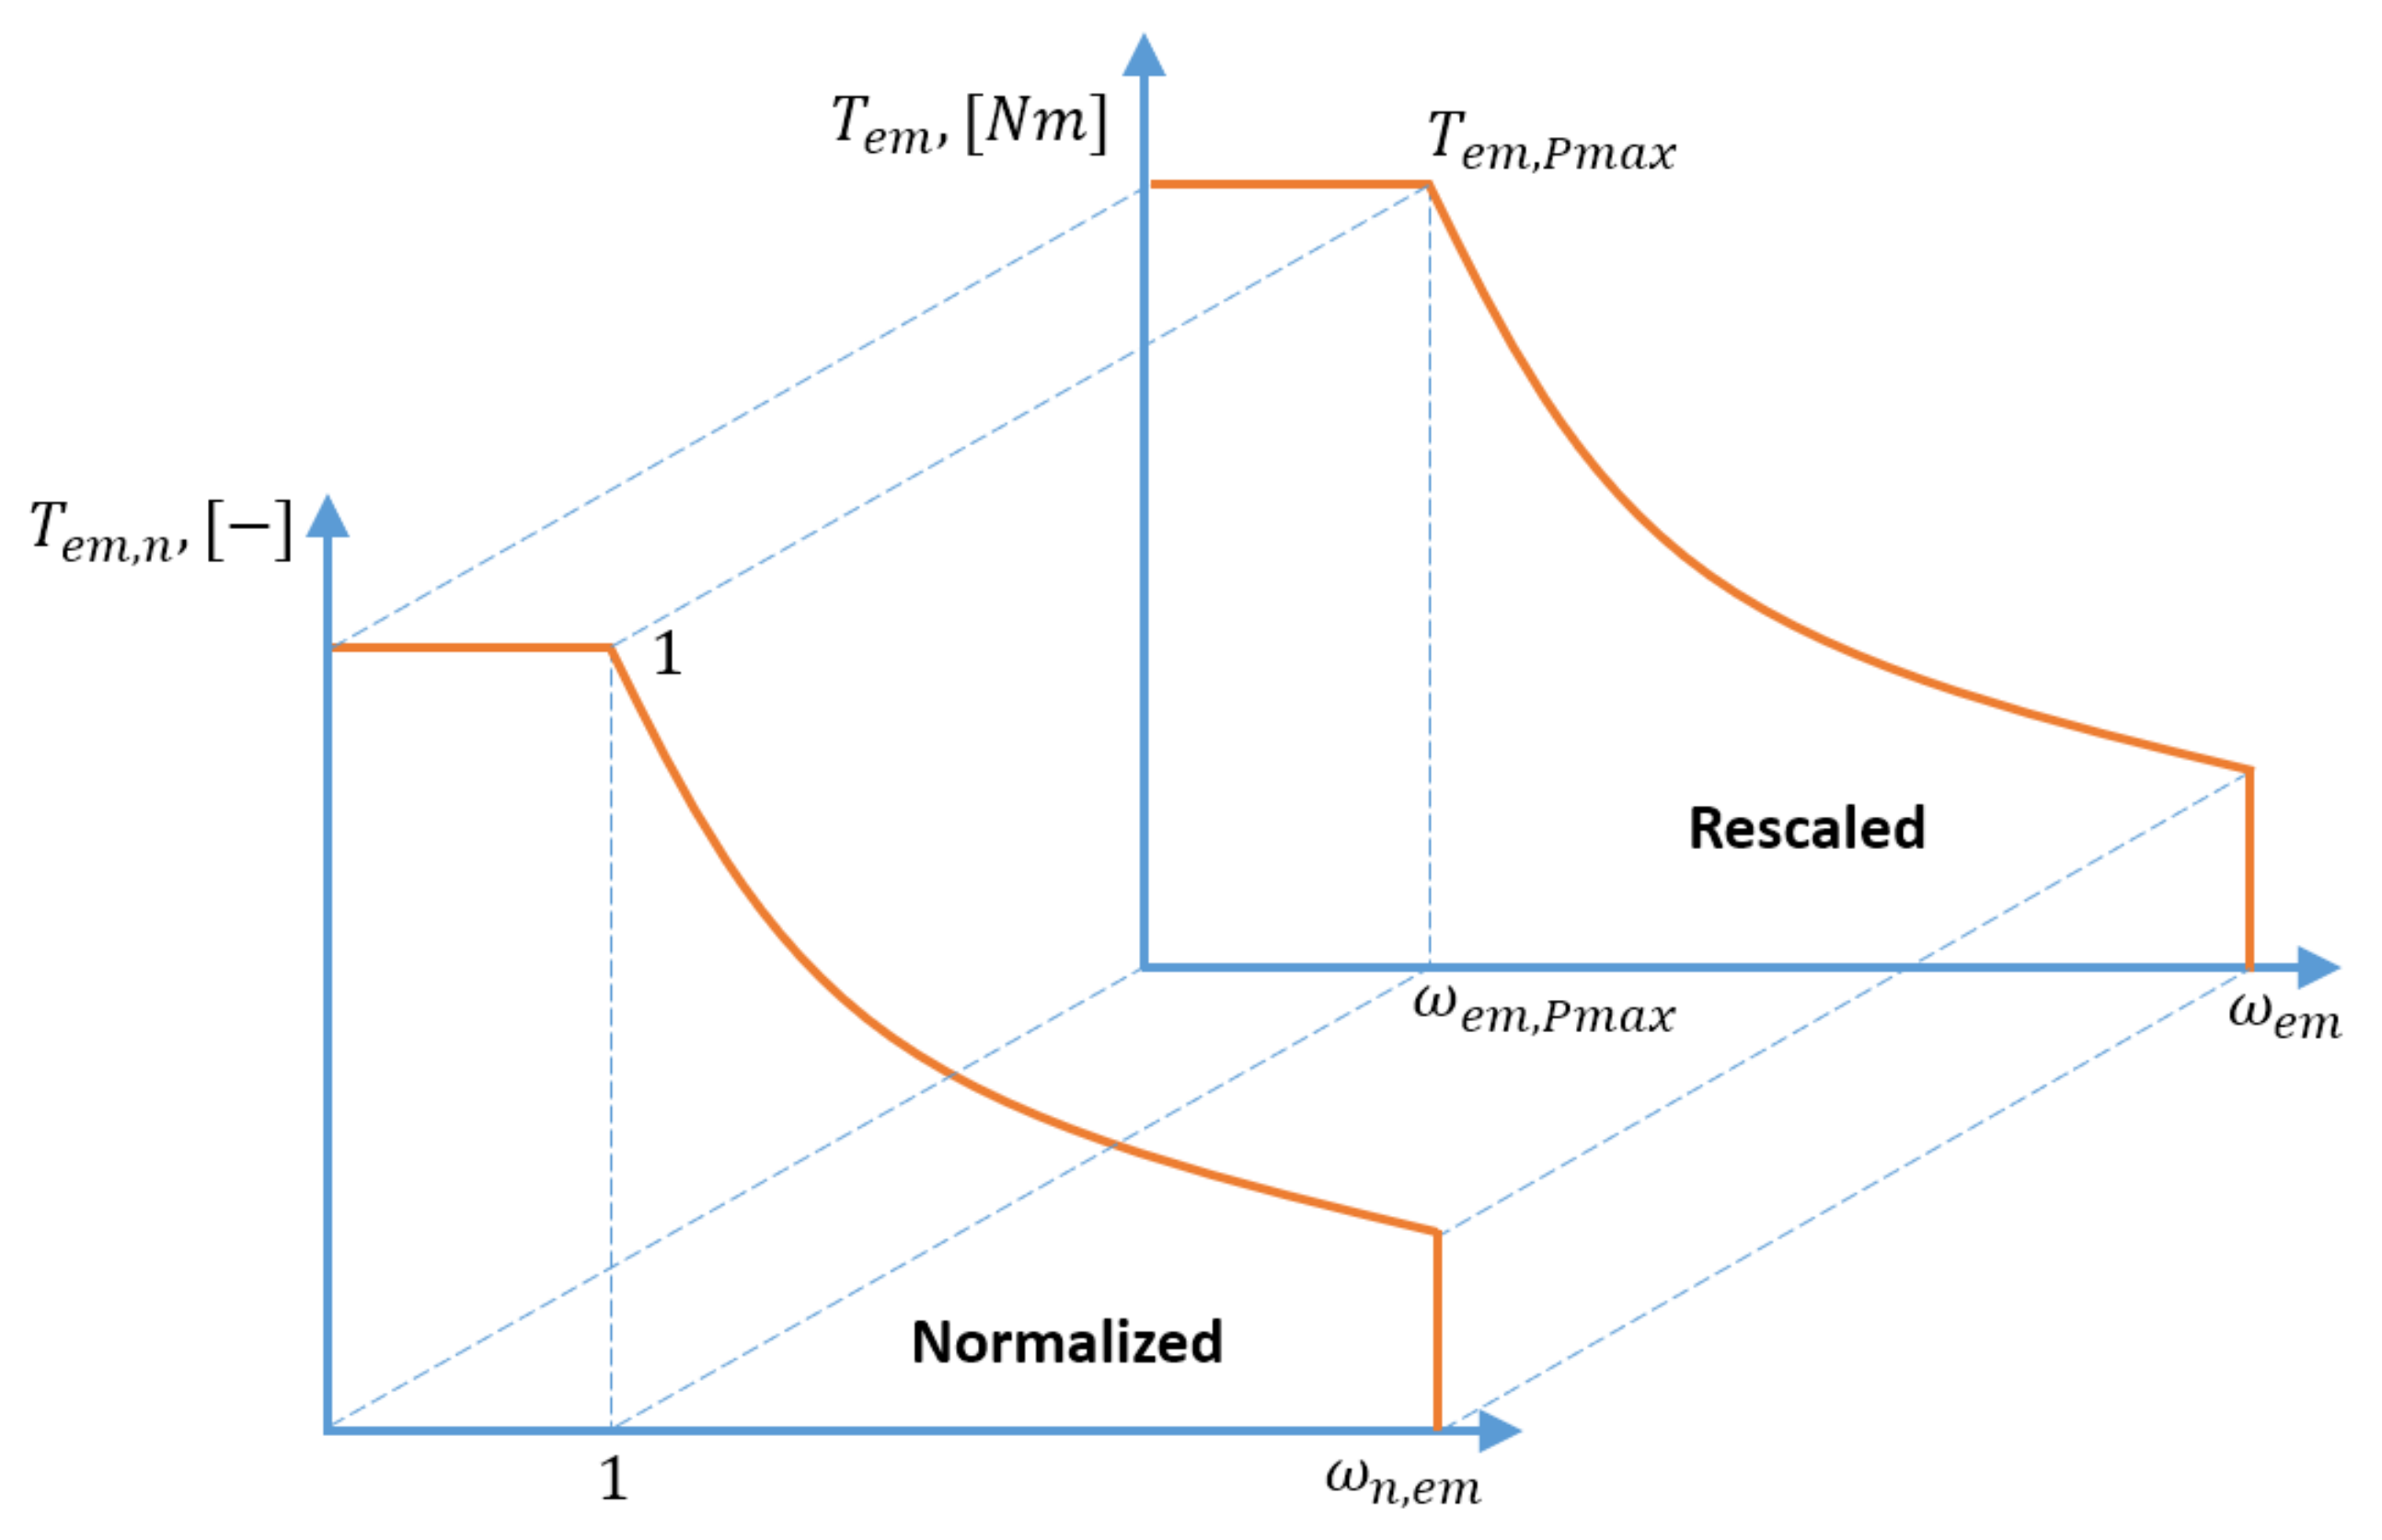
2.5. Electric Motor Re-Scaling Method

To analyze the influence of the motor characteristics and efficiency maps on electric energy consumption, three previously mentioned EMs were utilized. The simulations were performed for two BEVs using re-scaled and original characteristics of three EMs. The combination used during the simulation is shown in Table 3. It shows that, for the BMW i3 BEV, five sets of EM characteristics are used, such as Kia Soul EM re-scaled to BMW i3 EM maximum power, YASA EM re-scaled to BMW i3 EM maximum power, and three motors with their original characteristics. A similar task is performed for Kia Soul BEV, however, re-scaling the other motors to Kia Soul EM maximum power. This action can be considered as using five different motor characteristics installed in one vehicle. It should be mentioned that the re-scaling of the motors does not comprise any physical meaning; however, it allows for obtaining three electric motors of the same maximum power but with different efficiency maps.
Re-scaling the electric motor characteristics to certain maximum power can be accomplished in two steps. Firstly, the original characteristics of the EMs are normalized with respect to their own maximum power point P ( ω e m , P m a x , T e m , P m a x ) (Figure 2). Then, the normalized maps are re-scaled using the coordinates ω e m , P m a x and T e m , P m a x of the EM originally installed on the vehicles (i.e., BMW i3 or Kia Soul). In this way, the maximum torque characteristics of the motor and the efficiency map are stretched to new torque speed data. Therefore, a motor with different torque-speed characteristics and the efficiency map is obtained, while having the same maximum power point with the original EM installed on the simulated BEV. A graphical representation of the re-scaling procedure is shown in Figure 5. The normalized characteristics of the EMs shown in Figure 2 are used for this purpose.

3. Sensitivity Analysis for Electric Energy Consumption
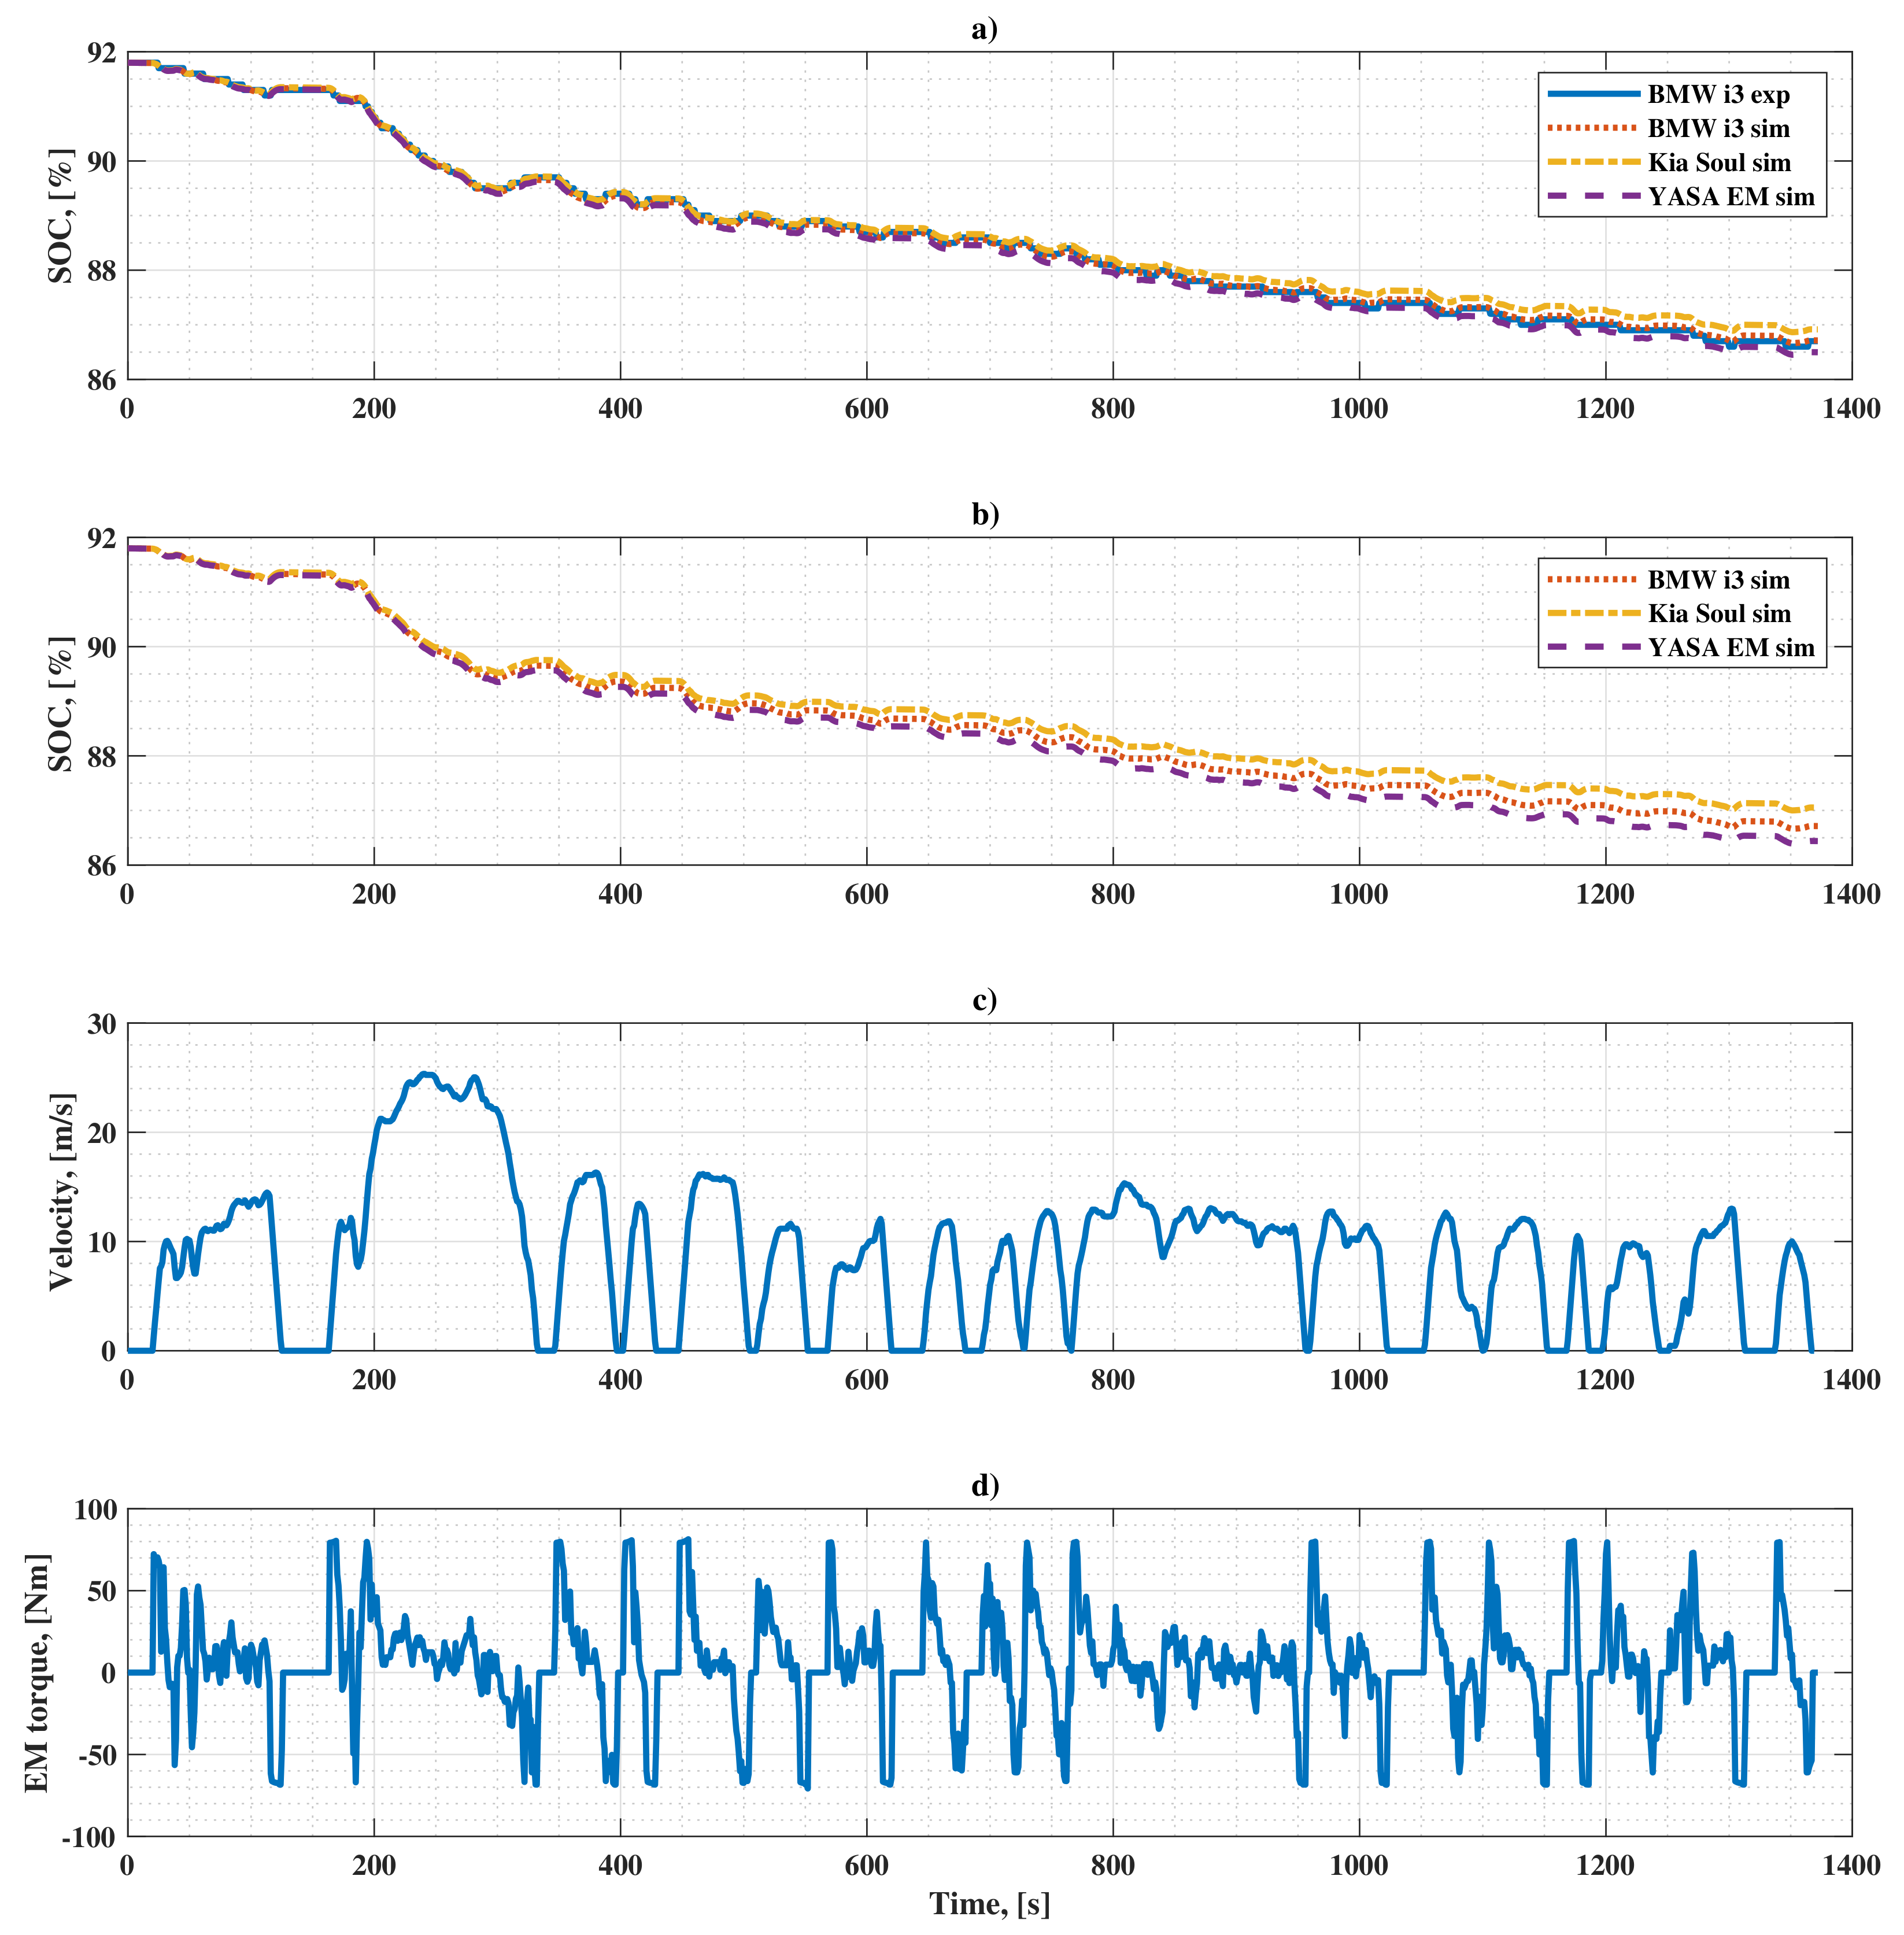
The vehicle models are simulated over various driving cycles and with different electric motors in order to define energy consumption. The working points of the electric motor on a given driving cycle are composed of the required angular speed ω r e q and the torque T r e q points. For certain vehicle parameters set (mass, transmission, etc.) and drive cycle, the working points are the same. However, these working points are performed at different efficiency values for various EMs.
Figure 6 demonstrates the simulation results of two re-scaled EMs installed on BMW i3 BEV. In this case, the normalized maps of Kia Soul and YASA EMs are re-scaled with respect to the maximum power point of BMW i3 EM. Moreover, the working points on UDDS driving cycle are overlapped on the plot to demonstrate the working efficiency zones. The right column plots show the distribution of efficiency working points. The choice of UDDS driving cycle is determined by the availability in the literature of extensive experimental results in this driving cycle used for validation of the developed simulation models.
Figure 7 illustrates the simulation results for the UDDS cycle when the original characteristics of three EMs are used. Similar plots for the case when the EMs are installed on Kia Soul BEV are reported in Figure 8 and Figure 9. The EMs are re-scaled with respect to the maximum power point of Kia Soul EM.

4. Results

The distributions of efficiency points for the considered four cases are shown on the right columns of Figure 6, Figure 7, Figure 8 and Figure 9.
Figure 6 shows that, when the BMW i3 EM is used as a traction motor, the efficiency points have an even distribution in the range of values between 0.75 and 0.9 (Figure 6b). Simulation with the re-scaled Kia Soul EM results in distribution within a narrower range of 0.83–0.9 (Figure 6d), indicating that the same mechanical energy requirement is provided from the battery to wheels in a higher efficiency region. This range is wider and flat for the re-scaled YASA EM (0.65–0.0.92) as shown in Figure 6f. When the EM original characteristics are used, the working region of Kia Soul EM shifts towards higher efficiency ranges, while the remaining two have similar behavior. (Figure 7). Similarly, for the Kia Soul BEV, the highest efficiency region during its operation is reached while using its own EM. The working points of the other two motors are spread in wider efficiency ranges.
The data of experimental results for the BMW i3 2014 and the Kia Soul 2015, publicly available online [18] by Argonne National Laboratory, are used to validate the simulation results. Figure 10 shows the battery SOC variation over the UDDS drive cycle with different EMs installed on the BMW i3 BEV. The auxiliary power ( P a u x ) time history in the simulation is tuned such that the results of experiments and simulations with BMW i3 EM original characteristics overlap. In this way, all the un-modeled factors are included in the auxiliary loads. As shown in Figure 10, the solid blue line (BMW i3 exp) represents the experimental data overlaps with the dotted red line (BMW i3 sim) obtained during the simulation. The dash-dot yellow line (Kia Soul sim) is the result of simulation using the re-scaled Kia Soul EM, which has higher final SOC due to higher efficiency points during the operation. For the re-scaled YASA EM (YASA EM sim, dashed purple line), the consumption is slightly more with respect to others, hence the final SOC is lower.
Figure 10b shows the results of the simulation with the original characteristics of the considered motors. It shows that the energy consumption over the cycle decreases with the reduction of EM nominal power while following the required speed profile of the drive cycle. The Kia Soul EM with 81 kW power installed on the BMW i3 vehicle results in the lowest energy consumption. Figure 10c shows the speed profile of the UDDS drive cycle. The variation of traction torque requested from EM is depicted in Figure 10d. Figure 11 demonstrates similar results as Figure 10 for the case when all the considered EMs are installed on the Kia Soul electric vehicle.
The detailed results for battery state of charge for re-scaled and original motor characteristics are summarized in Table 4 and Table 5, respectively. As Table 4 shows, when motors with the same rated powers are used, due to the difference in the efficiency maps, the electricity consumption varies 8% for Kia Soul and 9.6% ( ± 4.8 % ) for BMW i3. Moreover, due to the differences in the EM maximum power and in the efficiency maps, the electricity consumption can vary 10% for Kia Soul and 20.6% (+11% and −9.6%) for BMW i3 (see Table 5). Hence, the influence of the electric motor size on the electricity can be assumed to be between 2–11%. This encourages the use of smaller power electric motors, which does not decrease the performance of the BEVs. Currently, their power is higher than the one required during the drive cycle [36].

5. Conclusions

The electric motor size (maximum motor power) and its efficiency map are the main factors that influence the overall electricity consumption of the electric vehicle. This paper is devoted to the quantitative assessment of this influence. To analyze the influence of the electric motor size and efficiency on electricity consumption, electric motors with various power and efficiency maps are required to be used. Due to the lack of a wide range of data on electric motors, the re-scaling of the parameters of available motors is performed. Obviously, this procedure might not carry physical meaning; however, it allows for understanding the sensitivity of the electricity consumption on such EM parameters. The results of the simulation revealed that, for the UDDS driving cycle, the influences of the efficiency map and the electric motor size can be around 8–10% and 2–11%, respectively. The overall difference in electricity consumption when both factors are taken into account can be around 10–21%. These values indicate the difference in electricity consumption of the BEVs with similar weight in real-world applications.

Author Contributions

Conceptualization, J.M., S.R., A.T., N.A. and A.M.; Data curation, J.M. and S.R.; Formal analysis, J.M. and S.R.; Investigation, J.M., S.R., A.T. and N.A.; Methodology, S.R. and A.T.; Resources, J.M. and S.R.; Software, J.M. and S.R.; Supervision, A.T., A.M. and N.A.; Validation, J.M., S.R. and A.M.; Writing—original draft, J.M.; Writing—review and editing, J.M., S.R., A.T., N.A. and A.M. All authors have read and agreed to the published version of the manuscript.

Funding

This research is the result of a long-term collaboration between the Mechatronics Lab and CARS Center of Politecnico di Torino (Italy), and Turin Polytechnic University in Tashkent (Uzbekistan).

Institutional Review Board Statement

Not applicable.

Data Availability Statement

Not applicable.

Conflicts of Interest

The authors declare no conflict of interest.

Abbreviations

The following abbreviations are used in this manuscript:
BEVBattery Electric Vehicle
UDDSUrban Dynamometer Driving Schedule
EMElectric Motor
SOCState of Charge
OCVOpen Circuit Voltage
INLIdaho National Laboratory

References

  1. Buberger, J.; Kersten, A.; Kuder, M.; Eckerle, R.; Weyh, T.; Thiringer, T. Total CO2-Equivalent Life-Cycle Emissions from Commercially Available Passenger Cars. Renew. Sustain. Energy Rev. 2022, 159, 112158. [Google Scholar] [CrossRef]
  2. EU Plotting Ban on Internal Combustion Engine as of 2025: Industry. Available online: https://www.eceee.org/all-news/news/eu-plotting-ban-on-internal-combustion-engine-as-of-2025-industry/ (accessed on 23 January 2023).
  3. Jiménez, D.; Hernández, S.; Fraile-Ardanuy, J.; Serrano, J.; Fernández, R.; Álvarez, F. Modelling the Effect of Driving Events on Electrical Vehicle Energy Consumption Using Inertial Sensors in Smartphones. Energies 2018, 11, 412. [Google Scholar] [CrossRef] [Green Version]
  4. Varga, B.; Sagoian, A.; Mariasiu, F. Prediction of Electric Vehicle Range: A Comprehensive Review of Current Issues and Challenges. Energies 2019, 12, 946. [Google Scholar] [CrossRef] [Green Version]
  5. Szumska, E.M.; Jurecki, R.S. Parameters Influencing on Electric Vehicle Range. Energies 2021, 14, 4821. [Google Scholar] [CrossRef]
  6. Vatanparvar, K.; Faezi, S.; Burago, I.; Levorato, M.; Al Faruque, M.A. Extended Range Electric Vehicle with Driving Behavior Estimation in Energy Management. IEEE Trans. Smart Grid 2019, 10, 2959–2968. [Google Scholar] [CrossRef]
  7. Xie, Y.; Li, Y.; Zhao, Z.; Dong, H.; Wang, S.; Liu, J.; Guan, J.; Duan, X. Microsimulation of Electric Vehicle Energy Consumption and Driving Range. Appl. Energy 2020, 267, 115081. [Google Scholar] [CrossRef]
  8. Chakraborty, S.; Kumar, N.M.; Jayakumar, A.; Dash, S.K.; Elangovan, D. Selected Aspects of Sustainable Mobility Reveals Implementable Approaches and Conceivable Actions. Sustainability 2021, 13, 12918. [Google Scholar] [CrossRef]
  9. Skuza, A.; Jurecki, R.S. Analysis of Factors Affecting the Energy Consumption of an EV Vehicle-a Literature Study. IOP Conf. Ser. Mater. Sci. Eng. 2022, 1247, 012001. [Google Scholar] [CrossRef]
  10. Mruzek, M.; Gajdáč, I.; Kučera, L.; Barta, D. Analysis of Parameters Influencing Electric Vehicle Range. Procedia Eng. 2016, 134, 165–174. [Google Scholar] [CrossRef] [Green Version]
  11. Koch, A.; Bürchner, T.; Herrmann, T.; Lienkamp, M. Eco-Driving for Different Electric Powertrain Topologies Considering Motor Efficiency. World Electr. Veh. J. 2021, 12, 6. [Google Scholar] [CrossRef]
  12. Pathak, A.; Sethuraman, G.; Krapf, S.; Ongel, A.; Lienkamp, M. Exploration of Optimal Powertrain Design Using Realistic Load Profiles. World Electr. Veh. J. 2019, 10, 56. [Google Scholar] [CrossRef] [Green Version]
  13. Yildirim, M.; Kurt, S. Effect of Different Types of Electric Drive Units on the Energy Consumption of Heavy Commercial Electric Vehicles. World Electr. Veh. J. 2022, 13, 92. [Google Scholar] [CrossRef]
  14. Puma-Benavides, D.S.; Izquierdo-Reyes, J.; Galluzzi, R.; Calderon-Najera, J.D.D. Influence of the Final Ratio on the Consumption of an Electric Vehicle under Conditions of Standardized Driving Cycles. Appl. Sci. 2021, 11, 11474. [Google Scholar] [CrossRef]
  15. Ramakrishnan, K.; Stipetic, S.; Gobbi, M.; Mastinu, G. Optimal Sizing of Traction Motors Using Scalable Electric Machine Model. IEEE Trans. Transp. Electrif. 2018, 4, 314–321. [Google Scholar] [CrossRef]
  16. Pastellides, S.; Gerber, S.; Wang, R.-J.; Kamper, M. Evaluation of Drive Cycle-Based Traction Motor Design Strategies Using Gradient Optimisation. Energies 2022, 15, 1095. [Google Scholar] [CrossRef]
  17. Stipetic, S.; Goss, J.; Zarko, D.; Popescu, M. Calculation of Efficiency Maps Using a Scalable Saturated Model of Synchronous Permanent Magnet Machines. IEEE Trans. Ind. Appl. 2018, 54, 4257–4267. [Google Scholar] [CrossRef]
  18. Downloadable Dynamometer Database of Transportation and Power Systems Division of Argonne National Laboratory. Available online: https://www.anl.gov/taps/downloadable-dynamometer-database (accessed on 23 January 2023).
  19. Guzzella, L.; Sciarretta, A. Vehicle Propulsion Systems; Springer: Berlin/Heidelberg, Germany, 2013. [Google Scholar] [CrossRef]
  20. Onori, S.; Serrao, L.; Rizzoni, G. Hybrid Electric Vehicles; Springer: London, UK, 2016. [Google Scholar] [CrossRef]
  21. D3 2014 BMW i3BEV. Available online: https://www.anl.gov/taps/d3-2014-bmw-i3bev (accessed on 23 January 2023).
  22. D3 2015 Kia Soul Electric. Available online: https://www.anl.gov/taps/d3-2015-kia-soul-electric (accessed on 23 January 2023).
  23. Chassis Dynamometer Testing Reference Document. Available online: https://anl.app.box.com/s/5tlld40tjhhhtoj2tg0n4y3fkwdbs4m3 (accessed on 23 January 2023).
  24. EPA Urban Dynamometer Driving Schedule (UDDS). Available online: https://www.epa.gov/emission-standards-referenceguide/epa-urban-dynamometer-driving-schedule-udds (accessed on 26 July 2022).
  25. EPA Highway Fuel Economy Test Cycle (HWFET). Available online: https://dieselnet.com/standards/cycles/hwfet.php (accessed on 26 July 2022).
  26. Supplemental Federal Test Procedure (SFTP)–US06. Available online: https://dieselnet.com/standards/cycles/ftpus06.php (accessed on 26 July 2022).
  27. Castellazzi, L.; Ruzimov, S.; Bonfitto, A.; Tonoli, A.; Amati, N. A Method for Battery Sizing in Parallel P4 Mild Hybrid Electric Vehicles. Sae Int. J. Electrified Veh. 2021, 11, 97–111. [Google Scholar] [CrossRef]
  28. Mavlonov, J.; Ruzimov, S.; Mukhitdinov, A. Modelling of Energy Consumption of the Battery Electric Vehicle. Acta Turin Polytech. Univ. Tashkent 2022, 31, 7–13. [Google Scholar]
  29. Yakhshilikova, G.; Ezemobi, E.; Ruzimov, S.; Tonoli, A. Battery Sizing for Mild P2 HEVs Considering the Battery Pack Thermal Limitations. Appl. Sci. 2021, 12, 226. [Google Scholar] [CrossRef]
  30. Miri, I.; Fotouhi, A.; Ewin, N. Electric Vehicle Energy Consumption Modelling and Estimation—A Case Study. Int. J. Energy Res. 2020, 45, 501–520. [Google Scholar] [CrossRef]
  31. Kia Soul EVchip-Range Extender and Regenerative Force Improvement. Available online: https://www.evmotion.eu/evchip/soulchip-range-extender-and-regenerative-force-improvement (accessed on 23 January 2023).
  32. YASA P400 R Series E-Motors. Available online: https://www.yasa.com/wp-content/uploads/2018/01/YASA_P400_Product_Sheet.pdf (accessed on 22 January 2023).
  33. Idaho National Laboratory, Advanced Vehicles, Library-By Vehicle. Available online: https://avt.inl.gov/content/pubs-vehicles.html (accessed on 23 January 2023).
  34. Battery Pack Laboratory Testing Results: 2015 Kia Soul. Available online: https://avt.inl.gov/sites/default/files/pdf/fsev/batterySoul1908.pdf (accessed on 23 January 2023).
  35. Battery Pack Laboratory Testing Results: 2014 BMW i3 EV. Available online: https://avt.inl.gov/sites/default/files/pdf/fsev/batteryi5486.pdf (accessed on 23 January 2023).
  36. Sanjarbek, R.; Mavlonov, J.; Mukhitdinov, A. Analysis of the Powertrain Component Size of Electrified Vehicles Commercially Available on the Market. Commun. Sci. Lett. Univ. Zilina 2022, 24, B74–B86. [Google Scholar] [CrossRef]
Figure 1. BEV model data flow for energy consumption computation.
Wevj 14 00036 g001
Figure 2. EM characteristics in motor mode. Original characteristics: (a) BMW i3; (c) Kia Soul; (e) YASA EM and normalized characteristics: (b) BMW i3; (d) Kia Soul; (f) YASA EM.
Wevj 14 00036 g002
Figure 3. Electric battery equivalent circuit model.
Wevj 14 00036 g003
Figure 4. Variation of battery cell parameters as functions of battery SOC [34,35]: (a) Open circuit voltage E; (b) R c h g ; and (c) R d c h g .
Wevj 14 00036 g004
Figure 5. Graphical representation of the re-scaling procedure of the motor maximum torque characteristics.
Wevj 14 00036 g005
Figure 6. Working points on the UDDS cycle with different EMs installed on BMW i3 BEV. Characteristics of EMs re-scaled to BMW i3 maximum power point (right column) and distribution of their efficiency working points (left column) for: BMW i3 EM (a,b); Kia Soul EM (c,d); YASA EM (e,f).
Wevj 14 00036 g006
Figure 7. Working points on the UDDS cycle with different EMs installed on BMW i3 BEV. EMs with original characteristics (right column) and distribution of their efficiency working points (left column) for: BMW i3 EM (a,b); Kia Soul EM (c,d); YASA EM (e,f).
Wevj 14 00036 g007
Figure 8. Working points during the UDDS cycle with different EMs installed on Kia Soul BEV. Re-scaled characteristics to Kia Soul and distribution of re-scaled EMs working points. Kia Soul EM (a,b); BMW i3 EM (c,d); YASA EM (e,f).
Wevj 14 00036 g008
Figure 9. Working points during the UDDS cycle with different EMs installed on Kia Soul BEV). Real characteristics to Kia Soul EM: (a) Kia Soul; (c) BMW i3; (e) YASA EM; and Distribution of real characteristics EMS working points: (b) Kia Soul; (d) BMW i3; (f) YASA EM.
Wevj 14 00036 g009
Figure 10. Variation of battery SOC during the UDDS driving cycle for different EMs installed on BMW i3: (a) with re-scaled characteristics of EMs; (b) with original characteristics of EMs; (c) vehicle speed profile variation over UDDS cycle; (d) EM Torque variation over the UDDS cycle.
Wevj 14 00036 g010
Figure 11. Variation of battery SOC during the UDDS driving cycle for different EMs installed on Kia Soul: (a) with re-scaled characteristics of EMs; (b) with original characteristics of EMs; (c) vehicle speed profile variation over the UDDS cycle; (d) EM torque variation over the UDDS cycle.
Wevj 14 00036 g011
Table 1. Technical specification of two considered BEVs [18,21,22].
Vehicle SpecificationsValue (BMW i3)Value (Kia Soul)Unit
Vehicle weight1443.31663.8kg
Frontal area2.382.418m 2
Aerodynamic drag coefficient0.30.3-
Motor operating range0–11,4700–10,360rpm
Max power125@ 477881@ 2715kW@rpm
Max torque250@ 0–3897285@ 0–2654Nm@rpm
Transmission typeSingle speed ATSingle speed AT-
Final gear ratio9.7:18.2:1-
Tire radius0.33 (150/60 R20)0.30 (205/60 R16)m
Battery typeLithium-ionLithium-ion-
Number of cells9696-
Nominal cell capacity6075Ah
Nominal cell voltage3.73.7V
Nominal battery pack voltage355.2355.2V
Nominal battery pack energy2227kWh
Table 2. Main parameters of EMs used in different commercial BEVs.
EMs P max , [kW]EM Speed ω em , Pmax at P max , [rpm]EM Torque T em , Pmax at P max , [Nm]
BMW i31254778250
Kia Soul812715285
YASA EM1604132372
Table 3. Combination of the electric motors used in the simulation.
Electric VehicleElectric Motors
BMW i3 EM originalBMW i3 EM original
BMW i3Kia Soul EM re-scaled to BMW i3 EMKia Soul EM original
YASA EM re-scaled to BMW i3 EMYASA EM original
Kia Soul EM originalKia Soul EM original
Kia SoulBMW i3 EM re-scaled to Kia Soul EMBMW i3 EM original
YASA EM re-scaled to Kia Soul EMYASA EM original
Table 4. SOC results for re-scaled EMs at different ambient temperatures.
BEVsEMs23 C−7 C35 C
SOC start ,
[%]
SOC end ,
[%]
Diff.exp
[%]
SOC start ,
[%]
SOC end ,
[%]
Diff.exp
[%]
SOC start ,
[%]
SOC end ,
[%]
Diff.exp
[%]
BMWBMW91.886.709177.4092.386.10
Kia91.886.9+3.99177.8+2.992.386.4+4.8
YASA91.886.5−3.99177.2−1.592.385.8−4.8
KiaKia37.529.5030.525.509588.50
BMW37.529.3−2.530.525.3−49588.2−4.6
YASA37.529.1−530.525.1−89587.9−8
Table 5. SOC results with original EMs at different ambient temperatures.
BEVsEMs23 C−7 C35 C
SOC start ,
[%]
SOC end ,
[%]
Diff.exp
[%]
SOC start ,
[%]
SOC end ,
[%]
Diff.exp
[%]
SOC start ,
[%]
SOC end ,
[%]
Diff.exp
[%]
BMWBMW91.886.709177.4092.386.10
Kia91.887.2+9.89178.1+5.192.386.8+11
YASA91.886.3−7.89177−2.992.385.5−9.6
KiaKia37.529.5030.525.509588.50
BMW37.529−6.2530.525.1−89588−7.7
YASA37.528.8−8.730.524.9−109587.7−10
Disclaimer/Publisher’s Note: The statements, opinions and data contained in all publications are solely those of the individual author(s) and contributor(s) and not of MDPI and/or the editor(s). MDPI and/or the editor(s) disclaim responsibility for any injury to people or property resulting from any ideas, methods, instructions or products referred to in the content.

