Analysis of Influencing Factors of Thermal Management System for LiFePO4 Lithium Battery under High Power Charging


State Key Laboratory of Automotive Safety and Energy, Tsinghua University, Beijing 100084, China
*
Author to whom correspondence should be addressed.
World Electr. Veh. J. 2020, 11(2), 44; https://doi.org/10.3390/wevj11020044
Submission received: 15 April 2020
/
Revised: 12 May 2020
/
Accepted: 26 May 2020
/
Published: 4 June 2020
(This article belongs to the Special Issue Fast Charging System for Electric Vehicles)
Abstract
:During the high-power charging process, the heat generated by the power battery is significantly increased, resulting in a significant temperature rise, which will bring safety hazards and worsens capacity degradation. In this study, we focus on the energy storage system composed of LiFePO4 pouch battery cells whose capacity is 30Ah. The coupling calculation between the one-dimensional electro-chemical model and the 3D heat generation model is realized. The accuracy of the model is verified by charging the battery at different rates. The results show that the inlet flow rate and the cooling channel size within a certain range has a great influence on the cooling effect of the battery pack during high power charging process. Comparing the temperature distribution of the battery pack under different charging rates, the electrochemical-heating coupling model established in this study can truly reflect the heat generation of the battery. Through the calculation of the heat generation of the battery pack, the boundary conditions of the cooling system design can be found, which provides a basis for the optimal design of the conditional cooling system for battery high-power charging.
1. Introduction
Electric vehicles are developing in the direction of large battery capacity and long cruising range. However, to shorten the charging time and slow down the user’s mileage anxiety, it is necessary to increase the charging power of the vehicle [1,2]. Increasing the charging factor will inevitably increase the temperature of the battery, accelerate the battery attenuation, and affect the battery life [3,4]. Due to the highly flammable substances used in lithium-ion batteries, an increase in battery temperature may cause thermal runaway, which also poses a challenge to the safety of the battery. The thermal management system of the power battery pack can effectively adjust the temperature rise of the power battery work, and avoid safety problems such as fire and explosion caused by heat accumulation of the power battery [5,6]. Ideally, appropriate thermal management system design will guarantee safe and reliable power battery pack operation [7,8].
When determining the cooling mode, it is usually necessary to establish a thermo-electric model of a battery for the thermal management system used for battery design and to optimize the design based on the model [9]. The thermo-electrochemical coupling model of a lithium-ion battery can couple the electric and thermal domains through the heat generated by the battery, which can accurately simulate the dynamic characteristics of the battery [10]. Wu, et al. [11] focused on the thermal problems in the actual operation of power batteries, studying a ternary polymer lithium-ion battery and establishing a lumped parameter model to analyze the thermal behavior of an electric bus under actual working conditions. Further, the quantitative relationship between the optimal heat transfer coefficient of a battery and the environmental temperature was studied. Panchal et al. [12] established a thermal model of a LiFePO4 battery to describe its thermal behavior and verified the model using experimental data. The temperature distributions of batteries were simulated and analyzed under different discharging rates and boundary conditions. Li et al. [13] established a thermo-electrochemical model of a prismatic lithium-ion battery and a battery box consisting of 14 single batteries and used a micro-channel to cool the battery box. The simulation results showed that the model is suitable for fast discharging of lithium-ion batteries. A thermo-electrochemical coupling model of a cylindrical LiFePO4 battery was established in [14], and the effects of the discharging rate, ambient temperature, and convective heat transfer coefficient on the discharge characteristics and heat production were discussed.
There are two main types of thermal management strategies for electric vehicles. Active cooling methods using air or liquid cooling and passive methods of phase change materials [15]. Air cooling can reduce the maximum temperature rise of the module, but under fast charge/high power operation and higher operating temperature, the uniformity of the battery module will become poor. Compared with air cooling, the cooling efficiency of liquid cooling is better, because the heat capacity of liquid is greater than that of air [16].
A number of numerical investigations have been performed on the liquid cooling of Li-ion batteries. In a study of liquid cooling, Deng et al. [17] designed a new type of leaf cooling channel and investigated the effects of different structural dimensions on the maximum temperature and temperature gradient of the battery pack. The influence of inlet flow on the cooling effect was also addressed, and the optimal structural size and inlet flow were selected. Reference [18] designed a liquid cooling system for lithium-ion batteries with a variable contact surface, where the width of the cooling plate determines the contact area. The results showed that increasing the inlet flow could effectively limit the maximum temperature but could not significantly improve the temperature uniformity. The battery temperature is inversely proportional to the width of the cooling plate. Wu et al. [19] systematically analyzed a liquid cooling system considering direct and indirect contact and discussed the progress made in the liquid channel structure and traditional fluids. Numerical analysis of the cooling plates of different internal flow channels was conducted in [20], and the effects of cavity, parallel, and serpentine channel structures on the flow characteristics of the coolant were compared. In addition, an orthogonal test and range analysis were employed to optimize the serpentine channel further and to improve the comprehensive performance. Ye et al. [21] took a LiFePO4 battery as the research object, designed a battery module with a radiator, and performed numerical verification, analyzing the effects of the cell gap, section size, and geometry of the cooling plate on the cooling effect. Tang et al. [22] proposed a multi-channel structure for liquid-cooled cylindrical lithium-ion batteries, conducted a three-dimensional transient simulation, and performed numerical optimization by changing the multi-channel structure and inlet flow. Panchal et al. [23] used the combination of an experiment and a simulation to compare the temperature and flow velocity of the micro-channel cooling plate of a prismatic lithium-ion battery under different discharging rates and initial working temperatures. The results showed that the discharging rate and initial working temperature were the main causes of the temperature increase of the cooling plate. To study phase change material cooling and heat pipe cooling, Reference [24] established a thermal management model based on phase change materials, taking into account the effects of the thermal conductivity, latent heat, and ambient temperature on the battery temperature. The results showed that with increasing latent heat of phase change materials, the battery temperature decreased gradually. In addition, lower thermal conductivity and higher ambient temperature could stabilize the battery temperature more effectively. Zheng et al. [25] proposed a thermal management system for batteries based on fast-charging liquid cooling combined with material cooling. The main heat dissipation method was determined to be liquid cooling. By analyzing the heat transfer mechanism of the thermal management system employed, the factors affecting the performance of the system were identified and the temperature performance of the thermal balance coefficient was quantified. Song et al. [26] connected 106 cylindrical batteries with a bottom cooling plate through a cooling plate, filled the gap in the cell with phase change materials, established a three-dimensional numerical cooling model, studied the effects of geometric parameters such as the cooling plate thickness and spacing between batteries on the cooling effect and compared the results with those obtained by material cooling with a single phase change and liquid cooling. It was found that the combination of the two cooling methods significantly reduced the battery temperature. Smith et al. [27] proposed a battery thermal management system based on heat pipe cooling, which consists of eight prismatic batteries, heat pipes, and cooling plates. The model simulation results showed that the heat pipe-based cooling system provided better temperature uniformity than traditional liquid cooling.
In summary, the power battery thermal management system plays an important role in the safe operation of electric vehicles. When designing the thermal management system, it can be combined with a model that truly reflects the heat generation of the power battery to determine the factors influencing the battery cooling system and aspects affecting the battery cooling system. It is important to establish rules and optimize the system design. With these objectives, the present study was focused on a 30 Ah pouch LiFePO4 lithium-ion battery as an energy storage device, using a liquid cooling thermal management system. Based on the established thermo-electric coupling model of the power battery, the influencing factors and laws of the cooling system were analyzed for different battery pack charging rates, considering the effects of the cooling channel inlet flow velocity and flow channel structure on the temperature rise of the battery. While looking for the channel and flow velocity boundary of the liquid cooling system in the high-power charging process, the cooling effect of the battery pack on the liquid cooling system under high-power charging conditions is evaluated. The results provide the basis for optimal design of battery thermal management systems.
2. Battery Pack Cooling System Structure and Working Principle
At present, liquid cooling has been applied more often than other cooling methods in practical electric vehicle thermal management systems due to its effectiveness [28]. In this study, the battery cooling system employed in [12] was taken as a reference structure and a 30 Ah pouch lithium-ion battery pack, whose structure is shown in Figure 1, was used as the research object.
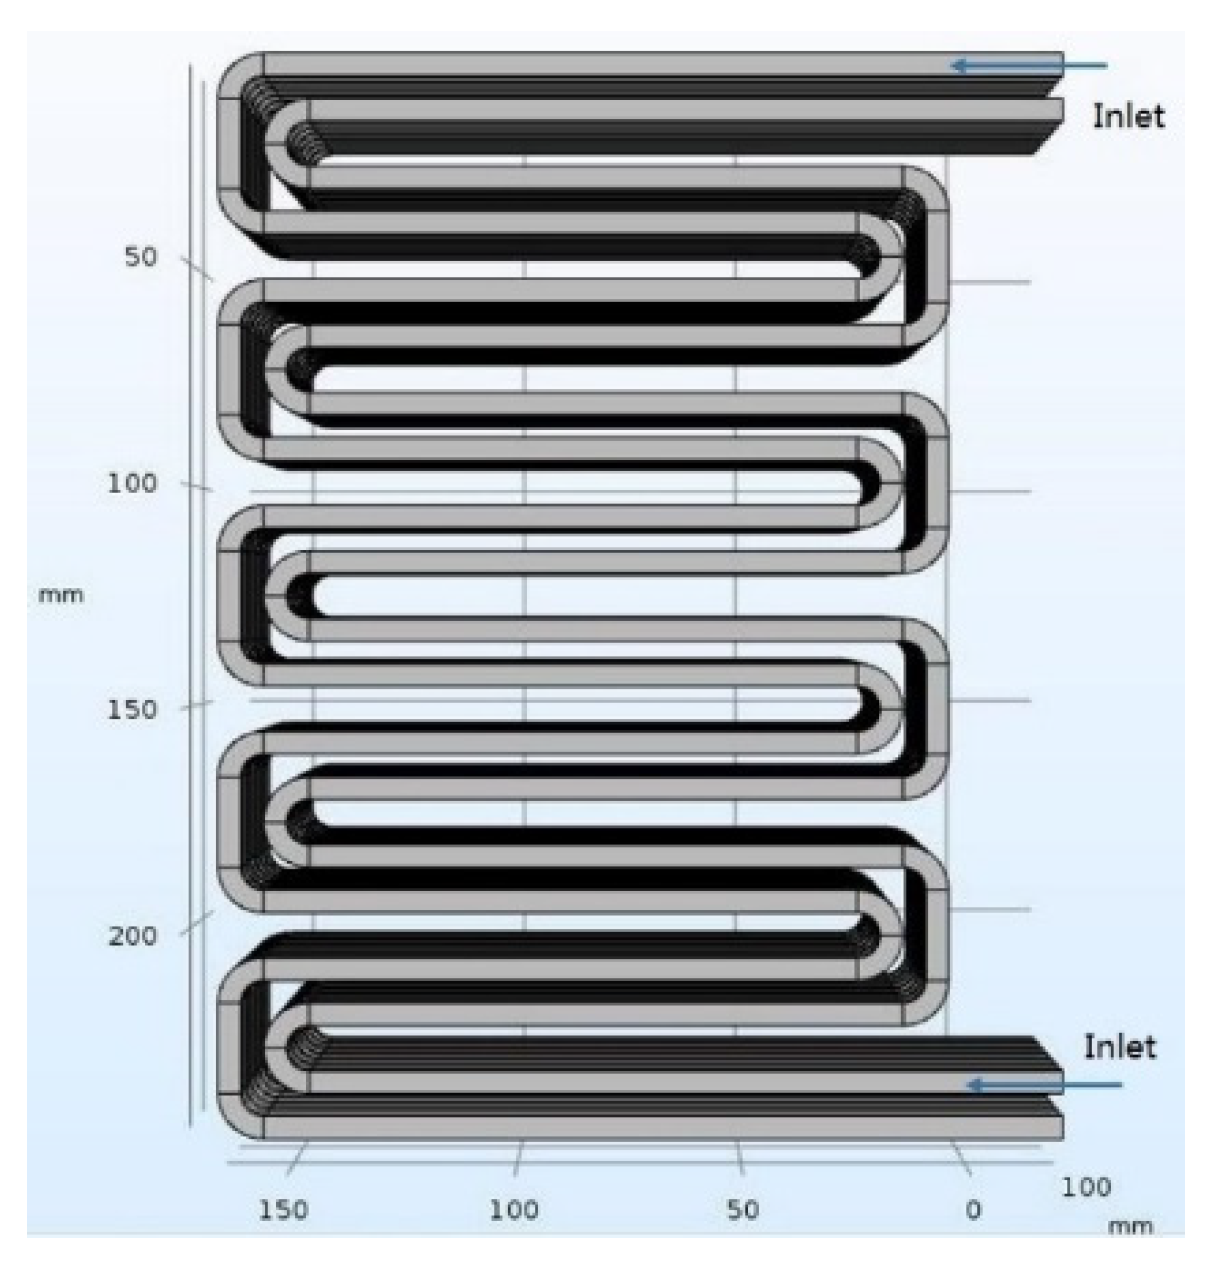
As can be seen from Figure 1, the battery pack is composed of eight single cells, and each cell has dimensions of 250 mm × 10 mm × 170 mm. There is a cooling plate between each pair of adjacent cells, the thickness of the cooling plate is fixed at 10 mm, covering the surface of the battery. Two cooling channels are embedded in each of the cooling plates, and the width of the serpentine channel can be adjusted within the thickness of the cooling plate. The cooling channel structure is shown in Figure 2. The cooling plate can increase the contact area between the cooling channel and the surface of the battery, thereby increasing the amount of heat dissipation, improving the cooling effect, and also protecting the cooling channel.
To avoid the problem of an uneven battery temperature distribution in the cooling channel in a single direction, the two cooling channels are opposite in direction, and the coolant flows correspondingly. In addition, the cooling channels in each layer of cooling plates are not independent, and each inlet and outlet have a main pipe connection to ensure the inflow and outflow of the coolant. Due to the limited calculation level in the simulation, it was necessary to simplify the complex geometric models. While ensuring the accuracy of the simulation results, ignoring accessories such as thermistors and wires inside the actual battery pack can effectively reduce the simulation time. Because these components have little effect on the simulated flow field, they also have little effect on the temperature distribution of the battery pack and the temperature of the cooling channel in the cooling plate.
In this study, the initial dimensions of the cooling channel were 5 mm × 4 mm. As the cooling effect of the battery pack is related to factors such as the cooling channel size and inlet flow velocity, the factors affecting the cooling of the battery pack were investigated under different charging rates by changing the cooling channel size and inlet flow velocity of the battery pack.
3. Power Battery Thermo-Electrochemical Model
Due to the complexity of the internal components and structure of the lithium-ion battery and there being many electrochemical reactions inside, it is not only time-consuming and laborious to simply use the experimental method, but also difficult to obtain the real-time electrochemical characteristics of the lithium-ion battery during the charge and discharge process. The heat production of lithium batteries is closely related to the electrochemical characteristics, and the internal temperature changes will also affect the electrochemical characteristics of power batteries. The electrochemical-thermal coupling model also considers the material conservation, charge conservation, electrode reaction kinetics, and energy conservation in the lithium ion battery, which can more accurately describe the internal electric field and temperature distribution of the lithium-ion battery.
3.1. One-Dimensional Electrochemical Model
At present, electrochemical models are generally improved by employing the Doyle Fuller Newman (DFN) model [29]. The electrochemical model in this study was established based on the DFN model using 3D simulation software of COMSOL Multi-physics 5. The battery geometrical and design parameters, as well as kinetic, transport, and thermal properties are listed in Table 1. The initial state of charge (SOC) of the battery is defined as the ratio of the current actual lithium-ion concentration to the maximum lithium-ion concentration [30]:
where C1,0 is the current lithium-ion concentration in the active material, and C1,max is the maximum lithium-ion concentration.
The initial voltage of the battery Ecell,0 can be calculated using the open circuit potentials (OCPs) of the positive and negative active materials [30]:
where Ep,OCP and En,OCP are the open circuit potentials of the positive and negative active materials, respectively, and have functional relationships with the positive and negative SOCs.
The solid phase charge balance can be defined as follows [30,31]:
where κ is the conductivity of the ion, Sa is the specific surface area, jloc is the local current density, γ is the Bruggeman factor, ε is the electrode volume fraction, and φi is the electron potential. The liquid phase charge balance can be defined as follows [30,31]:
where f is the average molar activity coefficient, ci is the lithium-ion concentration, t+ is the lithium-ion transfer number, and F is the Faraday constant.
The lithium-ion species balance in the intercalated particles in the active electrode material is by Fick’s second law, and the solid phase material balance can be defined as follows [30,31]:
Meanwhile, the liquid-phase material balance can be defined as follows [30,31]:
where y is the dimensionless radial distance of the particle (y = r/rp), and D is the diffusion coefficient.
The local current density is given by the Bulter-Volumer equation [30,31]:
where η is the reaction activation over-potential, j0 is the migration current density, αc and αa are the positive and negative current transfer coefficients, respectively, and β is the reaction rate constant. The reaction rate constant of the positive and negative electrode charging process is modified by the Arrhenius formula, expressed as follows:
where βn is the negative electrode active material lithium ion reaction rate constant, βp is the cathode active material lithium ion reaction rate constant, Iapp represents the charge-discharge current density of the lithium-ion battery, and I1c is the charge and discharge current density of the lithium battery loaded at a rate of 1C.
In Equations (3)–(15), the subscript 0 represents the initial or equilibrium state, and 1 and 2 represent the solid and liquid phases, respectively, of the active substance.
If the length of the one-dimensional lithium-ion battery model is L, the voltage Up of the lithium-ion battery terminal is the potential difference between the two terminals:
The parameters such as specific surface area Sa, local current density jloc, and terminal voltage Up in the one-dimensional electrochemical model were substituted into a three-dimensional thermal model to calculate the heat generation Q of the battery.
3.2. Three-Dimensional Thermal Model
After the parameters used to calculate the heat generation of the battery are calculated using the one-dimensional electrochemical model, the heat generation of the battery can be calculated from the three-dimensional thermal model. The parameters of the three-dimensional battery thermal model are shown in Table 2. In the process of charging and discharging the battery, the internal energy variation of the battery is equal to the difference between the heat generation and heat dissipation of the battery, and the internal energy satisfies the conservation equation [31]:
where Qc is the heat dissipation rate of the battery, which mainly includes liquid cooling and heat transfer with air. The calculation formula of convection heat transfer on the surface of lithium ion batteries is based on Newton’s cooling formula:
where h is the heat transfer coefficient (unit: W/m2K), T is the battery temperature, and Tout is the ambient temperature.
The thermal conductivity k, the active material density ρbatt, and the heat capacity Cp,batt in Equation (14) can be obtained from Equations (19)–(23), respectively, wherein the internal thermal conductivity of the battery is anisotropic. The thermal conductivity can be determined for the x, y, and z directions using Equations (19)–(21), respectively [31]:
where Li is the thickness of each layer of the unit cell, and kT,i is the thermal conductivity of each layer of material.
ρbatt and Cp,batt can be obtained using Equations (22) and (23), respectively:
The heat production Q of the battery includes the heat produced by the active material Qact, chemical reaction heat Qrea, and Ohmic heat Qohm, which are given using Equations (24)–(26), respectively:
where I is the current, U0 is the open-circuit voltage (OCV), U is the battery operating voltage, and R is the total internal resistance of the battery (including the Ohmic resistance and polarization resistance). Q can then be obtained using Equation (27):
The model established in this study includes the mutual coupling among the lithium-ion battery, laminar flow, and heat transfer modules. The one-dimensional electrochemical model can be used to calculate the battery terminal voltage Up and other related parameters, which are then input into the three-dimensional model to calculate the heat production Q of the lithium-ion battery during the charging process. Simultaneously, the three-dimensional thermal model feeds the battery temperature T back to the one-dimensional electrochemical model. The battery temperature affects the electrode reaction rate constant β in the one-dimensional electrochemical model, enabling Q to be calculated more accurately. To improve the simulation efficiency, a laminar module is firstly employed to calculate the steady-state coolant flow at constant temperature, under the premise of ensuring the accuracy of the simulation results. On this basis, the lithium-ion battery module is used to determine the temperature change of the lithium-ion battery during the charging process. Finally, the heat transfer module is utilized to solve the battery pack temperature, and the temperature distribution of the battery pack is obtained.
3.3. Lithium Battery Electrochemical-Thermal Coupling Model
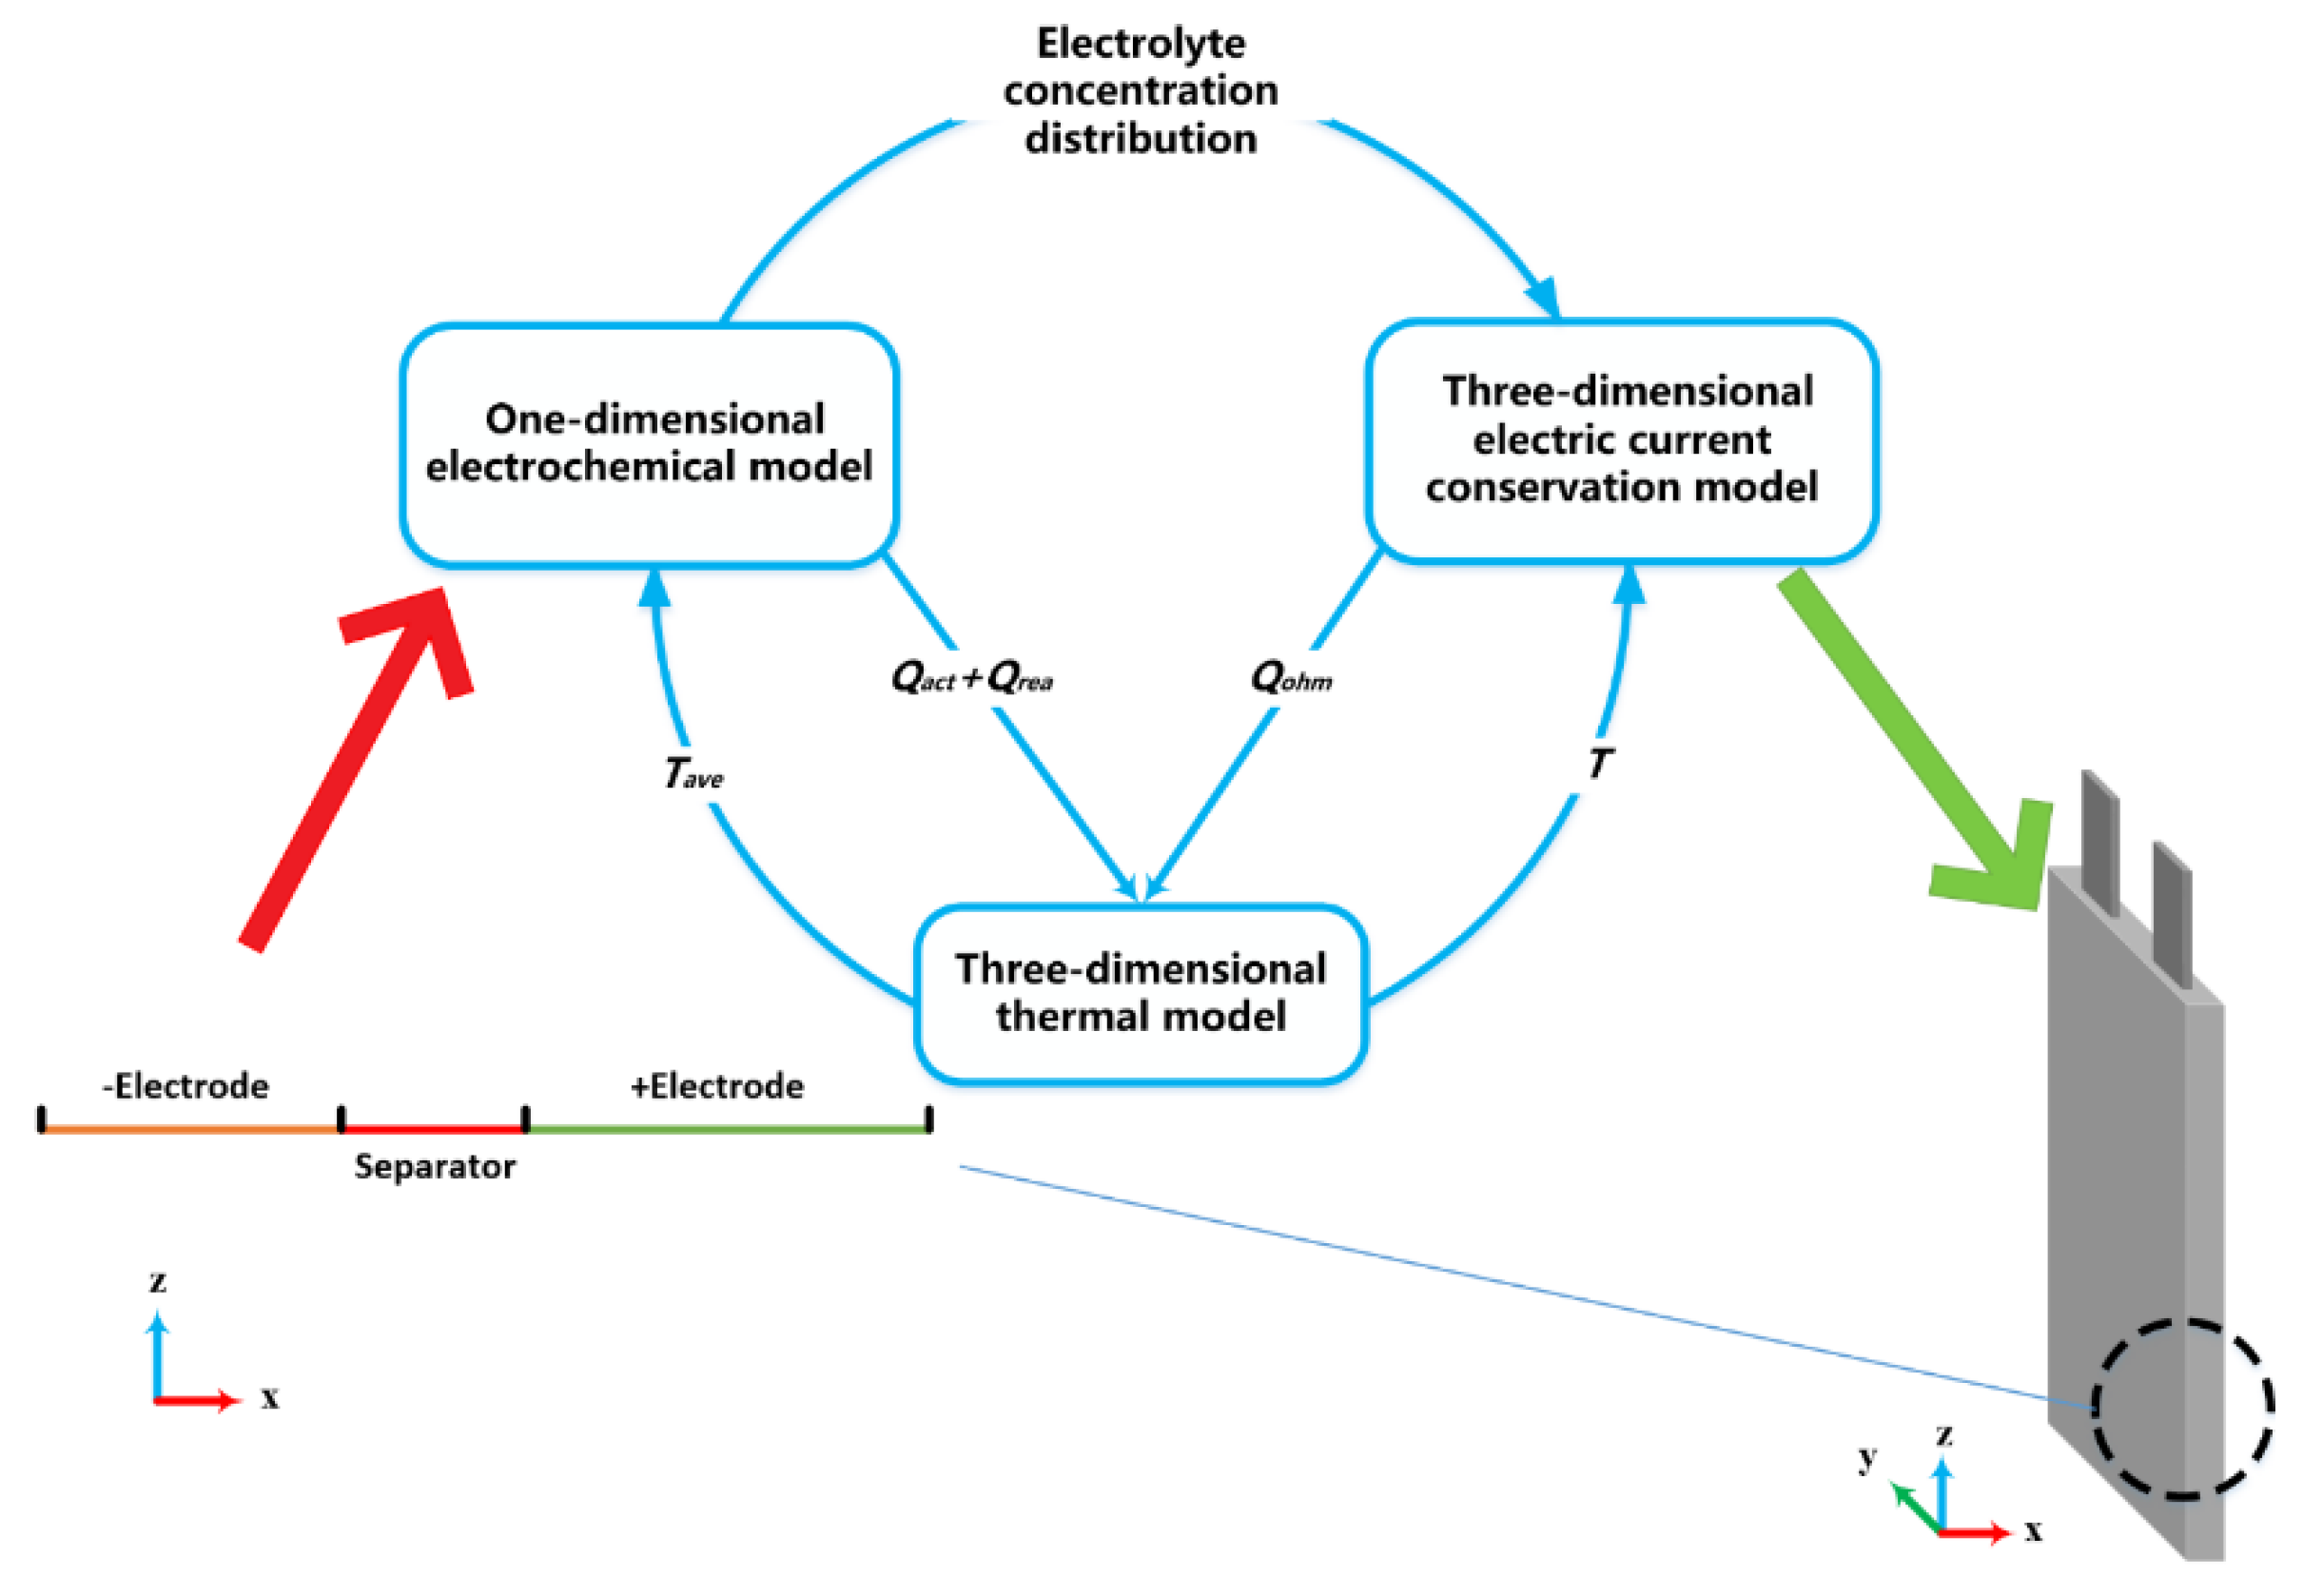
The electrochemical performance of lithium-ion batteries is closely related to the heat production characteristics. The heat production power of the battery is obtained from the electrochemical characteristic parameters. At the same time, the battery temperature directly affects the electrochemical reaction inside the battery, thereby affecting its electrochemical characteristics. Figure 3 shows a schematic diagram of a lithium battery electrochemical-thermal coupling model.
By solving the control equation of the one-dimensional electrochemical model, the parameters of the solid-phase lithium ion concentration, the liquid-phase lithium ion concentration, the solid-phase potential, the liquid-phase potential, the lithium-ion diffusion flux, and the over-potential of the solid-liquid reaction interface are obtained. It is used to calculate the reaction heat in the active electrode material, the heat of the active material, and the concentration distribution of the electrolyte. The values of concentration are inserted in a 3D electric current conservation solver to calculate the distributed Ohmic heat generation. In the one-dimensional electrochemical model of lithium-ion batteries, the reaction rate and local current density are affected by temperature. The 3D energy conservation equation is used to calculate the temperature distribution of the battery and the temperature is fed back to the one-dimensional model to realize the coupled solution of the two models
3.4. Measurement of Thermal-Electrical Parameters of Batteries
To verify the authenticity of the proposed thermo-electric coupling model of the power battery, an experiment was performed to test the thermo-electric performance of the power battery, including identification of the basic parameters of the battery, for comparison with the built-in thermo-electric coupling model. In the experiment, the battery test system and high-low temperature alternating damp-heat test chamber were the main test tools. Selected basic parameters of the 30 Ah LiFePO4 battery are shown in Table 3.
Figure 4 and Figure 5 show the experimental test platform for the battery and the 30 Ah pouch LiFePO4 lithium-ion battery itself, respectively. The relevant equipment parameters are summarized in Table 4.
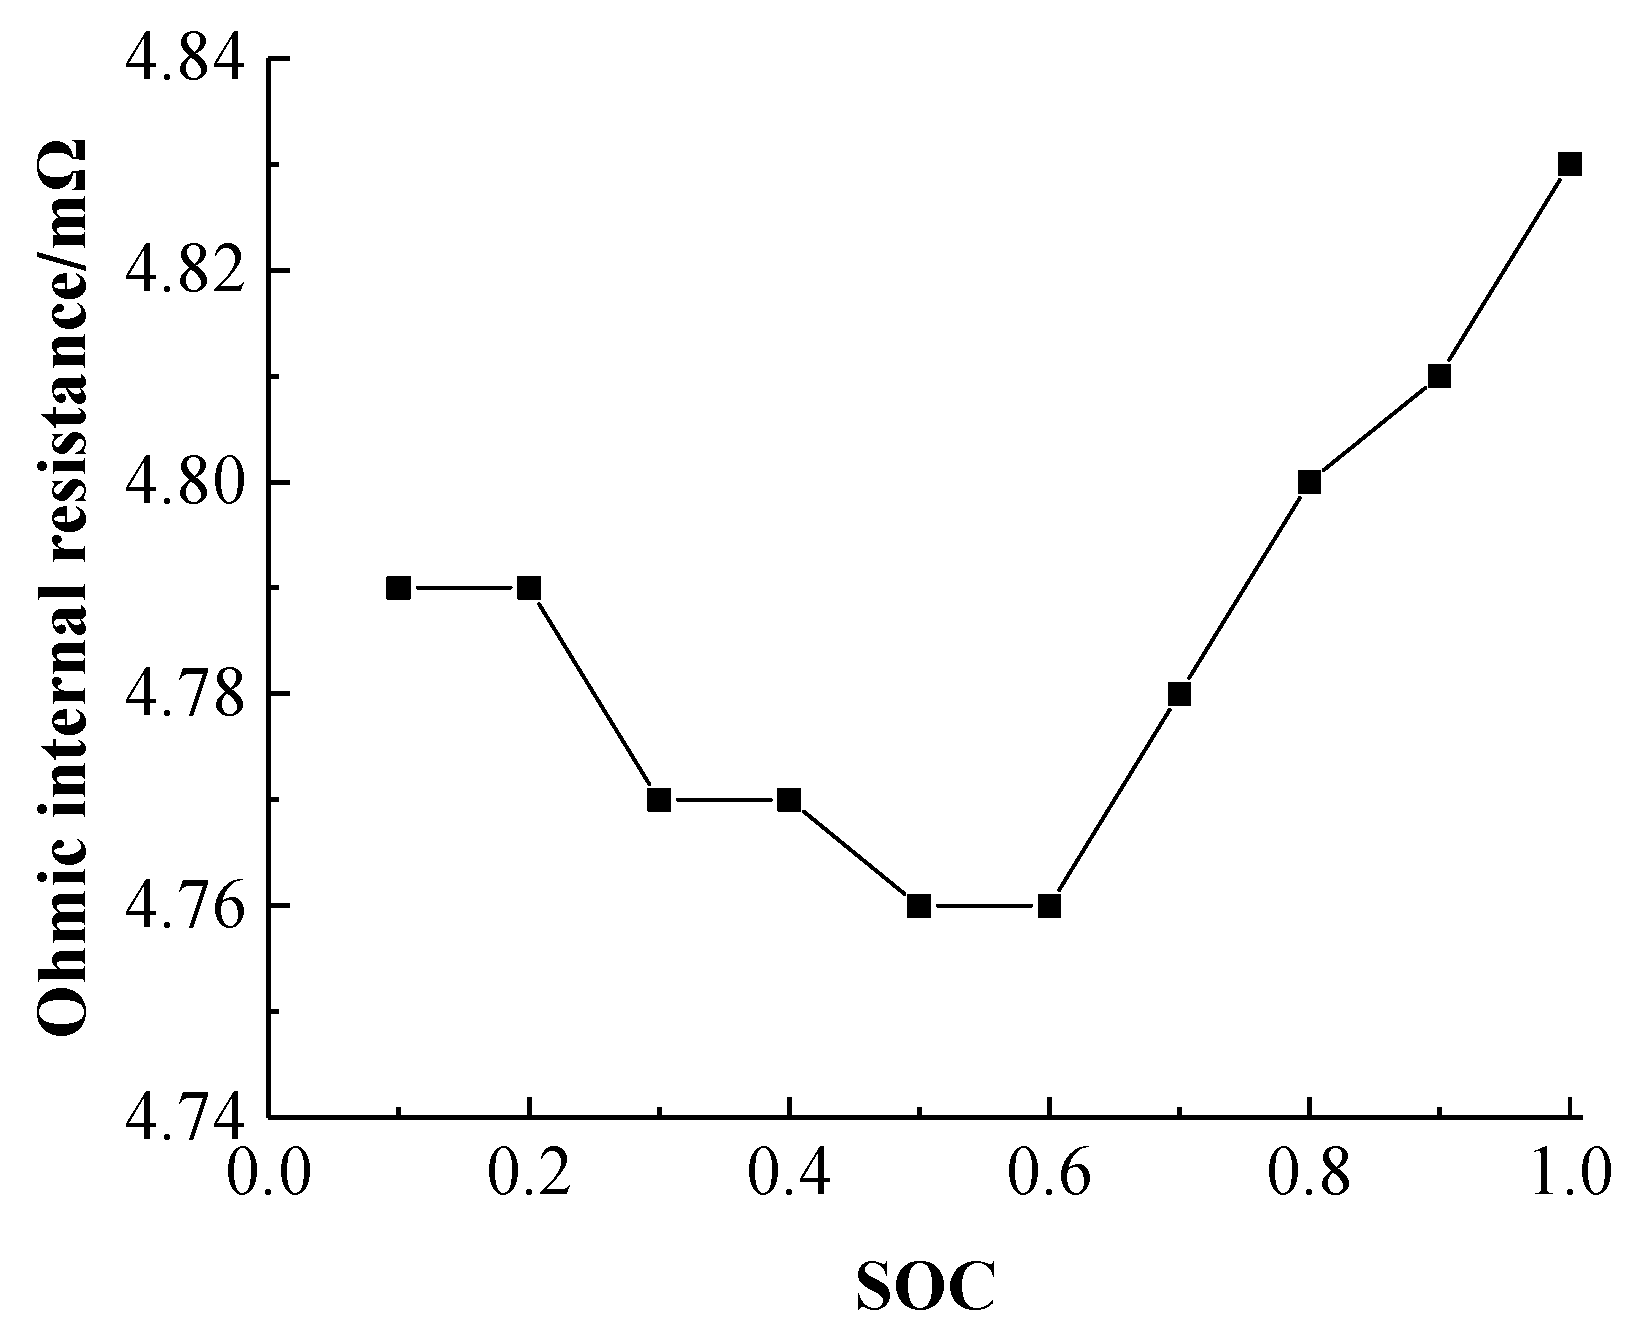
The actual capacity of the battery is an important indicator. In this study, the battery was tested at a constant temperature of 25 °C. The battery performed three charge-discharge cycles at a current of 0.3 C, and the actual battery capacity was found to be 32.37 Ah. A hybrid pulse power characteristic test was performed on the battery, and the internal resistance of the battery during charging and discharging was calculated, thereby enabling the Ohmic resistance heat generation of the battery to be determined according to Equation (23). Figure 6 shows the internal resistance of the battery during charging as a function of the SOC.
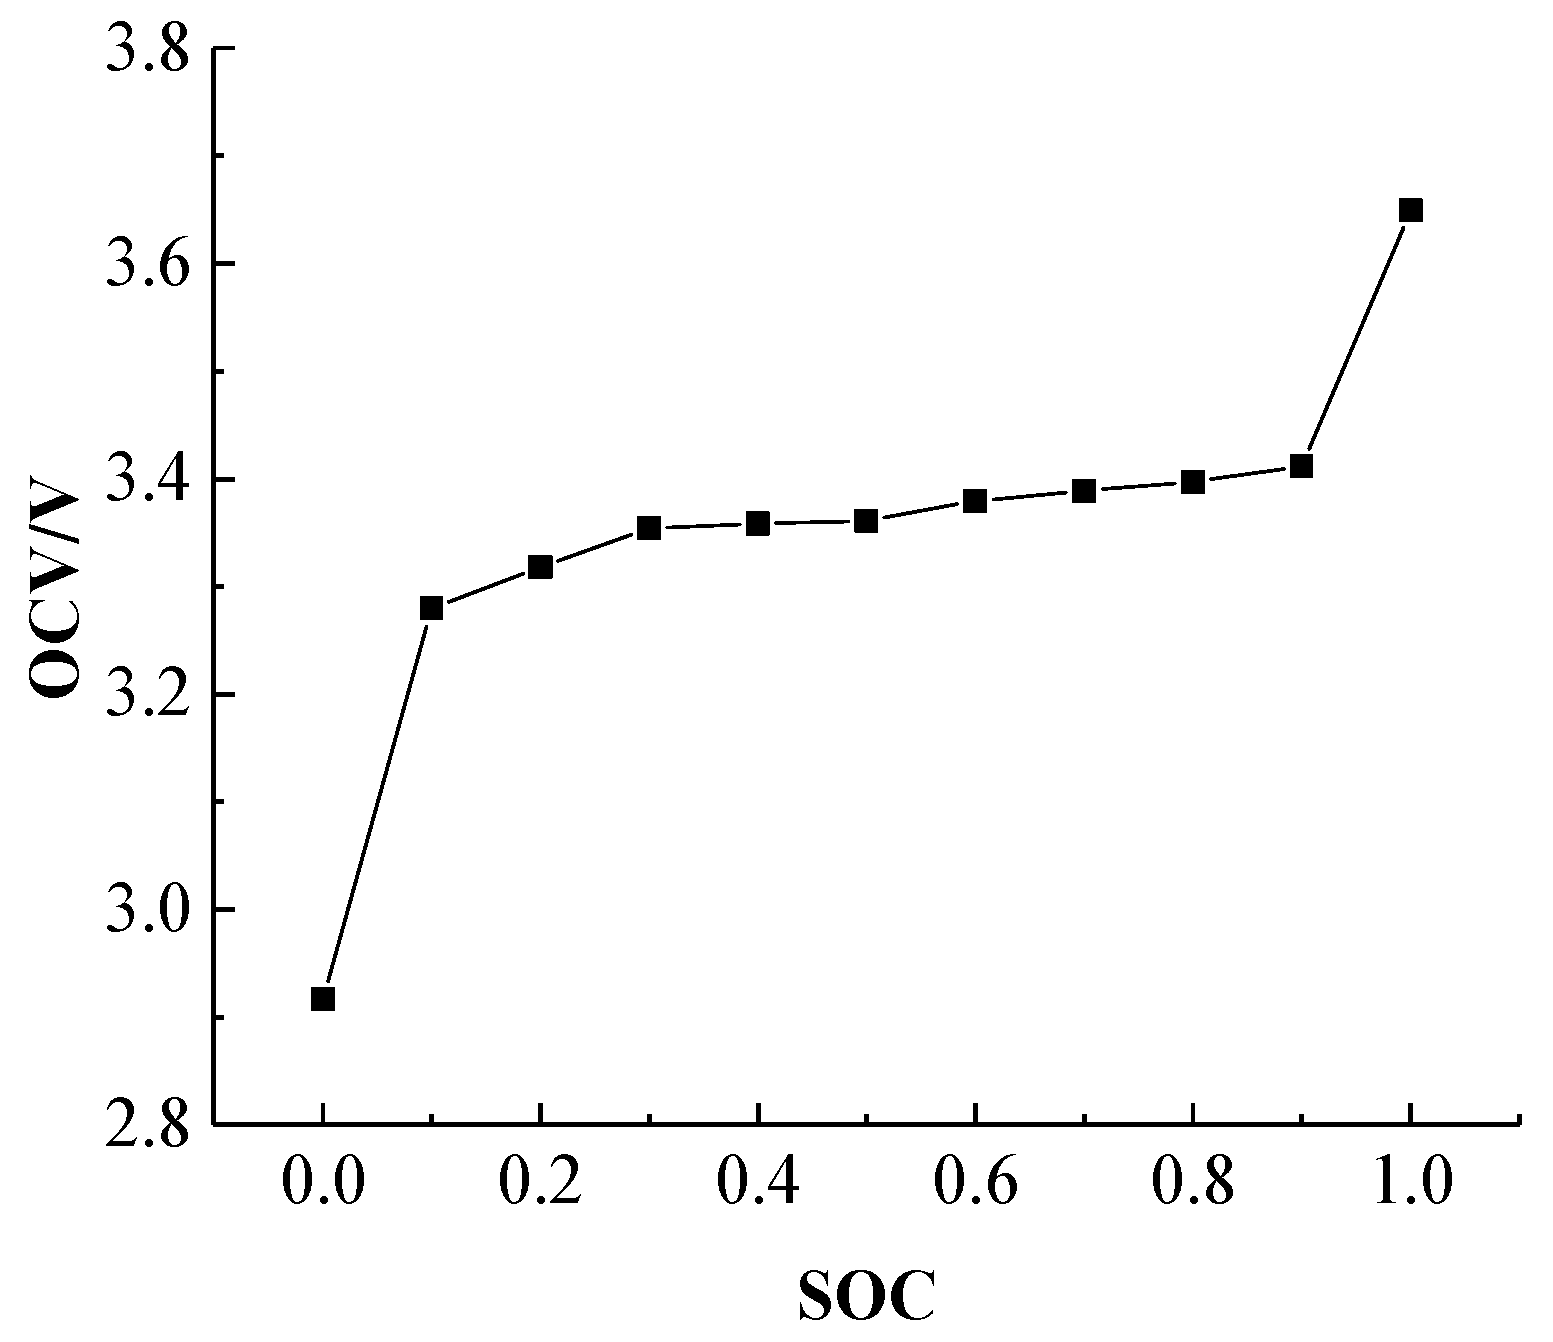
According to Equation (22), the entropy thermal coefficient of the battery needs to be calculated for the chemical reaction of the battery. Therefore, in order to determine the entropy thermal coefficient of the power battery, the OCV was measured with respect to the SOC at different temperatures. Figure 7 presents the battery OCV versus SOC curve at 25 °C, and it can be observed the OCV platform exists when the SOC is between 0.1 and 0.9.
Generally, the entropy thermal coefficient ∂Ui/∂T of the battery is usually different in different SOCs, so it is necessary to determine the entropy thermal coefficient ∂Ui/∂T of the battery in different SOCs. The battery is charged to a specific SOC, and the battery is subjected to a thermal cycle experiment, which is repeated for different SOCs. Using the linear fitting of OCV with temperature change, the ∂Ui/∂T value of the battery under different SOC is obtained shown as Figure 8, and the chemical reaction heat of the battery can be calculated by using Equation (22).
3.5. Thermo-Electric Coupling Model Verification
To validate the thermo-electric coupling model, the temperature of the thermostat was set to 25 °C. After the temperature was balanced in the thermostat, the batteries were placed in the thermostat and were discharged to the discharge cut-off voltage at a low rate. When the temperature of the batteries had been constant for 3 h, the batteries were charged to the charge cut-off voltage at rates of 0.5 C, 1 C, and 2 C. In order to ensure the safety of battery charging and avoid excessive battery voltage, when the battery voltage reaches the upper limit cut-off voltage, the battery will stop charging. During the charging process, the temperature of the battery is recorded in real time using a thermocouple. The experimental temperature rise of the battery under three different charging rates was recorded using a thermal imager. The final temperature distribution of the battery is shown in Figure 9. The overall temperature of the battery gradually increases with the increase of the charging rate. Figure 10 shows the simulation of battery temperature rise under three charging rates. The battery center positive and negative temperature are consistent with the experimental temperature distribution.
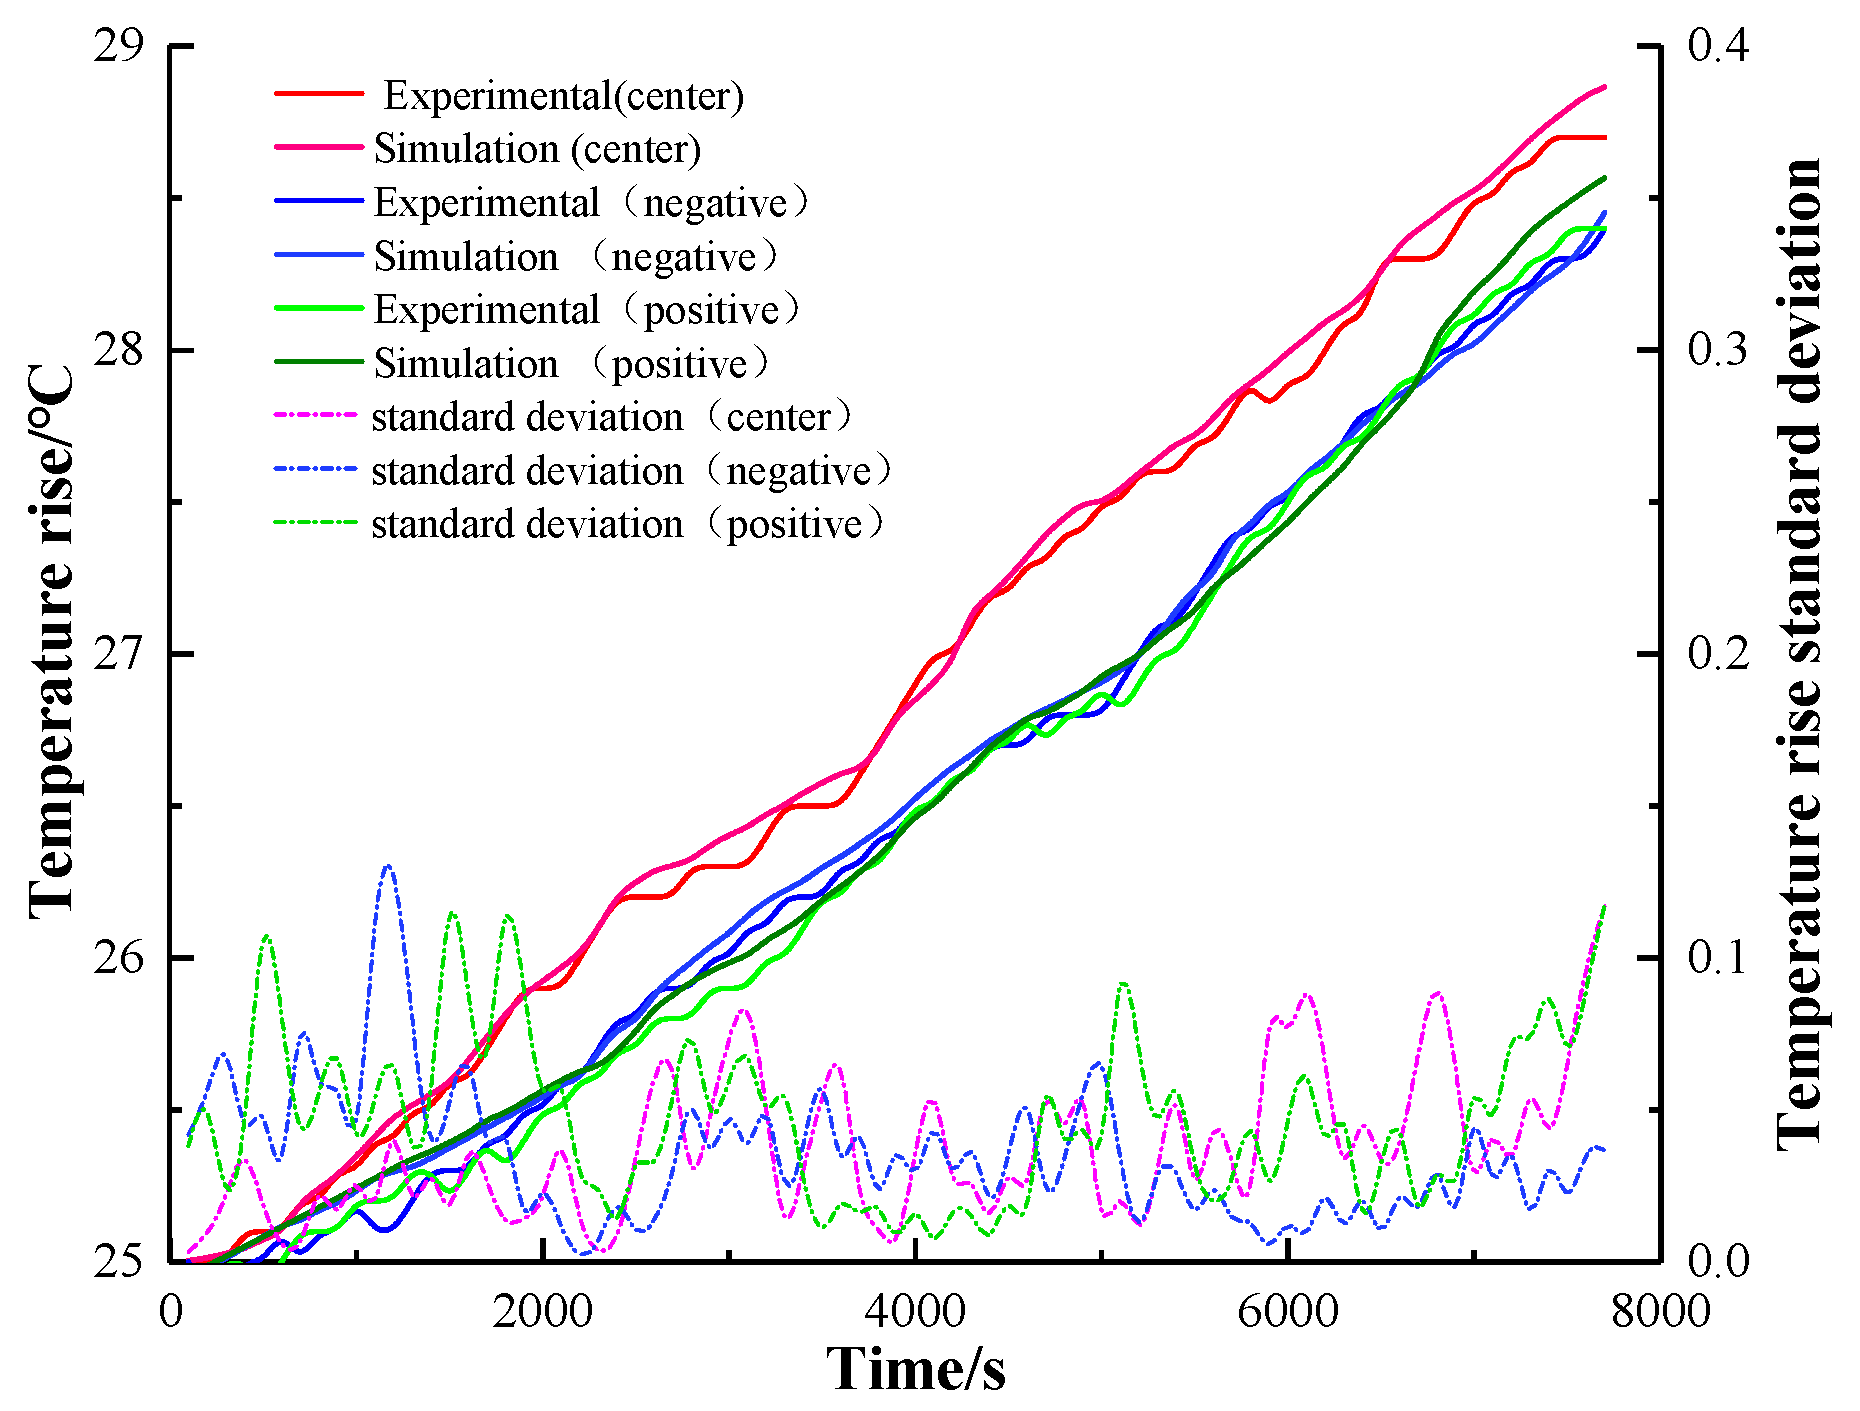
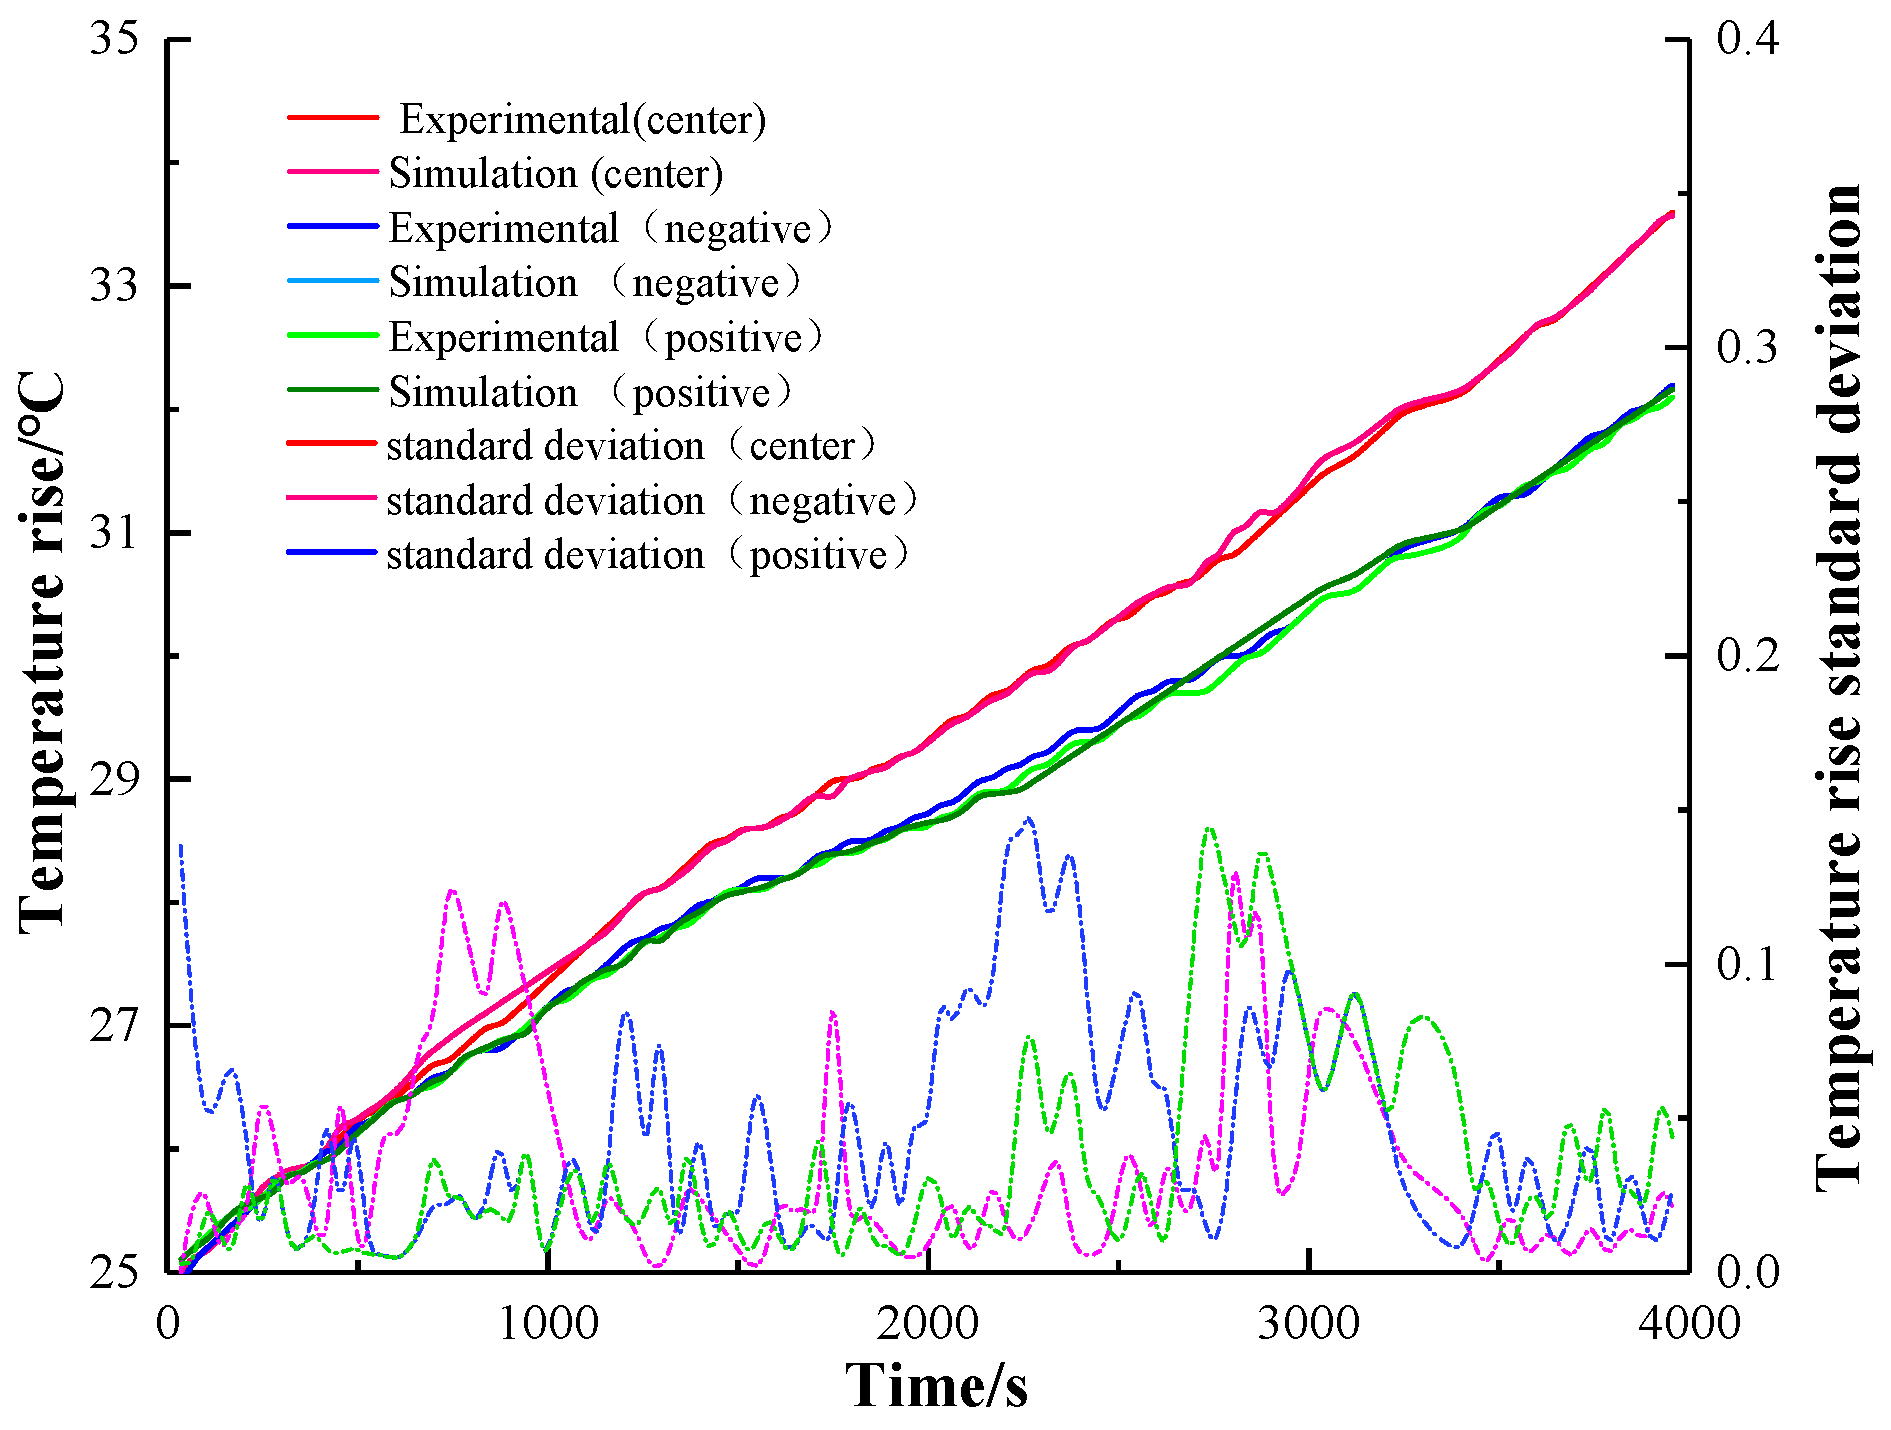
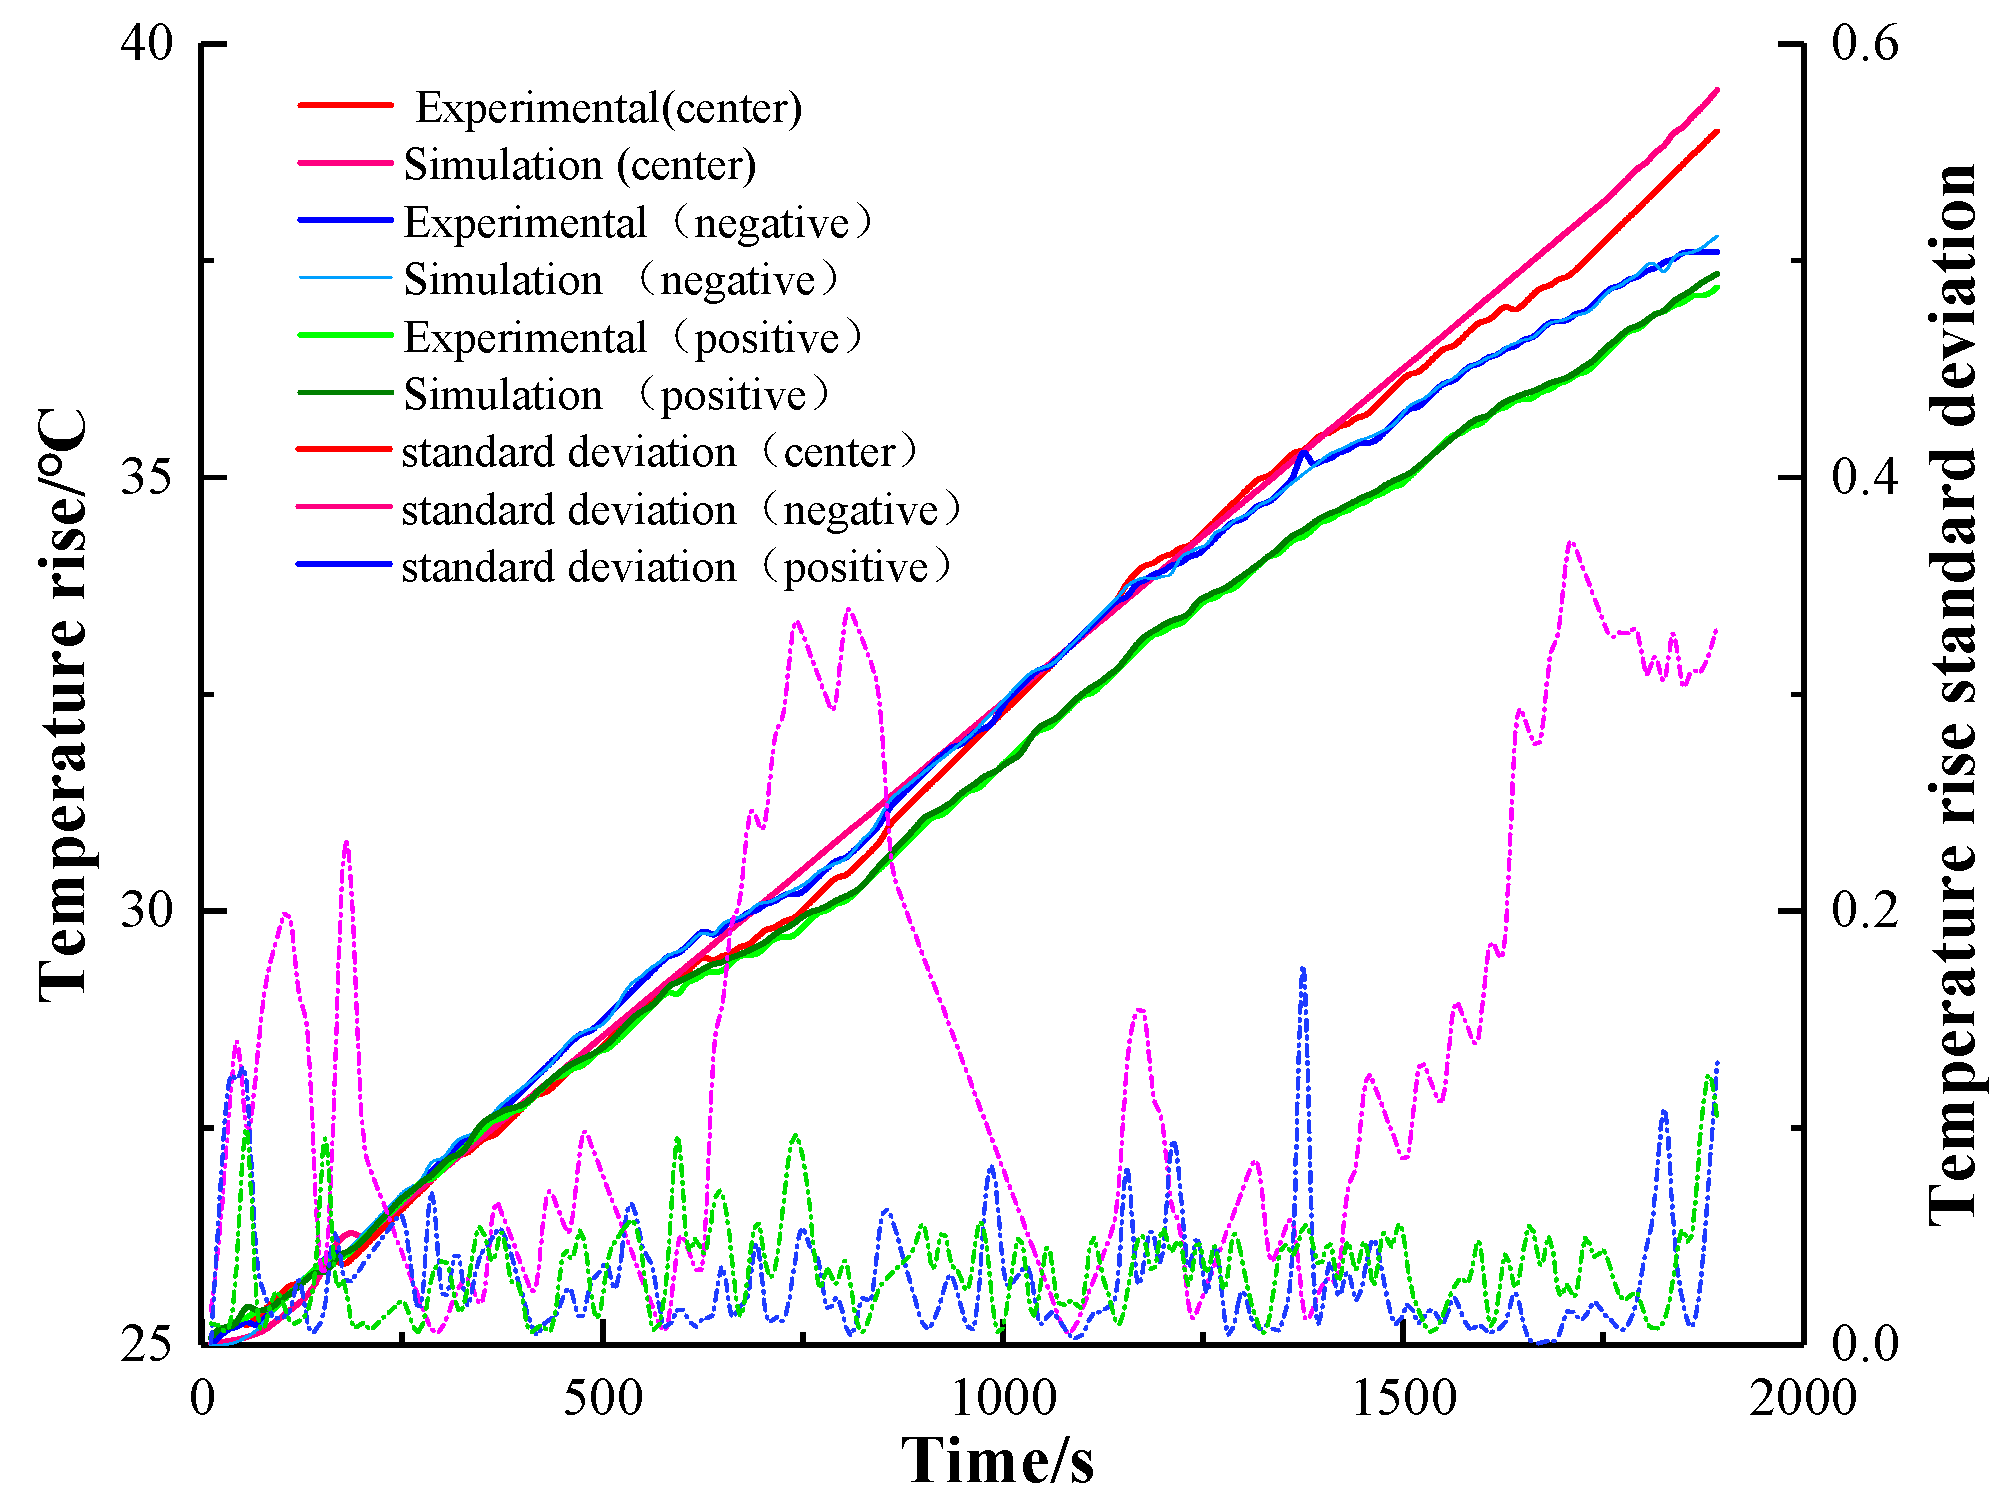
Under the 0.5 C, 1 C, and 2 C charging experiments, the temperature rise curve of the three points and the simulated temperature rise curve were analyzed and processed, and the results are shown in Figure 11, Figure 12 and Figure 13. The degree standard deviation indicates the degree of dispersion between the simulated temperature and the experimental temperature, which can reflect the inconsistency between the experimental temperature and the simulated temperature. The results of infrared imaging and numerical differences can be explained by a variety of factors. The electrochemical and thermal parameters of the battery are not obtained from experimental measurements but from literature searches. During the construction of the simulation model, we adopted the assumption of a uniform electrochemical reaction. Due to the limitation of manufacturing conditions, it is difficult to obtain the ideal active substance distribution, and the battery may be affected by the ambient temperature during charging. From the standard deviation of temperature, the standard deviation of three different magnifications is less than 0.4, which can accurately reflect the temperature rise of the actual charge and discharge of the battery and verify the accuracy of the thermal-electrochemical model of the battery established in this paper [32].
4. Analysis of Simulation Results
Based on the model of the battery cell, a model of battery module was built and a liquid cooling structure was added. The standard charge and discharge current of the battery is 0.3 C, and the charge rates studied in this study are 0.5 C, 1 C, and 2 C, respectively. Firstly, the temperature distribution of the battery pack without cooling at 25 °C was simulated, and then the influence of coolant flow rate and cooling channel size on the temperature rise and temperature distribution of the battery was analyzed.
4.1. Temperature Distribution without Cooling
In order to determine the effect of the liquid cooling system on the temperature distribution of the battery pack, the battery pack was first simulated without cooling. The battery pack cooling channel size is 5 mm × 8 mm, the ambient temperature is set to 25 °C, and the convective heat transfer coefficient h = 7.71 W/m2K [33] is simulated at three different charging rates. The battery pack temperature distribution is shown in Figure 14.
4.2. Flow Velocity Effect
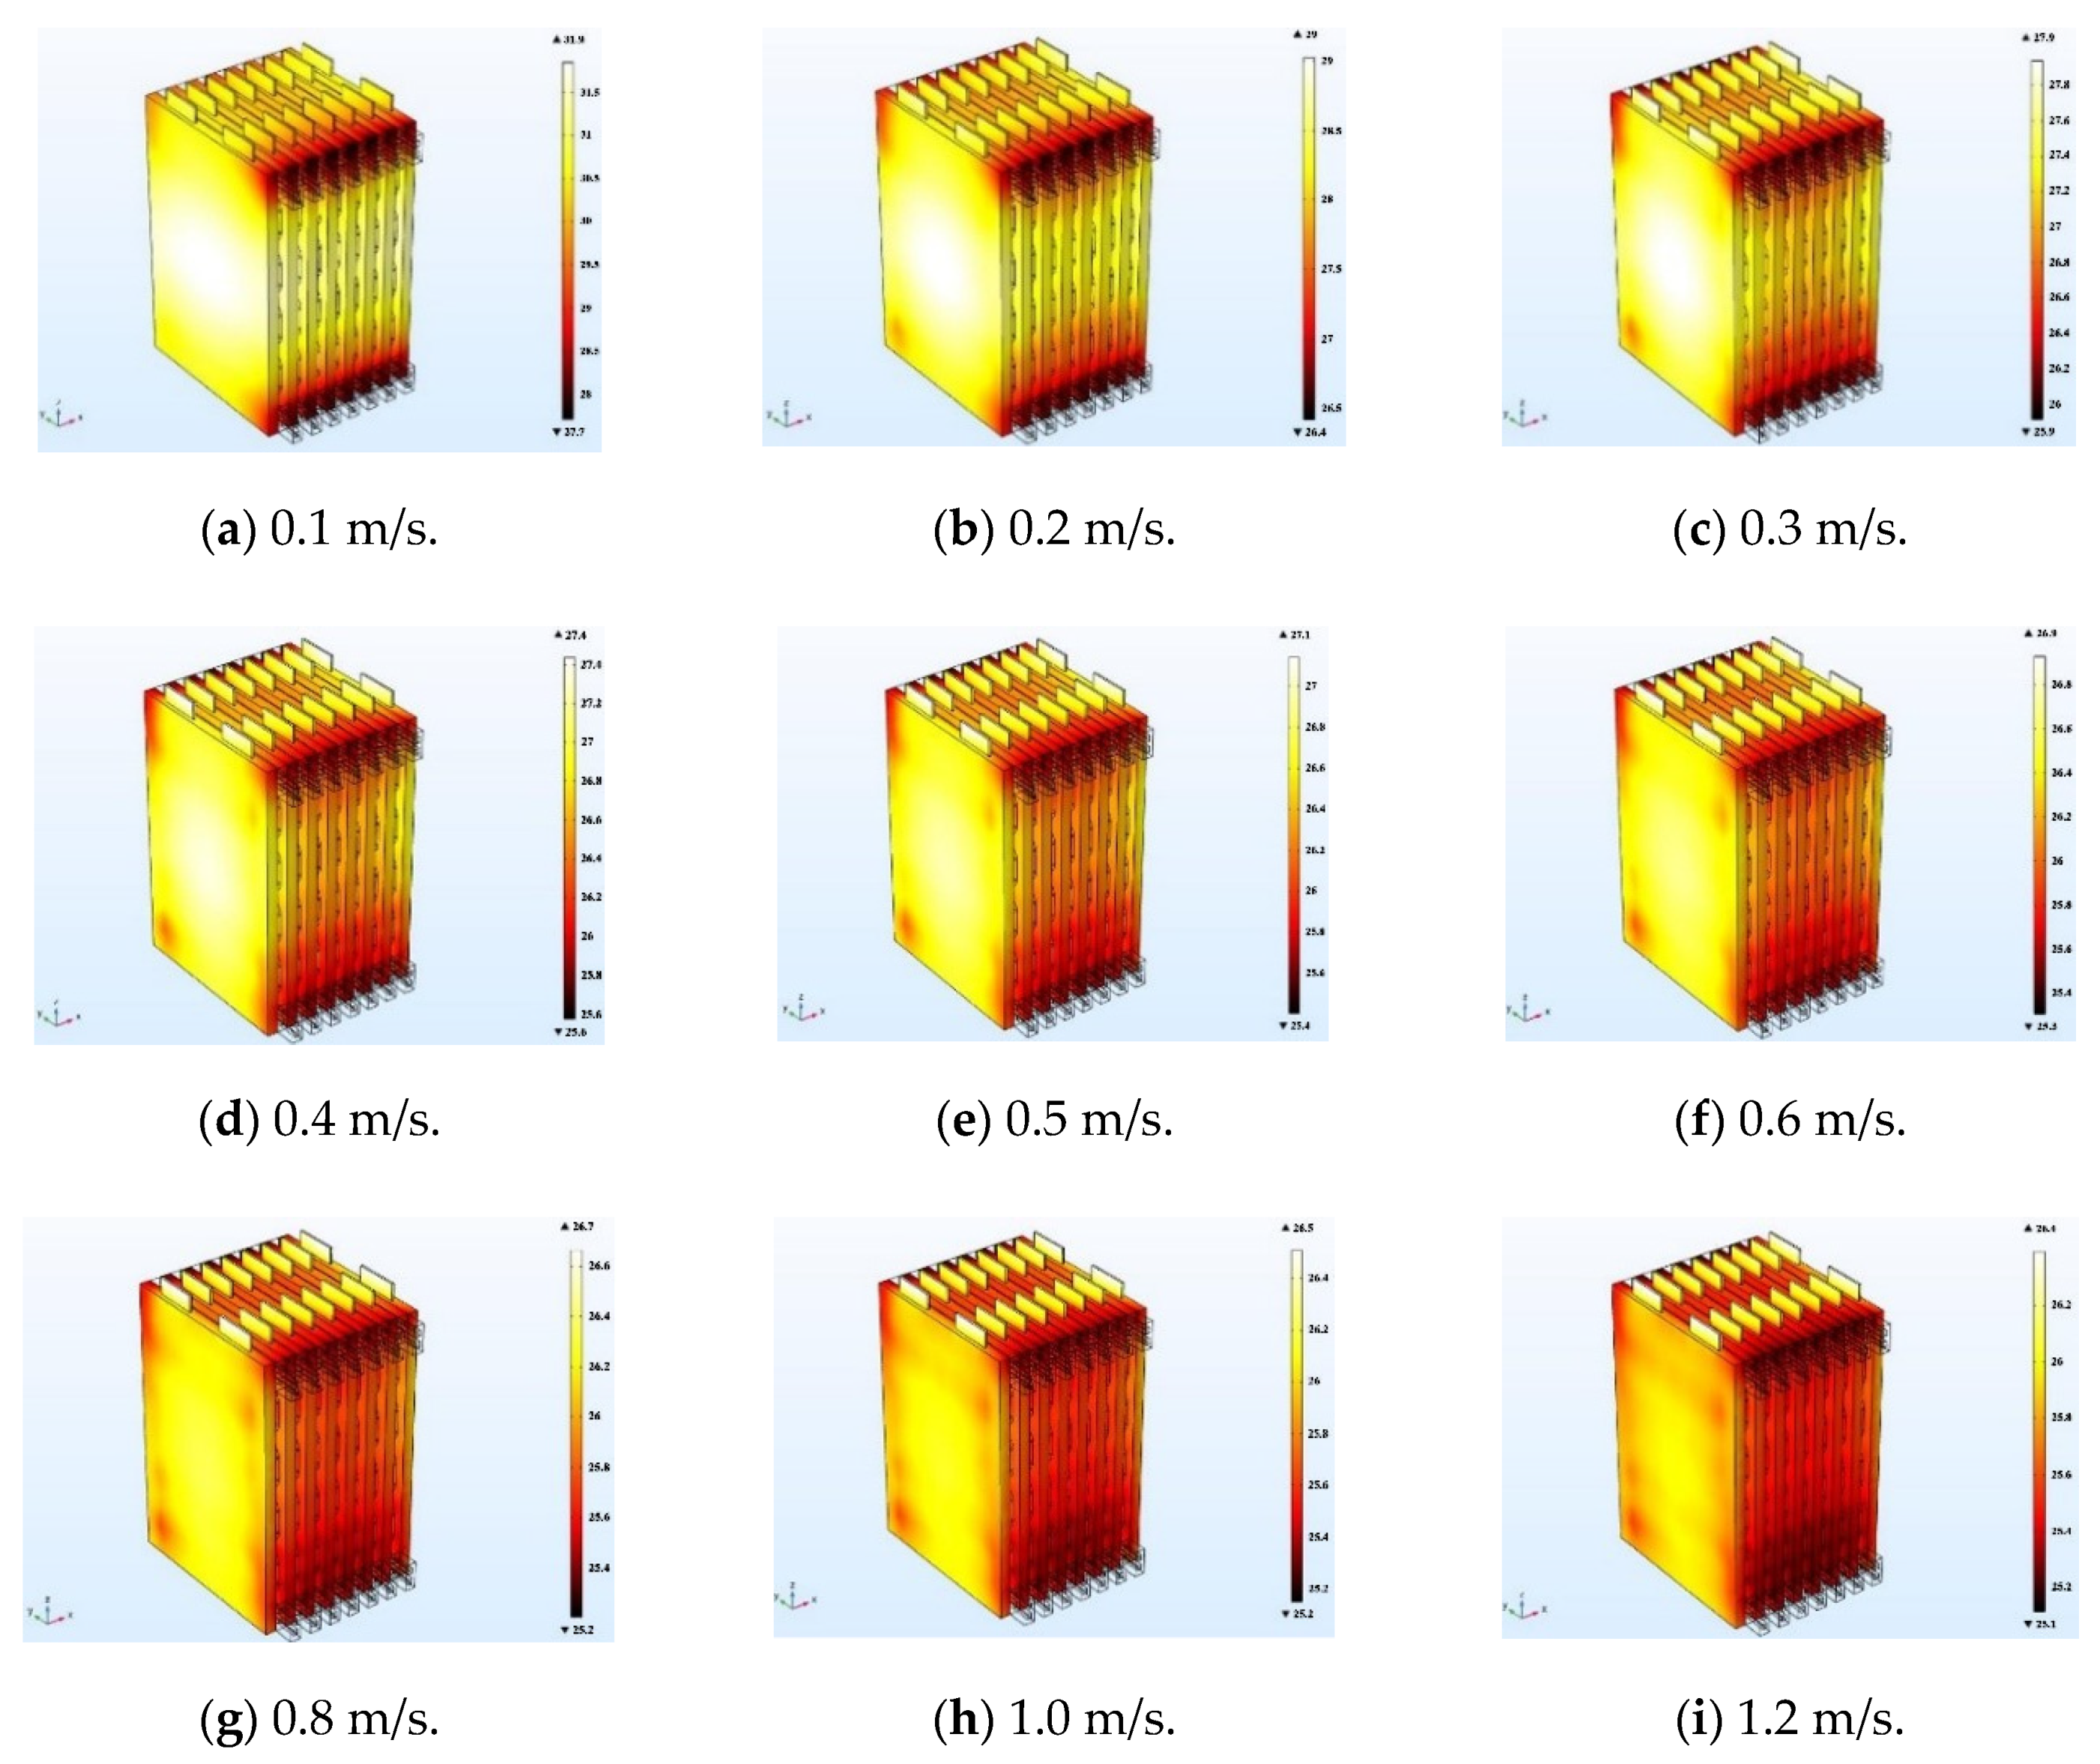
In order to analyze the influence of coolant flow rate on the temperature rise and temperature distribution of the battery pack, the ambient temperature is set to 25 °C, the width of the cooling plate is fixed to 10 mm, the internal cooling channel size is 5 mm × 4 mm, and the charging rate is fixed at 0.5 C. The cooling effect was simulated and analyzed. The battery temperature distribution under steady-state conditions is shown in Figure 15.
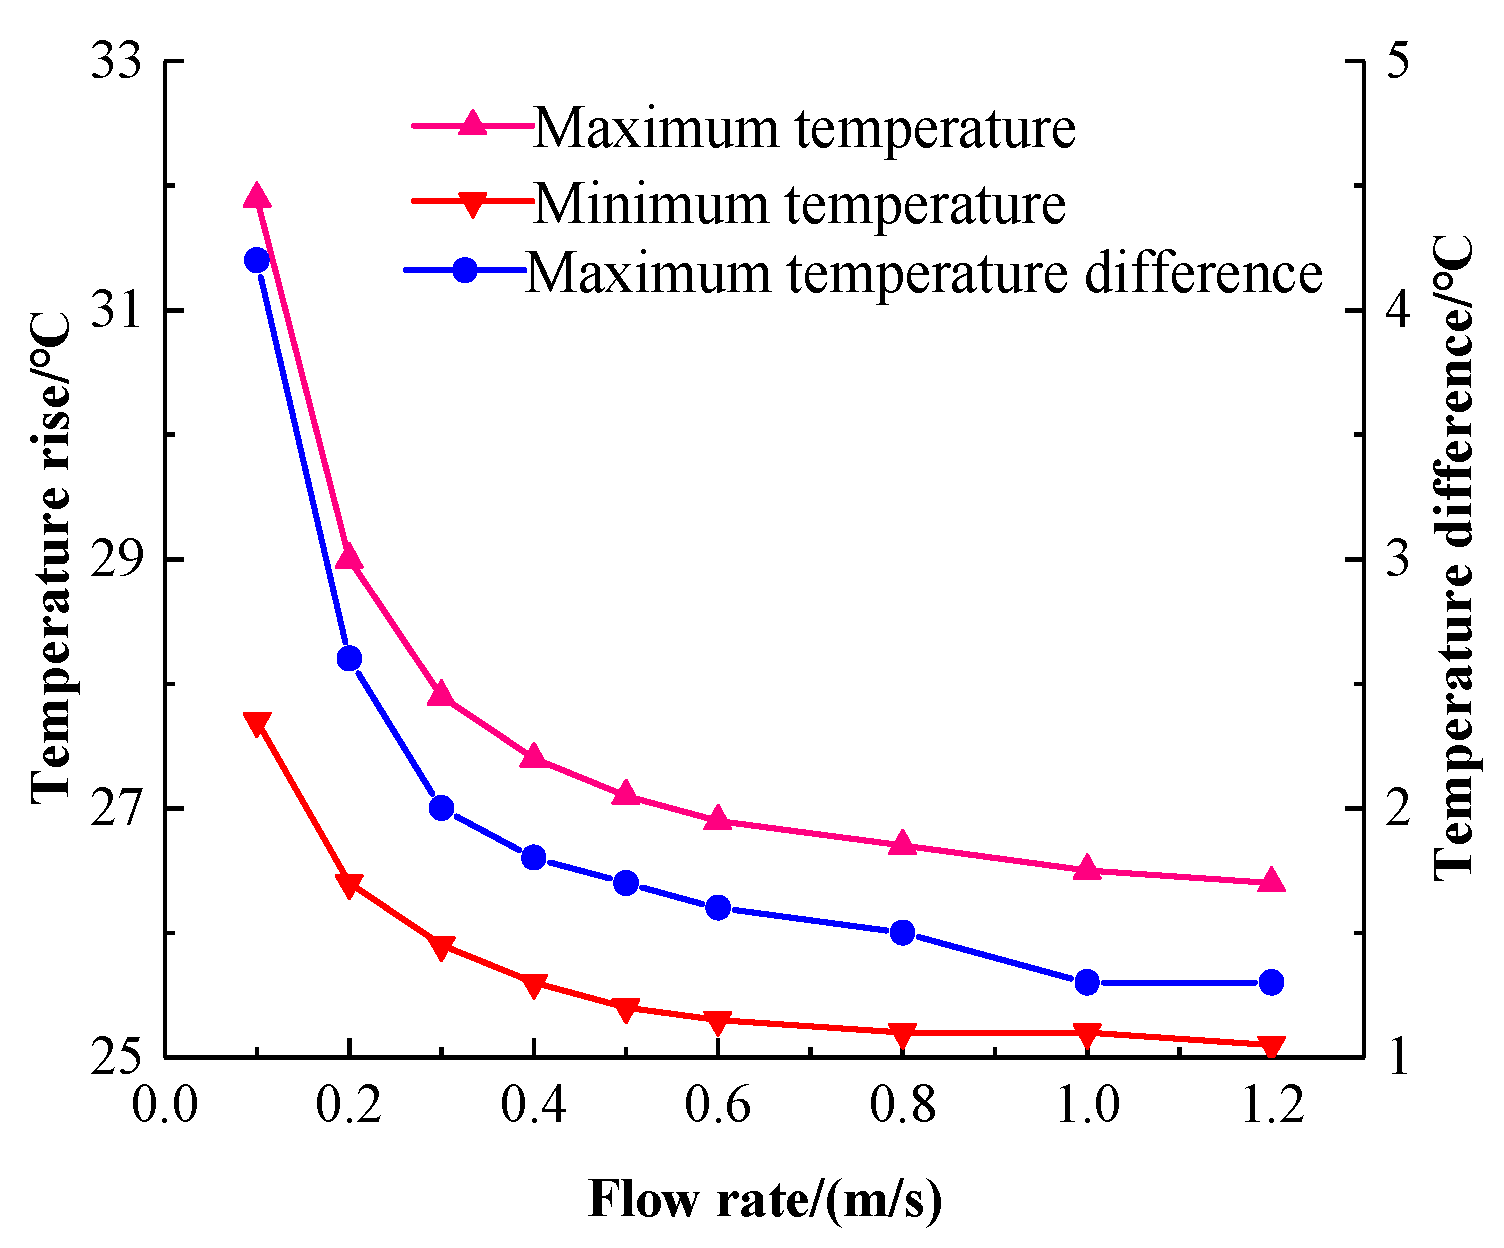
A linear fit of the highest and lowest temperatures of the battery pack at nine different flow rates yields a plot of battery temperature rise versus flow rate, as shown in Figure 16. The difference between the highest temperature and the lowest temperature is the maximum temperature difference of the battery pack. It can be seen that at the lower flow rate, that is, 0.1 m/s to 0.4 m/s, the maximum temperature and maximum temperature difference of the battery pack are degraded. The flow rate has a large effect on the battery pack temperature. When the flow rate is greater than 0.5 m/s, the maximum temperature and maximum temperature difference decrease, and when the flow rate is greater than 1 m/s, the temperature drop tends to be stable. This shows that the influence of the flow rate on the battery pack temperature has reached saturation. Continuing to increase the flow rate will not greatly improve the cooling effect, but will increase the power consumption.
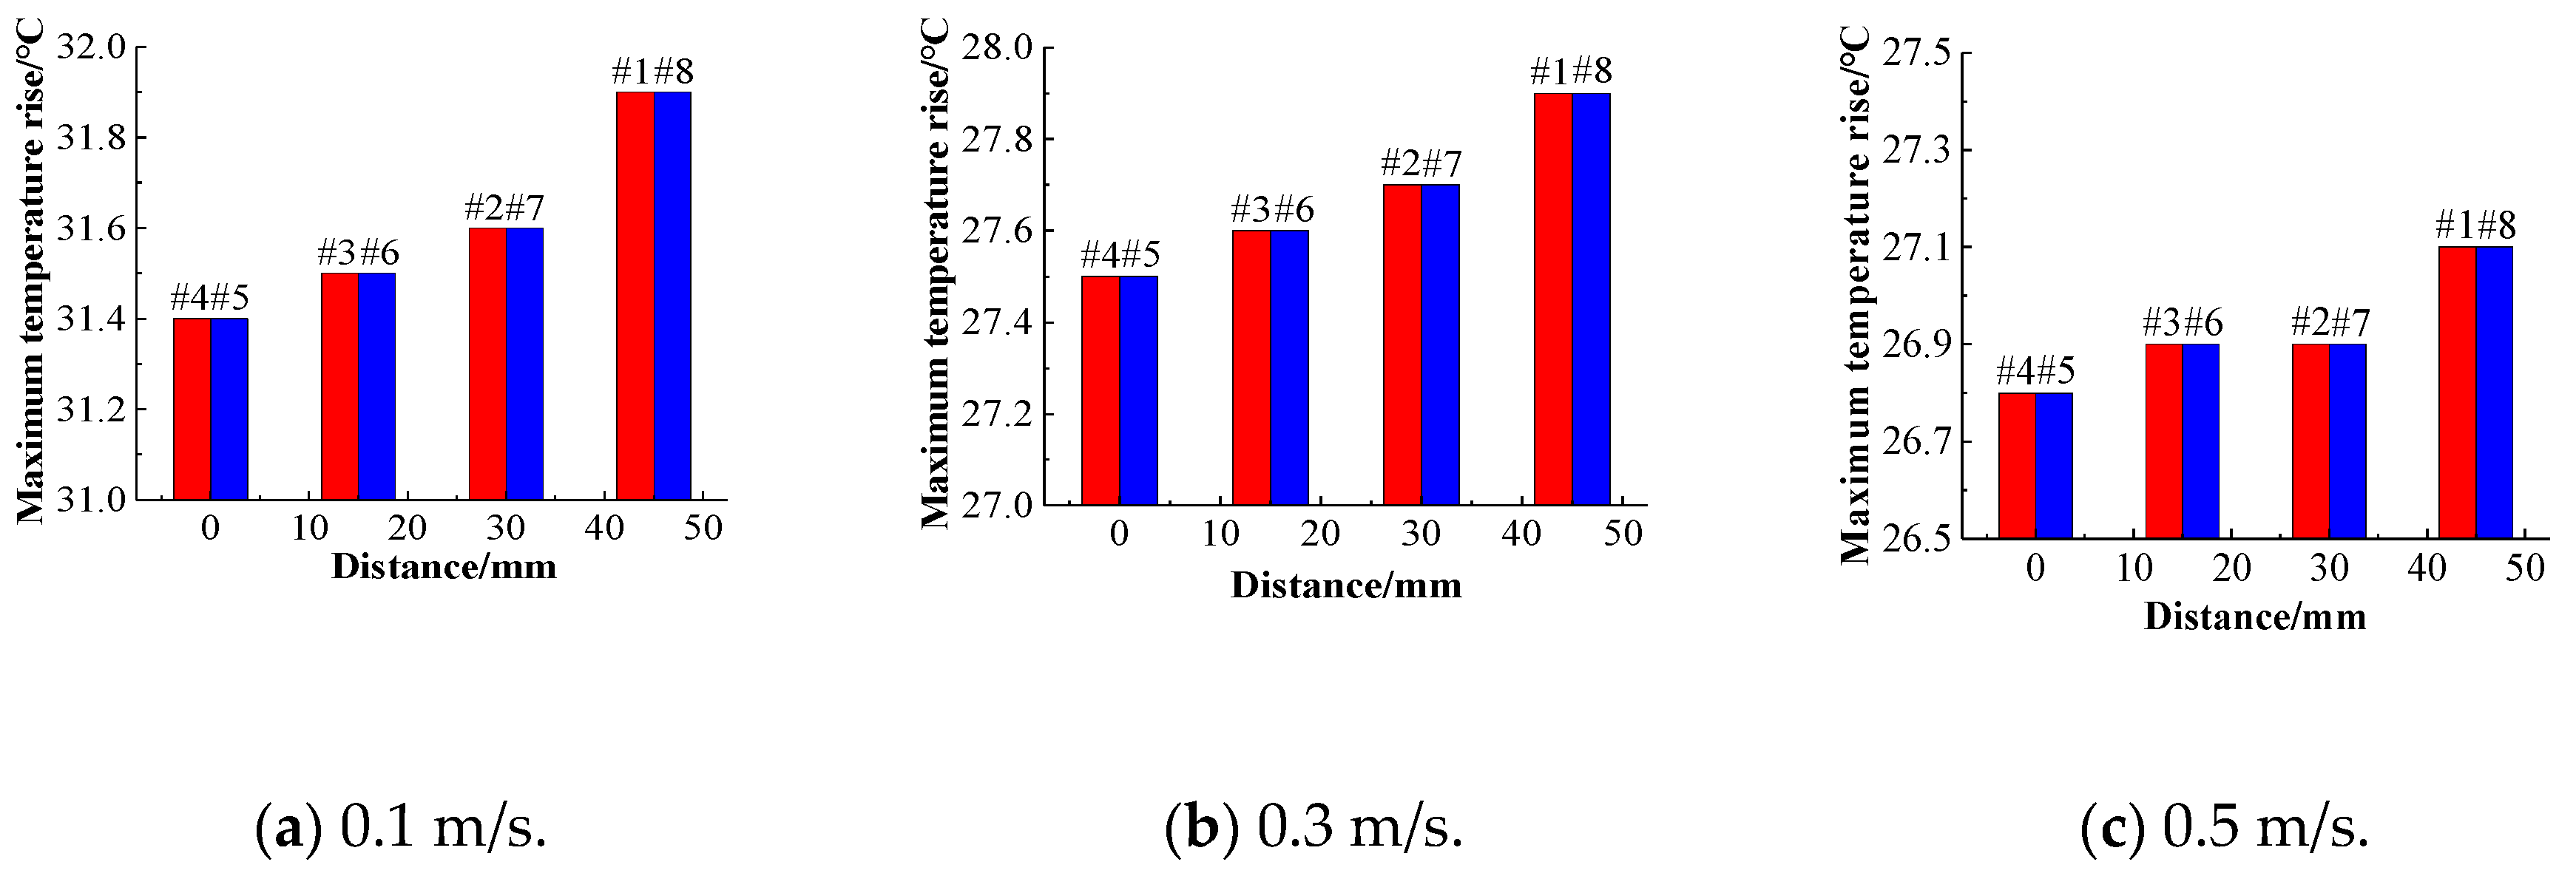
The single cells are marked as batteries #1–#8 in the positive direction along the x-axis. The structure of the battery pack is centered on batteries #4 and #5 and has a central symmetrical structure. Thus, batteries #3 and #6, #2 and #7, and #1 and #8 are symmetric. To analyze the temperature distribution of the battery pack, batteries #4 and #5 were selected as the reference batteries. The temperature rises of the single cell at different flow rates of 0.1 m/s, 0.3 m/s, and 0.5 m/s was analyzed using the distance between the cell and the center of the battery, as shown in Figure 17. In addition, the temperature rises of the batteries near the center of the battery pack are lower than those of the other batteries at the same flow velocity, and their cooling effects are better. As the distance from the center increases, the maximum temperature rise increases.
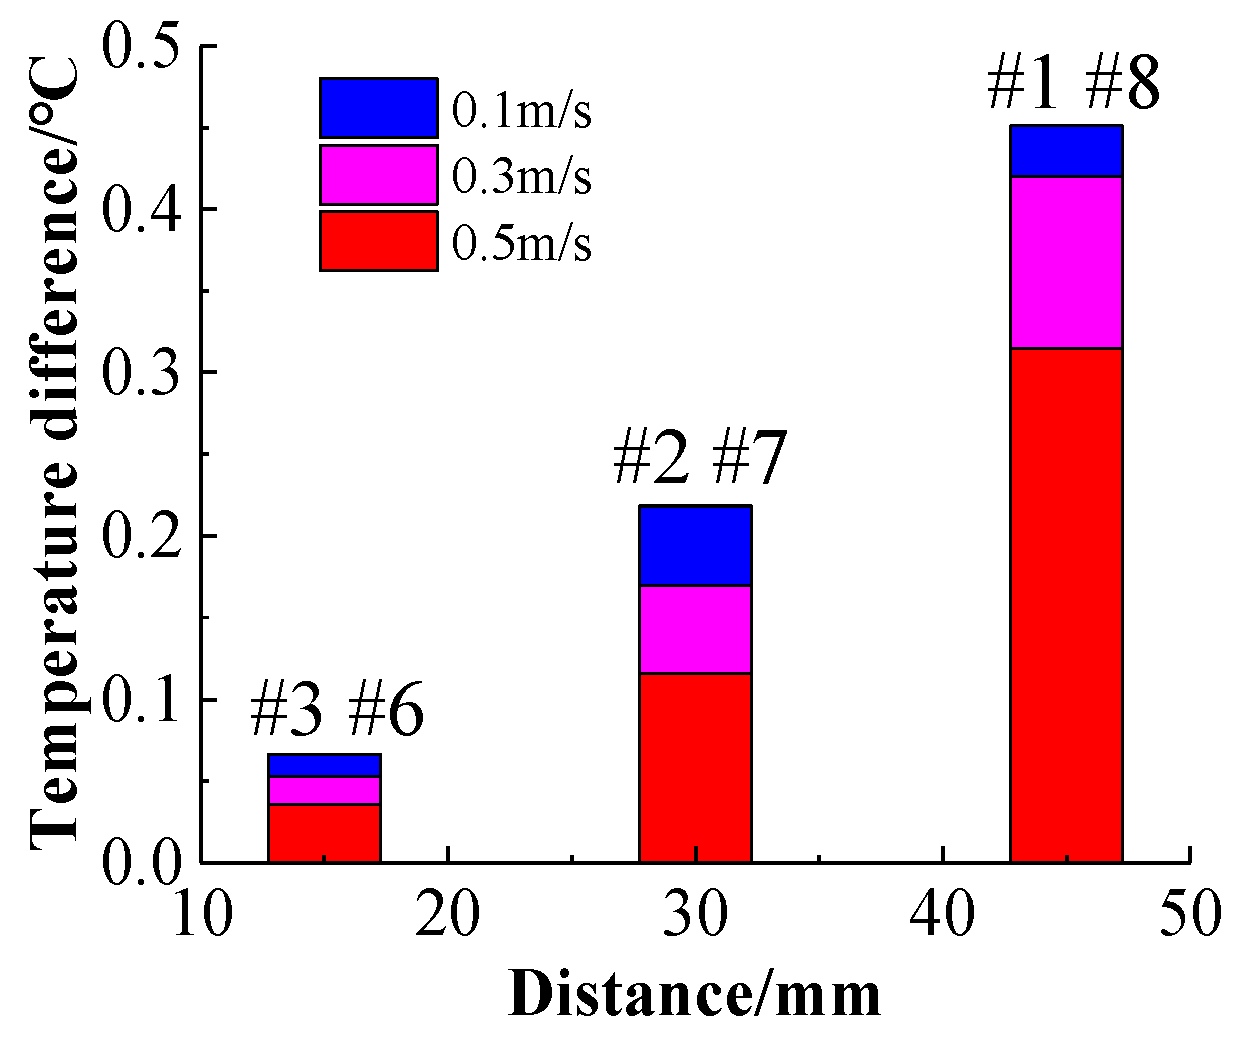
It can be seen from Figure 17 that the maximum temperature rises of the batteries in symmetrical positions are almost equal; thus, taking the average of these values does not affect the temperature rise analysis. The difference between the average temperature of the batteries in symmetrical positions and the average temperature of the batteries at the center positions is defined as the average temperature difference, enabling the relationship between the average temperature difference and the distance from the center to be obtained. At different flow velocities, the average temperature differences of the three sets of symmetrical batteries vary with distance, as depicted in Figure 18. It can be seen that the greater the distance from the center, the higher the temperature rise, indicating that the cooling effect is better near the center of the battery pack than at its ends.
Under the conditions determined by the cooling structure, for the charge and discharge conditions of the same magnification, when the flow rate is low, as the flow rate increases, the highest temperature rise of the battery pack is lower, the temperature uniformity is better, and the cooling effect of the cooling system is significantly improved. However, when the flow rate reaches a certain value, continuing to increase the flow rate does not significantly improve the cooling effect. It shows that under the condition of a certain channel size, the influence of the flow rate on the cooling effect has its limitations. After the flow rate reaches a certain value, the cooling effect does not change significantly due to factors such as the coolant flow rate. According to [34], the optimal operating temperature of a lithium-ion battery pack is between 25 °C and 40 °C and the temperature difference should be less than 5 C. For the model studied in this study, the maximum temperature is lower than 40 °C at a flow rate of 0.5 m/s, and the maximum temperature difference is less than 5 °C. Whether it is the overall temperature rise of the battery pack or the temperature difference between the batteries in the battery pack, that is, the uniformity of the battery pack temperature, the normal working conditions of the electric vehicle power battery pack are satisfied.
4.3. Cooling Channel Size Effect
In order to analyze the effect of channel size on the cooling effect of the battery pack, the ambient temperature is set to 25 °C, and the coolant flow rate is fixed at 0.5 m/s, and the battery temperature distribution at 0.5 C charging rate was simulated by using three different cooling channel widths of 4 mm, 6 mm, and 8 mm, respectively. In order to eliminate the influence of the battery spacing on the temperature distribution of the battery pack, the width of the cooling plate between the batteries is constant at 10 mm, the battery spacing is kept constant, and the width of the channel in the cooling plate is changed. When the channel size changes, the steady-state temperature distribution of the battery pack is as shown in Figure 19. The steady-state temperature distributions of the battery pack with channel widths of 4 mm, 6 mm, and 8 mm are shown in Figure 15a–c, respectively, where the maximum temperature of the battery pack is 27.1 °C, 27 °C, and 26.7 °C, and the corresponding maximum temperature rises are 1.7 °C, 1.8 °C, and 1.5 °C. The battery temperature is less than 30 °C and sufficiently uniform, indicating effective cooling. With increasing channel size, the temperature rises of the battery decreases, which is mainly due to the following two factors. First, as the size of the cooling channel increases, the coolant flow rate increases, and the heat transfer can be increased. Second, an increase in the size of the cooling channel causes the cooling plate to widen and the heat transfer area to increase, thereby decreasing the temperature rise of the battery.
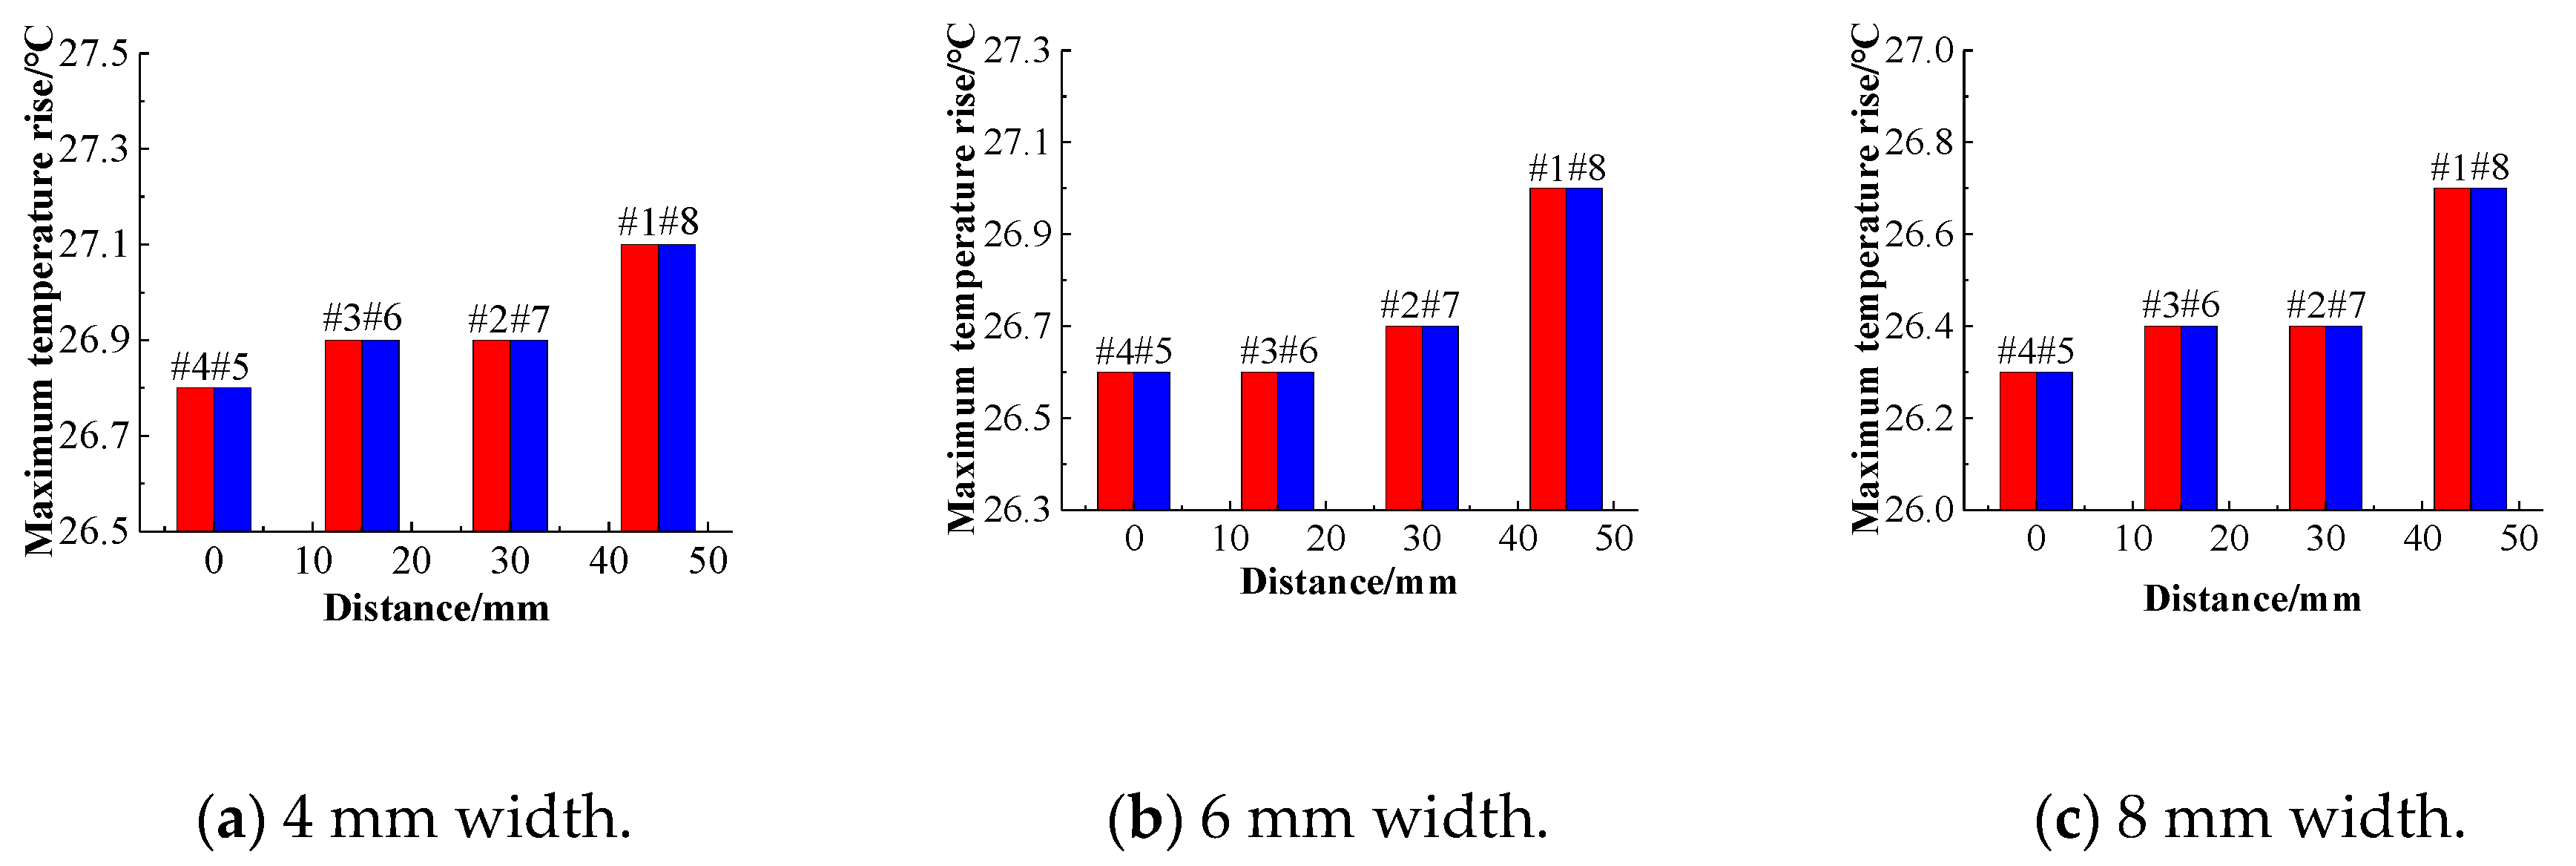
Figure 20a–c show changes in the temperature rise of the battery pack with the center distance when the channel widths are different. Under three different channel widths, the temperature rise of the battery is manifested by the tendency of the battery temperature rise at the center position and the temperature of the battery on both sides to rise. As the distance between the battery and the center increases, the temperature rise of the battery gradually increases, and the temperature uniformity of the entire battery pack will deteriorate.
Figure 21 shows the relationship between the average temperature difference and the center distance for different channel widths. Comparing the temperature rise of the battery at the same position when different channel widths are compared, it can be found that as the channel size increases, the maximum temperature of the battery decreases. When the cooling channel width is 4 mm, 6 mm, and 8 mm, respectively, the maximum temperature rise of the battery decreases.
Therefore, increasing the size of the cooling channel can improve the cooling effect of the battery pack to a certain extent and reduce the maximum temperature rise of the battery. However, as the width of the cooling channel increases, the temperature rises of the batteries farther away from the center of the battery pack are higher; thus, the temperature uniformity of the battery pack decreases. Therefore, when designing the battery pack cooling channel structure, it is necessary to consider the maximum temperature rise and overall temperature uniformity of the battery pack comprehensively when selecting the cooling channel size.
4.4. Charging Rate Effect
As the charging rate increases, the heat generated by the battery increases continuously, as does the temperature rise rate of the battery pack, which introduces great challenges in cooling system design. In this portion of the study, a cooling channel structure with dimensions of 5 mm × 8 mm was selected, and the inlet flow velocity was set to 0.5 m/s. The battery temperature was simulated with charging rates of 0.5 C, 1 C, and 2 C, and Figure 22a–c presents the corresponding temperature distributions of the battery pack at three rates, respectively. As can be seen from Figure 22, with the same flow velocity and cooling inlet channel size, the maximum temperature of the battery and maximum temperature difference increase with increasing charging rate.
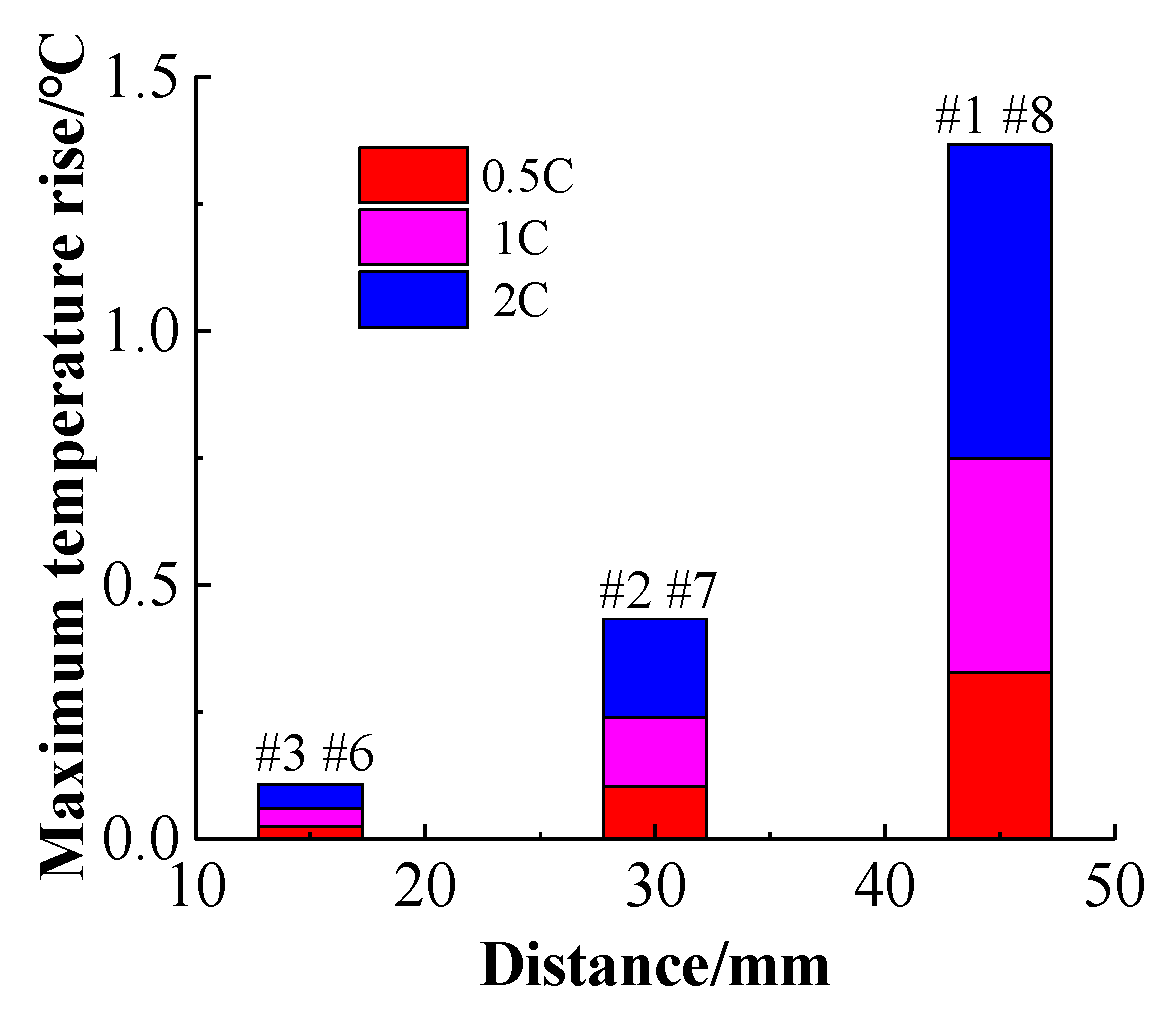
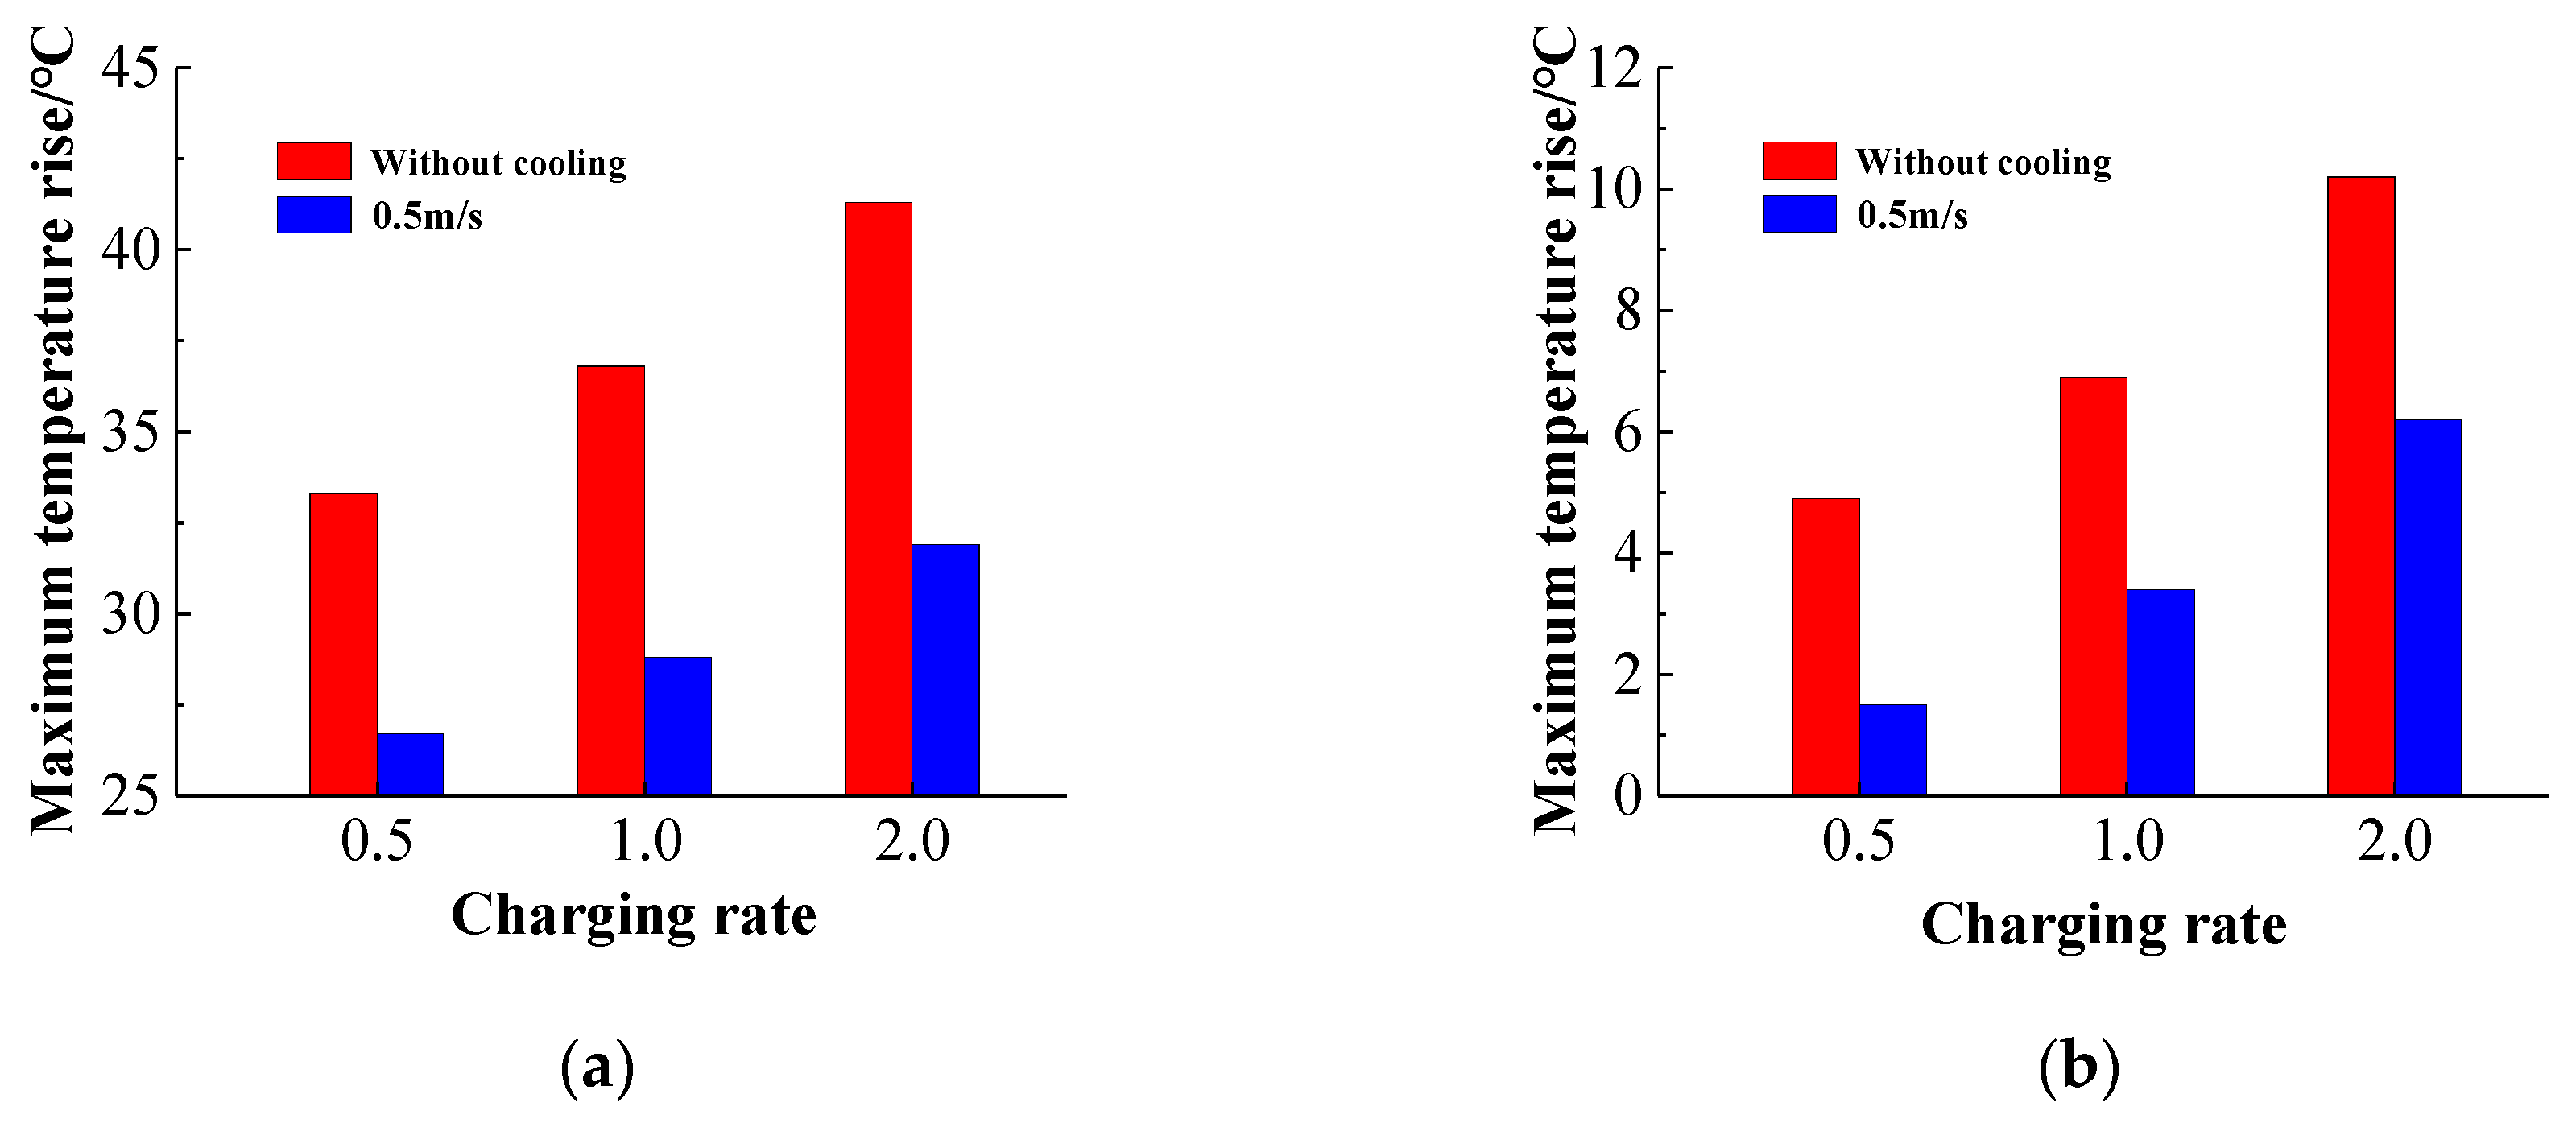
The maximum temperature rises of the battery pack charged at rates of 0.5 C, 1 C, and 2 C are presented in Figure 23a–c, respectively. It can be seen that as the distance between the battery and the center or the charging rate increases, the maximum temperature rise of the battery increases. The average temperature differences of the three sets of symmetrical batteries at different charging rates are depicted in Figure 24. It can be seen that when the charging rate is constant, the temperature rises of the batteries located near the center of the battery pack are low, while those of the batteries located at the ends of the battery pack are relatively large, and that the higher the charging rate, the greater the average temperature difference. Thus, the cooling effect is better near the center of the battery pack than at its ends, because there are cooling channels on both sides of the central batteries and only one side of the battery pack is cooled. In addition, when the charging rate is 2 C, the maximum temperature difference of the battery pack is more than 6 °C. If the charging rate is continuously increased, the temperature difference in the battery pack will continue to increase, the battery pack temperature uniformity will decrease, and the charge-discharge performance of the battery pack will be affected. Compared with the battery pack temperature distribution at different charging rates when there is no cooling in Figure 14, the maximum temperature and maximum temperature difference of the battery pack are shown in Figure 25.
It can be seen from Figure 25 that the increase of the charging rate necessarily leads to an increase in the maximum temperature of the battery pack, and the temperature distribution of the battery pack is more uneven. The maximum temperature difference of the battery pack at three magnifications is 4.9 °C, 6.9 °C, and 10.6 °C, respectively, and the temperature uniformity of the battery pack is extremely poor, far exceeding the normal operating temperature range of the battery pack [35]. When the battery pack is liquid-cooled, the maximum temperature and the maximum temperature difference is significantly reduced, especially the maximum temperature, which is reduced to 1.5 °C, 3.4 °C, and 6.2 °C, respectively. When the charging magnification is 0.5 C and 1 C, the temperature uniformity of the battery pack is good. When the magnification is 2 C, the temperature difference of the battery pack exceeds the optimal working range by 5 °C, but the temperature difference of the battery pack compared with no cooling condition has been significantly improved. It shows that the structure of the cooling system has a good cooling effect on the temperature distribution of the battery pack under high power charging conditions. It should be pointed out that if the cooling effect of the battery pack cooling system is further improved, and the temperature difference of the battery pack at the 2 C charging magnification is lower than 5 °C, it is necessary to appropriately increase the coolant flow rate or appropriately increase the cooling channel size.
4.5. Inlet Cooling Temperature Effect
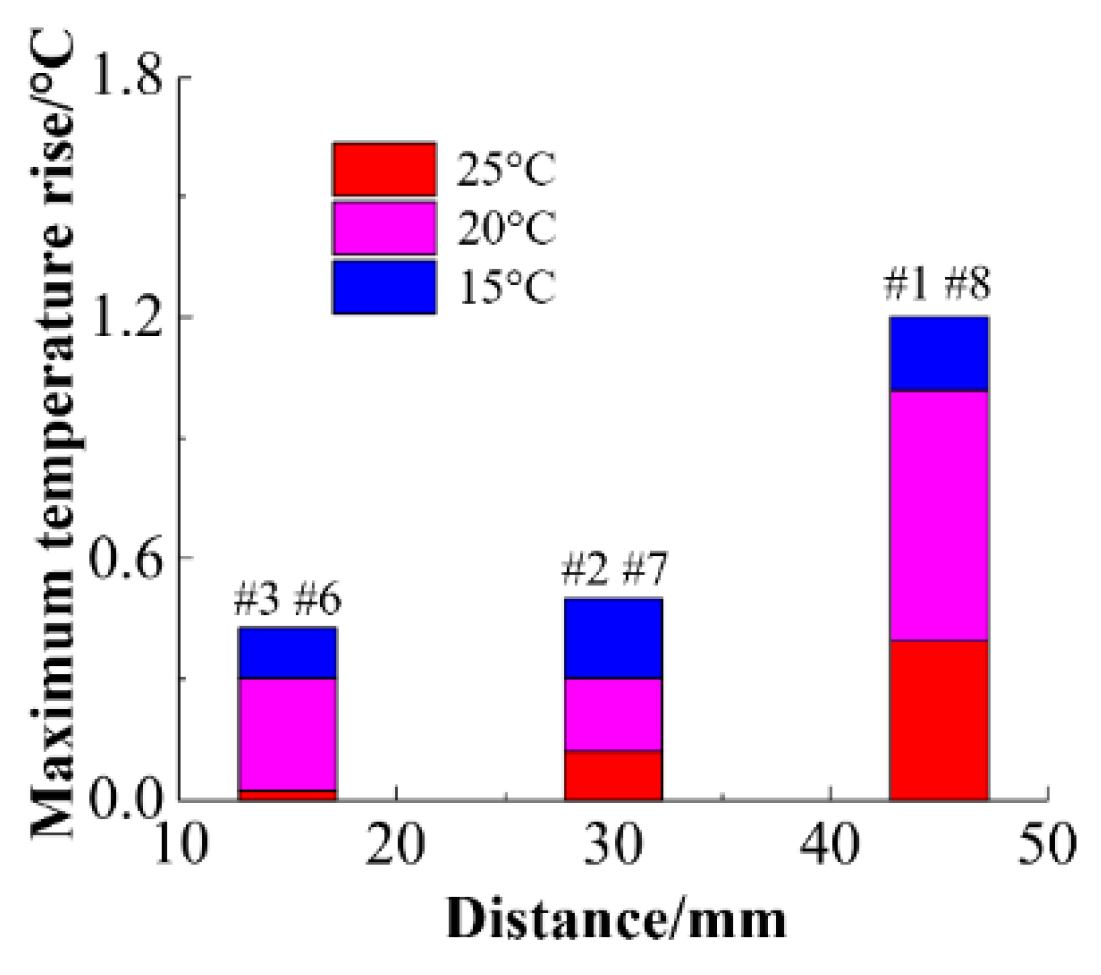
In order to analyze the influence of the inlet temperature on the cooling effect of the battery pack, the ambient temperature is set to 25 °C, the flow rate of the coolant is fixed at 0.5 m/s, the charging rate is 0.5 C, and the temperature of the three coolants is simulated at 25 °C, 20 °C, 15 °C cooling effect. In order to eliminate the influence of the battery spacing on the temperature distribution of the battery pack, the width of the cooling plate between the batteries is 10 mm, and the cooling channel is fixed at 4 mm. The steady-state temperature distribution of the battery pack with inlet temperatures of 25 °C, 20 °C, and 15 °C is shown in the Figure 26. The maximum temperature of the battery pack is 27.1 °C, 21 °C, 16.2 °C, and the corresponding module temperature difference is 1.7 °C, 1 °C, 1.2 °C. The temperature of the battery pack is less than 30 °C, and the temperature difference is less than 5 °C. As the inlet temperature decreases, the temperature rise of the battery decreases. This is mainly due to the decrease in the temperature of the coolant and the increase in heat transfer, thereby reducing the temperature rise of the battery.
Figure 27 shows the temperature rise of the battery pack with the center distance at different coolant temperatures of inlet. Under the three inlet temperatures, the temperature rise of the battery shows a temperature rise trend at the center of the battery and a temperature rise trend of the batteries on both sides. As the distance between the battery and the center increases, the temperature rise of the battery gradually increases, resulting in poor temperature uniformity of the entire battery pack.
Figure 28 shows the relationship between the average temperature difference and the center distance at different inlet coolant temperatures. Comparing the temperature rise of the battery at different inlet temperatures at the same location, it can be found that as the inlet temperature decreases, the maximum temperature of the battery decreases, but as the distance from the center increases, the temperature difference of the battery gradually increases.
Therefore, reducing the inlet coolant temperature can reduce the maximum temperature rise of the battery to some extent. However, as the inlet temperature decreases, the temperature of the battery increases further away from the center of the battery pack, resulting in an increase in the temperature difference of the battery pack. At the same time, reducing the inlet temperature during actual operation will increase power consumption and increase costs. When designing the cooling channel structure of the battery pack, it is necessary to comprehensively consider factors such as the maximum temperature rise of the battery pack and the overall temperature uniformity, as well as the power and cost of the module, and select the appropriate coolant temperature.
5. Conclusions
In this study, a 30 Ah large-capacity LiFePO4 pouch battery was used as the research object to establish a thermal-electrochemical coupled power battery model. The aim was to realize the coupling between the one-dimensional electrochemical model and the three-dimensional thermal model. The model was used to calculate the heat production of LiFePO4 power battery during high-power charging, and the accuracy of the model was verified by experiments. Based on this, the battery pack liquid cooling structure was established. The temperature distribution of the battery pack under different coolant flow rates and different cooling channel sizes was compared and analyzed, and the temperature rise of the battery pack under different charging rates was analyzed.
- (1)
- By changing the flow rate, the maximum temperature of the battery pack cooling system and the temperature difference of the battery pack are compared. The results show that when the flow rate is 0.5 m/s, the cooling effect of the cooling system is better. When the flow velocity exceeds 0.5 m/s, the cooling effect is saturated.
- (2)
- By examining the cooling plate thickness, inlet flow rate, and inlet temperature, the maximum temperature rise of the module and the temperature uniformity of the module were studied. Under the same charging rate and flow rate, increasing the thickness of cooling plate and reducing the inlet temperature can reduce the maximum temperature of the pack, but it will increase the temperature difference of the battery module. The uneven temperature distribution of the battery pack is due to the different distance from the battery to the center of the battery pack. In the structural design of the liquid cooling system, it is possible to further consider different cooling structures applied to the batteries at different positions to ensure the uniformity of the temperature of the battery pack.
- (3)
- A liquid cooling system was established to simulate the temperature change of the battery pack under high-power charging conditions. The effectiveness and applicability of the structure of cooling plate is verified by analyzing the temperature distribution of the battery pack charging at different rates without cooling plate. The maximum temperature rises and maximum temperature difference of the battery pack under high power charging conditions meet the normal working requirements. The design of the cooling structure can provide a guidance for the design of battery thermal management systems under high power charging conditions.
Author Contributions
Project administration, J.D. and Y.S. wrote this paper, Y.H. did the simulation of the relevant battery pack model, and X.W. participated in the writing of the paper. All authors have read and agreed to the published version of the manuscript.
Funding
The research is funded by National Key Research and Development Project 2018YFB0106300.
Conflicts of Interest
The authors declare no conflict of interest.
Nomenclature
| SOCinit | the initial state of charge of the battery |
| C1,0, C1,max | the current lithium-ion concentration and maximum lithium-ion concentration in the active material |
| Ecell,init | the initial voltage of the battery (V) |
| OCP | the open circuit potentials |
| Ep,OCP, En,OCP | the open circuit potentials of the positive and negative active materials |
| κ | the conductivity of the ion |
| Sa | the specific surface area |
| jloc | the local current density |
| γ | the Bruggeman factor |
| ε | the electrode volume fraction |
| φi | the electron potential |
| f | the average molar activity coefficient |
| ci | the lithium-ion concentration |
| t+ | the lithium-ion transfer number |
| F | the Faraday constant. |
| y | the dimensionless radial distance of the particle |
| D | the diffusion coefficient |
| η | the reaction activation over-potential |
| j0 | the migration current density |
| αc, αa | the positive and negative current transfer coefficients |
| σ | the electronic conductivity in solid phase material |
| β | the reaction rate constant |
| Ui | the open circuit potential of the electrode (V) |
| Ui,ref | the open circuit potential under the reference temperature (V) |
| Up | the voltage of the lithium-ion battery terminal (V) |
| Qe | the heat dissipation rate of the battery |
| h | the heat transfer coefficient (W/m2K) |
| T | the battery temperature (°C) |
| Tout | the ambient temperature (°C) |
| ρbatt | the active material density |
| Cp,batt | the heat capacity |
| Li | the thickness of each layer of the unit cell |
| kT,i | the thermal conductivity of each layer of material |
| Q | the battery heat generation |
| Qact | the active material heat |
| Qrea | the chemical reaction heat |
| Qohm | the Ohmic heat |
| I | the current (A) |
| U0 | the open-circuit voltage (V) |
| U | the battery operating voltage (V) |
| R | the total internal resistance of the battery (Ω) |
References
- Tomaszewska, A.; Chu, Z.; Feng, X.; O’Kane, S.; Liu, X.; Chen, J.; Ji, C.; Endler, E.; Li, R.; Liu, L.; et al. Lithium-ion battery fast charging: A review. eTransportation 2019, 1, 100011. [Google Scholar] [CrossRef]
- Xiong, R.; Zhang, Y.; Wang, J. Lithium-ion battery health prognosis based on a real battery management system used in electric vehicles. Int. J. IEEE Trans. Veh. Technol. 2018, 68, 4110–4121. [Google Scholar] [CrossRef]
- Lv, C.; Hu, X.; Sangiovanni-Vincentelli, A. Driving-style-based codesign optimization of an automated electric vehicle: A cyber-physical system approach. Int. J. IEEE Trans. Ind. Electron. 2019, 66, 2965–2975. [Google Scholar] [CrossRef] [Green Version]
- Zhang, H.; Wang, J. Active steering actuator fault detection for an automatically-steered electric ground vehicle. Int. J. IEEE Trans. Veh. Technol. 2017, 66, 3685–3702. [Google Scholar] [CrossRef]
- Xiong, R.; Li, L.; Tian, J. Towards a smarter battery management system: A critical review on battery state of health monitoring methods. Int. J. Power Sources 2018, 405, 18–29. [Google Scholar] [CrossRef]
- Xiong, R.; Yu, Q.; Shen, W. A sensor fault diagnosis method for a lithium-ion battery pack in electric vehicles. Int. J. IEEE Trans. Power Electron. 2019, 34, 9709–9718. [Google Scholar] [CrossRef]
- Zhang, C.; Jiang, J.; Gao, Y. Charging optimization in lithium-ion batteries based on temperature rise and charge time. Int. J. Appl. Energy 2017, 194, 569–577. [Google Scholar] [CrossRef]
- Zou, C.; Hu, X.; Wei, Z. Electrothermal dynamics-conscious lithium-ion battery cell-level charging management via state-monitored predictive control. Int. J. Energy 2017, 141, 250–259. [Google Scholar] [CrossRef]
- Bahiraei, F.; Fartaj, A.; Nazri, G.-A. Electrochemical-thermal modeling to evaluate active thermal management of a lithium-ion battery module. Int. J. Electrochim. Acta 2017, 254, 59–71. [Google Scholar] [CrossRef]
- Hu, X.; Tang, X. Review of modeling techniques for lithium-ion traction batteries in electric vehicles. Int. J. Mech. Eng. 2017, 53, 34–45. [Google Scholar] [CrossRef]
- Wu, X.; Lv, S.; Chen, J. Determination of the optimum heat transfer coefficient and temperature rise analysis for a lithium-ion battery under the conditions of harbin city bus driving cycles. Energies 2017, 10, 1723. [Google Scholar] [CrossRef] [Green Version]
- Panchal, S.; Dincer, I.; Agelin-Chaab, M. Thermal modeling and validation of temperature distributions in a prismatic lithium-ion battery at different discharge rates and varying boundary conditions. Int. J. Appl. Therm. Eng. 2015, 96, 190–199. [Google Scholar] [CrossRef]
- Li, Y.; Zhou, Z.; Wu, W. Three-dimensional thermal modeling of li-ion battery cell and 50V li-ion battery pack cooled by mini-channel cold plate. Int. J. Appl. Therm. Eng. 2019, 147, 829–840. [Google Scholar] [CrossRef]
- Han, X.; Huang, Y.; Lai, H.X. Electrochemical-themal coupled investigation of lithium iron phosphate cell performances under air-cooled conditions. Int. J. Appl. Therm. Eng. 2019, 147, 908–916. [Google Scholar] [CrossRef]
- Karimi, G.; Li, X. Thermal management of lithium-ion batteries for electric vehicles. Int. J. Energy Res. 2017, 37, 13–24. [Google Scholar] [CrossRef]
- Wang, Q.; Jiang, B.; Li, B.; Yan, Y. A critical review of thermal management models and solutions of lithium-ion batteries for the development of pure electric vehicles. Renew. Sustain. Energy Rev. 2016, 64, 106–128. [Google Scholar] [CrossRef]
- Deng, T.; Ran, Y.; Zhang, G. Novel leaf-like channels for cooling rectangular lithium ion batteries. Int. J. Appl. Therm. Eng. 2019, 150, 1186–1196. [Google Scholar] [CrossRef]
- Rao, Z.; Qian, Z.; Kuang, Y. Thermal performance of liquid cooling based thermal management system for cylindrical lithium-ion battery module with variable contact surface. Int. J. Appl. Therm. Eng. 2017, 123, 1514–1522. [Google Scholar] [CrossRef]
- Wu, W.; Wang, S.; Wu, W. A critical review of battery thermal performance and liquid based battery thermal management. Int. J. Energy Convers. Manag. 2019, 182, 262–281. [Google Scholar] [CrossRef]
- Cai, H.; Xu, C.; Liao, Y. Mass maldistribution research of different internal flowing channels in the cooling plate applied to electric vehicle batteries. Appl. Sci. 2019, 9, 636. [Google Scholar] [CrossRef] [Green Version]
- Ye, B.; Rubel, M.R.H.; Li, H. Design and optimization of cooling plate for battery module of an electric vehicle. Appl. Sci. 2019, 9, 754. [Google Scholar] [CrossRef] [Green Version]
- Tang, Z.; Min, X.; Song, A. Thermal management of a cylindrical lithium-ion battery module using a multichannel wavy tube. Int. J. Energy Eng. 2019, 145, 1. [Google Scholar] [CrossRef]
- Panchal, S.; Khasow, R.; Dincer, I. Thermal design and simulation of mini-channel cold plate for water cooled large sized prismatic Lithium-ion battery. Int. J. Appl. Therm. Eng. 2017, 122, 80–90. [Google Scholar] [CrossRef]
- Huo, Y.; Rao, Z. Investigation of phase change material based battery thermal management at cold temperature using lattice Boltzmann method. Int. J. Energy Convers. Manag. 2017, 133, 204–215. [Google Scholar] [CrossRef]
- Zheng, Y.; Yu, S.; Huang, Y. Optimisation with adiabatic interlayers for liquid-dominated cooling system on fast charging battery packs. Int. J. Appl. Therm. Eng. 2019, 147, 636–646. [Google Scholar] [CrossRef]
- Song, L.; Zhang, H.; Yang, C. Thermal analysis of conjugated cooling configurations using phase change material and liquid cooling techniques for a battery module. Int. J. Heat Mass Transf. 2019, 133, 827–841. [Google Scholar] [CrossRef]
- Smith, J.; Singh, R.; Hinterberger, M. Battery thermal management system for electric vehicle using heat pipes. Int. J. Therm. Sci. 2018, 134, 517–529. [Google Scholar] [CrossRef]
- Xia, G.; Cao, L.; Bi, G. A review on battery thermal management in electric vehicle application. Int. J. Power Sources 2017, 367, 90–105. [Google Scholar] [CrossRef]
- Jin, N.; Danilov, D.L.; Van den Hof, P.M.; Donkers, M.C.F. Parameter estimation of an electrochemistry-based lithium-ion battery model using a two-step procedure and a parameter sensitivity analysis. Int. J. Energy Res. 2018, 42, 203–2592. [Google Scholar] [CrossRef]
- Guo, S.; Xiong, R.; Wang, K. A novel echelon internal heating strategy of cold batteries for all-climate electric vehicles application. Int. J. Appl. Energy 2018, 219, 256–263. [Google Scholar] [CrossRef]
- Ye, Y.; Shi, Y.; Tay, A.A. Electro-thermal cycle life model for lithium iron phosphate battery. Int. J. Power Sources 2012, 217, 509–518. [Google Scholar] [CrossRef]
- Zhang, C.; Cheng, G.; Qun, J. Study on battery pack consistency evolutions during electric vehicle operation with statistical method. Int. J. Energy Procedia 2017, 105, 3551–3556. [Google Scholar] [CrossRef]
- Saw, L.H.; Poon, H.M.; Thiam, H.S. Novel thermal management system using mist cooling for lithium-ion battery packs. Int. J. Appl. Energy 2018, 223, 146–158. [Google Scholar] [CrossRef] [Green Version]
- Al-Zareer, M.; Dincer, I.; Rosen, M.A. Novel thermal management system using boiling cooling for high-powered lithium-ion battery packs for hybrid electric vehicles. Int. J. Power Sources 2017, 363, 291–303. [Google Scholar] [CrossRef]
- Malik, M.; Dincer, I.; Rosen, M.A. Review on use of phase change materials in battery thermal management for electric and hybrid electric vehicles. Int. J. Energy Res. 2016, 40, 1011–1031. [Google Scholar] [CrossRef]
Figure 1.
The battery pack structure.

Figure 2.
The cooling channel structure.
Figure 3.
Battery model coupling diagram.
Figure 4.
Experimental platform.
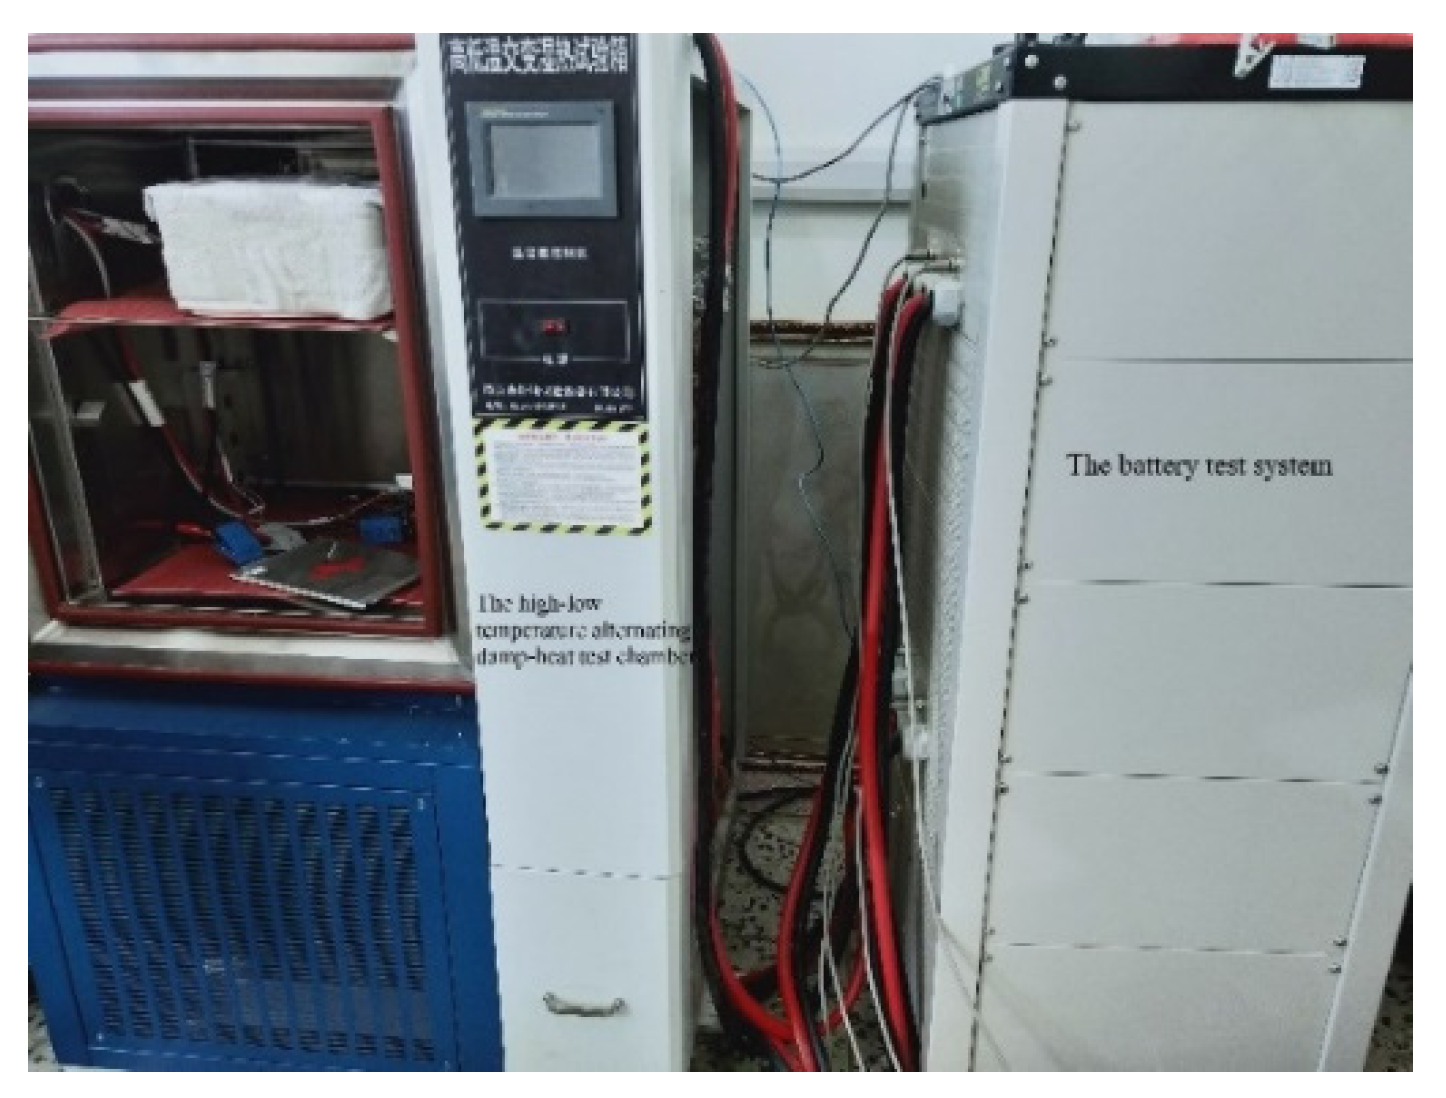
Figure 5.
30 Ah pouch LiFePO4 lithium-ion battery.
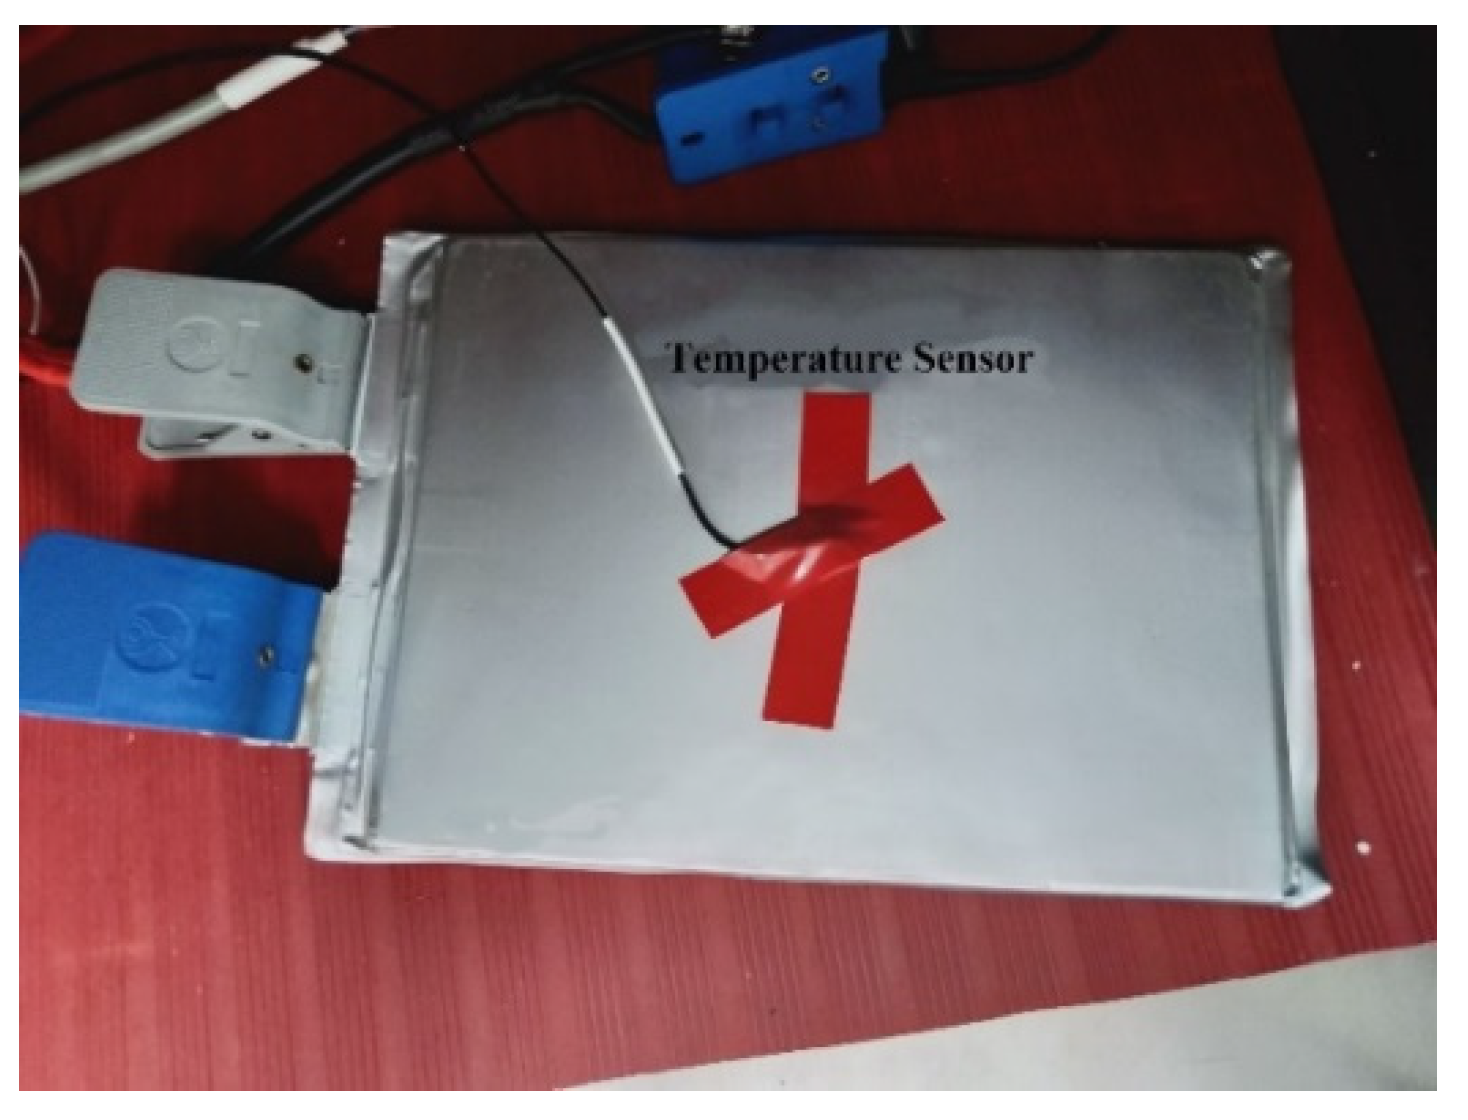
Figure 6.
Battery internal resistance versus SOC.
Figure 7.
Battery OCV and SOC curves of 25 °C.
Figure 8.
Battery ∂Ui/∂T value in different SOC.
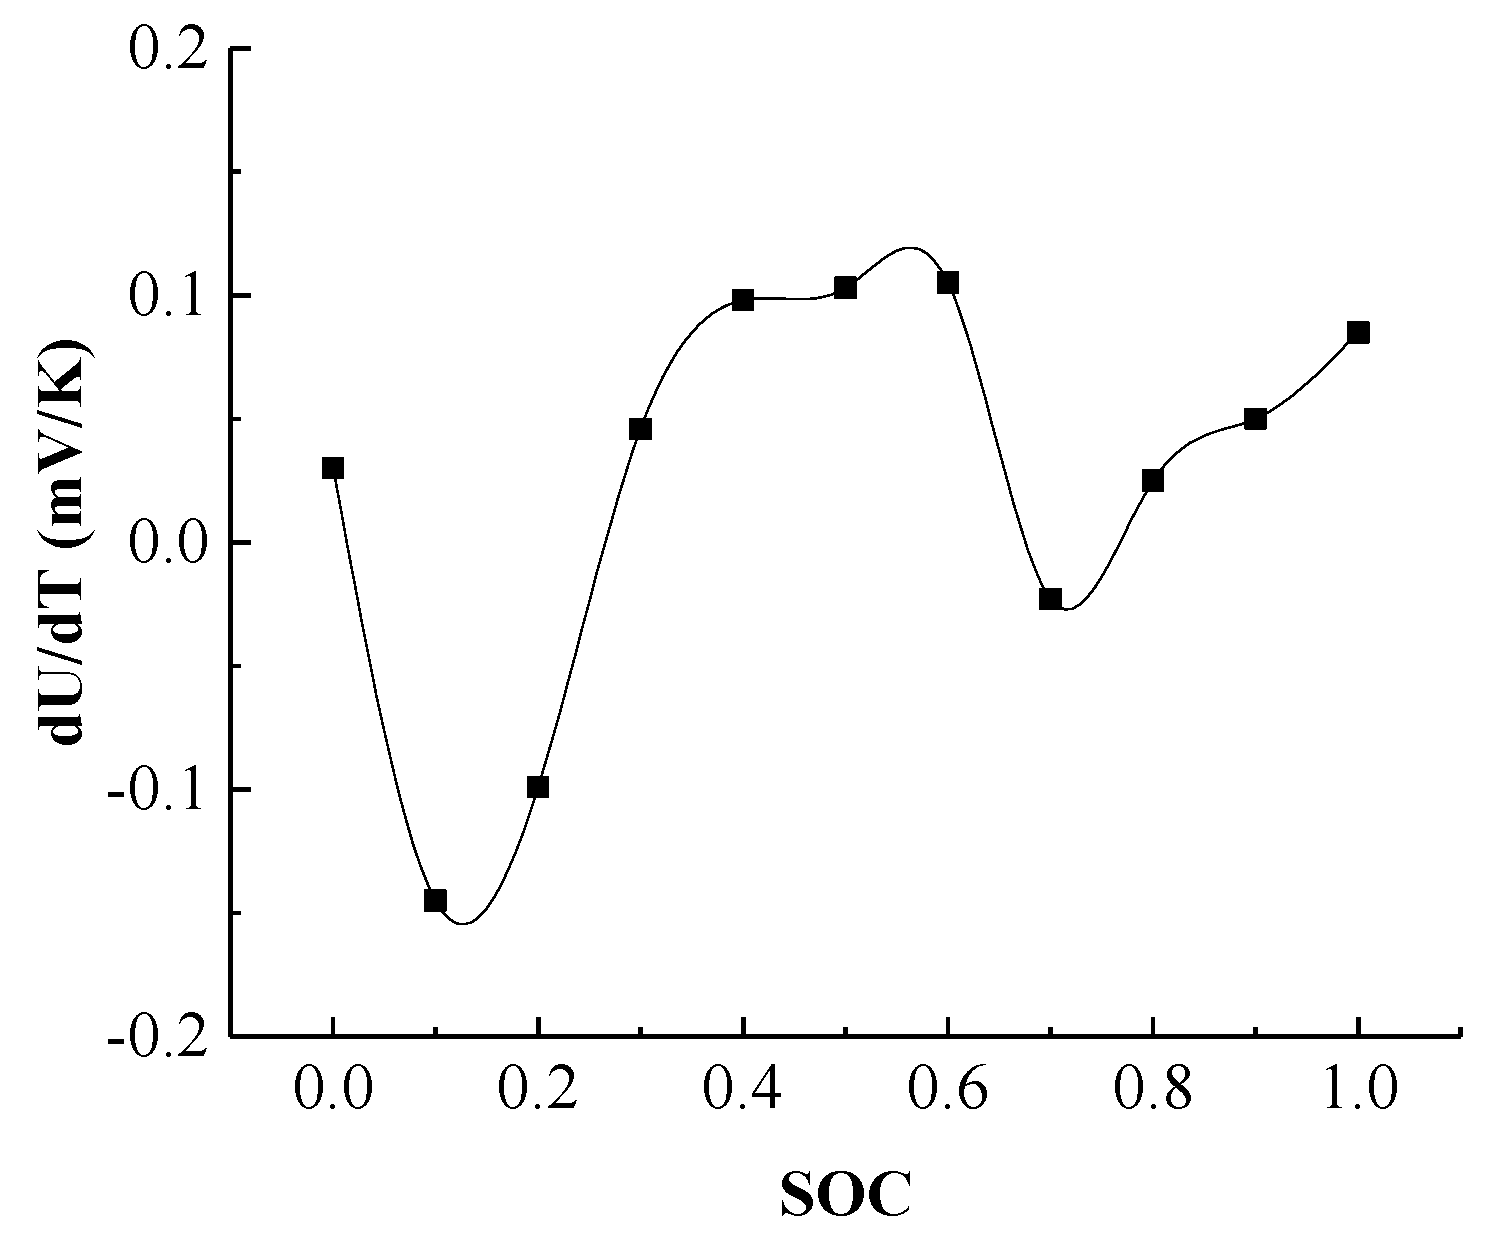
Figure 9.
Experimental temperature distribution under different charging rates. (a) 0.5 C charging rate. (b) 1 C charging rate. (c) 2 C charging rate.
Figure 9.
Experimental temperature distribution under different charging rates. (a) 0.5 C charging rate. (b) 1 C charging rate. (c) 2 C charging rate.

Figure 10.
Simulation temperature distribution under different charging rates.
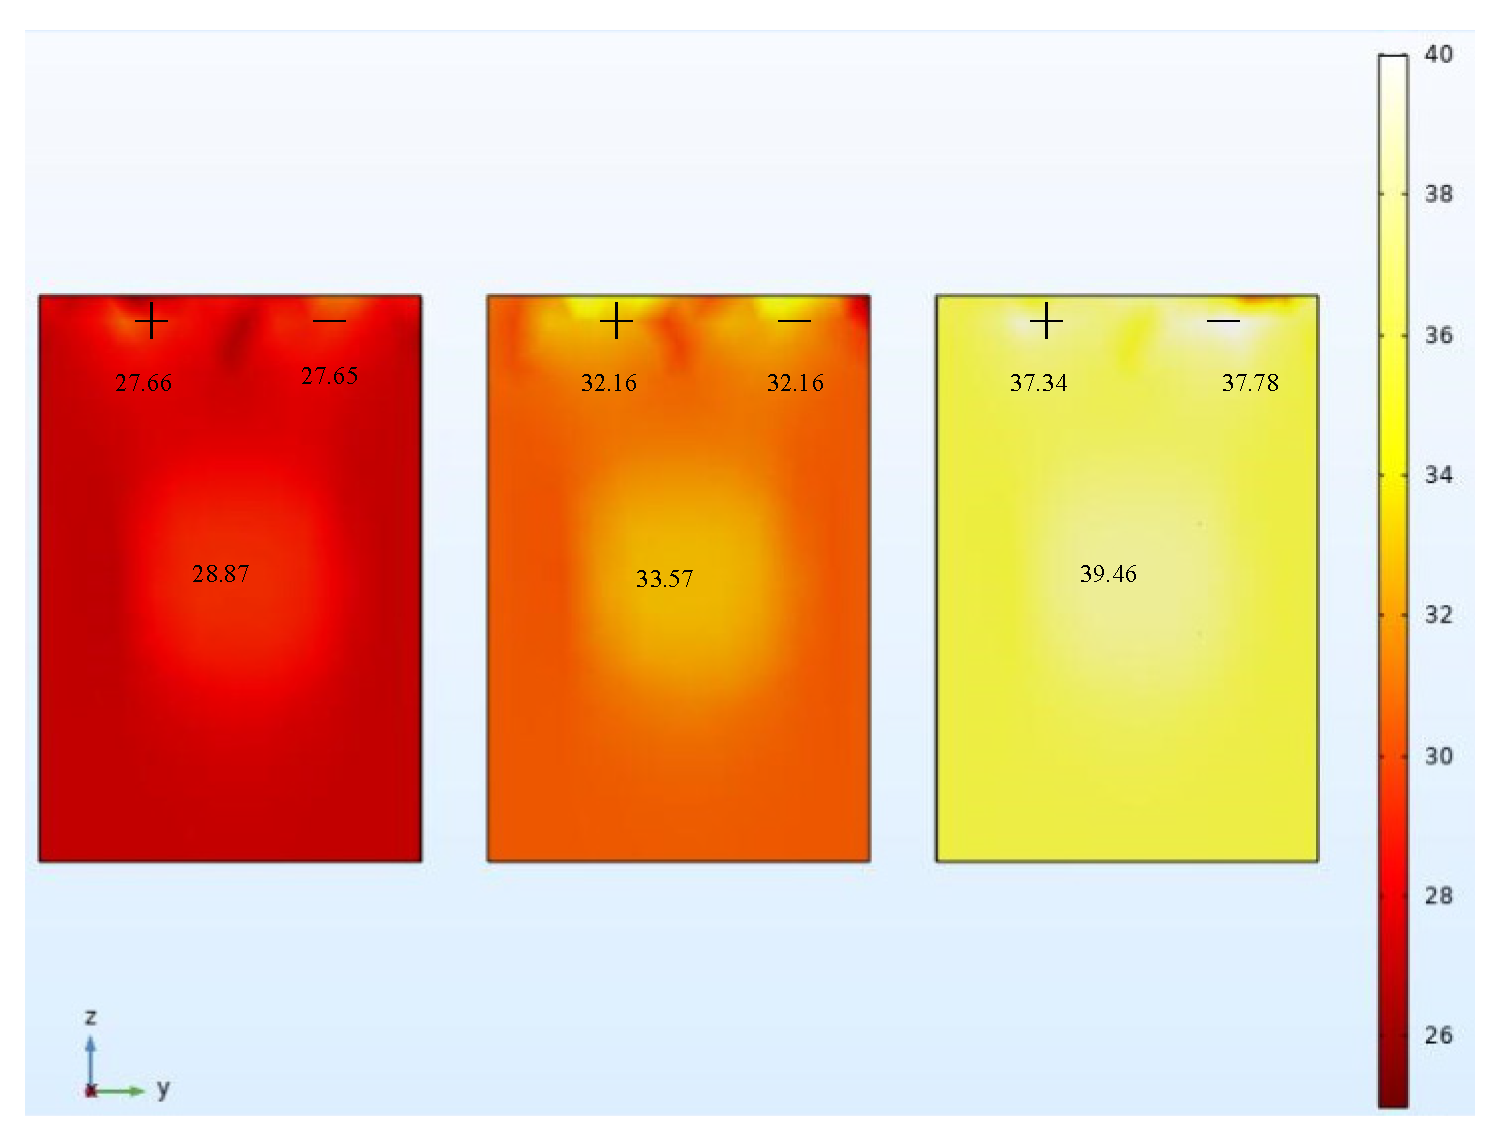
Figure 11.
Comparison of temperature rise and simulation temperature rise of 0.5 C rate charging experiment.
Figure 11.
Comparison of temperature rise and simulation temperature rise of 0.5 C rate charging experiment.
Figure 12.
Comparison of temperature rise and simulation temperature rise of 1 C rate charging experiment.
Figure 12.
Comparison of temperature rise and simulation temperature rise of 1 C rate charging experiment.

Figure 13.
Comparison of temperature rise and simulation temperature rise of 2 C rate charging experiment.
Figure 13.
Comparison of temperature rise and simulation temperature rise of 2 C rate charging experiment.
Figure 14.
Battery pack temperature distribution without cooling device (a) 0.5 C charging rate. (b) 1 C charging rate. (c) 2 C charging rate.
Figure 14.
Battery pack temperature distribution without cooling device (a) 0.5 C charging rate. (b) 1 C charging rate. (c) 2 C charging rate.
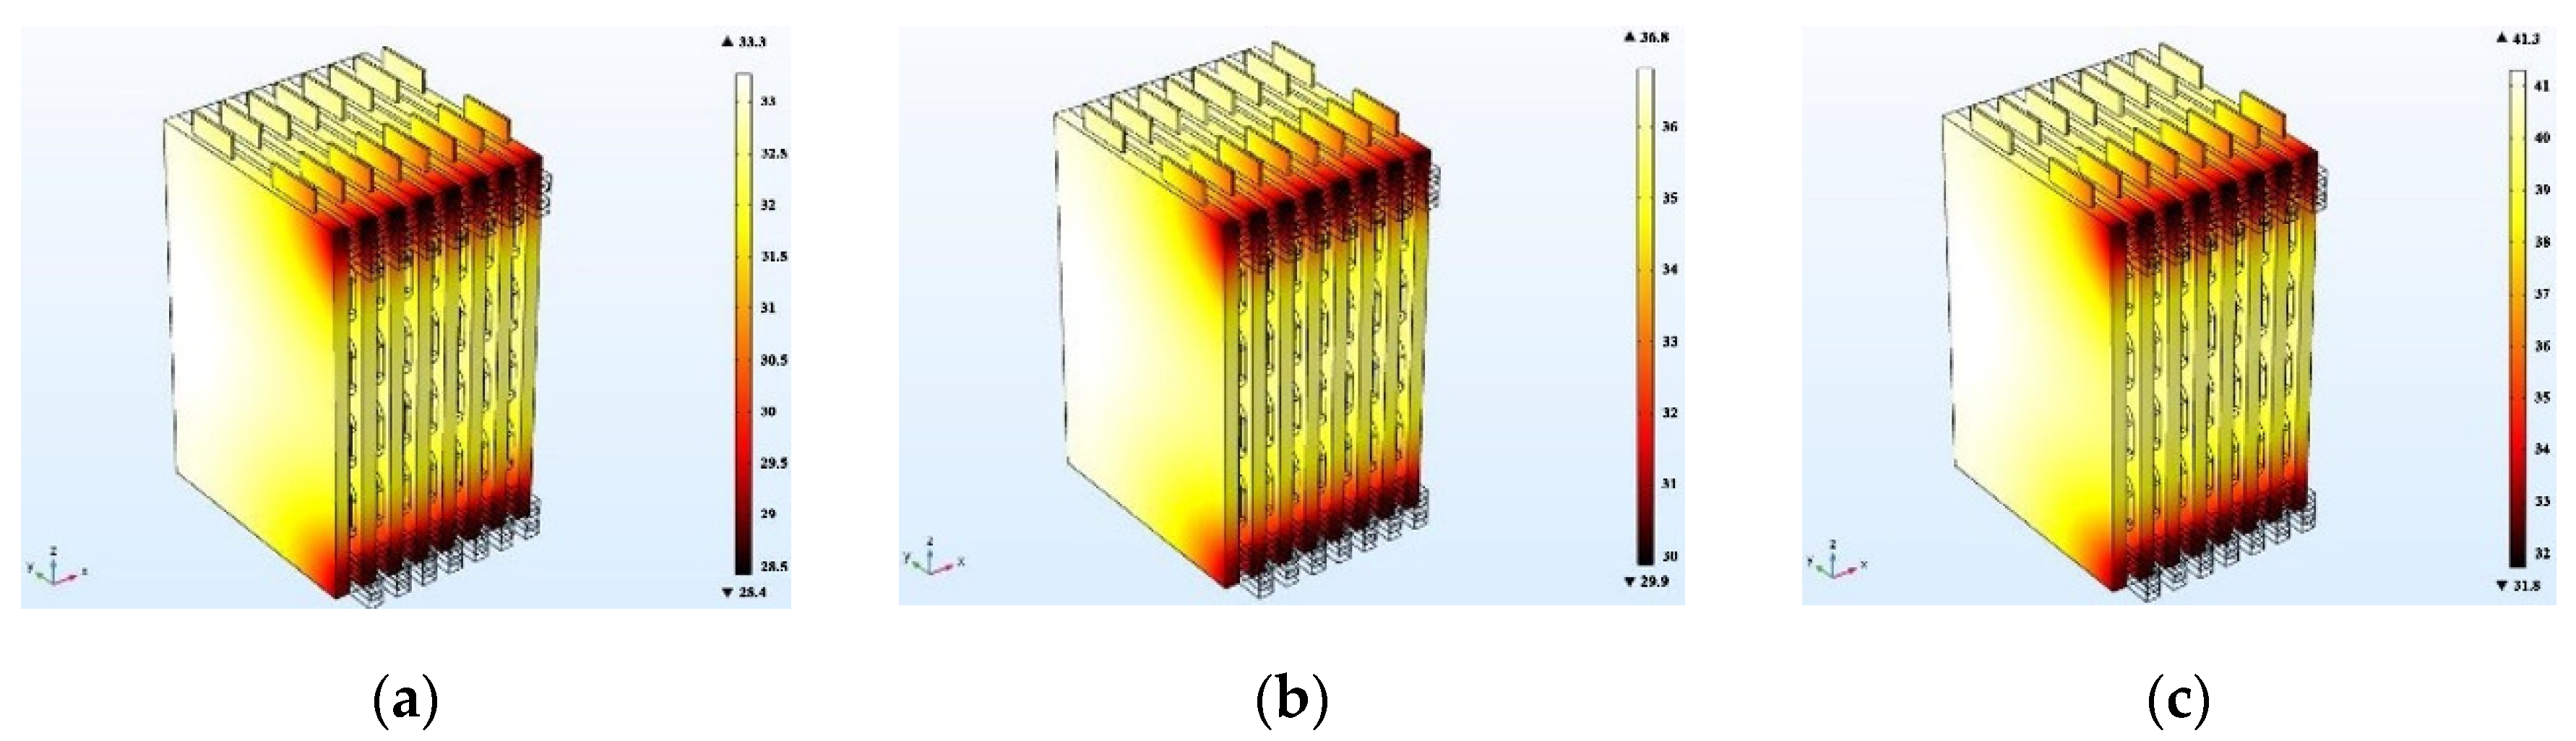
Figure 15.
Battery pack temperature distribution at nine different flow rates.
Figure 16.
Battery pack temperature versus flow rate curve.
Figure 17.
Relationship between temperature rise and distance from the center of the battery pack.
Figure 18.
Relationship between average temperature difference and distance from the center at different flow velocities.
Figure 18.
Relationship between average temperature difference and distance from the center at different flow velocities.
Figure 19.
Temperature distribution of battery packs with different channel widths.
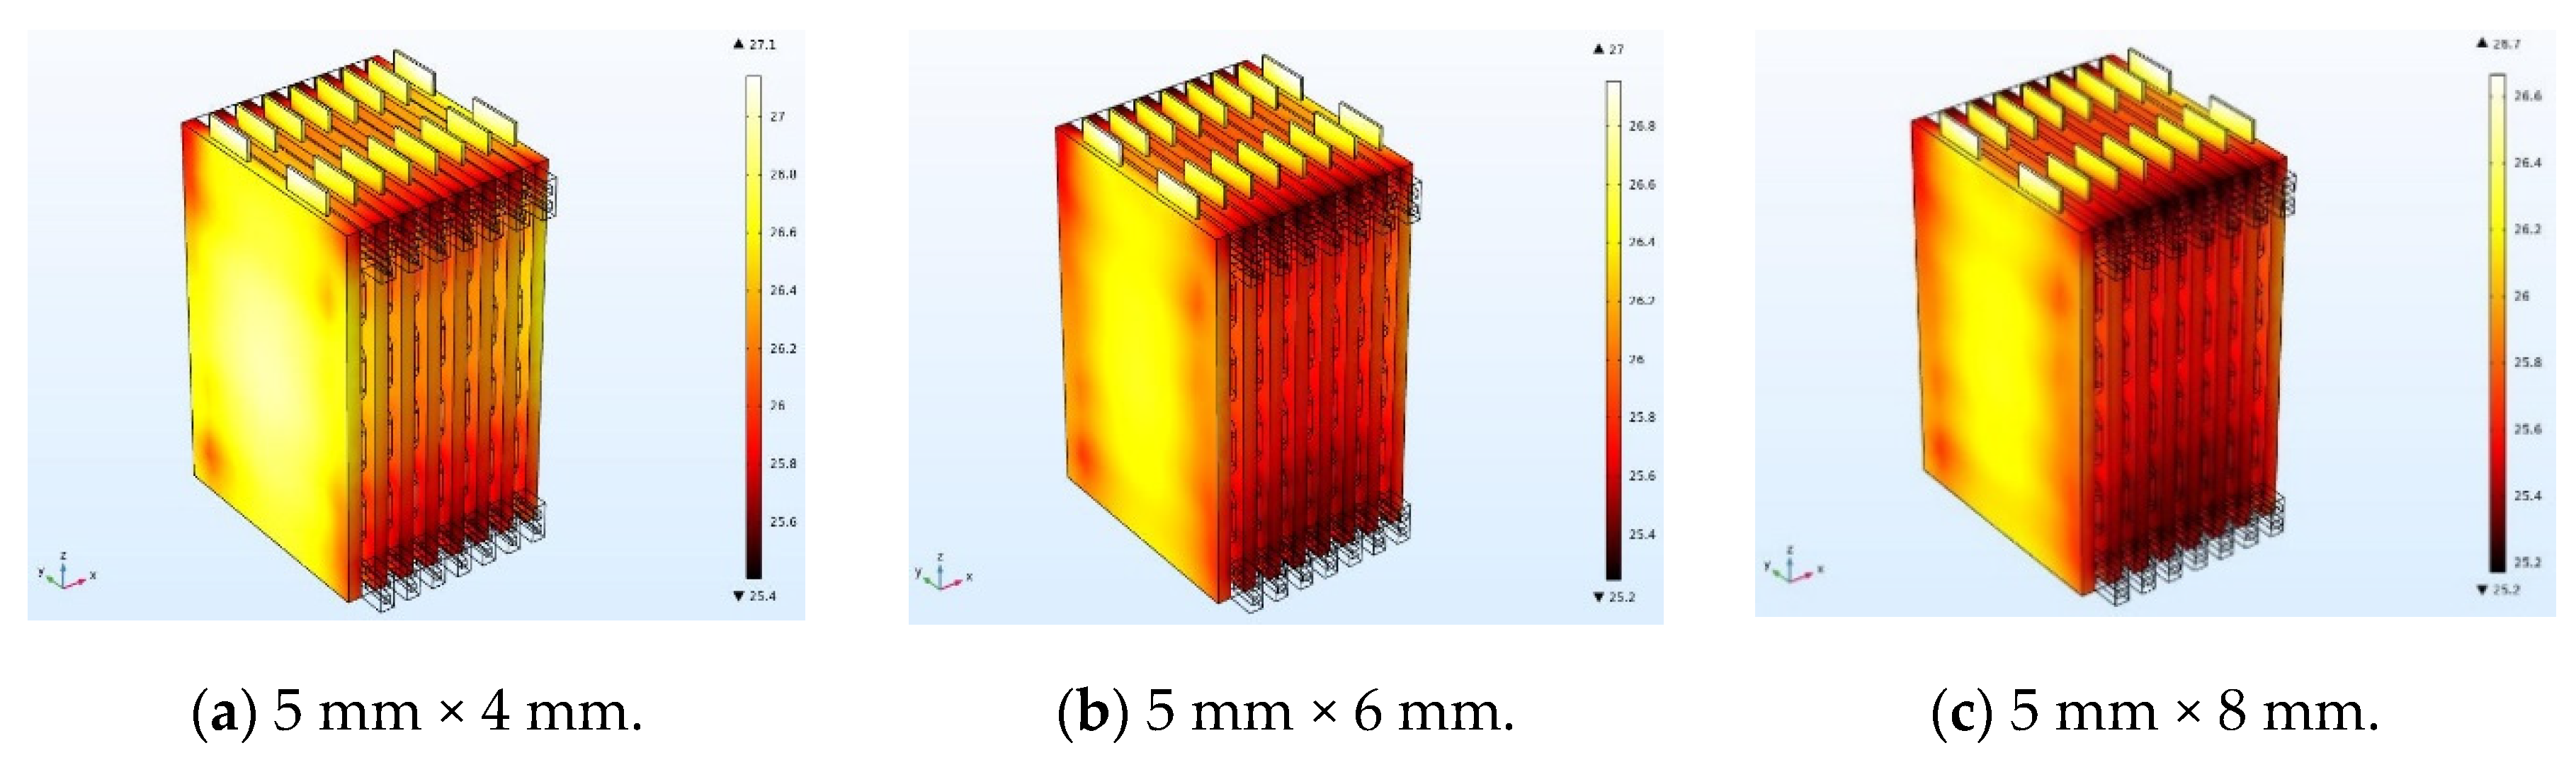
Figure 20.
Relationship between temperature rise and distance from the center of the battery pack.
Figure 21.
Relationship between average temperature difference and distance from the center for channel widths.
Figure 21.
Relationship between average temperature difference and distance from the center for channel widths.
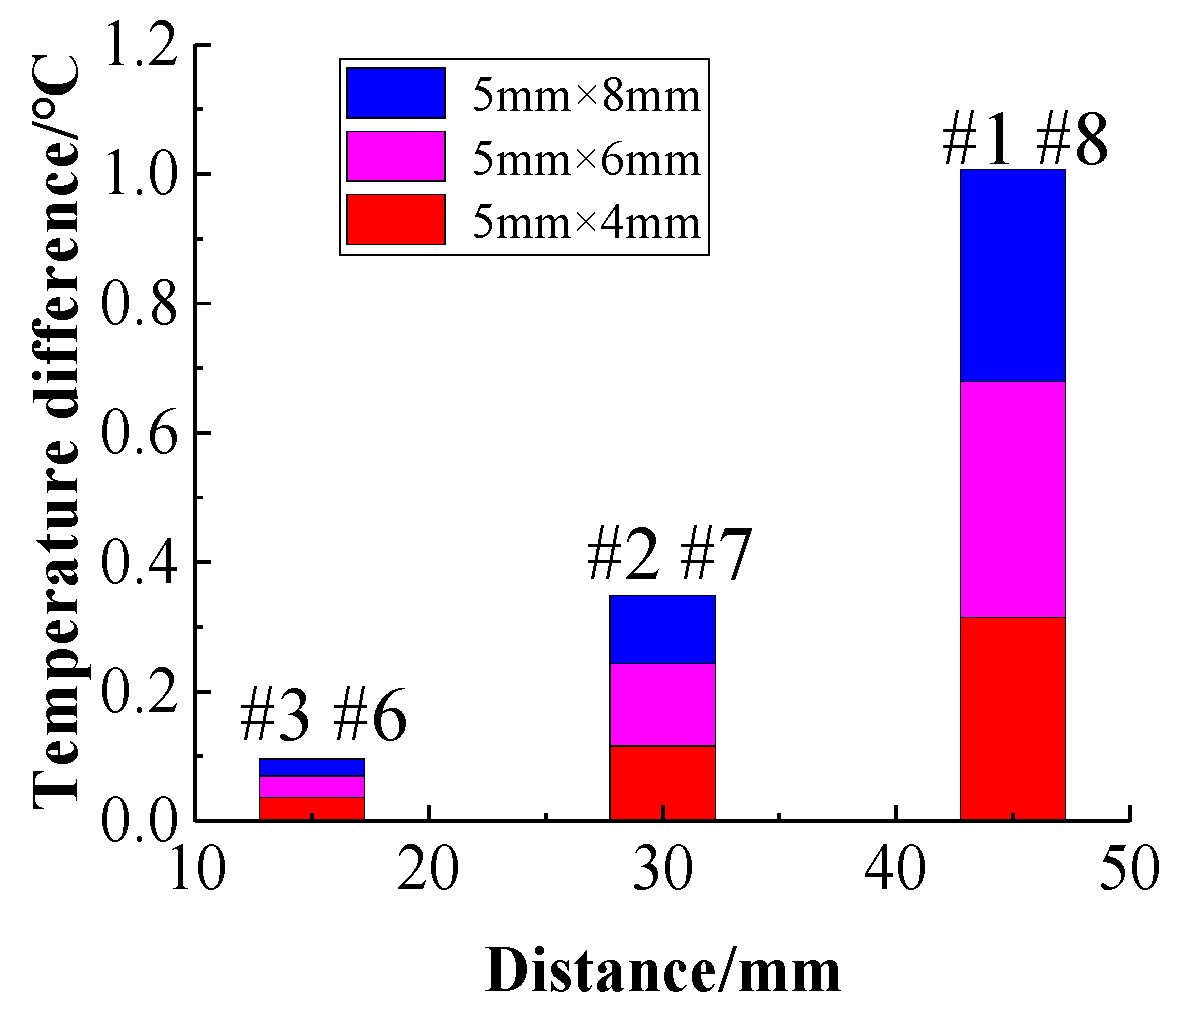
Figure 22.
Battery pack temperature distribution at three different charging rates. (a) 0.5 C charging rate. (b) 1 C charging rate. (c) 2 C charging rate.
Figure 22.
Battery pack temperature distribution at three different charging rates. (a) 0.5 C charging rate. (b) 1 C charging rate. (c) 2 C charging rate.
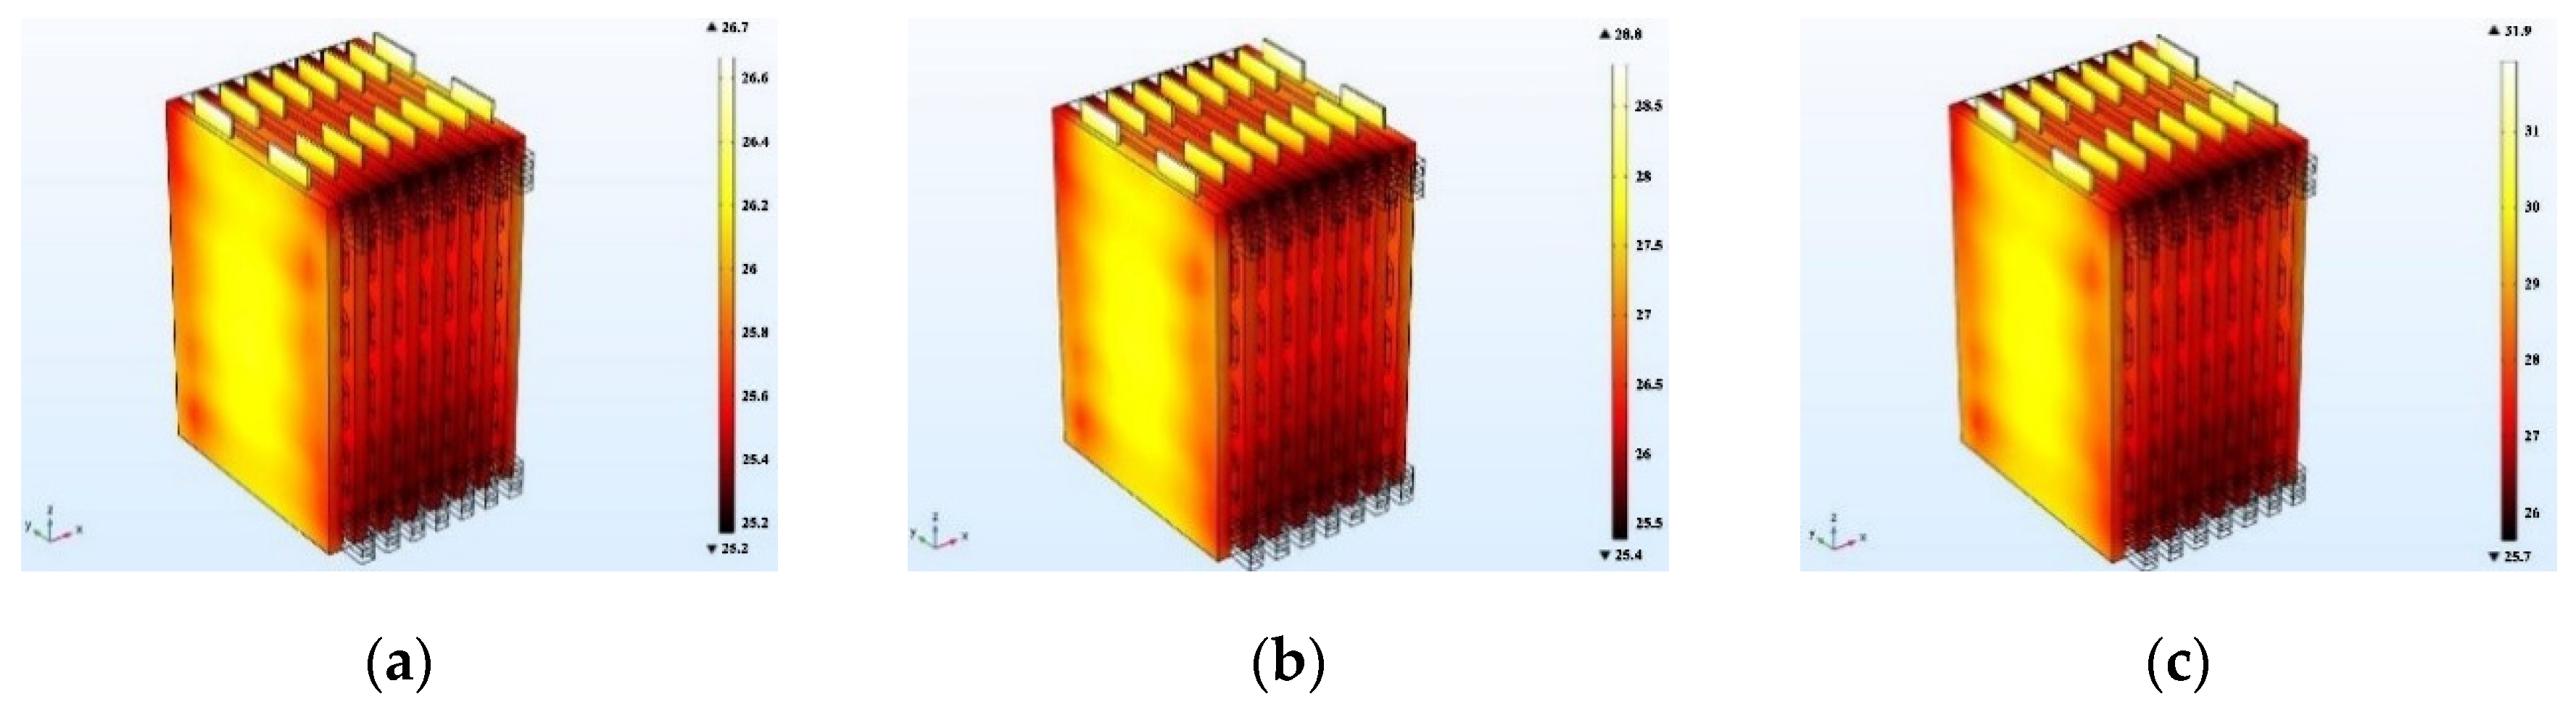
Figure 23.
Relationship between battery temperature rise and center distance at different charging rates. (a) 0.5 C charging rate. (b) 1 C charging rate. (c) 2 C charging rate.
Figure 23.
Relationship between battery temperature rise and center distance at different charging rates. (a) 0.5 C charging rate. (b) 1 C charging rate. (c) 2 C charging rate.
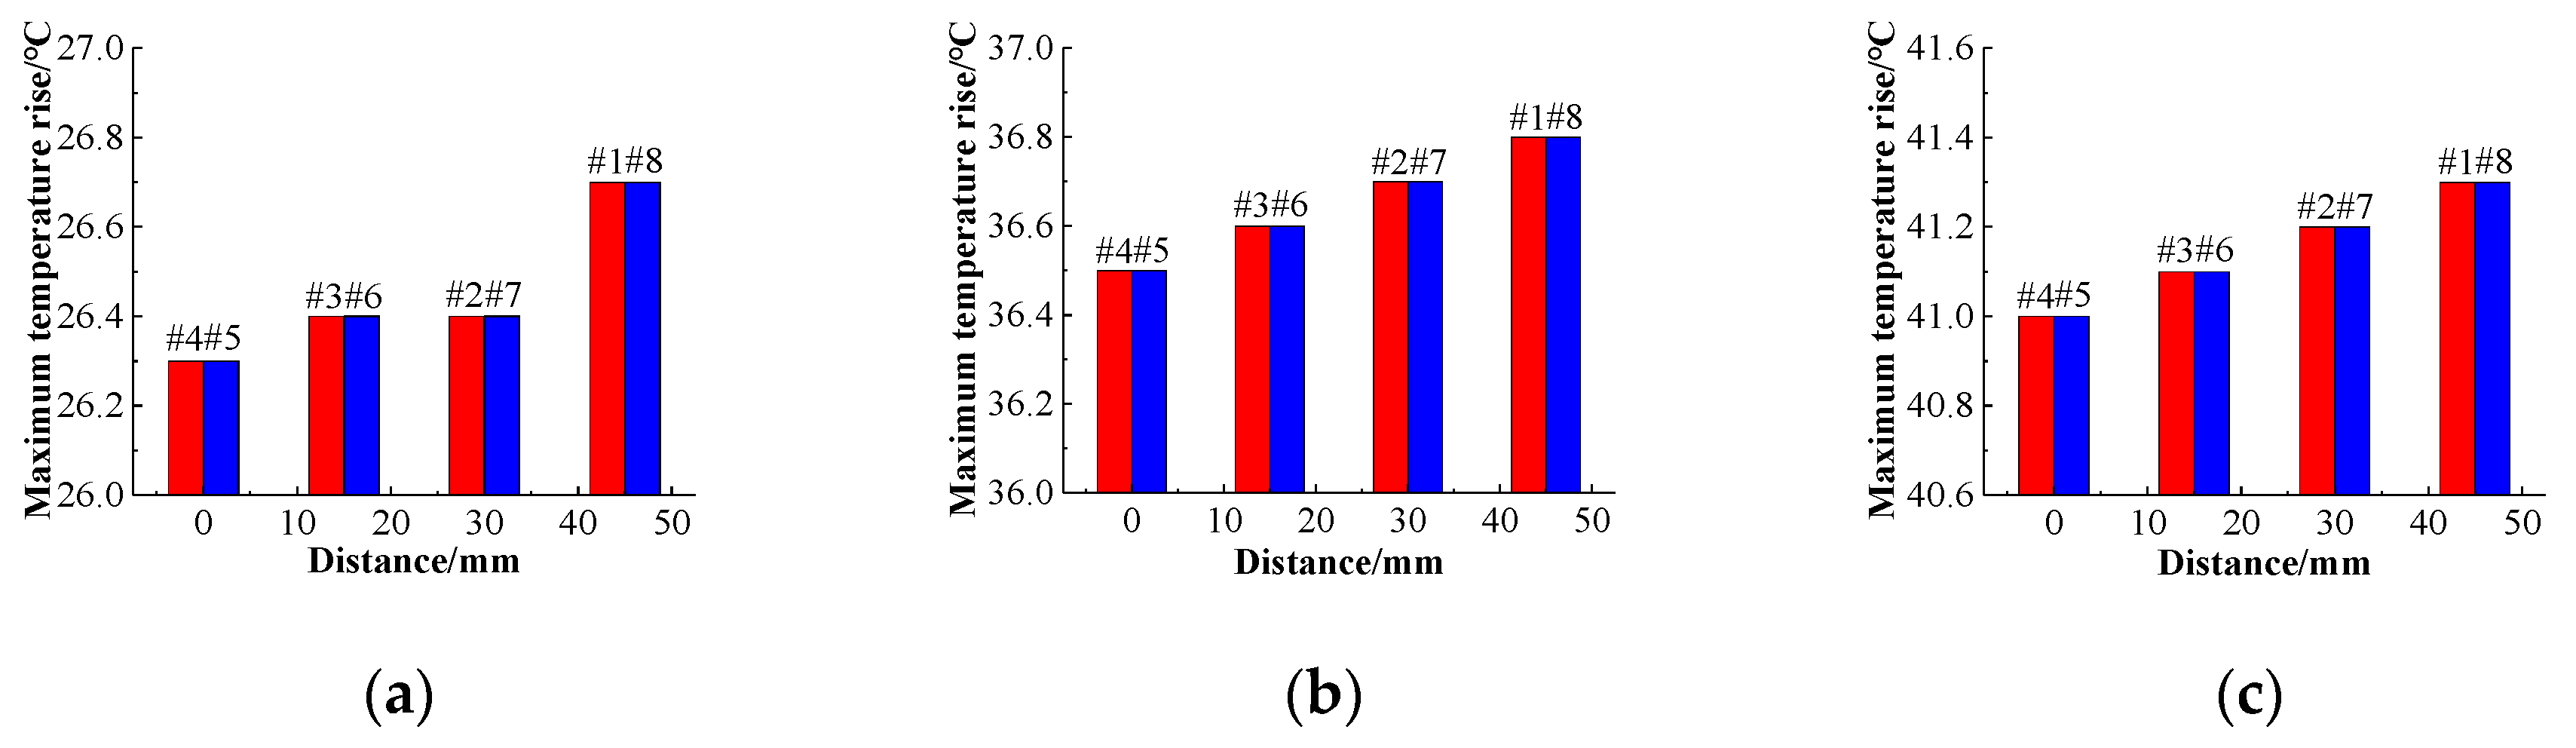
Figure 24.
Relationship between average temperature difference and center distance at different charging rates.
Figure 24.
Relationship between average temperature difference and center distance at different charging rates.
Figure 25.
Cooling battery pack temperature comparison at different charging rates. (a) Maximum temperature. (b) Maximum temperature difference.
Figure 25.
Cooling battery pack temperature comparison at different charging rates. (a) Maximum temperature. (b) Maximum temperature difference.
Figure 26.
Battery pack temperature distribution at different inlet cooling temperatures. (a) inlet temperature 25 °C. (b) inlet temperature 20 °C. (c) inlet temperature 15 °C.
Figure 26.
Battery pack temperature distribution at different inlet cooling temperatures. (a) inlet temperature 25 °C. (b) inlet temperature 20 °C. (c) inlet temperature 15 °C.

Figure 27.
Relationship between temperature rise of battery at different inlet cooling temperatures. (a) inlet temperature 25 °C. (b) inlet temperature 20 °C. (c) inlet temperature 15 °C.
Figure 27.
Relationship between temperature rise of battery at different inlet cooling temperatures. (a) inlet temperature 25 °C. (b) inlet temperature 20 °C. (c) inlet temperature 15 °C.
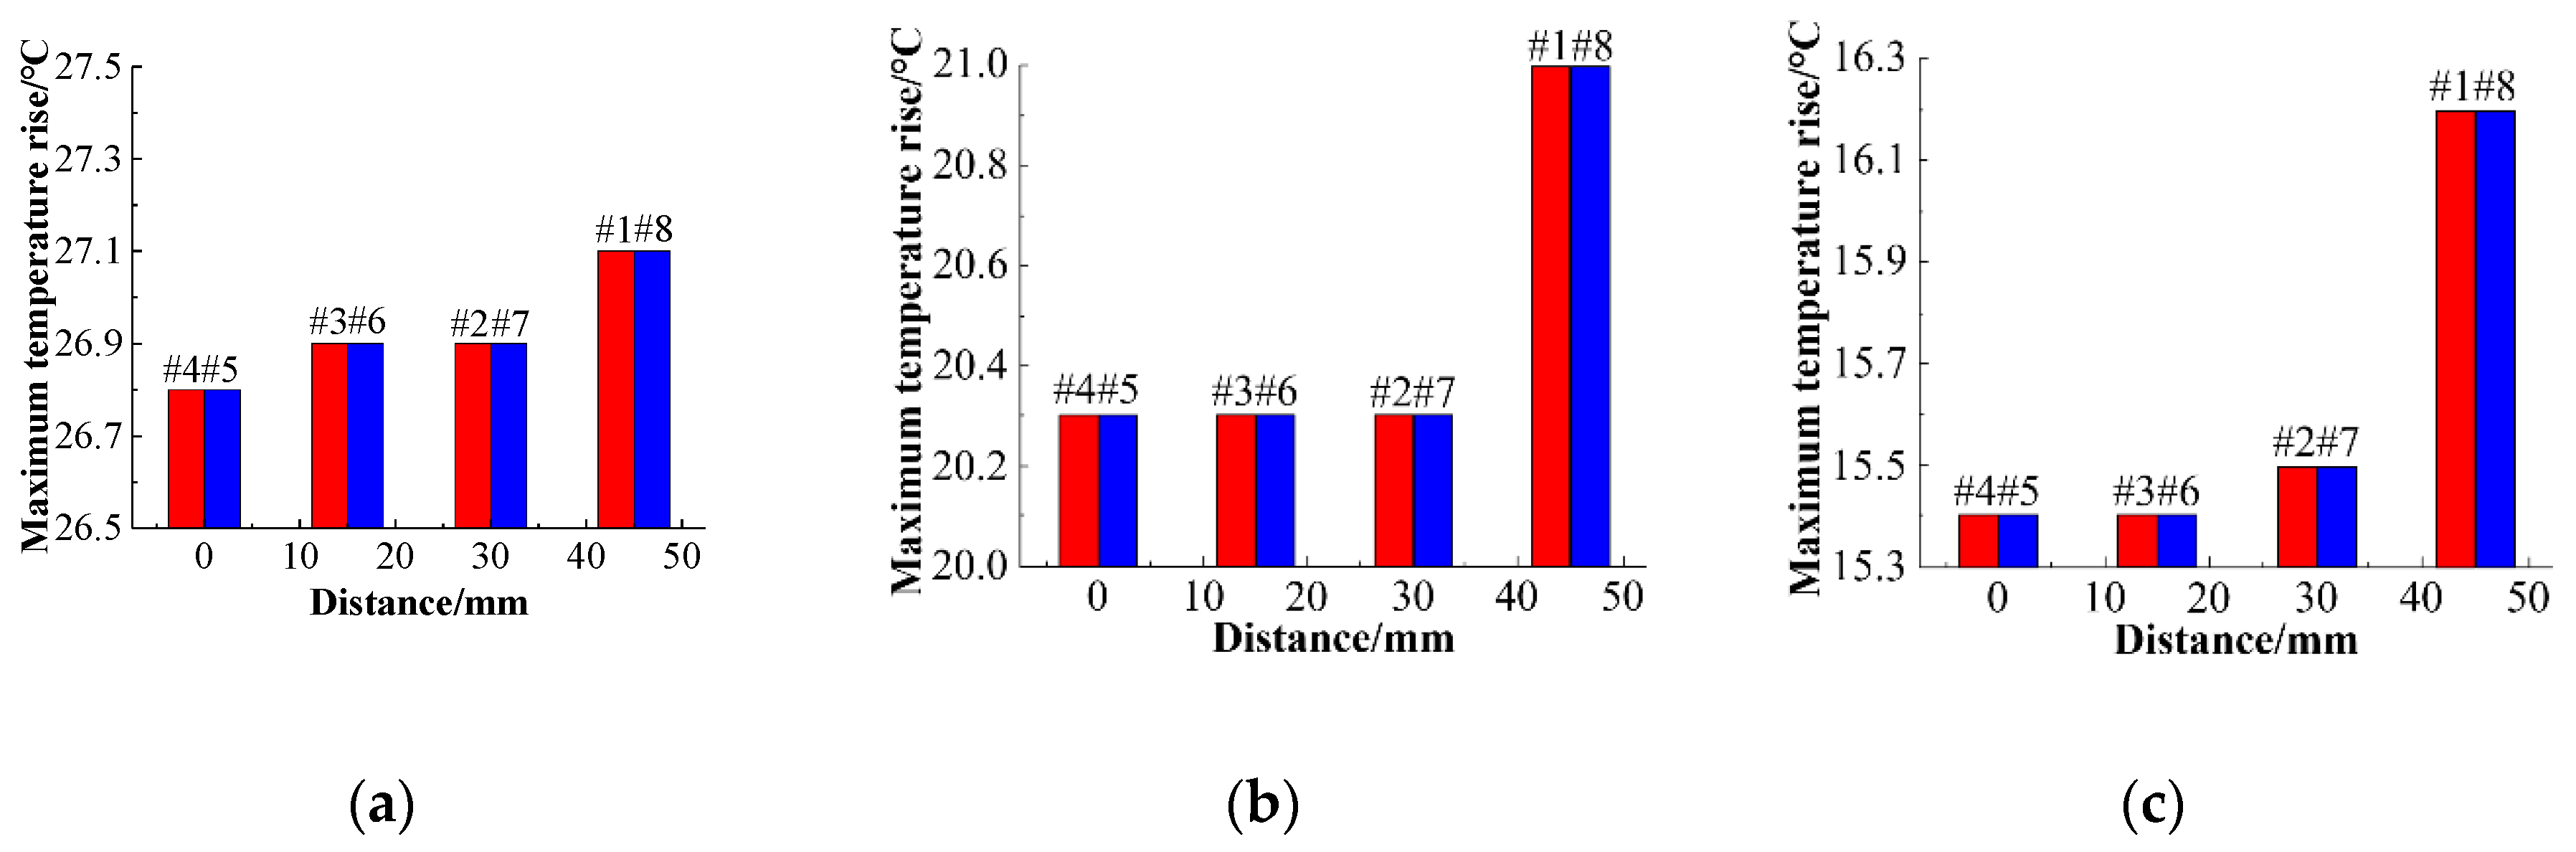
Figure 28.
Relationship between average temperature difference and center distance at different inlet cooling temperatures.
Figure 28.
Relationship between average temperature difference and center distance at different inlet cooling temperatures.

Table 1.
Parameters used in the battery one-dimensional electrochemical model.
| Parameter (Unit) | Cathode (LiFePO4) | Separator | Anode (LixC6) |
|---|---|---|---|
| σ (s/m) | 0.1 | 100 | |
| C1,0 (mol/m3) | 21190 | 1000 | 31507 |
| αc, αa | 0.5 | 0.5 | |
| Β (m2.5mol0.5/s) | 5 × 10⁻¹¹ | 2 × 10⁻¹¹ | |
| t+ | 0.363 | ||
| ε | 0.3 | 0.4 | 0.3 |
Table 2.
Parameters used in the battery three-dimensional thermal model.
| Ingredient | Material | Thermal Conductivity W/(m·K) | Density kg/m3 | Specific Heat Capacity J/(kg·K) |
|---|---|---|---|---|
| Electrolyte | LiPF6 | 0.6 | 1130 | 2055 |
| Separator | PP/PE/PP | 0.334 | 1009 | 1978 |
| Anode | LiFePO4 | 1.48 | 800 | 2100 |
| Al CC | 170 | 2700 | 875 | |
| Cathode | graphite | 1.04 | 1347 | 1437 |
| Cu CC | 398 | 8900 | 385 |
Table 3.
Basic parameters of 30 Ah pouch LiFePO4 lithium-ion battery.
| Parameter | Value |
|---|---|
| Weight (g) | 795 ± 2 |
| Dimensions (mm) | 251 × 174 × 10.2 max |
| Nominal capacity (Ah) | 30 |
| Nominal voltage (V) | 3.2 |
| Charge cut-off voltage (V) | 3.65 |
| Discharge cut-off voltage (V) | 2.0 |
| Operating temperature (°C) | Charge: 0~45 °C Discharge: −20~60 °C |
| Standard charge | Constant current at 0.3 C with max. voltage of 3.65 V and cut-off current at 0.02 C |
Table 4.
Relevant equipment parameters.
| Items | Values |
|---|---|
| Battery tester | Voltage range: 0~5 V Current range: 0~300 A Channel number: 4 |
| High-low temperature alternating damp-heat test chamber | Constant temperature range: −40~+100 °C Temperature error: <2 °C Studio dimensions (m): 0.5 × 0.5 × 0.6 |
© 2020 by the authors. Licensee MDPI, Basel, Switzerland. This article is an open access article distributed under the terms and conditions of the Creative Commons Attribution (CC BY) license (http://creativecommons.org/licenses/by/4.0/).
Share and Cite
MDPI and ACS Style
Du, J.; Sun, Y.; Huang, Y.; Wu, X. Analysis of Influencing Factors of Thermal Management System for LiFePO4 Lithium Battery under High Power Charging. World Electr. Veh. J. 2020, 11, 44. https://doi.org/10.3390/wevj11020044
AMA Style
Du J, Sun Y, Huang Y, Wu X. Analysis of Influencing Factors of Thermal Management System for LiFePO4 Lithium Battery under High Power Charging. World Electric Vehicle Journal. 2020; 11(2):44. https://doi.org/10.3390/wevj11020044
Chicago/Turabian StyleDu, Jiuyu, Yizhao Sun, Yingxuan Huang, and Xiaogang Wu. 2020. "Analysis of Influencing Factors of Thermal Management System for LiFePO4 Lithium Battery under High Power Charging" World Electric Vehicle Journal 11, no. 2: 44. https://doi.org/10.3390/wevj11020044