Stand-Alone Battery Thermal Management for Fast Charging of Electric Two Wheelers—Integrated Busbar Cooling †


German Aerospace Center, Institute of Vehicle Concepts, 70569 Stuttgart, Germany
*
Author to whom correspondence should be addressed.
†
This paper is an extended version of a paper presented at the 31st International Electric Vehicle Symposium & Exhibition and International Electric Vehicle Technology Conference 2018 (EVS 31 & EVTeC 2018), Kobe, Japan, 1–3 October 2018.
World Electr. Veh. J. 2019, 10(2), 37; https://doi.org/10.3390/wevj10020037
Submission received: 18 April 2019
/
Revised: 29 May 2019
/
Accepted: 30 May 2019
/
Published: 4 June 2019
(This article belongs to the Special Issue Selected Papers from The 31st International Electric Vehicles Symposium and Exhibition (Kobe, Japan))
Abstract
:This paper presents a thermal interface for cylindrical cells using busbar-integrated cooling channels. This interface is available due to the use of a stand-alone refrigerant circuit for the thermal management of the battery. A stand-alone refrigerant circuit offers performance and efficiency increases compared to state-of-the-art battery thermal management systems. This can be achieved by increasing the evaporation temperature to the requirements of the Li-ion cells and the use of alternative refrigerants. The solution proposed in this paper is defined for electric two-wheelers, as the thermal management of these vehicles is currently insufficient for fast charging where high heat losses occur. Three channel patterns for the integrated busbar cooling were examined regarding their thermal performance to cool the li-ion cells of a 16p14s battery pack during fast charging. A method of coupling correlation-based heat transfer and pressure drop with thermal finite element method (FEM) simulations was developed. The symmetric channel pattern offers a good compromise between battery temperatures and homogeneity, as well as the best volumetric and gravimetric energy densities on system level. Average cell temperatures of 22 °C with a maximum temperature spread of 8 K were achieved.
Keywords:
two-wheeler; thermal management; battery; busbar; thermal interface; Li-ion; fast charging1. Introduction
Charging times of 15 min are aspired by car manufacturers [1] and suppliers [2] for future vehicles to shorten the waiting time for customers while charging. Especially in electric two-wheelers, fast charging is a key technology to increase the attractiveness as range and thus battery capacities are limited due to volume and mass constraints. Customer surveys of a German pilot project with electric scooters [3] have shown that 80% of the 293 interviewed persons rated the charging time as “too long” or “rather too long”. The charging duration was between three and five hours to reach ranges of 20 to 70 km. According to the study, this is especially critical as the range was also rated by the customers as too short.
Regarding both vehicle classes, the fast charging procedure will be confronted with large waste heat losses. The heat generation, depending on the internal resistance of the cells and resistances of the electric contacts, is manifested as Joule heat [4]. The Mahle Behr chiller system [5] estimates required cooling capacities of 12 kW for battery cooling during a 15 min charge of an automobile with a 100 kWh battery capacity. This would outperform the available cooling capacity of current HVAC (heating, ventilation, and air conditioning) systems, which can supply up to 8 kW during cabin cooldown.
Keeping in mind that steady-state cabin cooling will require an additional power of 3 kW and that battery cell aging may double the battery heat losses, it is not possible to use current automotive battery thermal management systems for fast charging with more than 2C (a current which is twice the battery capacity).
The air cooling [6] and passive cooling systems used for the battery of current electric two-wheelers cannot cope with high waste heat losses. The cylindrical cells used in many electric scooters and motorcycles show higher internal resistances than automotive cells, resulting in even larger relative waste heat.
To allow the fast charging of electric two-wheelers, a stand-alone refrigerant cycle for the thermal management of the battery has already been proposed by the authors [7]. This paper presents the comparison of three design variations of a new thermal interface directly resulting from this approach. The thermal simulations were conducted with the software ANSYS Mechanical to simulate the heat conduction coupled with correlations to calculate the heat transfer coefficient as well as the pressure loss and the associated evaporation temperature.
2. State of the Art
The most advanced battery thermal management systems are currently implemented automotive battery systems. Automotive battery thermal management systems are coupled with the HVAC system which was originally used to climatize the cabin. This allows the cooling of the battery even in extreme environmental conditions. But as the temperature level (−5 to 0 °C) and thus the pressure of the refrigerant circuit are adjusted to the HVAC, these systems do not utilize the full potential of the refrigerant circuit. In electric two-wheelers, there is no cabin and thus no HVAC. For electric two-wheelers, the most advanced thermal management systems are based on air cooling. Three state-of-the-art types of battery thermal management systems are presented in this chapter.
2.1. Automotive Battery Cooling Systems
The Mahle Behr chiller system [8] is used in plug-in hybrids and electric vehicles. The temperature control is established with a water/glycol circuit. To cool the battery, the circuit is coupled with the HVAC via a plate heat exchanger with an integrated expansion valve (called chiller) and a radiator integrated in the circuit (see Figure 1a).
The heating of the battery is usually applied by positive temperature coefficient (PTC) heaters. At suitable ambient temperatures, the battery can dissipate the heat via the radiator. For high temperatures, the heat is dissipated via the chiller. The cooling circuit allows low fluid pressures and easy control of the battery temperatures. Disadvantages are the numerous heat transmissions (battery cell to cooling circuit, cooling circuit to HVAC, HVAC to ambient) and the resulting temperature levels as well as a specific cell temperature inhomogeneity due to the temperature increase of the cooling fluid.
The direct evaporation system [8] depicted in Figure 1b cools the battery with a refrigerant evaporator which is often integrated in a cooling plate. This cooling system has been applied, for example, in the battery of the BMW i3 [9]. The phase change of the refrigerant in the cooling plate offers high heat transfer coefficients and homogeneous cell temperatures as, for low pressure drops, the temperature is almost constant during phase change. However, the cooling plate and tubing must withstand the higher system pressure (current refrigerants: up to 20 bar), and water condensation can occur on the cooling plate at high humidity conditions.
2.2. Air Cooling in Electric Two-Wheelers
The air cooling of a battery pack in a commercial electric two-wheeler was demonstrated in the BMW C evolution electric scooter [6]. As shown Figure 2b, the prismatic cells are separated into two modules which are both cooled at the bottom. For the upper module, a channel is integrated into the structure, the lower module uses cooling fins.
Another solution is the exposure of the cylindrical cells to the surrounding air by leaving gaps between the lateral cell surfaces for the air flow. A student team at the University of Twente in the Netherlands [10] followed this approach. The cells are protected from gravel and dispersed road objects by filters (Figure 2a).
Both solutions face long-term dust and dirt contamination of the cooling structures. As forced convection during charging is only possible with additional fans, an increased noise level is expected. Air cooling is not capable of an environment-independent temperature control and temperature inhomogeneities will result from the low thermal capacity and heat transfer coefficients of air.
3. Stand-Alone Battery Thermal Management
A stand-alone refrigerant circuit for the thermal management of the battery was proposed by the authors [7]. A stand-alone system with integrated heat pump functionality is depicted in Figure 3. It offers several advantages, but also disadvantages, which are listed in this chapter. The order does not represent the importance, as it depends heavily on the goals of the application.
3.1. Integration of Battery Thermal Management in Drivetrain Cooling Circuits
During charging, the drivetrain cooling circuit is not required for the electric motor or power electronics cooling. The battery and onboard charger cooling systems can utilize it. The drivetrain cooling radiator only needs to be enlarged slightly, as battery waste heat is less in driving operation compared to fast charging. Coupling the two circuits offers the possibility to use drivetrain waste heat and thermal mass for battery heating (Figure 3).
3.2. Increasing the Performance and Efficiency and Using Alternative Refrigerants
Using a stand-alone refrigerant circuit for the battery thermal management allows to adjust the evaporation temperature to the required battery temperature of 23 °C [11]. By increasing the evaporation temperature, the cooling capacity, as well as the energy efficiency, is increased compared to a conventional air conditioning system. A comparison of seven low-GWP (global warming potential) refrigerants for a standalone battery thermal management can be found in [7]. There, it was suggested to use propane for the further investigations because of its high volumetric cooling capacity and moderate pressure levels as well as low electric conductivity. Especially for the use in electric two-wheelers, where mostly no cabin exists, the flammability of propane is not a no-go argument.
3.3. Noise Reduction
Dissipating large heat flows in a standing vehicle is only possible by either increasing the radiator size, the fan performance, or the temperature level. The first measure will increase the required space and possibly the drag coefficient, and the second measure will increase the noise level. The temperature level only depends on the operating conditions of the refrigerant circuit. Increasing the condensation temperature will mainly reduce the energy efficiency and will have minor effects on the cooling capacity of a stand-alone system.
3.4. Reduction of Refrigerant Charge
The adaption of the evaporation temperature and a short distance between evaporator and condenser of the battery thermal management lead to shorter tubing and hose lines in comparison to using the air conditioning refrigerant circuit. This results in smaller refrigerant charges.
3.5. Decreased Water Condensation on Cooling Structures
Due to the evaporation temperatures of the stand-alone battery cooling system, condensation is prevented in most climate conditions. Thus, the integration of cooling structures into the battery is simplified.
3.6. Additional Components
The big drawback of a stand-alone battery thermal management is the installation space, mass, and cost of the additional components, such as compressor, condenser, and (expansion) valves. The components can be downsized due to the cooling performance increase of the adapted evaporation temperature and the use of alternative refrigerants. Refrigerant costs can be cut down by using natural refrigerants.
3.7. Flammability of Alternative Refrigerants
The flammability of natural refrigerants such as propane poses another issue. Flammable fluids are not allowed in HVAC systems, as the refrigerant can contaminate the cabin in case of a crash. Quantities below 150 g require no additional safety features [12] and should be aspired for stand-alone battery thermal management systems if we consider the application in electric two-wheelers.
4. Integrated Busbar Cooling
The best thermal conductivity of the windings of a cylindrical li-ion cell to the outside surfaces is along the winding axis. As many cylindrical cells connected in parallel are needed to increase the battery capacity, metal sheets are mostly used as busbars. The idea is to design an evaporator as a busbar. Due to the low electric conductivity of propane, it makes sense to think about the possibility to integrate the cooling plate into the busbar. This is only possible with a stand-alone battery thermal management system as the evaporation temperature is for most of the environmental conditions above the condensation point. Roll bonding was chosen as the production method of the busbars. This technique allows the cost-efficient integration of cooling channels into aluminum sheets. Figure 4 shows the design of an integrated bus bar cooling as well as the refrigerant flow pattern and the electrical connection system of the cylindrical cells.
The refrigerant inlet at the first busbar at the bottom acts also as the positive terminal. The busbars conduct the refrigerant on the bottom side along the longitudinal axis of the battery pack. Between the busbars, the refrigerant flow is guided through non-conducting tubes, which are not displayed in the figure. The 8th busbar at the bottom, which also acts as the negative terminal, directs the refrigerant to the top side where the refrigerant flows in the opposite direction. This conduction of the refrigerant flow counteracts the decreasing evaporation temperatures caused by the pressure drop of each busbar. By reversing the flow, the evaporation temperatures on top of and at the bottom of the cells are balanced. In this paper, three different channel patterns are investigated concerning the application in an electric two-wheeler vehicle.
This chapter contains the boundary conditions as well as the methodology and the results of the conducted simulations to assess an optimal channel layout for the busbar cooling.
4.1. Boundary Conditions
The battery system is defined for a small electric scooter with a battery configuration of 14 serial connected modules consisting of 16 parallel connected cells (16p14s). This configuration results in a system voltage of 50.4 V and a capacity of 48 Ah. The cells (Samsung INR18650-30Q) have a capacity of 3 Ah, an inner resistance at the beginning of life (BOL) of 19.94 mΩ, which was adjusted upward to 20 mΩ for the simulations. The temperature and state-of-charge dependencies of the inner resistance were disregarded. The heat generation was calculated based on the Joule heat of the cells. Using the internal resistance and the charging current for a 15 min fast charge (12 A per cell), a total heat flow of 645 W was generated in the battery system. The cells were simulated with a simplified model, taking into account the directional heat conduction coefficients of the cell winding and the limited surface on top of the cells. According to Wiebelt [13], the heat conduction coefficient in the winding can differ from 20 to 50 W/mK in the axial direction and from 0.5 to 2 W/mK in the radial direction. These variations are caused by the composition of the cell winding. The mean values were used for the simulations (see Table 1) as no data for the simulated cell was available.
Figure 5b shows the sectional view of the cell model. The cell diameter is 18 mm, and the height is 65 mm. The cell winding has an inner diameter of 4.4 mm. The stainless-steel cell casing has a thickness of 0.5 mm. These measurements were taken from Tahir [14] for a 26650 cell and are applicable to the used cell. The cell winding was simplified to a solid with directional heat conduction. The top and bottom sections of the cells were simplified. The insulation on top of the cell was not modeled separately, but the reduced area was taken into account by a buckling with a diameter of 7.5 mm and a height of 0.2 mm. The cell winding stretches into the complete cell casing. The notch at the head of the lateral area is not modelled to save computation time. The inlet conditions of the refrigerant flow can be found in Table 1. The mass flow is defined for a small rolling piston compressor. The inlet vapor fraction was calculated using a one-stage refrigerant cycle with a condensation temperature of 55 °C and isenthalpic expansion.
The roll bonding has several restrictions, which are displayed in Figure 6. The distance between the outer perimeter of the channel and the rectangular holes must not be lower than 5 mm. The same applies to the distance between the channel and the edge of the busbar.
The inner channel width was defined to be 8 mm with a height of 1.5 mm. The overall thickness of the sheets was defined to 2 mm to allow pressures of approximately 20 bar.
4.2. Geometric Variations
Three channel configurations were investigated. Each consisted of 15 busbars, 13 of which interconnect 32 cells in a 16p2s configuration. The first and eighth busbar only interconnect 16 cells acting as positive and negative terminals. Figure 7 and Figure 8 show technical drawings of the repeating units of the different channel patterns.
In the first geometry, a cooling channel was placed between each cell. The inlets and outlets of the refrigerant were relocated along the streaming direction, thus making it necessary to have additional mirror-inverted busbars, which can be seen in Figure 7. The distance between the cell rows was set to 2 mm, whereas the distance of the columns was limited to 6 mm due to the distance of the channels to the rectangular hole for the electric cell contacts. The overall channel length of pattern 1 was 8.54 m.
In the channel pattern shown in Figure 8a, the channels were placed between every second row. This allowed to decrease the column distance to 2 mm where no channel was located. The cell distance at the channel was still 6 mm. The busbar inlet and outlet were located on the same side, resulting in the same busbar pattern for the whole battery pack. The overall channel length of pattern 2 was 5.62 m.
The third channel pattern, shown in Figure 8b, placed the cooling channel at every third battery row. The cell row and column distance were the same as in pattern 1 because of the alternating inlet and outlet position. This also made it necessary to add additional mirror inverted busbars. The overall channel length of pattern 3 was 5.36 m.
4.3. Target Values
According to Eberleh [11] and Vetter [15], the aging of li-ion cells is reduced if the cells are operated at 23 °C. The temperature distribution of the cells in a battery system should be kept homogeneous to avoid different aging rates. Neumeister [8] mentions a maximum temperature spread in each cell of 10 K and a maximum variation of 5 K between the cells in a pack.
4.4. Methodology
The simulations were conducted using ANSYS Mechanical to simulate the heat conduction from the cell windings to the evaporation channels. The complex heat conduction between the cell core and the busbars was calculated solving Fourier’s law stated in Equation (1) numerically with the finite elements method and a preconditioned conjugate gradient (PCG) solver.
The heat transfer coefficient and pressure drop of the evaporation channels were calculated in Scilab using the correlation of Kim and Mudawar [16]. According to Longo [17], this correlation is also applicable for propane. The heat transfer coefficient stated in Equation (2) was calculated by the superposition of the heat transfer coefficient for the nucleate boiling dominant regime and the heat transfer coefficient of the convective boiling regime .
The nucleate boiling heat transfer coefficient depends on the Boiling number the heated perimeter of channel , the wetted perimeter of channel , the reduced pressure , the vapor quality the superficial liquid Reynolds number the superficial liquid Prandtl number the heat conductivity of saturated liquid fluid , and the hydraulic diameter
The convective boiling heat transfer coefficient depends on almost the same coefficients but includes the Weber number the Lockhart-Martinelli parameter based on turbulent liquid–turbulent vapor flows and the ratio of the densities of saturated vapor to saturated liquid .
The two-phase pressure drop can be determined by integrating the relations for accelerational, gravitational, and frictional pressure gradients numerically according to
As the refrigerant flow is in the horizontal plane, the gravitational pressure gradient is neglected. The definition of the frictional pressure gradient and the accelerational pressure gradient are quite extensive and can be found in [18].
The decreasing evaporation temperature due to the pressure drop was regarded for each plate separately. The solution was calculated iteratively as shown in Figure 9 because the heat transfer coefficient and the pressure drop are influenced by the heat flow density of each busbar. High heat flows to a busbar increase the vapor fraction as well as the Boiling number . The simulations converged after 5–7 iterations, each with a duration of 10 min.
A mesh study was conducted using the grid convergence index suggested by Roache [19] and the simulation model of channel pattern 2 to solve the trade-off between computing time and the accuracy of the results. The average cell temperature was determined as a quality criterion. The results depicted in Table 2 show that Mesh 2 offers sufficient accuracy of the average cell temperature while halving the number of elements.
The Grid Convergence Index (GCI) is a measure of the percentage the computed value is away from the value of the asymptotic numerical value. With the Richardson extrapolation it is possible to obtain a higher-order estimate of the continuum value (value at zero grid spacing) of the average cell temperature from the mesh study. It has been found that Mesh 2 meets the requirements and will be used for the simulations
4.5. Results
This chapter analyses the results of the coupled simulation. The results for the module temperatures, the temperature spread in the modules, the evaporation temperature, and the volumetric as well as the gravimetric energy density of the cooling system.
4.5.1. Module Temperatures
Figure 10 shows the average module temperatures which were calculated using the temperatures of the 16 parallel cells of each module.
The lowest temperature was achieved with the channel pattern 1. However, the difference between the coolest and the hottest module was larger compared to the other patterns. The most homogeneous module temperature distribution was found in channel pattern 2, where the deviation was only 0.81 K.
The temperature spread between the hottest and the lowest temperature in a module is shown in Figure 11. For all channel patterns it is lower than the target value of 10 K. It decreases along the modules because the evaporation temperature deviation between the top and the bottom of the modules decreases. Channel pattern 2 offered the lowest temperature spread up to module 8, where the module temperature spread of channel pattern 1 was slightly lower.
4.5.2. Evaporation Temperature
Figure 12 shows that the evaporation temperature decreased due to the pressure drop of the busbars. The pressure drop increased along the busbars as the refrigerant evaporates and the vapor fraction increases. This leads to lower densities resulting in higher velocities causing higher friction losses in the channels.
As channel pattern 1 holds the longest channel length, the pressure drop, and thus the evaporation temperature decrease of 8 K, in the busbars was the highest. The temperatures in channel patterns 2 and 3 were nearly identical. At busbar 15, the highest deviation was 0.25 K.
4.5.3. Energy Density
The volumetric and gravimetric energy densities were affected by the busbar cooling. The decrease can be found in Table 3.
The busbar cooling had a major influence on the volumetric energy density of the battery system. The volumetric energy density of the cells was lowered by a factor of 2.4 to 2.7. This was caused by the design limitations of the roll bonding defining the minimum distance between the cells. The weight of the busbars is negligible compared to the cell weight; therefore, the gravimetric energy density is only slightly affected.
4.6. Discussion
Comparing the simulated channel patterns, it becomes obvious that channel pattern 2 is a good trade-off between the high cooling performance of pattern 1 and the low pressure drop of pattern 3. The channel pattern allows a slight increase in volumetric energy density and cheaper manufacturing, as only two different patterns are required.
5. Conclusions
A new thermal interface and the simulation of three different channel patterns were presented in this paper. Starting with the state-of-the-art several qualitative statements were given concerning the advantages and disadvantages of a stand-alone battery thermal management system. This was followed by the boundary conditions, a detailed description of the simulated busbar geometry and the methodology of the simulations. The simulations of an electric two-wheeler battery system showed that the busbar cooling can maintain the required temperatures and temperature homogeneity to reduce the aging of the li-ion cells. The effects on volumetric energy density due to the busbar design are high and thus should be investigated in detail. A solution would be to decrease the inner channel width and to increase inner channel height simultaneously. This would improve the volumetric energy density while maintaining a moderate pressure drop. Concerning the upcoming 2170 cells, the design limitations of roll bonding have a lower impact on the volumetric energy density, as the diameter is greater than that of the 18650 cells used in this study.
Author Contributions
Conceptualization, B.M.; methodology, B.M.; software, B.M.; formal analysis, B.M.; investigation, B.M.; resources, B.M. and M.S.; data curation, B.M.; Writing—Original Draft preparation, B.M.; Writing—Review and Editing, M.S.; visualization, B.M.; supervision, M.S. and H.E.F.; project administration, M.S. and H.E.F.; funding acquisition, M.S. and H.E.F.
Funding
This research received no external funding.
Acknowledgments
This research has been made possible thanks to the research project ‘Next Generation Car (NGC)’. We acknowledge all participating and supporting employees for the support to our research team.
Conflicts of Interest
The authors declare no conflict of interest.
References
- Reber, V. New possibilities by charging at 800 Volt. Porsche Eng. Mag. 2016, 1, 8–15. (In German) [Google Scholar]
- Ochs, T. Technological challenges and chances of Li-metal solid state batteries. In Proceedings of the Batterieforum, Berlin, Germany, 8 April 2016. [Google Scholar]
- Reichardt, K.; Schneider, U.; Dütschke, E. Electromobility on Two Wheels—Experiences from the Model Regions; Fraunhofer ISI: Karlsruhe, Germany, 2012. (In German) [Google Scholar]
- Linzen, D. Impedance-Based Loss Calculation and Thermal Model of Electrochemical Energy Storage Devices for Design Considerations of Automotive Power Systems; RWTH Aachen: Aachen, Germany, 2005. [Google Scholar]
- Wawzyniak, M.; Art, L.; Jung, M.; Ahmed, F.B. Thermal management as prerequisite for electric mobility. Automobiltechnische Zeitung (ATZ) 2017, 9, 53–57. (In German) [Google Scholar] [CrossRef]
- Ebner, C.; Danzer, K.; Platz, C. Batterie package of the E-Scotter concept from BMW motorcycles. Automobiltechnische Zeitung (ATZ) 2012, 114, 248–253. (In German) [Google Scholar]
- Mayer, B.; Schier, M.; Friedrich, H.E. Direct cooling for fast charging of electric vehicles. In Proceedings of the Conference on Future Automotive Technologies (COFAT), Fürstenfeldbruck, Germany, 8 May 2018. [Google Scholar]
- Neumeister, D.; Wiebelt, A.; Hechenberger, T. System integration of a lithium-ion battery in hybrid and electric vehicles. Automobiltechnische Zeitung (ATZ) 2010, 112, 250–255. (In German) [Google Scholar]
- Schoewel, F.; Hochgeiger, E. The high voltage batteries of the BMW i3 and BMW i8. In Proceedings of the Advanced Automotive Battery Conference, Atlanta, GA, USA, 3 February 2014. [Google Scholar]
- Electric Superbike Twente. Available online: https://electricsuperbiketwente.nl/ (accessed on 3 June 2019).
- Eberleh, B. Optimal climate for the battery. E-Mobility 2013, 2, 2–4. (In German) [Google Scholar]
- Jürgensen, H.; Tiedemann, T. Propane in hermetic refrigerant circuits and heat pumps. KI Luft- und Kältetechnik 2003, 3, 121–124. (In German) [Google Scholar]
- Wiebelt, A.; Isermeyer, T.; Siebrecht, T.; Heckenberger, T. Thermal management for lithium ion batteries. Automobiltechnische Zeitung (ATZ) 2009, 111, 500–504. (In German) [Google Scholar] [CrossRef]
- Tahir, M.W. Thermal Characterization, Multi-Scale Thermal Modeling and Experimental Validation of Lithium-Ion Batteries for Automobile Application; Institut für Chemische Verfahrenstechnik der Universität Stuttgart: Stuttgart, Germany, 2016. [Google Scholar]
- Vetter, J.; Novák, P.; Wagner, M.R.; Veit, C.; Möller, K.-C. Ageing mechanisms in lithium-ion batteries. J. Power Sources 2005, 147, 269–281. [Google Scholar]
- Kim, S.-M.; Mudawar, I. Review of databases and predictive methods for heat transfer in condensing and boiling mini/micro-channel flows. Int. J. Heat Mass Transf. 2014, 77, 627–652. [Google Scholar]
- Longo, G.A.; Mancin, S.; Righetti, G.; Zilio, C. Hydrocarbon refrigerants HC290 (Propane) and HC1270 (Propylene) low GWP long-term substitutes for HFC404A: A comparative analysis in vaporisation inside a small-diameter horizontal smooth tube. Appl. Therm. Eng. 2017, 124, 707–715. [Google Scholar]
- Kim, S.-M.; Mudawar, I. Review of databases and predictive methods for pressure drop in adiabatic, condensing and boiling mini/micro-channel flows. Int. J. Heat Mass Transf. 2014, 77, 74–97. [Google Scholar]
- Roache, P.J. Verification and Validation in Computational Science and Engineering; Hermosa: Albuquerque, NM, USA, 1998. [Google Scholar]
Figure 1.
Automotive battery cooling systems: (a) Mahle Behr chiller system; (b) direct evaporation system.
Figure 1.
Automotive battery cooling systems: (a) Mahle Behr chiller system; (b) direct evaporation system.

Figure 2.
Air cooling solutions: (a) Electric Superbike Twente; (b) BMW C evolution.
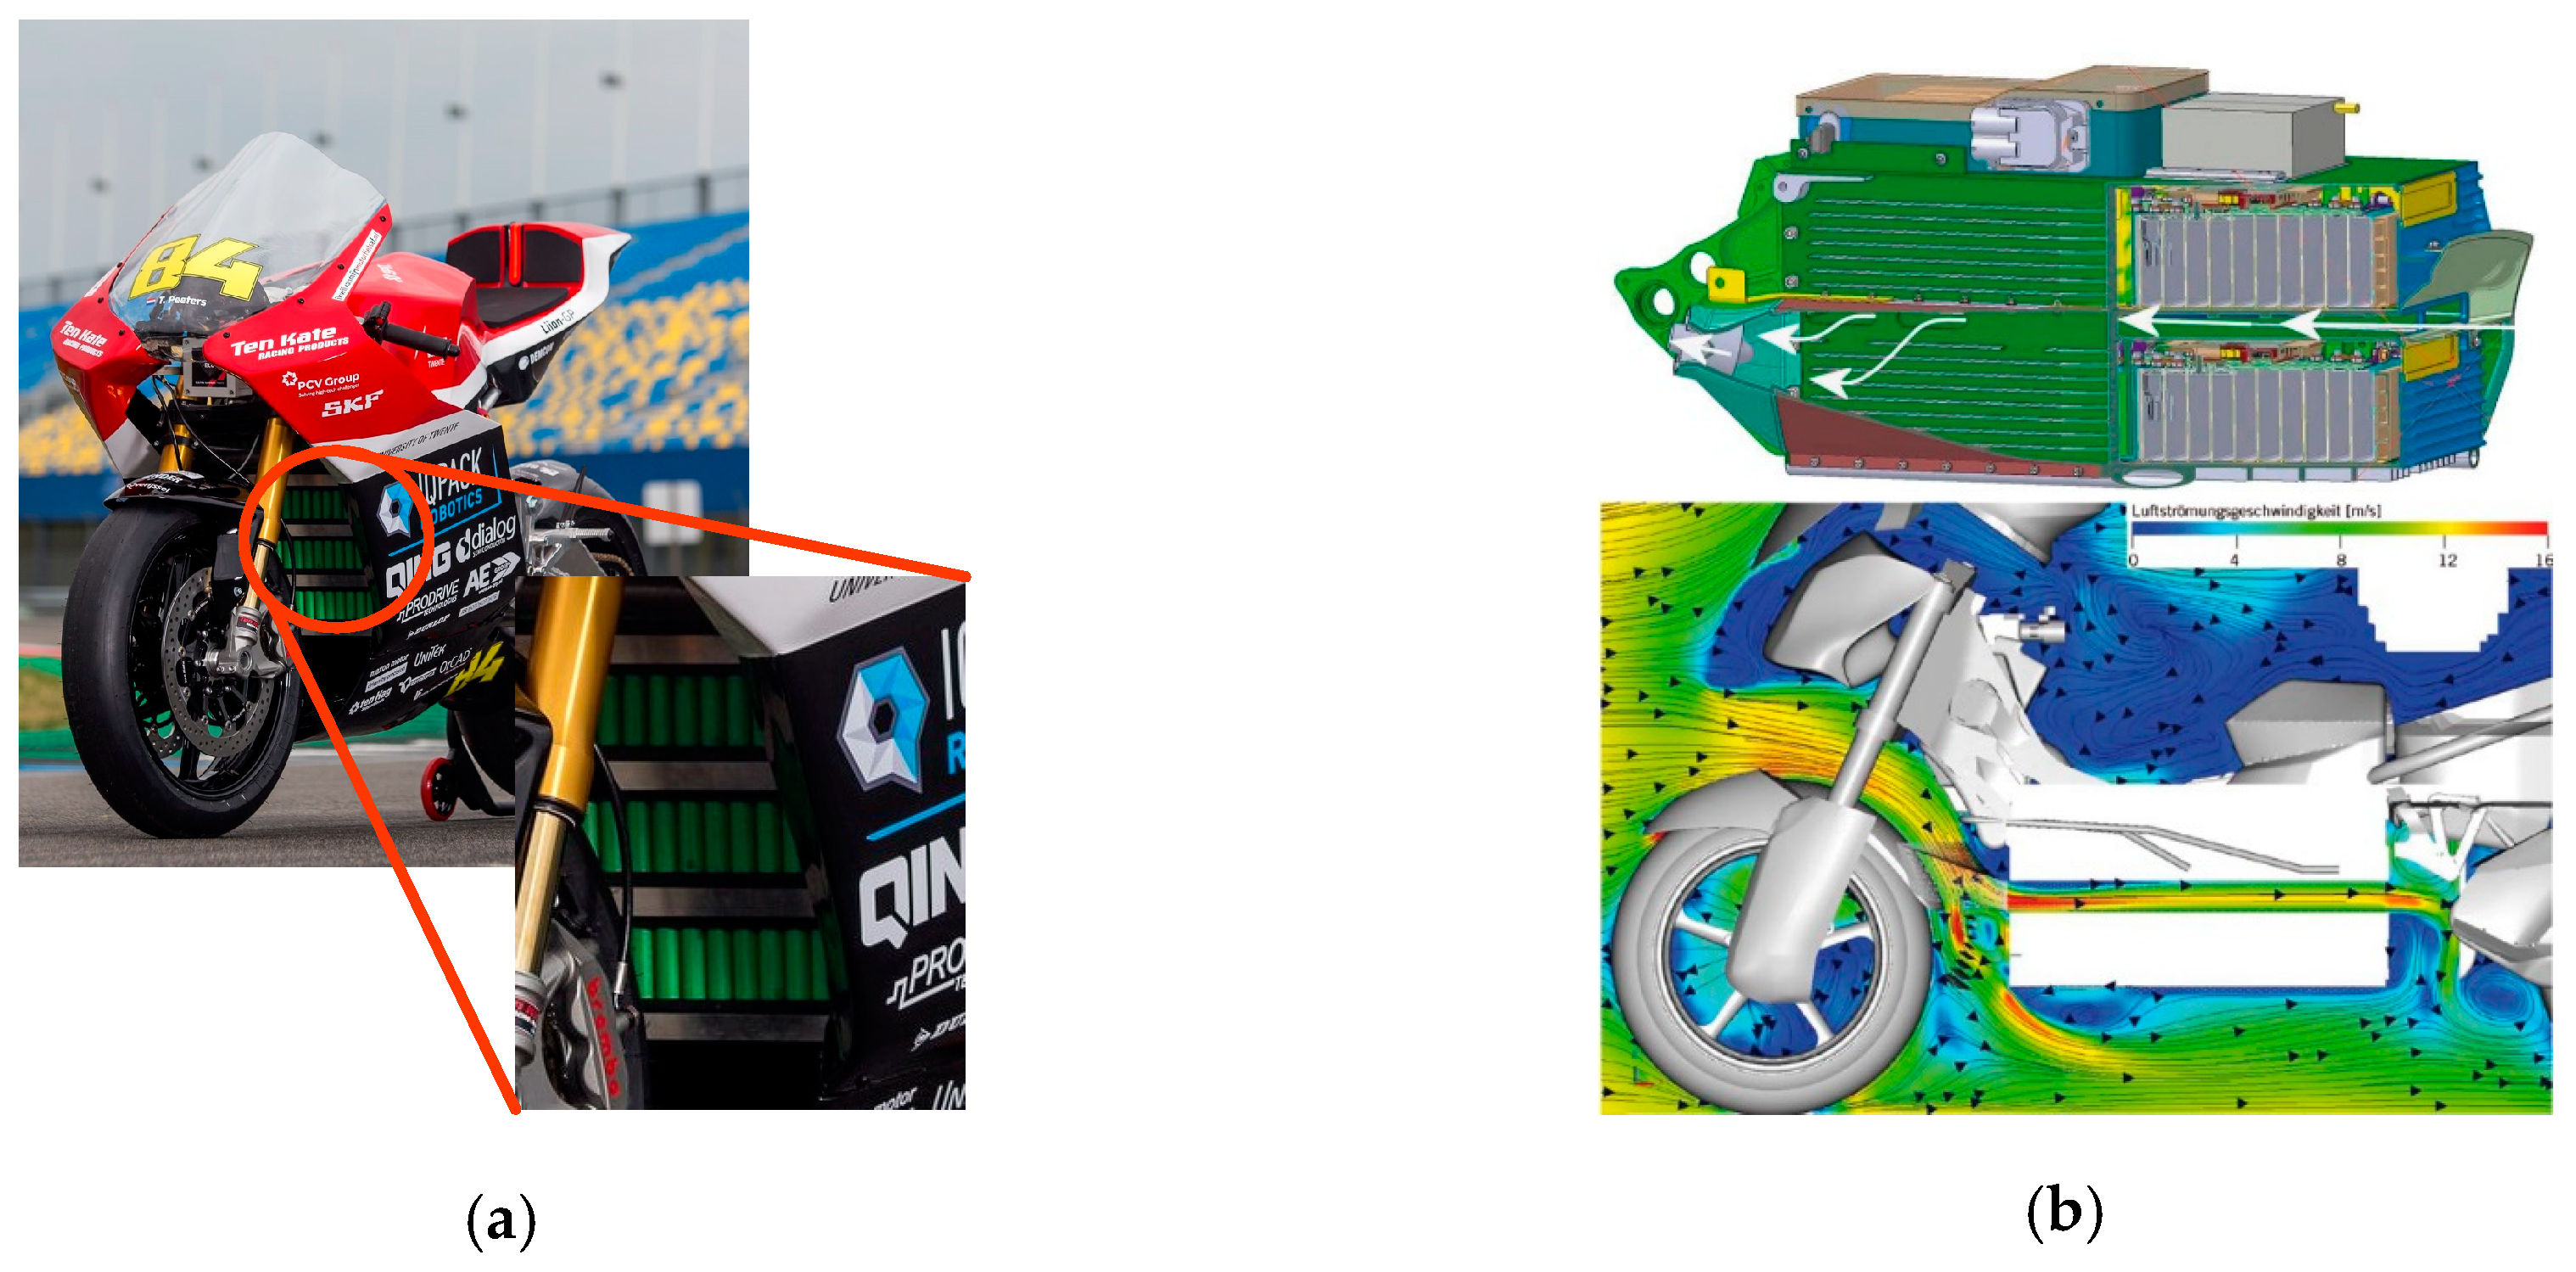
Figure 3.
Stand-alone battery thermal management system.

Figure 4.
Simulated battery cell and busbar configuration.
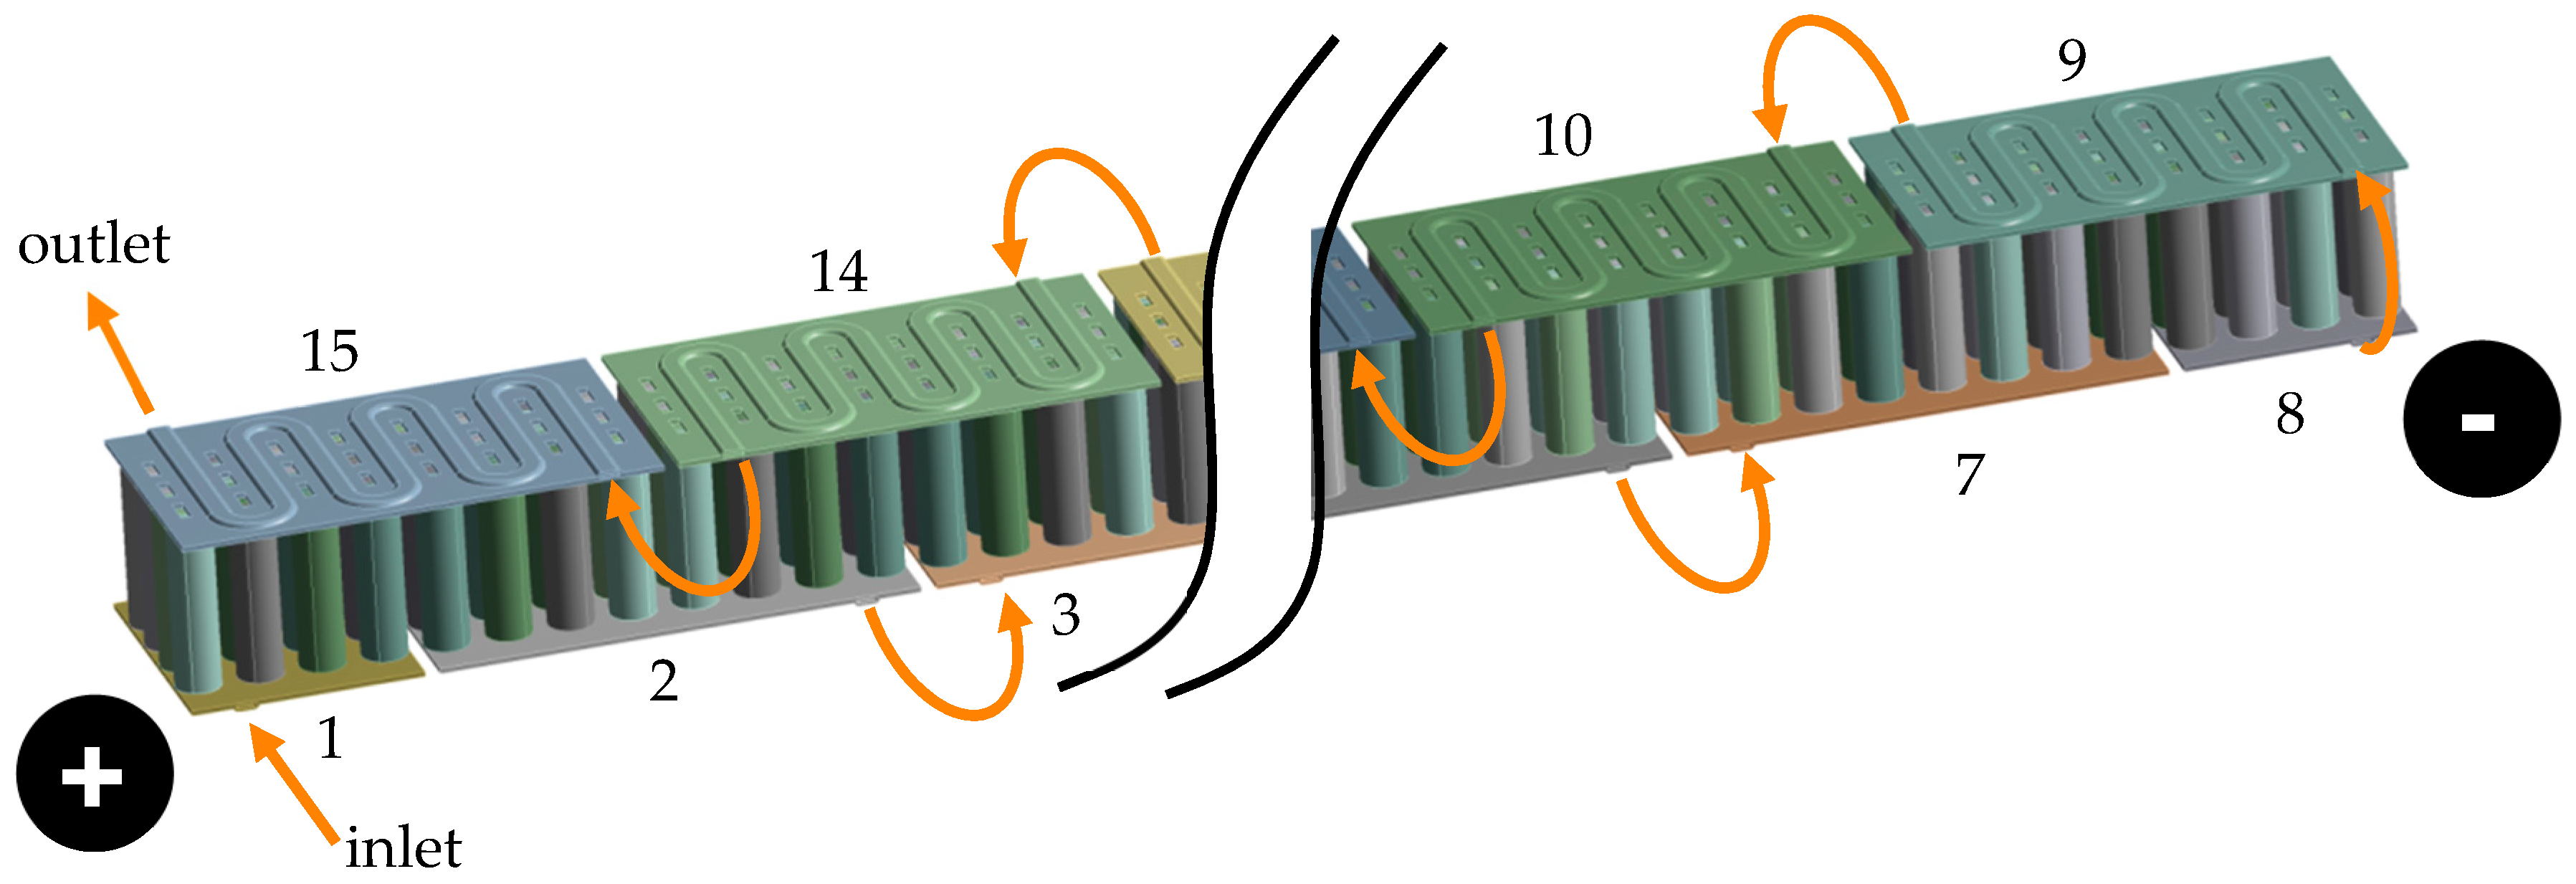
Figure 5.
Battery cell modelling: (a) Samsung INR18650-30Q; (b) sectional view of the cell model.
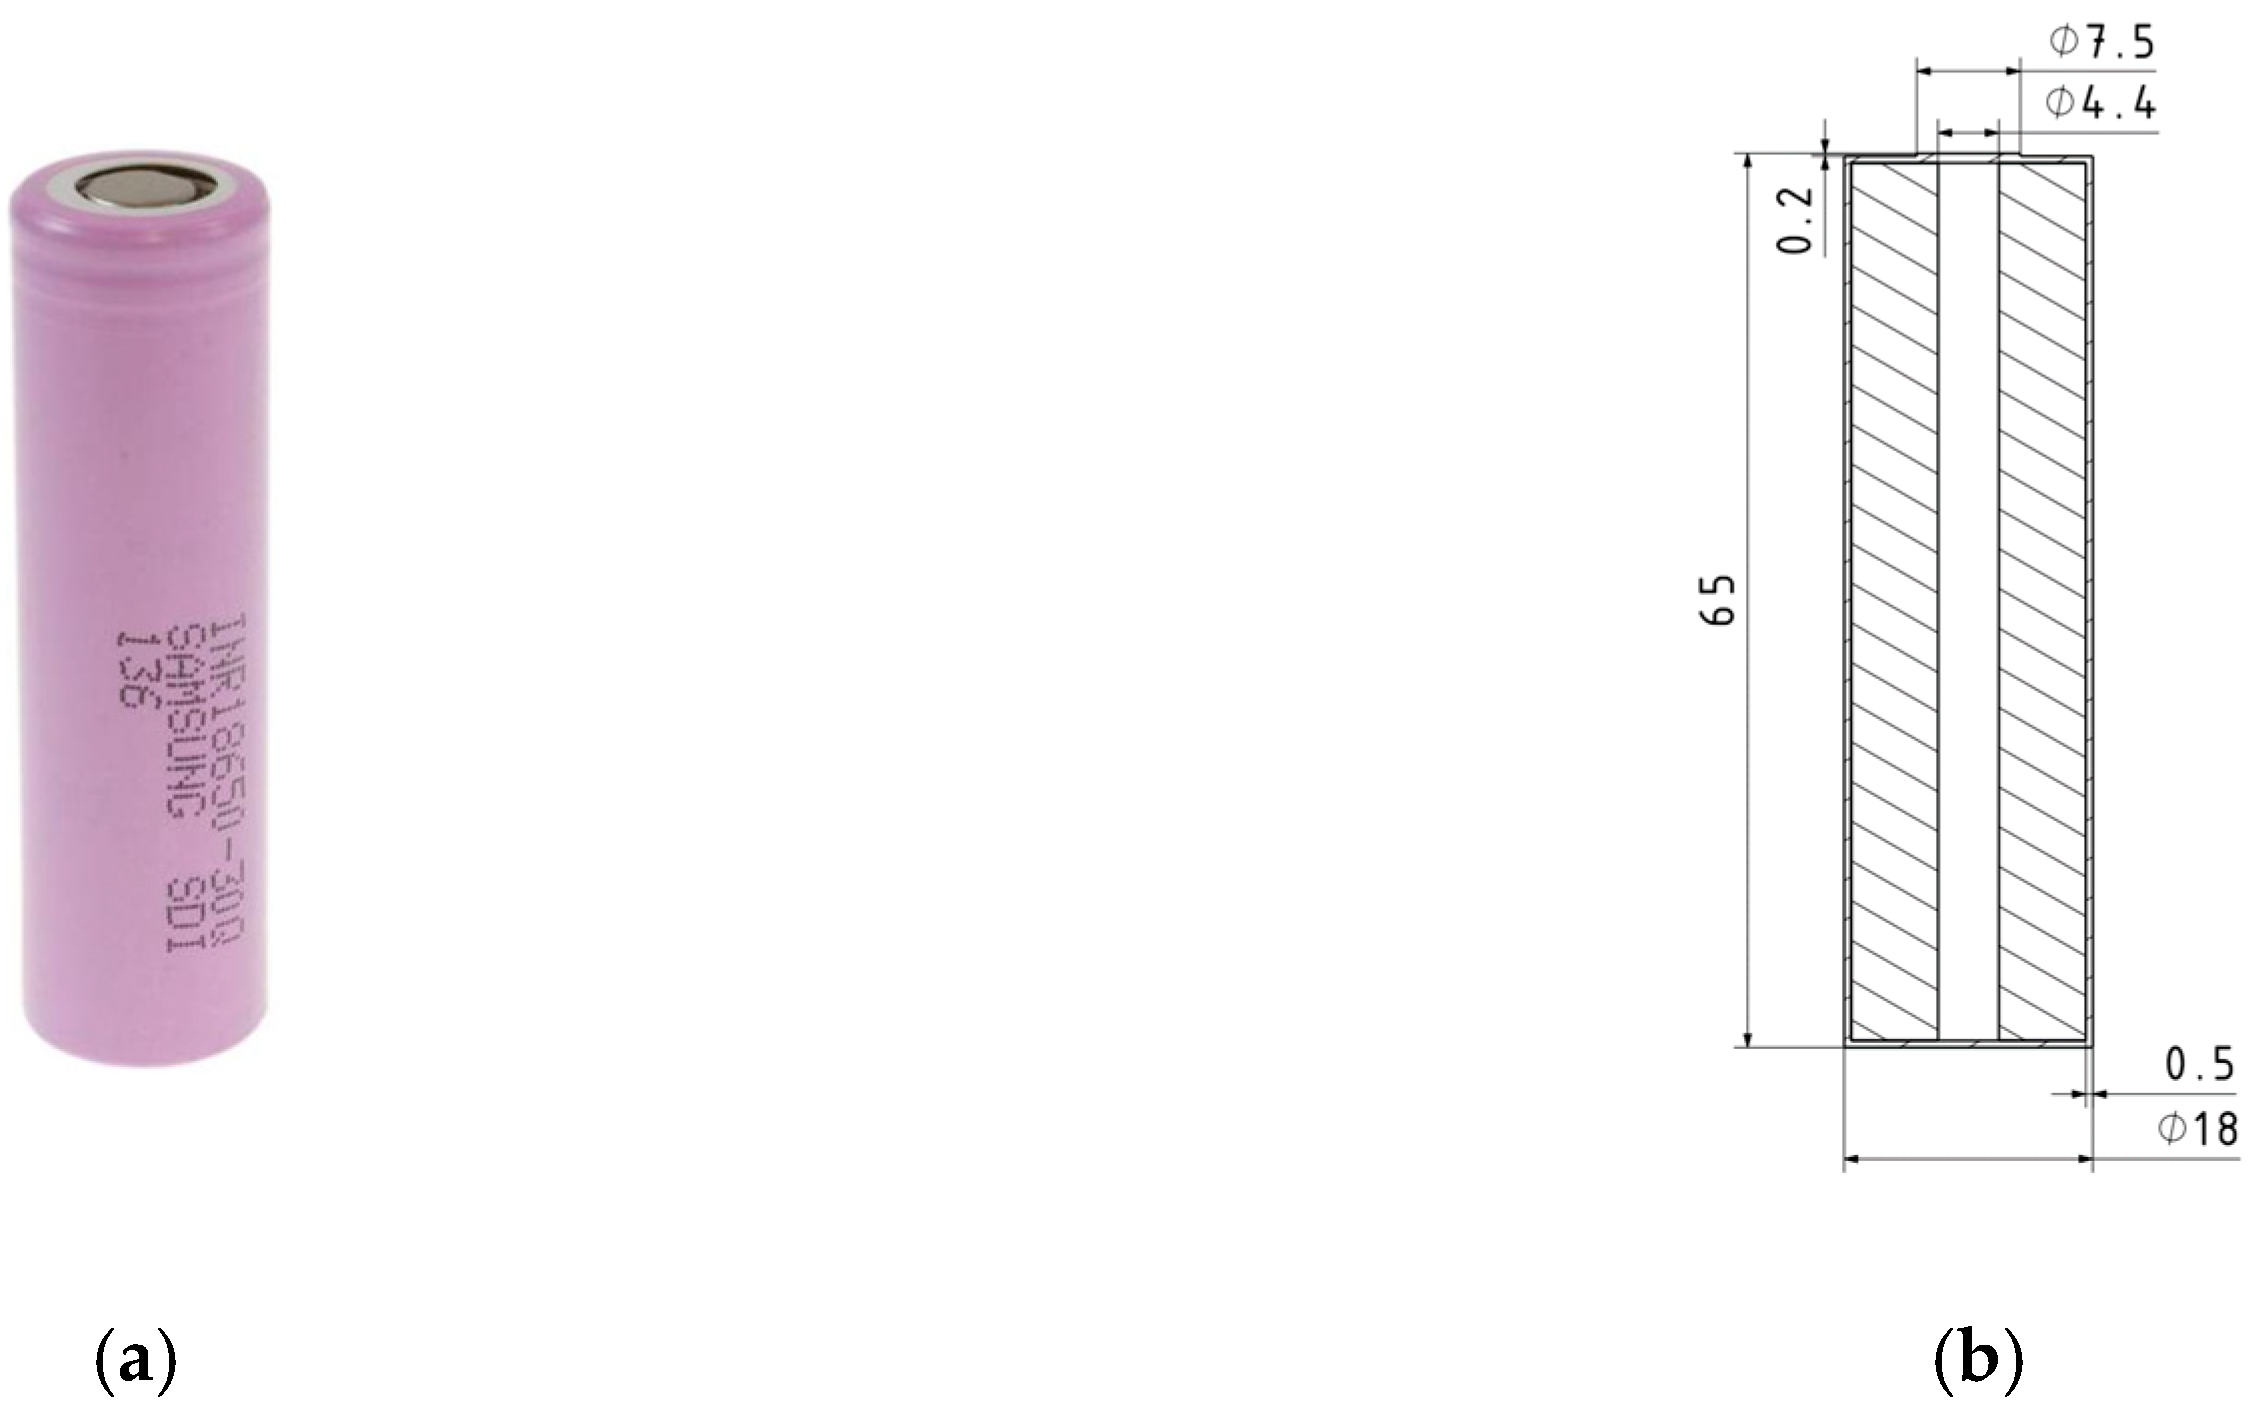
Figure 6.
Roll bonding design restrictions.

Figure 7.
Channel pattern 1.

Figure 8.
Channel patterns: (a) Channel pattern 2; (b) Channel pattern 3.
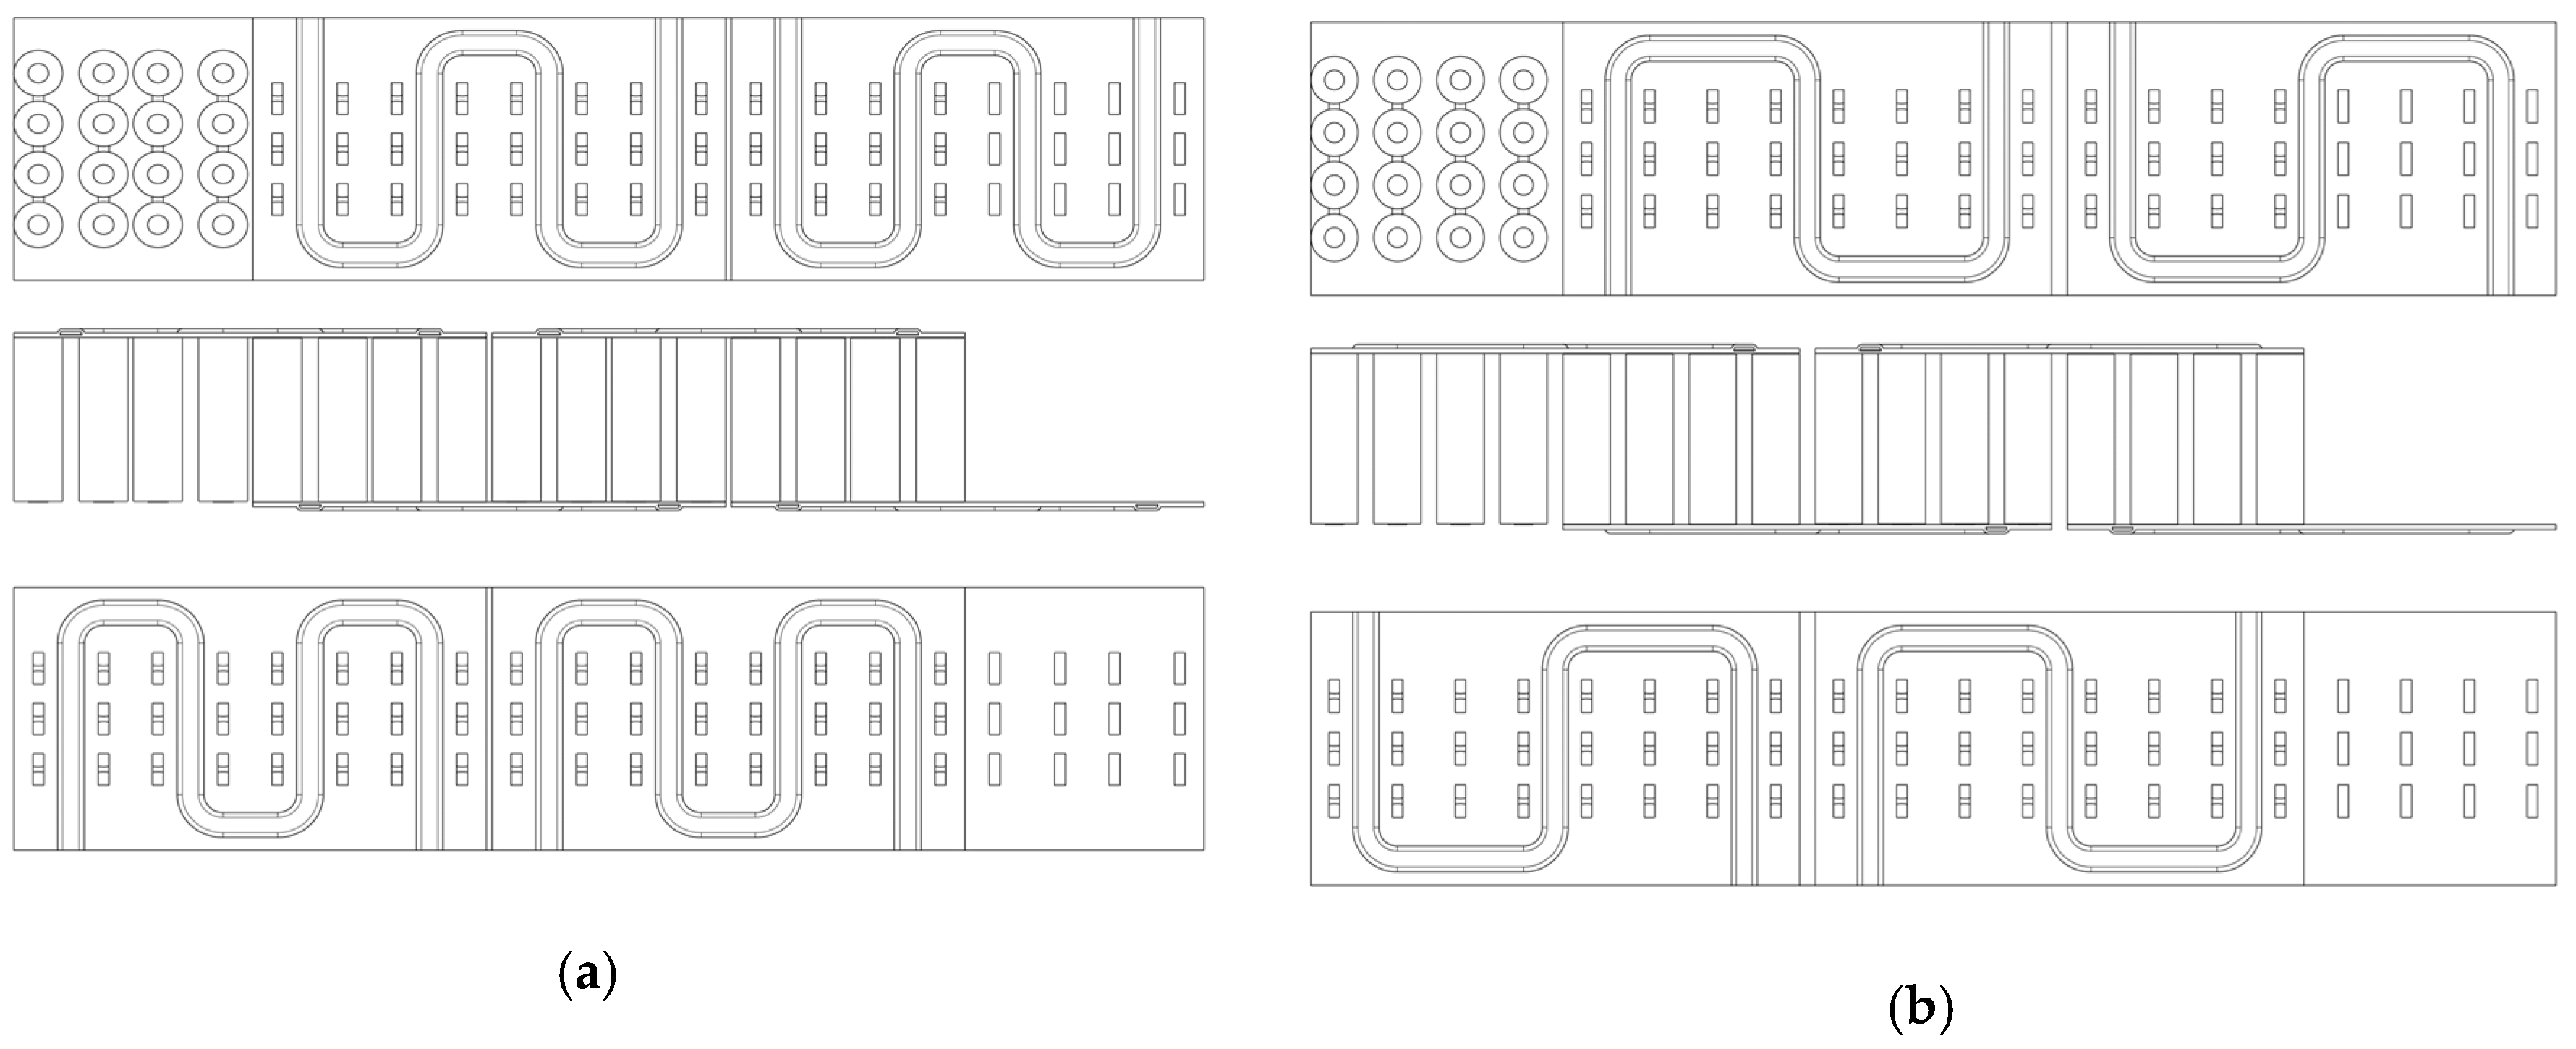
Figure 9.
Simulation procedure.
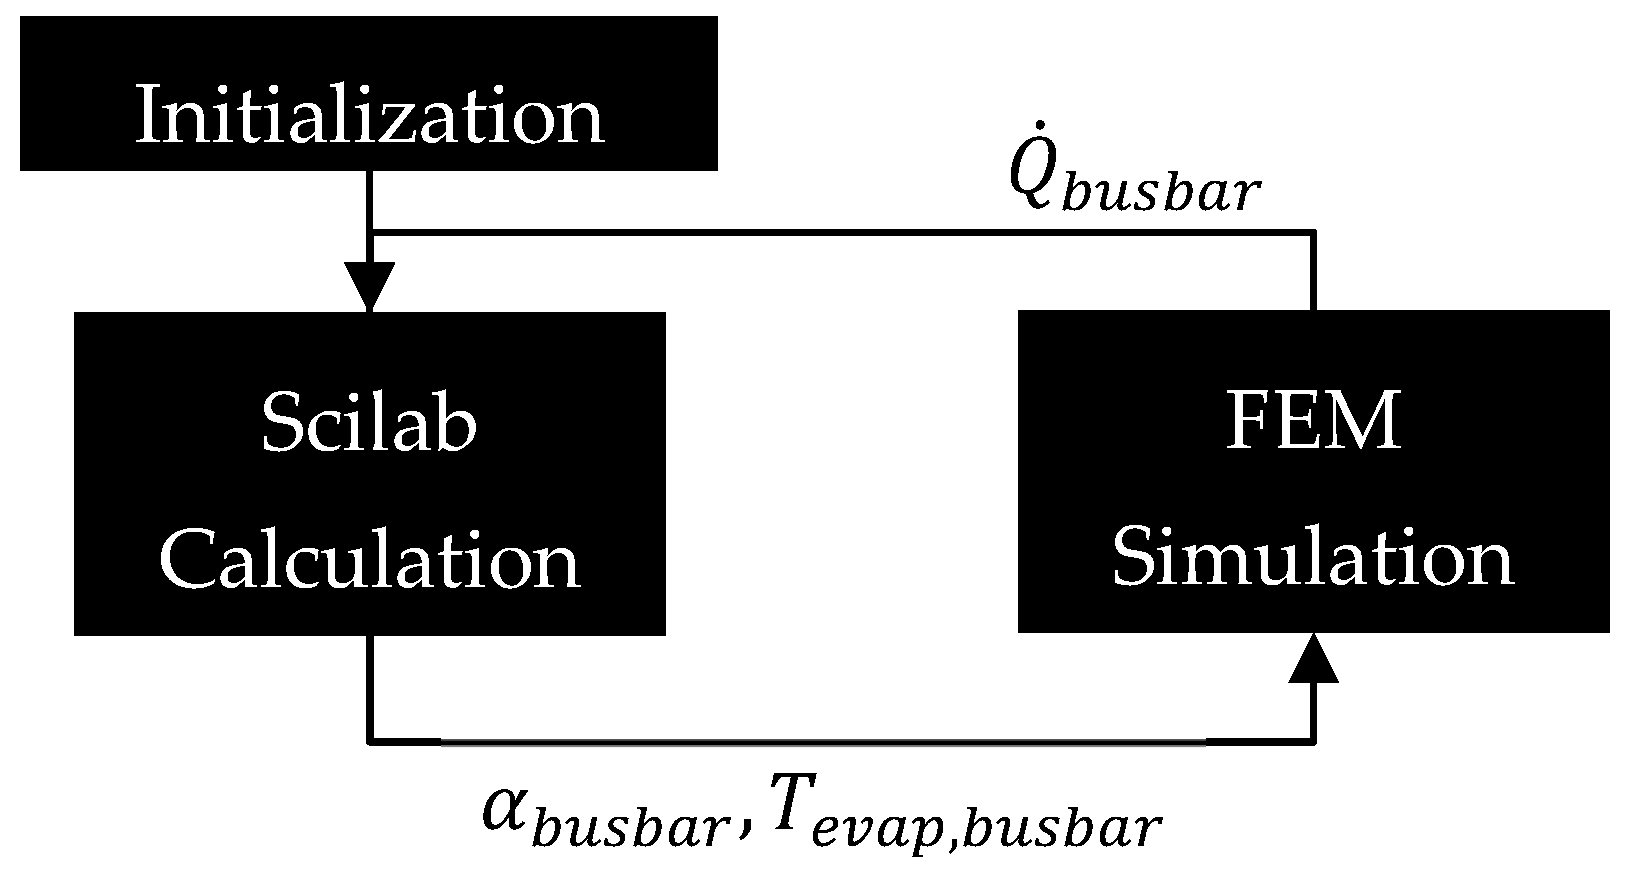
Figure 10.
Average module temperatures.

Figure 11.
Module temperature spread.
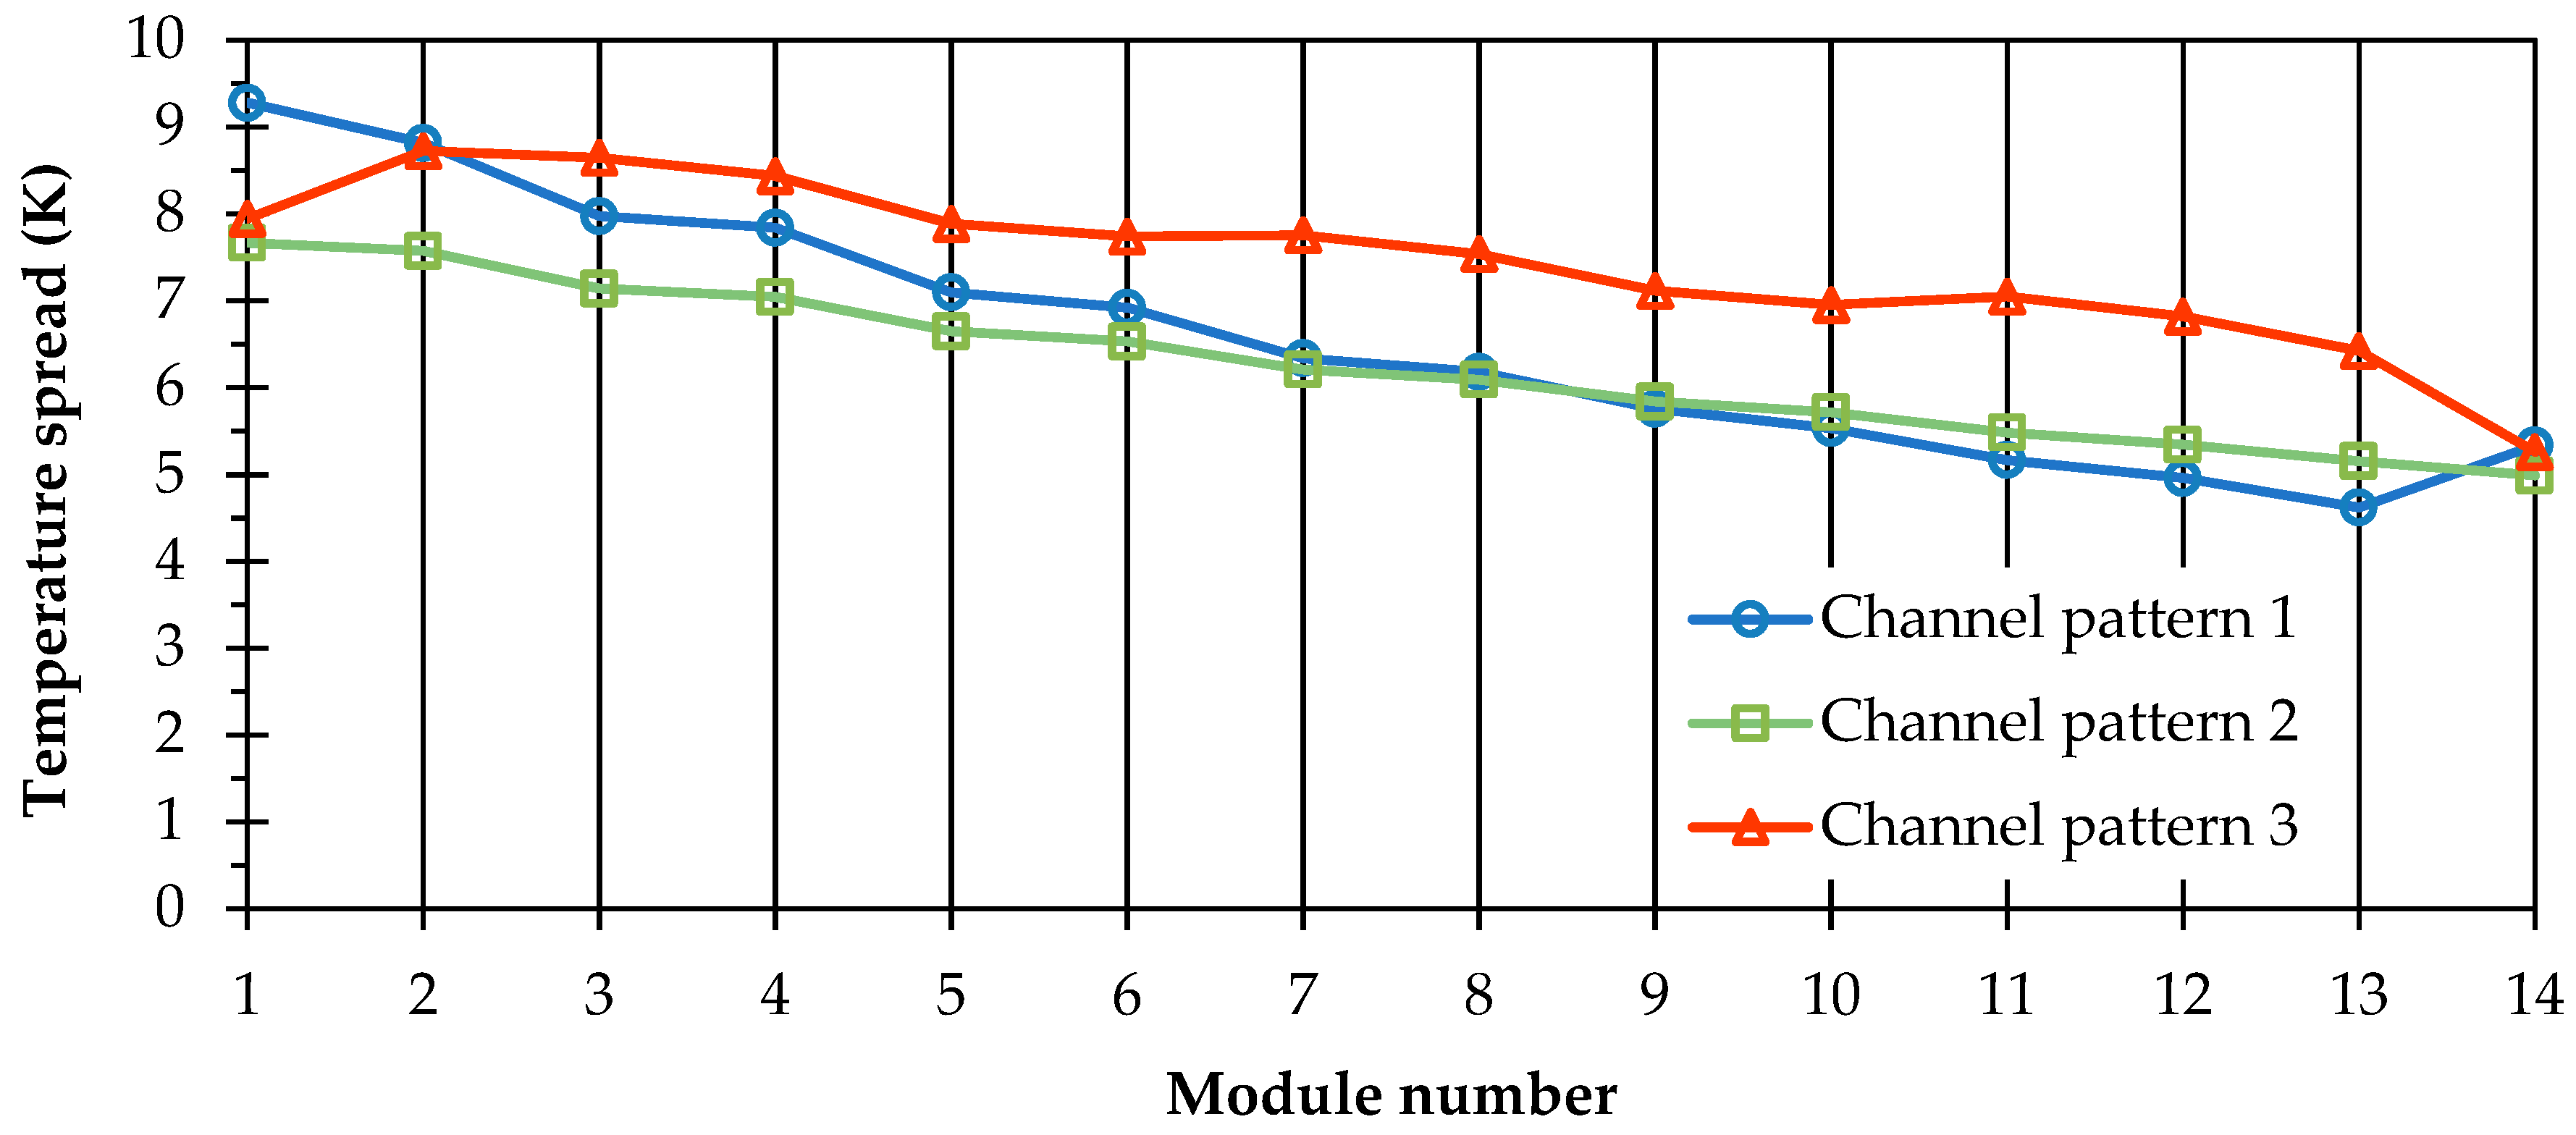
Figure 12.
Evaporation temperatures.


Table 1.
Boundary conditions.
| Refrigerant | R290 (Propane) |
|---|---|
| Mass flow | 3.34 g/s |
| Inlet pressure/inlet temperature | 8.36 bar/20 °C |
| Inlet vapor fraction | 0.26 |
| Axial heat conduction coefficient | 35 W/mK |
| Radial heat conduction coefficient | 1.25 W/mK |
Table 2.
Mesh Study.
| Variable | Mesh 1 | Mesh 2 | Mesh 3 |
|---|---|---|---|
| No. of elements | 11,188,218 | 4,595,763 | 2,710,836 |
| Average cell temperature | 22.056 °C | 22.04 °C | 21.91 °C |
| GCI (safety factor: 1.25) | GCI12: 0.013% | GCI23: 0.104% | |
| 22.069 | |||
| Error Band | 0.013% |
Table 3.
Energy density.
| Channel Patter | Volumetric Energy Density | Gravimetric Energy Density |
|---|---|---|
| Channel pattern 1 | 241 Wh/litre | 199 Wh/kg |
| Channel pattern 2 | 263 Wh/litre | 201 Wh/kg |
| Channel pattern 3 | 241 Wh/litre | 199 Wh/kg |
| 18650 cells | 653 Wh/litre | 225 Wh/kg |
© 2019 by the authors. Licensee MDPI, Basel, Switzerland. This article is an open access article distributed under the terms and conditions of the Creative Commons Attribution (CC BY) license (http://creativecommons.org/licenses/by/4.0/).
Share and Cite
MDPI and ACS Style
Mayer, B.; Schier, M.; Friedrich, H.E. Stand-Alone Battery Thermal Management for Fast Charging of Electric Two Wheelers—Integrated Busbar Cooling. World Electr. Veh. J. 2019, 10, 37. https://doi.org/10.3390/wevj10020037
AMA Style
Mayer B, Schier M, Friedrich HE. Stand-Alone Battery Thermal Management for Fast Charging of Electric Two Wheelers—Integrated Busbar Cooling. World Electric Vehicle Journal. 2019; 10(2):37. https://doi.org/10.3390/wevj10020037
Chicago/Turabian StyleMayer, Bastian, Michael Schier, and Horst E. Friedrich. 2019. "Stand-Alone Battery Thermal Management for Fast Charging of Electric Two Wheelers—Integrated Busbar Cooling" World Electric Vehicle Journal 10, no. 2: 37. https://doi.org/10.3390/wevj10020037