A Comparison of Internal and External Preheat Methods for NMC Batteries †
by
 , and
, and
Theodoros Kalogiannis
1,2,*, 
Joris Jaguemont
1,2,
Noshin Omar
1,2,
Joeri Van Mierlo
1,2 and
and
Peter Van den Bossche
1,2 
1
ETEC Department & MOBI Research Group, Vrije Universiteit Brussel (VUB), Pleinlaan 2, 1050 Brussel, Belgium
2
Flanders Make, 3001 Heverlee, Belgium
*
Author to whom correspondence should be addressed.
†
Paper Presented at EVS31 the 31th International Electric Vehicle Symposium and Exhibition & International Electric Vehicle Technology Conference,30 September to 3 October 2018 in Kobe, Japan.
World Electr. Veh. J. 2019, 10(2), 18; https://doi.org/10.3390/wevj10020018
Submission received: 14 March 2019
/
Revised: 3 April 2019
/
Accepted: 10 April 2019
/
Published: 15 April 2019
(This article belongs to the Special Issue Selected Papers from The 31st International Electric Vehicles Symposium and Exhibition (Kobe, Japan))
Abstract
:Lithium-ion batteries (LiBs) performance can be significantly declined when operated at cold climates in terms of capacity loss, resistance increase and accelerated aging rates. To prevent this downgrade and to maintain the optimal operation of battery cells, a preheat process is taking place, which can be implemented either by internal or external techniques. The former is performed actively, by circulating a constant amplitude and frequency alternative pulse current (APC) at the battery cell’s terminal and preheating it internally by harvesting its generated Joule losses. The latter is achieved passively, by enclosing the cell into thermal blankets. In this work, a comparison of these two preheating strategies is presented, by proposing electro-thermal and lifetime models of a lithium nickel manganese cobalt oxide (NMC/G) 20 Ah pouch battery cell. Heat transfer, energy efficiencies and degradation costs are estimated during operation of the preheat techniques. Validation of the model showed a good agreement between the model and experimental data, and a study case is proposed to estimate and compare the cost efficiency of the methods as based for an economic study.
1. Introduction
Nowadays, LiBs are the dominant choice in most pure electric/plug-in hybrid electric vehicles (EVs/PHEVs), or both as plug-in electric vehicles (PEVs) applications. Several research works focus on improving their safety and reliability subjected to minimum production and operation costs, whereas it is becoming more and more crucial that they adhere to an increased power and energy capability at cold climates [1]. PEVs can be part of the struggle to meet the CO2 emission requirements, and their contribution can be enhanced if they overcome certain challenges such as their downgraded operation at cold climates.
In a cold environment, typically below C, LiB cells performance is downgraded in terms of power and energy capability, resulting from the respective resistance increase and discharge capacity decrease [2], where discharge capacity (Ah) is the amount of current (Amperes) the battery can deliver to a load connected to it per hour, at a certain discharge current rate—C-rate, from 100% SoC to cut-off voltage limit. The limiting factors are correlated to the poor electrolyte conductivity, the slower charge transfer kinetics and the lithium ions diffusion in the anode, as well as the increased solid electrolyte interphase (SEI) resistance that appear at these low temperatures [3]. Consequently, a PEV might face difficulties in starting-up or poor performance, which makes it quite important to protect and increase the temperature of the battery cells before operation at cold climates, by a preheat/warming-up method.
Specifically, in [4], authors measure the discharge capacity of an LiB cell dropped around 60% to its value at the safe operation area. Moreover, the resistance drastically increases and leads to downgraded pulse power capability of LiBs at low ambient temperatures due to a reduction in electrolyte conductivity [5], a decrement in reaction kinetics [6] and a slower Li+ diffusion in the negative electrode [7]. In addition, fast charging can be challenging at those low temperatures due to the metallic lithium deposition that takes the intercalation place on the graphite anode surface (so-called lithium plating). Such an accumulated phenomenon can lead to further loss of available lithium (significant capacity fade) and eventually into safety hazards by the dendrites formation (increase of the metallic lithium can reach the cathode) and result in internal short circuits of the battery cell [8,9].
A preheating process to cope with the aforementioned limiting effects can be accomplished with either (actively) internal or (passively) external techniques. On the one hand, an externally connected heat source such as heat pads (HP) benefits due to simplicity, but lacks in energy and time efficiency point of view [10] and temperature uniformity on the cell’s surface [11], while also in the additional weight which affects the cost and the performance of the PEV in total.
On the other hand, internal preheat methods are able to warm the cell by using its electro-chemical reactions and temperature evolution during charge/discharge, by feeding a high magnitude bi-directional pulse current with a constant frequency and duty cycle. This technique, estimated by Pesaran et al. in the early 2000s [12], is also known as alternative pulse current (APC) method or bi-directional current pulse method and, despite its extra cycling and calendar degradation on the battery cells, it is able to produce a fast uniformed temperature rise with generally low energy and degradation costs.
The effects of the preheat methods, in terms of required time and cost to preheat, temperature increase and preservation during a whole night (8 h) study case are examined for a lithium nickel manganese cobalt oxide (NMC/G) 20 Ah pouch cell. An electro-thermal model coupled with lifetime dependency function is presented and validated in order to estimate and compare different approaches as well as the energy efficiency of the preheating techniques.
The rest of this paper is organized as follows: Section 2 describes the development of the proposed models. Section 3 gives a validation of the model with experimental results, whereas discussions on the APC with a comparison to the external method are taking place in Section 4. Lastly, Section 5 concludes this paper.
2. Model Development
This section describes the models used in this work with a brief discussion on their individual parts.
2.1. General Model
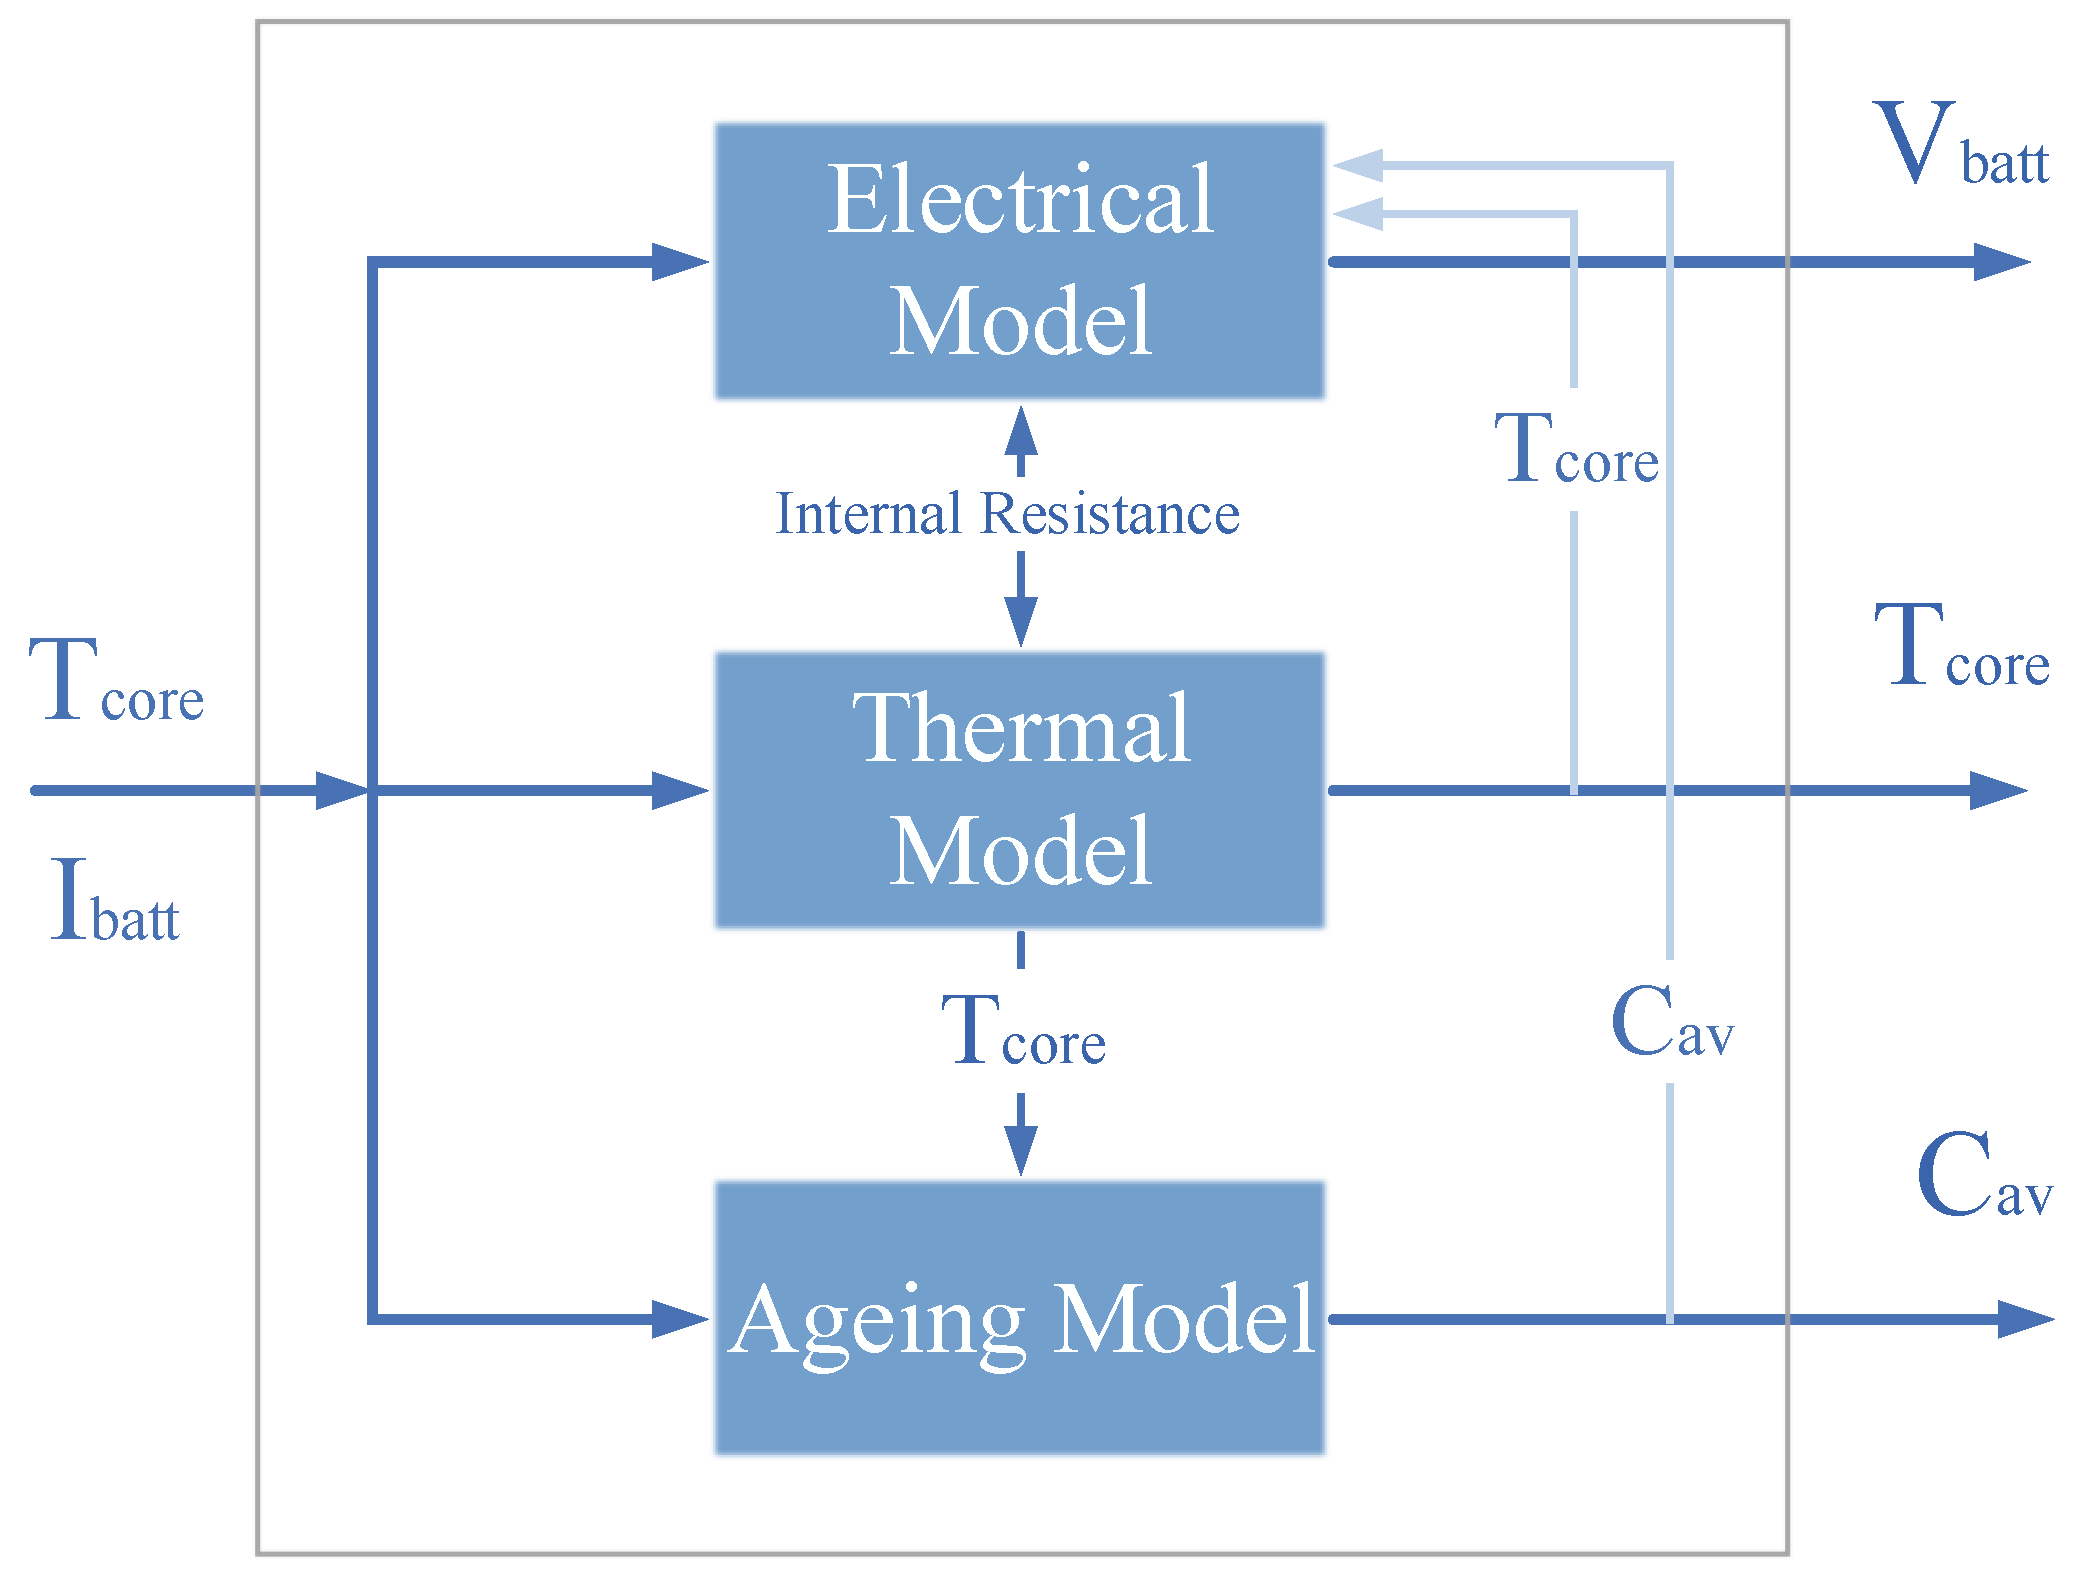
In this paper, an electro-thermal coupled to a lifetime model is proposed to describe an NMC pouch cell built in Matlab/Simulink interface, composed of three sub-models as shown in Figure 1.
The model’s inputs are the battery cell current and the ambient temperature. It is capable of estimating the heat transfers and the energy losses and it is coupled with a lifetime function to determine the total energy cost efficiency, due to cycle degradation that occurs during the preheat methods on the battery cell. Authors invite the reader to refer to previous articles [13,14] for more information about the model description and parameterization as well as the experimental protocols followed to characterize the battery cell. In particular, the hybrid pulse power characterization (HPPC) is performed to give information on the DC resistance of the battery cell and its power capabilities, the open circuit voltage test is performed to show the voltage of the battery at different SoC levels and the capacity test which is performed to give the discharge capacity of the battery cell at different current rates [15,16].
2.2. Electrical Model
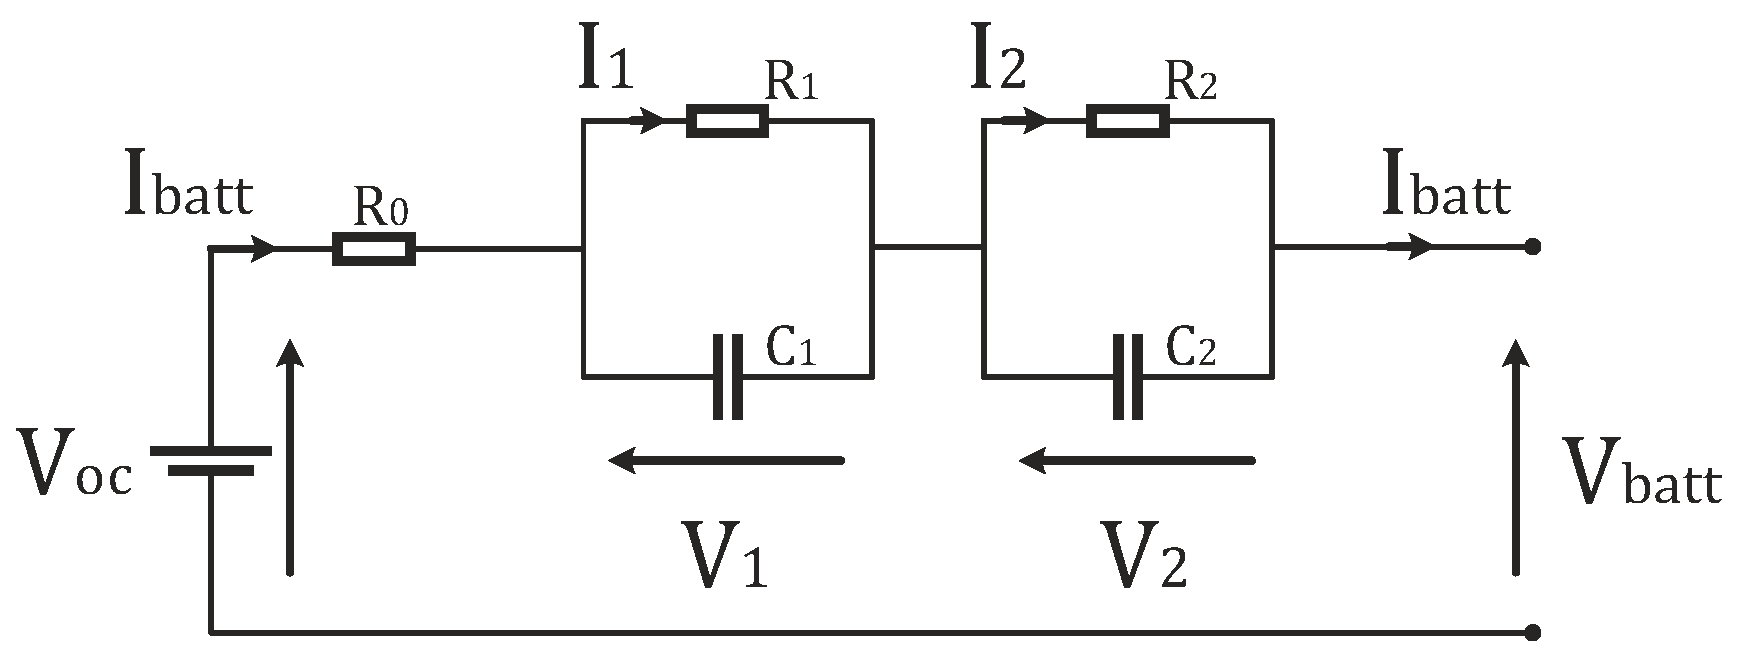
According to [17], the Dual Polarization Electric Equivalent Circuit (ECM) utilized in this work followed the topology of Figure 2, which is a quite accurate approach with low simulation error for the Li-ion electrical characterization purpose [18,19].
Accordingly, the terminal voltage of the ECM battery cell is calculated based on the following Equation (1):
where is the internal ohmic resistance, and are the polarization resistances (Ohms) with the respective capacitances ( and ) and voltage drops across them ( and ). is the current flow through the NMC cell (in Amps). Those parameters are estimated according to standard characterization procedures. Firstly, the Open Circuit Voltage (OCV) test corresponds to specific SoCs and temperatures, and it estimates the OCV at the various conditions. The discharge Capacity test is implemented to evaluate the capacity of the cell at different current rates. Lastly, the Hybrid Pulse Power Characterization (HPPC) test is performed at a 10% step from 100% to 0% at four temperature profiles to evaluate the power capability and the resistive elements of the ECM. Least-square curve fitting algorithms are performed to calculate the electrical components of the 2nd order ECM and characterize the battery cell according to Equation (2) [20]:
Lastly, the state of charge (SoC in %) is calculated based on the coulomb counting technique according to Equation (3):
where is the initial state of charge and is the initial capacity (Ah) as a function of temperature and current rate. In Table 1, the electrical and mechanical properties of the cell can be found.
The electrical model is validated with standard current profiles, dynamic discharge pulse test (DDPT) and the worldwide harmonized light vehicle test procedure (WLTC) and the results can be seen in [17].
2.3. Thermal Model
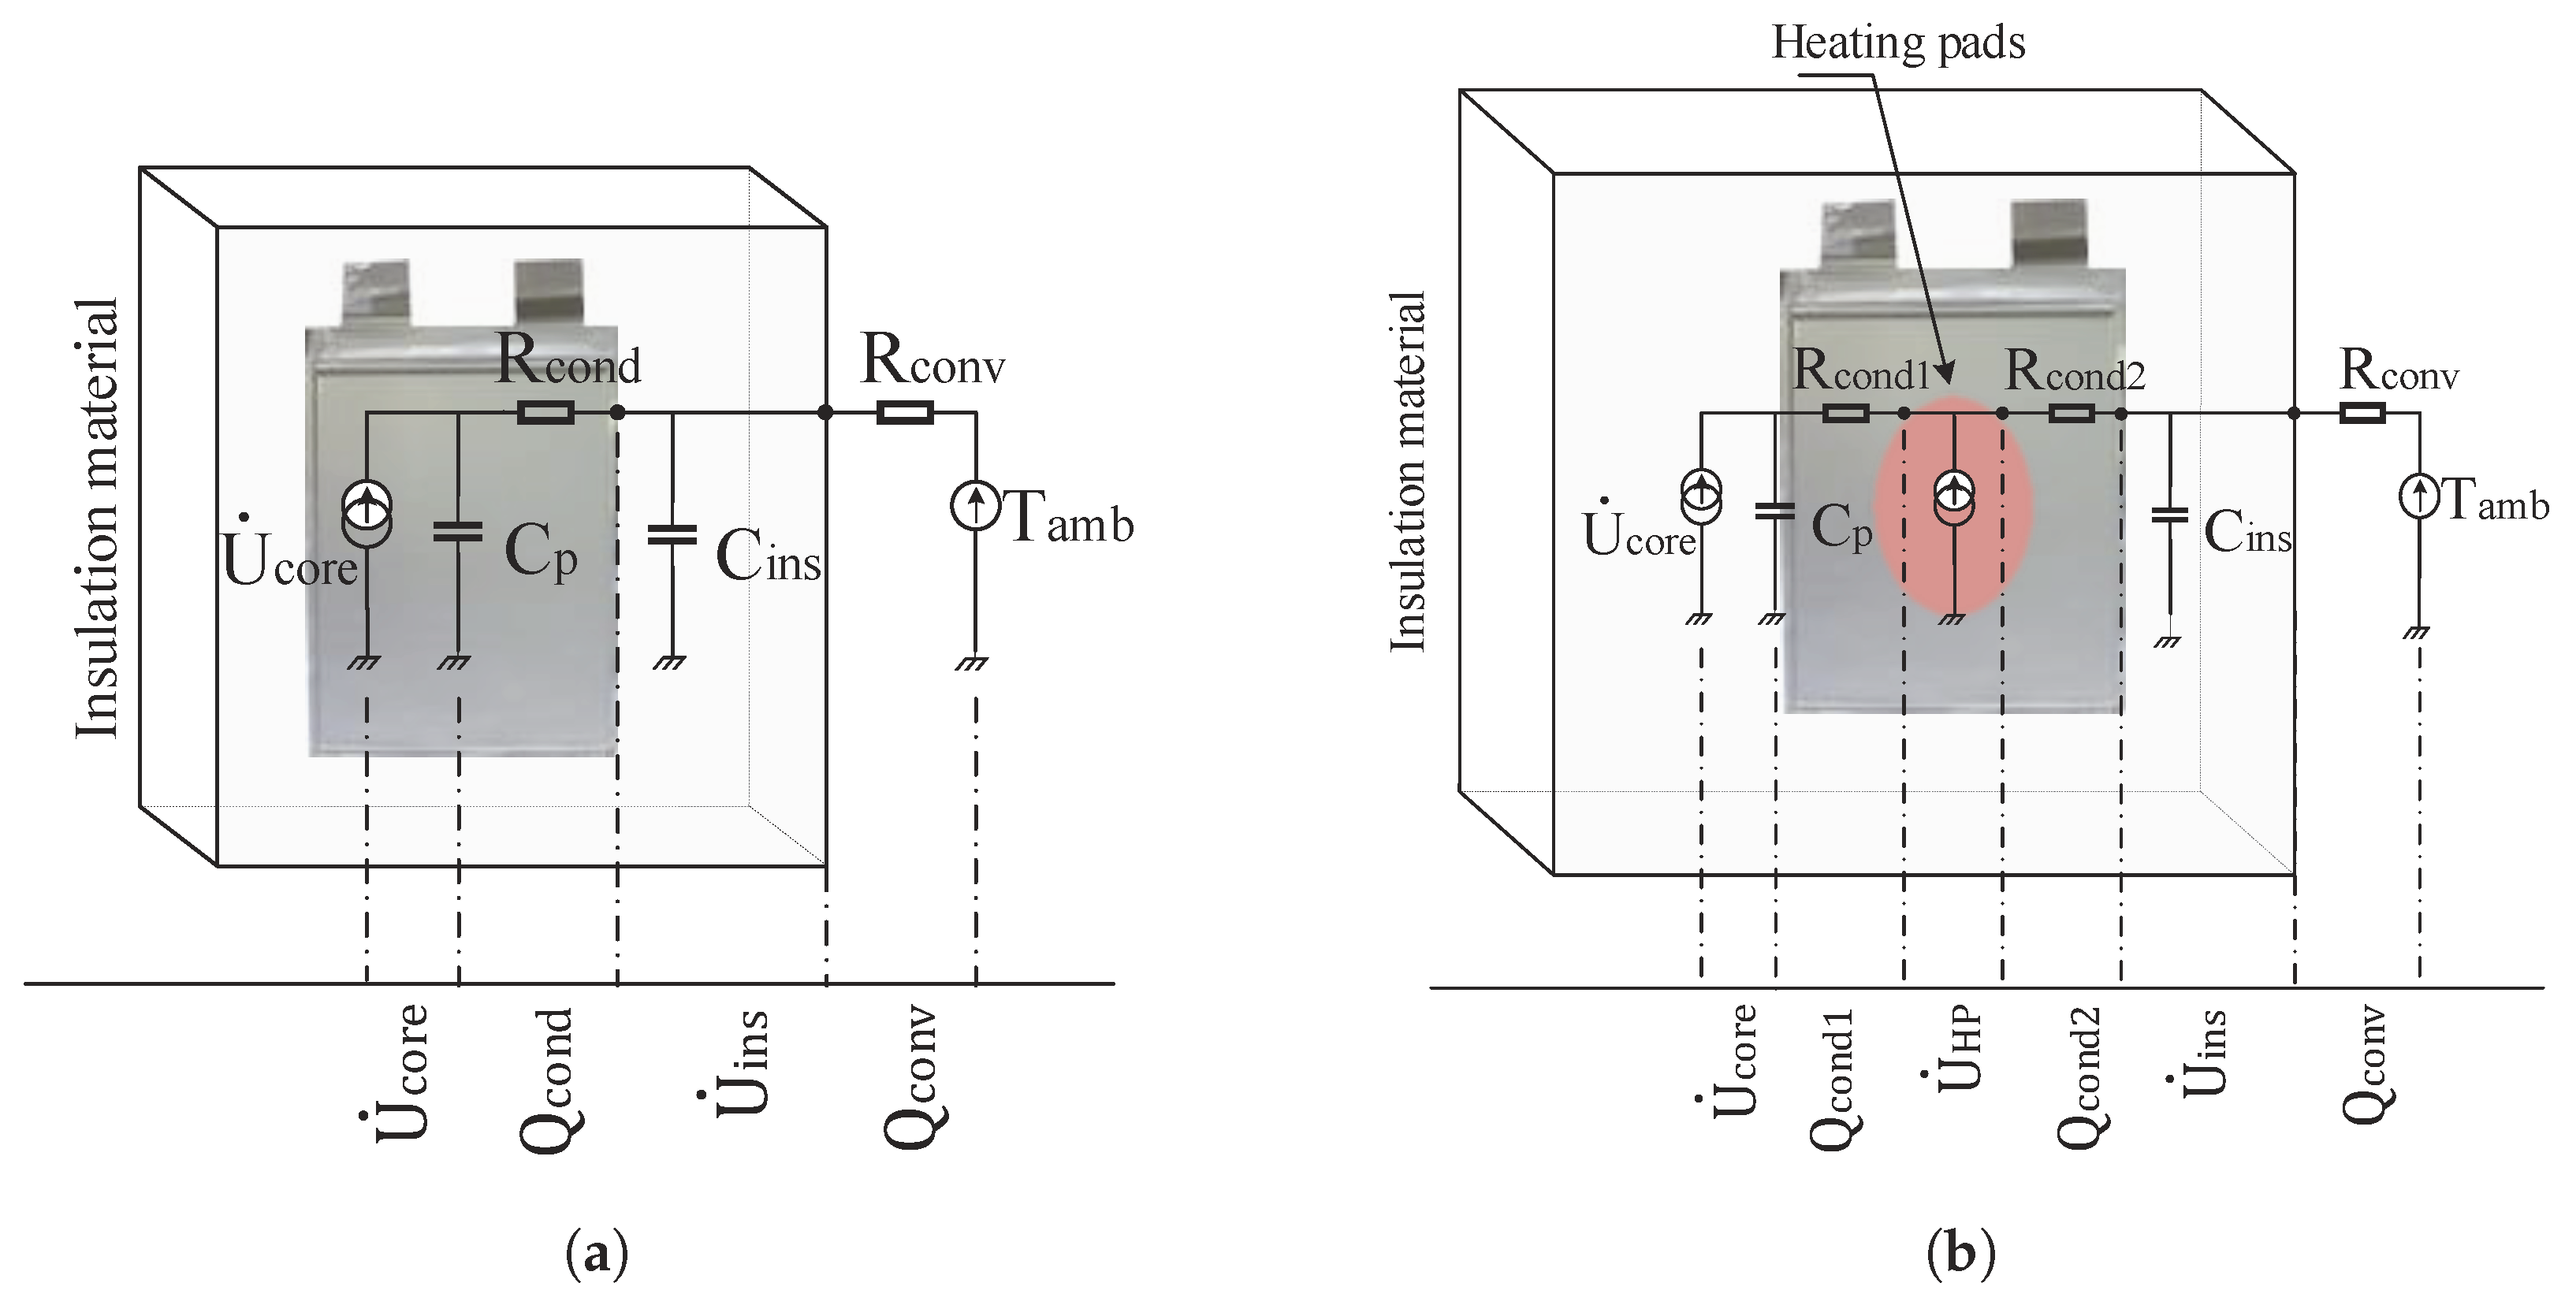
The heat sources that are considered in the thermal model are conduction and convection. Considering also the relative small thickness of the pouch cell’s casing, its internal energy is neglected and, for this purpose, a global core i.e., NMC core is taken under account. To maintain the temperature efficiently during the experiment, the battery cell is enclosed in an insulation material composed of polystyrene foam. In addition, all the components inside the cell are assumed to be single homogeneous materials with averaged/lumped properties, while assuming temperature uniformity on the cell, the thermal circuit model with the heat energies within the cell and its carriage to the surroundings is developed as illustrated in Figure 3, according to [21]. In the same figure, the thermal heat transferring from the cell to the environment is shown for both the internal and external methods.
According to Figure 3, the equivalent electrical resistive elements and , along with the capacitive elements and represent the heat transfer phenomena, whereas the current sources represent the rate of heat that is generated or consumed. For the NMC cell, the thermal properties can be found in [13], and they are illustrated in Table 2, along with the thermal properties of heating pad and the insulation material, for convenience.
In the internal preheat method Figure 3a, the generated heat from the core cell is conducted to the insulation material, and then through it, convected to the environment. On the other hand, as shown in Figure 3b, it is conducted firstly to the heating pad , then to the ins,ulation material to the convection with the environment. This is because, between the two rear sides of the cell, two HP that provide 8W each are being placed in order to externally heat the cell. Each pad is identical and provides the same heat flow to the cell.
In this paper, a comparison between the different preheat methods is proposed. For this purpose the equations describing the aforementioned thermal models and heat transfers rates are analyzed for both cases.
2.3.1. APC Thermal Model Description
The heat equations describing the thermal model are the subsequent [22,23] where the temperature gradient is calculated by the following Equation (4):
where (J) is the internal energy that a thermodynamic system consists of, (W) is the generated heat rate on the core characterized in this work only by the ohmic losses [24,25] seen in the ECM as calculated based on Label (5):
and (W) is the heat loss of the core expressed by conductive heat transfer (W) to the insulation material and the convective heat transfer (W) to the ambient expressed as in Equation (6):
where is the area of the insulation material, is the thermal conductivity, and represent the temperatures of the NMC core and the insulation material, respectively, (C) and is the material’s thickness. (J) is the internal total energy of the insulation material dependent on its specific heat and mass, and defines the temperature of the material, which thermal parameters can be found in Table 1.
2.3.2. HP Thermal Model Description
Similarly to the APC thermal calculations, the conduction from core cell to HP and from HP to insulation material are described based on Equation (6) for the conduction, where the areas and are given in Table 2. That heat transfer is shown in Figure 3b, where is the conduction losses from the cell to the HP and from the HP to the insulation material.
The thermodynamic system that describes the external preheat method treats the generation of the HP as another source of Joule losses:
Since there is no current flow in the cell during this method, the generation of the NMC core is zero, but there is a conduction loss between the cell and the HP, which is assumed to be the losses on the core:
2.4. Aging Model
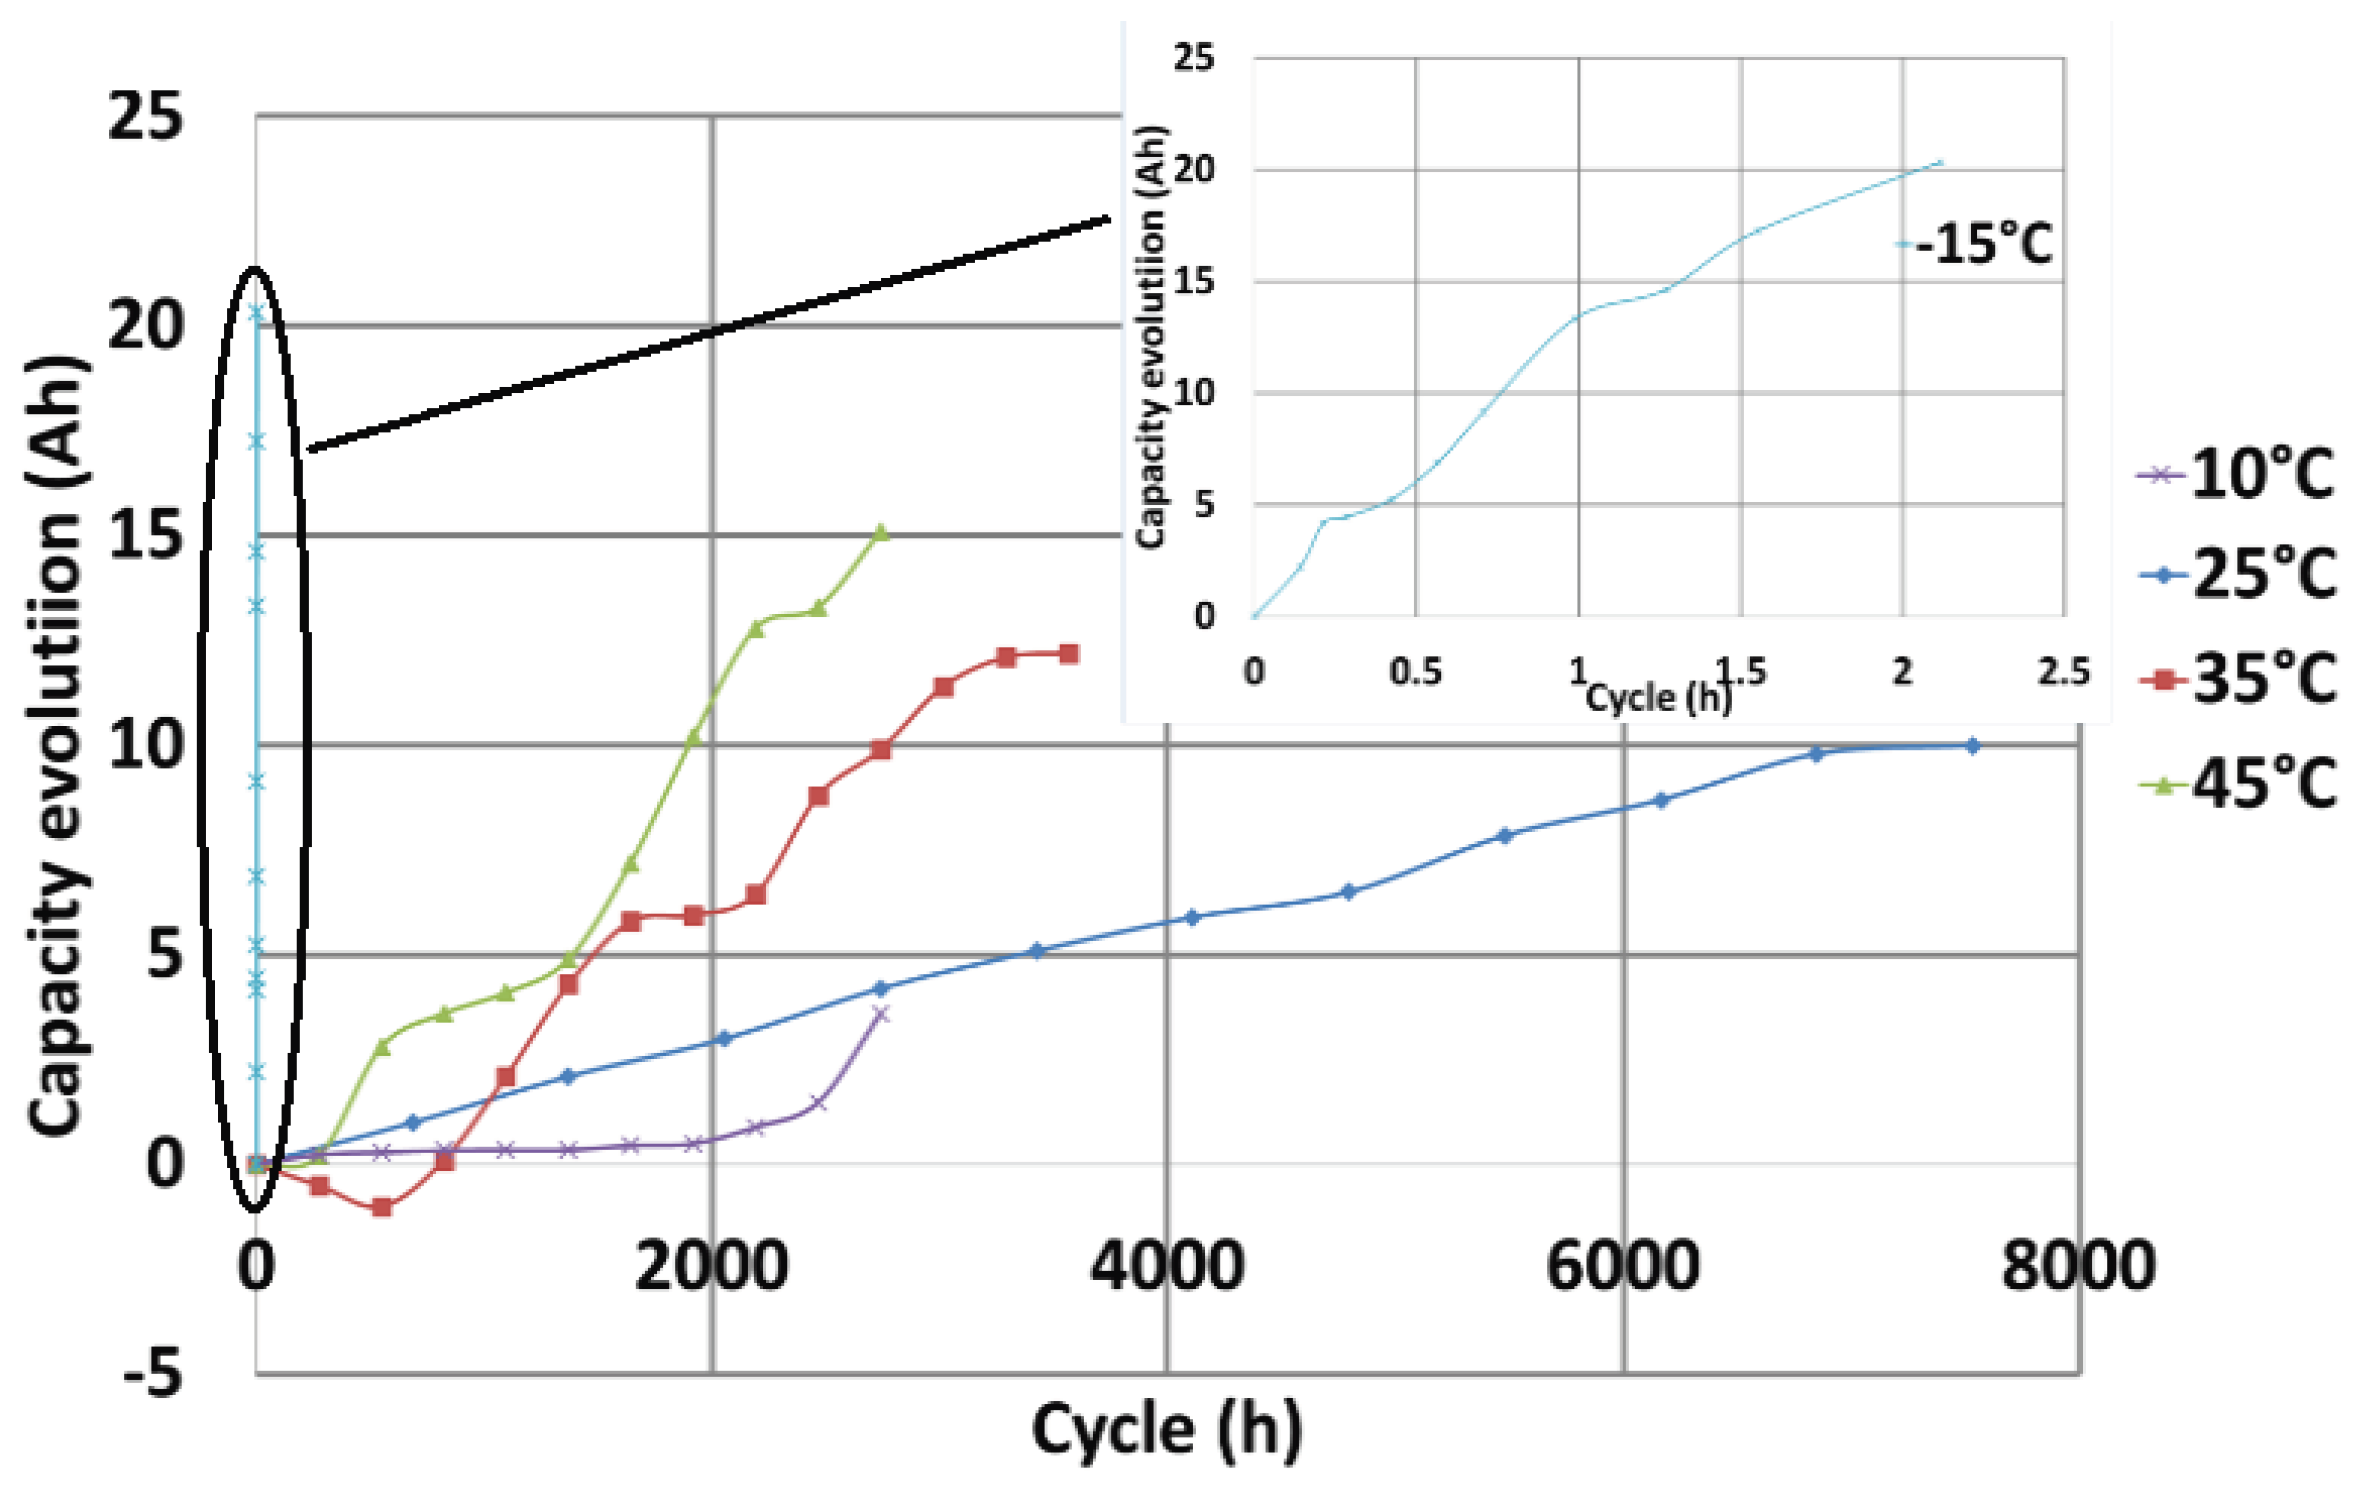
The lifetime model of the pouch cell was developed using an empirical approach. The cycling aging data had been acquired in a previous study, which proposed an extensive battery model for NMC cells. A detailed behavior of the NMC pouch cell of this work for various calendar and cycling aging profiles, as well as the internal resistance increment and capacity fade, are analyzed in [26,27], respectively. The text matrix presented a large number of variables such as depth of discharge, current rate, mid-SOC and temperature. To simplify this study and because of its significant impact on aging evolution, only the temperature dependency has been chosen. The aging model proposed in [27] combines the two aging behaviors of the NMC cell and derives a combined capacity fade behavior model, which is employed in this work and presented in Figure 4 for various temperatures.
Unfortunately, experimental raw data of either aging are not available, and authors use Figure 4 as an assumption to calculate the degradation costs in both internal and external cases. As for the former, it can be a valid assumption since both calendar and cycling aging are taking place and they cannot be separated (during cycling profiles, performance test and relaxation periods), the latter, however, has an inherited error (due to the cycling part) in the cost estimation which cannot be assessed by the authors and considered acceptable to proceed with the investigation.
A simple linear regression is implemented in order to obtain the rate of capacity fade based on cycling aging and ambient temperature. Thereafter, the aging model presented here accounts for the capacity fade by a capacity correction factor (CCF), which calculates the remaining usable capacity as in Equation (9):
where is the degradation rate from the combined aging model, N the cycle number and T the temperature (C). Data collected from the previous studies and the aging factor is derived for different temperatures and cycles, based on observations on Figure 4, and its values are summarized in Table 3.
This work focuses on the present power and capacity state of health of the battery ( apprx. at 170% and apprx. at 85%), which corresponds to state after the battery cell has been tested for the heating investigation. Both are considered adequate for model validation and preheat investigation. The pouch cell is not at the beginning of life conditions but neither its resistance value nor capacity fade are considered as limitations for this work.
3. Experimental Profiles and Model Validation
In this section, the thermal behavior of the models, operated with internal or external preheat method, is validated through experimental work. The objective is to propose a verified model able to estimate the energy cost and assess the outcomes of both methods.
3.1. Case Study
The scope is to maintain the battery cell’s temperature at a certain range over a whole night—an 8 h scenario. It is assumed as a case that a PEV is parked at a cold environment overnight and a preheat method is applied to preserve the battery cells between C and C, according to the safe and optimal operation of the lithium ion battery cells [23,28]. The preheat method is achieved with either a bi-directional square wave current pulse or external heating sources applied to its core. The same thermal strategies and current profiles are applied experimentally to the battery cell and at the model for verification purposes. Several assumptions are made as:
- The internal temperature of the battery cell is C due to the first cycle of the heating up phase.
- The ambient temperatures are set at C and C due to fast degraded performance at subzero temperatures of the pouch battery cell.
- The internal heating method (APC/bi-directional current pulses) applies a square-wave 40 A (2C of nominal current) amplitude, with a constant-low frequency 0.01 Hz and 50% duty cycle current, in order to maintain the SoC of the battery cell as close to a certain value as possible within a 100 s cycle. The external heating method heats up the cell with silicon-rubber heating sources rated at 16 W, which preserve its OCV constant throughout the whole experiment.
- The NMC/G battery cell is at the heating and temperature adjustment conditions for eight hours.
3.2. Results
3.2.1. Model Validation
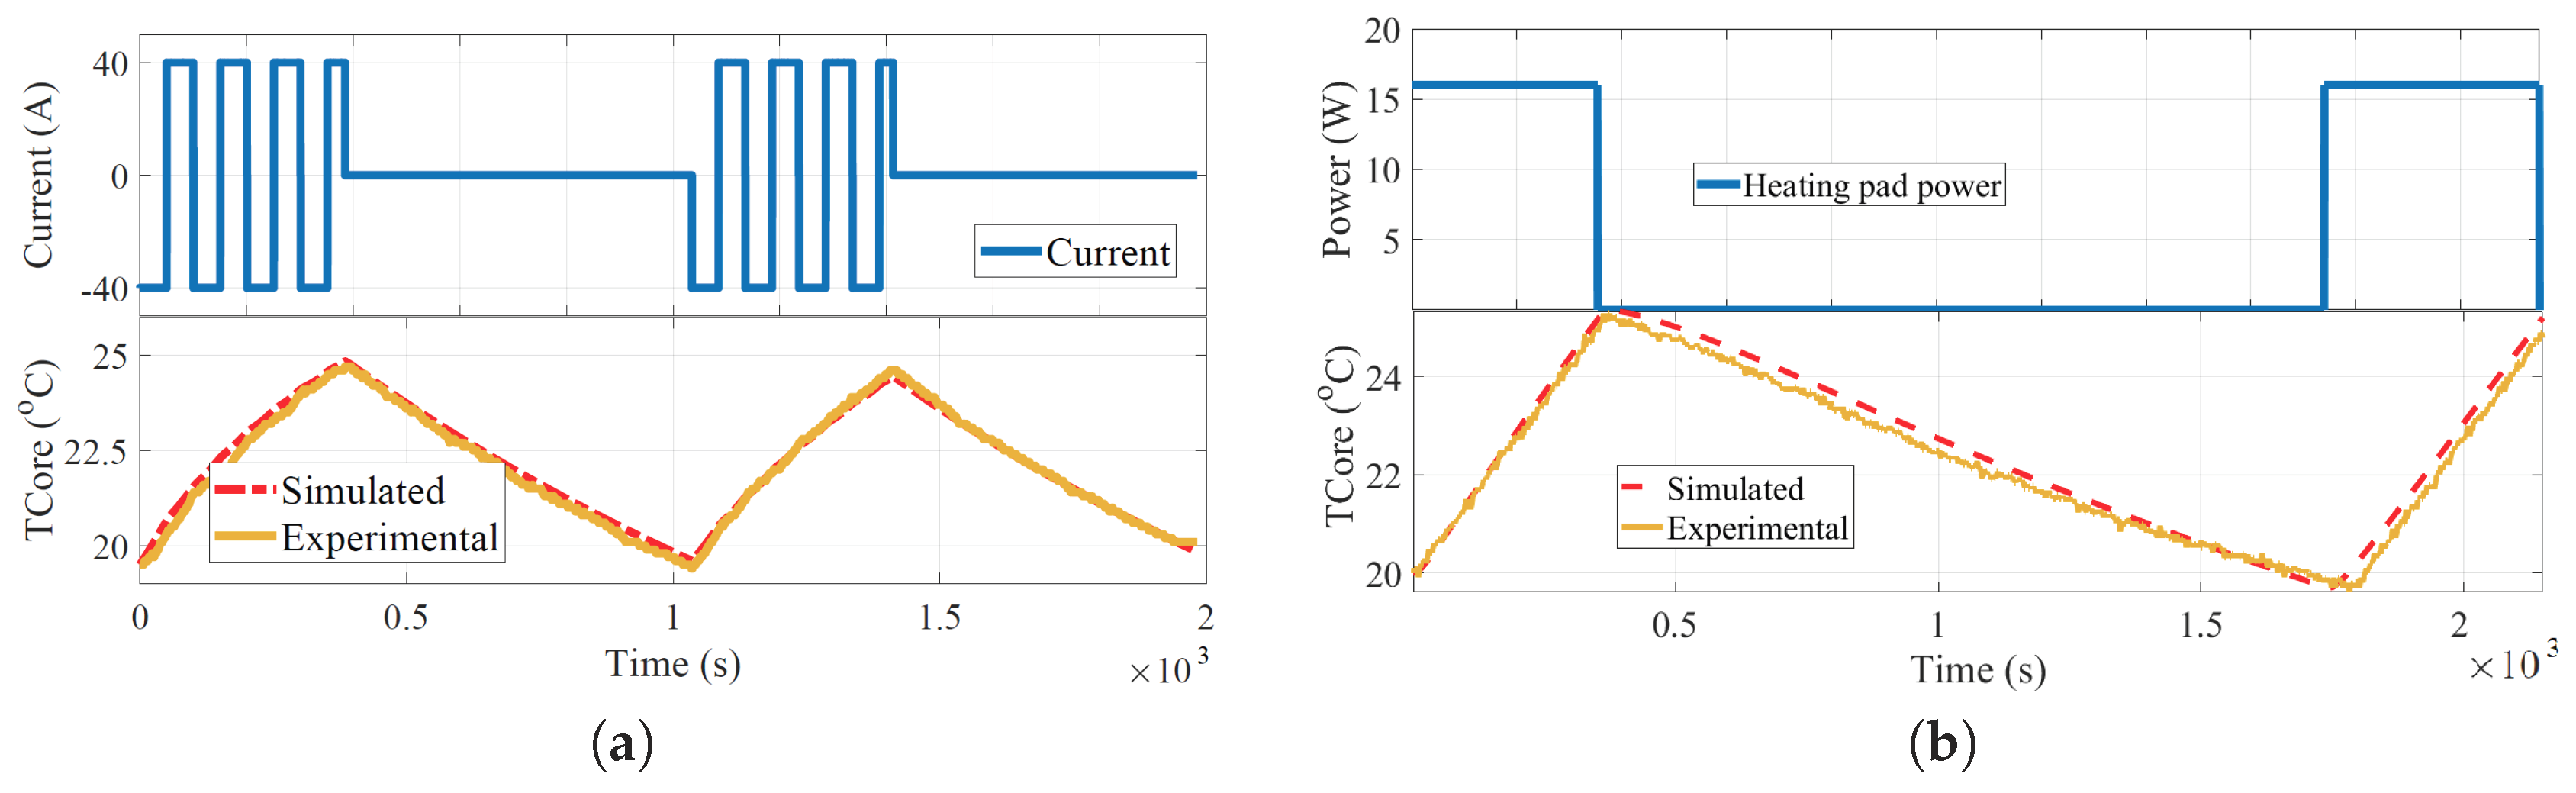
The ambient temperature is set at C and the battery cell is charged with 1C until its core temperature reaches a certain value (C) that is within its optimal temperature range and considered as the upper limit of the selected temperature preservation window. Then, both preheat methods are applied and the battery cell’s core temperature is tracked through an infrared camera. The battery cell is placed inside a climatic chamber to reproduce the cold climate conditions, and an ACT 0550 (80 channels) battery tester charger station is used to produce the bi-directional current pulses. Figure 5 presents both results.
A good agreement between the experimental and the simulated results is shown, with the accuracy being adequate to validate the model.
3.2.2. IR Images
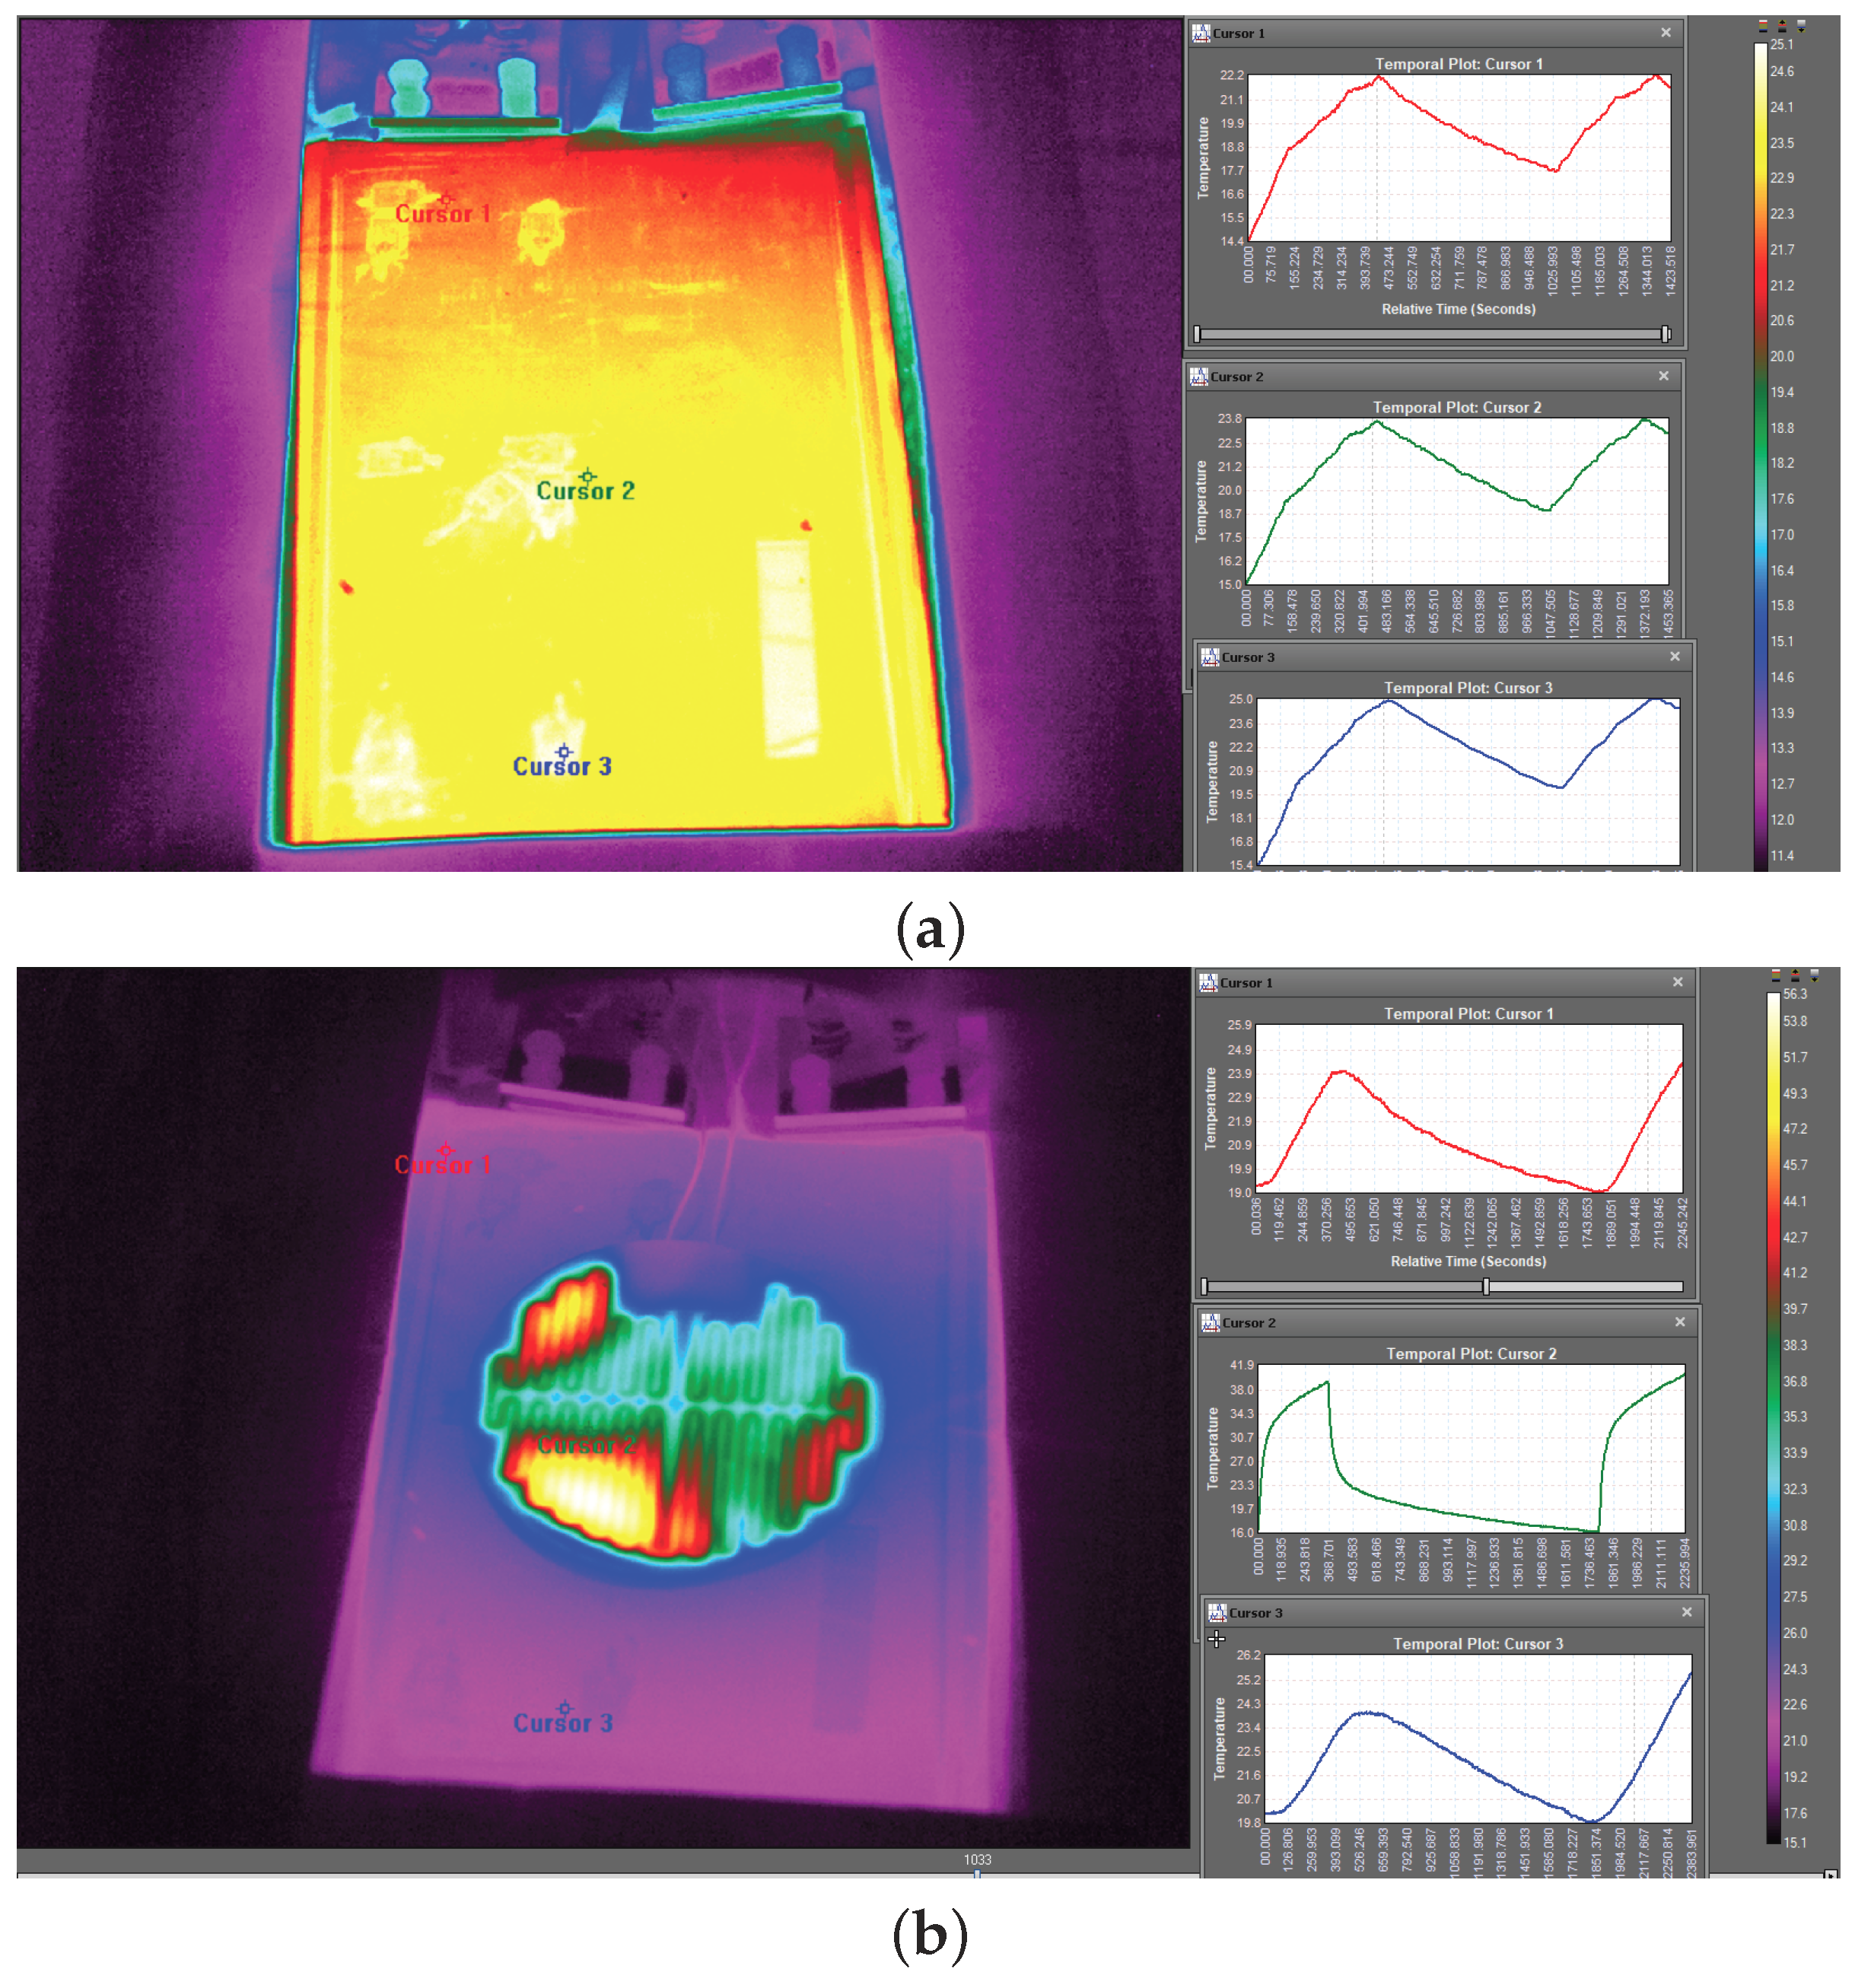
The temperature is observed during both experiments and its distribution on the core is compared. Over the lifetime of the battery cells, the non-uniformed distribution of the heat can create increased resistance and decreased capacity, and non-uniformed localized aging distribution [29]. In a battery pack topology, they might bring errors to the Battery Management System (BMS) estimations and aging evaluations. For this purpose, the temperature uniformity of the cell with both methods during the validation profile is estimated and shown in Figure 6.
Concerning the external heating method, the thickness, the dimensions and the heating power of the heating elements can effect the heating time and the temperature distribution on the cell [30]. Moreover, temperature uniformity is affected after the stop of the heating, with certain areas of the battery cell to suffer with higher values for longer periods of time. It is seen that the external heating method in this work is quite poor concerning the heat distribution throughout the whole experiment. On the contrary, the temperature uniformity is more consistent and controllable with the internal APC method, throughout the whole experiment.
4. Cost Function and Comparison of Both Methods
This section describes the cost functions to calculate the energy efficiency and gives simulation results of the preheat methods for two different ambient temperatures C and C.
4.1. Cost Functions
In order to determine a total cost of each method, this work proposes functions that combine the effects of degradation cost and the electricity price according to Equation (12):
where is the degradation factor for the NMC cell based on its price, i.e., 50 euro over the usable 20% of the capacity which turns 2.5 euro for each percentage of Lithium loss. The electricity prices for household consumers e are set to 0.22 euro/kWh, as an average cost of Europe based on Eurostat for 2018. Hereafter, the energy cost of the methods is assumed as the potential expenses on power provided by the grid at a certain price e, and it is calculated according to Equation (13):
where the cost in degradation is calculated based on the degradation factor and rate which is previously estimated in Equations (9) and (12). The energy cost is estimated from the Joule losses of the battery cell during the internal preheat method, dependent on the consumption for an eight hour case study at a euro/kWh charge rate. The is the total core resistance of the battery cell, i.e., the sum of the resistances responsible for the Joule losses on the core, and the is the power losses for the external heating as estimated in Equations (5) and (7), respectively.
4.2. Results
In this section, two different parameters that affect directly the total costs are assessed. The first one deals with the influence of the ambient temperature where two cases are evaluated at C and C. The second one compares the effects of the temperature window that the pouch battery cell is maintained during the 8 h case, i.e., either C to C, or C to C.
4.2.1. Influence of the Ambient Temperature
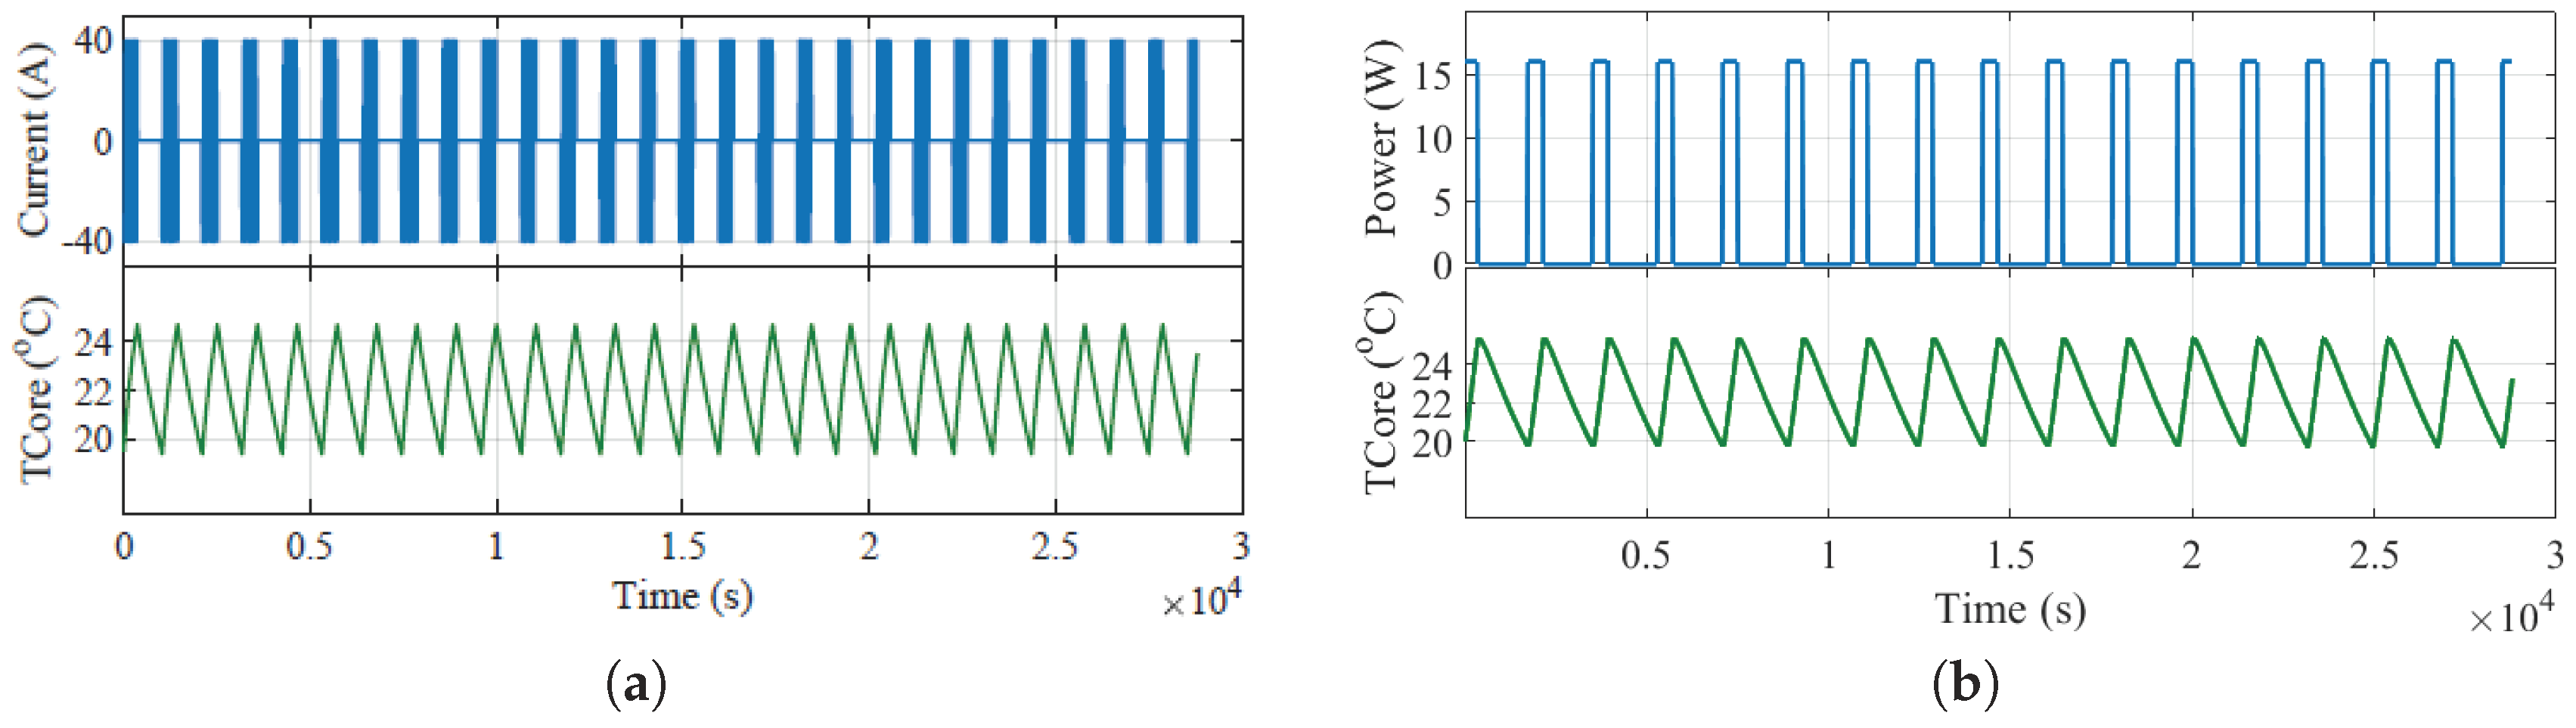
The preheat methods are set to maintain the battery cell’s core temperature between C and C, with an ambient temperature of C and C. Lower ambient temperatures are not considered for this battery cell since its degradation cost is significantly increased and the End of Life criteria are rapidly met according to Figure 4. As mentioned earlier, for the internal case, a bidirectional current pulse of certain amplitude, frequency and duty cycle is applied to the battery cell to maintain it within a predefined temperature range, whereas, for the external HP, 16W power is applied. Figure 7 and Figure 8 show the results of the methods for two different ambient temperatures, C and C, respectively, for which the current profile and the temperature evolution are depicted.
In Figure 7 and Figure 8, it can be observed that more current/power pulses are required to maintain the temperature of the cell when the ambient temperature is lower. Indeed, as explained in Equation (6), the convective heat transfer depends on the difference of the thermal gradient between the defined system and the outside temperature. In this context, if the ambient temperature is lower, the convective heat transfer is higher, thus more energy is needed to maintain the cell in a fixed temperature range.
Moreover, by comparing the heating strategies, it is seen that the heating time is approximately half for the internal method to reach the upper temperature limit as it takes more time for the heat flux to reach the battery core with the heating pads.
For C, the energy cost with the APC would increase, as the current injection and the Joule losses are higher. However, according to the aging profile of the cell, the sharp capacity fade at very low temperatures prevents any cycling in these ambient conditions. Hence, the degradation cost and the total cost are not calculated for this case as the cell would degrade sharply, but the heating pad with no cycling degradation effect is estimated. It can be observed that the decrease of temperature has an opposite effect on the total heating cost for both methods. The calculated energy, degradation and total costs are illustrated in Table 4 for three ambient temperatures.
For the internal heating method, the number of required cycling is increasing as the temperature drops, which creates a proportional increase to the degradation cost. On the other hand, for the external heating method, the degradation cost is constant because no cycling of the battery cell is happening.
In addition, as explained earlier, the aging model uses for both methods the same degradation factor which explains the more-or-less similar degradation effect of the methods. An alternative approach, since the individual models are not currently available, would be to use a zero degradation factor on the external heating method, which would consequently give zero degradation cost, or, for arbitrary use, a percentage of the degradation cost to represent the external heating method. Authors decided that these alternatives cannot be a fair assumption or a fair comparison of the methods, where the decline in the outcomes would be greater. Hence, the same degradation factor has been kept. In conclusion, as far as the degradation cost in both methods is concerned, it can be stated that, for the internal method, the cycling is increasing for the lower temperature, hence the degradation cost is increased. For the external, the degradation cost is constant because no cycling is happening, however estimated at a combined aging point of view.
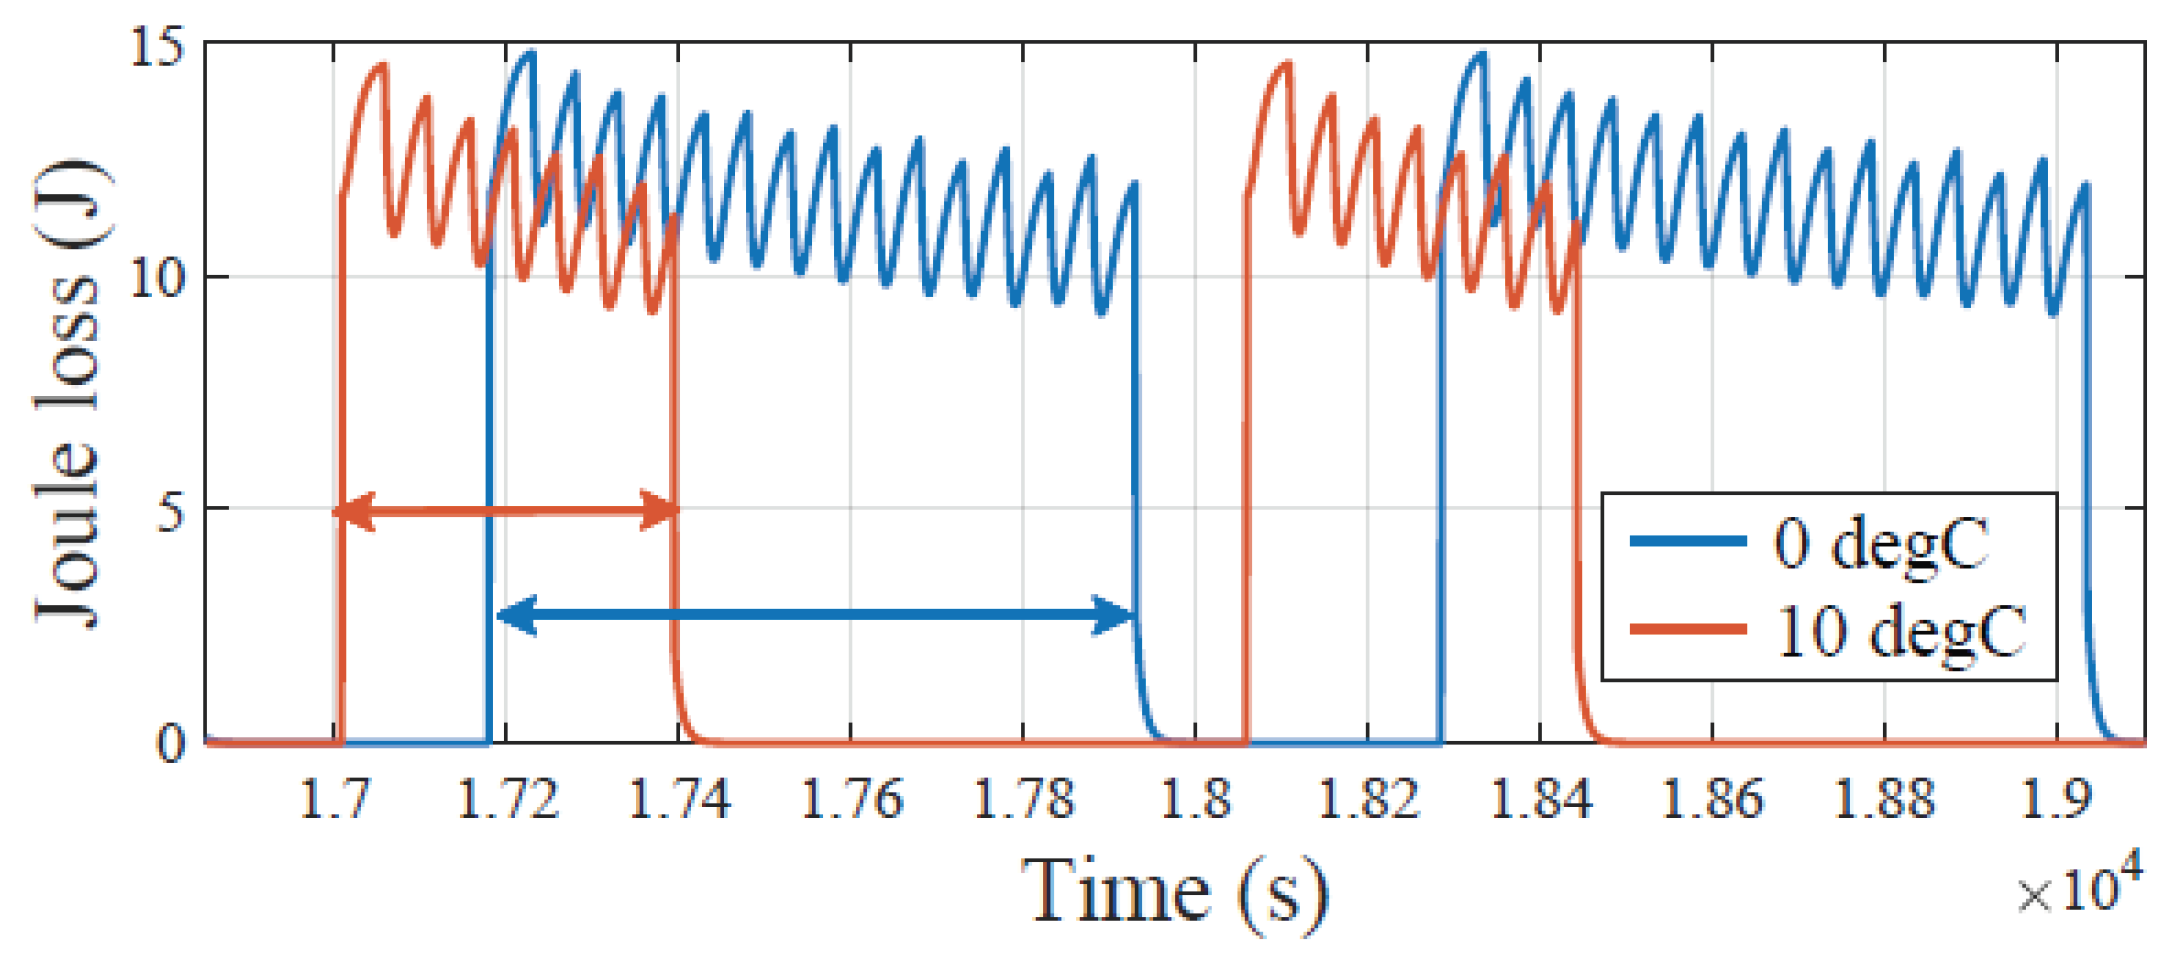
Figure 9 emphasizes the APC energy losses on the NMC cell’s core for the two ambient temperatures and a certain time frame of two pulses. As it can be seen, more Joule losses are generated in proportion to the required current to heat the battery. These losses are the potential energy expenses provided by the grid as explained in Equation (13), hence an energy cost higher is observed for a C ambient temperature. It is estimated that for C the energy cost accounts for 0.006 euro per 8 h case, whereas the double and triple cost is required for a colder weather condition at C and C.
The degradation cost is affected by many factors; nevertheless, based on Table 3, it is considered mainly by its influence to the ambient temperature. The lifetime model which provides inputs to the degradation cost is based on experimental data and methodology limitation for which the current amplitude is assumed not to influence the degradation, but only the temperature and the cycling number (life). In this regard and as far as the internal method is concerned, the degradation cost accounts for an approximate 0.024 euro of added cycling cost per 8 h case, i.e., 0.01% of total available lifetime of the cell, whereas the cost is increased as the temperature drops. As for the external heating case, the degradation cost remains the same for storing the cell (calendar aging) as zero current is flowing through the cell at any SoH, although it will be affected if the temperature would be preserved at a different target window. It is seen that the ambient temperature or the current of the APC are not affecting the degradation cost as important as the selected window, which will be further discussed in the following section.
4.2.2. Influence of the Temperature Window
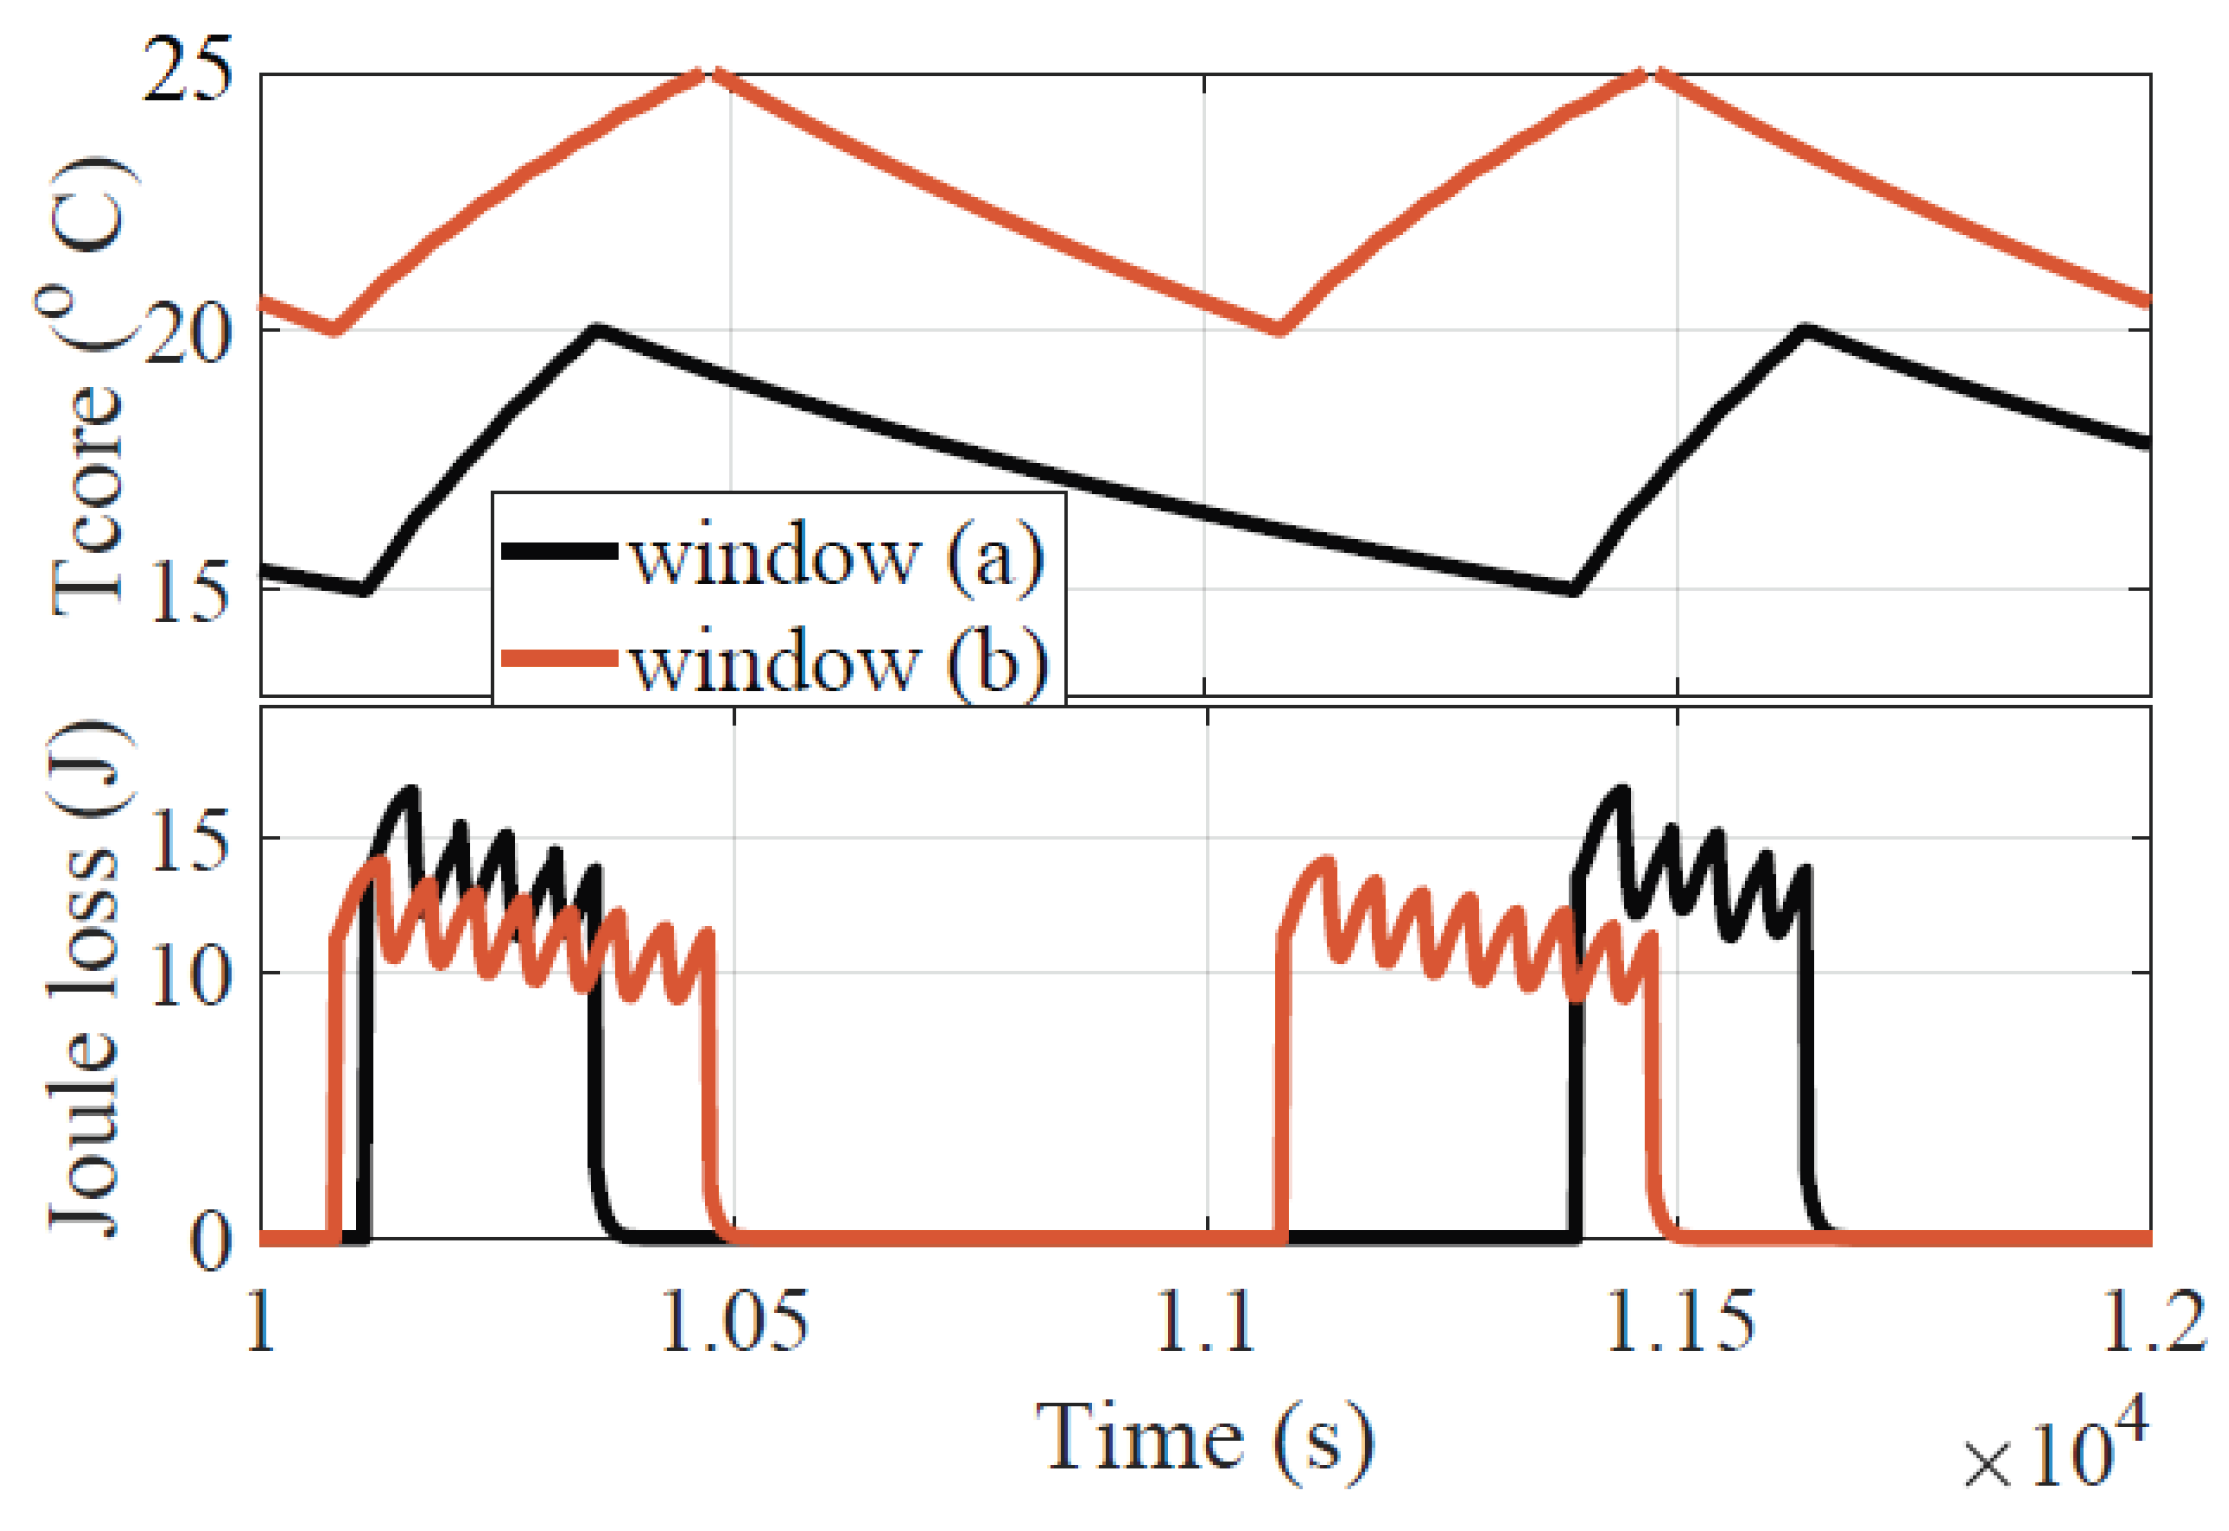
For the same current rate at 40 A and the same SoC level at both ambient temperatures, two temperature windows, i.e., C to C and C to C are tested, accounting on the safe operation area of LiBs being generally between C to C. Figure 10 shows the results of this method for the two different ranges and Table 5 indicates the estimated cost results.
What is noticeable in Figure 10 is that the energy cost for the lower temperature window is less than when selecting a higher one. The reason for that is mainly due to the losses via convective heat transfer flux, which thanks to a smaller thermal gradient difference, are lesser for a lower temperature range. Indeed, maintaining the cell at a lower temperature range requires less power or, in this case, heating time and total losses.
In addition, when the cell is operating in a lower temperature range, the internal resistance increases due to sluggish electrochemical reactions happening inside the battery cell. The internal resistance of the NMC for the two different windows (a) and (b) is estimated approximately 11 mOhms for (a) at C and 9.5 mOhms for (b) at C. This can also be seen at Figure 10 where the same current pulse generates higher instantaneous losses at those peak temperatures. Nevertheless, despite the behavior of the resistance, the overall loss is greater for the higher peak temperature (window b) for the same reason as previously mentioned.
A closer look in Figure 10 shows the temperature behavior and the corresponding energy losses for windows (a) and (b) for a certain period of the experiment. It can be observed that, for the same applied current profile (amplitude, frequency and duty cycle), a higher internal resistance leads to a higher heat generation but for a shorter time needed to reach the temperature limit.
Regarding the degradation cost, as it is listed in Table 5, it appears to be lower when the cell is maintained between C and C, than between C and C. The reason is that the degradation cost is based on a lifetime model for which the data propose a better lifetime behavior at C than at C. At the end, according to the results of the influence, this NMC/G pouch cell performs better between C to C.
It is noticeable that APC at the C ambient and window (a), it is less costly than HP at window (b) (see Table 4), and it is quite comparable to the HP at window (a) as well, which is at the rate of 0.021 euro per study case (0.004Energy + 0.017Degradation).
5. Conclusions
In this work, a 20 Ah-NMC/G battery cell is exposed to C and C ambient temperature in order to compare two preheat methods (internal: APC or bi-directional currents and external: with heating pads) that are applied to increase and preserve its core temperature between a target temperature window. During experiments on the former case, the battery cell is supplied with a 2C square wave pulse current at a frequency of 0.01 Hz and with a 50% duty cycle, whereas, experimenting on the latter case, a heating power of 16 W is supplied to both sides of the battery cell’s core by externally connected heating pads. It is shown that, in both ambient conditions, the preheat methods are able to maintain the temperature of the battery cell within the C and C range. Experimental results shown a better temperature uniformity for the internal preheat method, which is crucial for the minimization of the non-uniformed localized aging effects that can take place when externally heating the NMC cell with pads.
Then, an electro-thermal coupled to an aging model is proposed and validated with the experimental results in order to calculate the energy and the degradation cost of the heating methods, based on the generated Joule losses on the NMC core and the energy charges from the grid, as well as the degradation rate at various temperatures of the battery cell. The degradation factor is calculated based on combined calendar and aging effects, and it is constant for the external method, whereas it is increasing proportionally to the cycling, during the APC. Simulation results showed a quite low influence of the internal preheat method on the degradation cost of the battery cell with less than approximately 0.01% added total cost per day, as well as a relatively low energy charge compared to the external method. Maintaining the temperature between C to C makes not much difference in cost for both heating methods, as far as the energy costs are concerned. On the other hand, degradation costs remain constant for the external heating method if the effects of non-uniformity are neglected, which, according to the combined cycling-calendaring model proposed in this work, are approximately 5–8% less than the daily degradation costs calculated for the internal pre-heat method.
It should be noted at this point that the costs are calculated on a single battery cell and they will be increased for the total battery cells number in a battery electric vehicle application. It is also shown that the optimal heating-maintaining window for the NMC pouch cell would be between C to C resulting from the lifetime model methodology on which the data are collected and proposed solely for this work. These experimental results that show the aging effects under certain conditions at temperatures below C are expected to be published in a future report.
The internal preheat method showed better heat distribution on the cell and a comparable total cost for the battery cell. Considering also the reduced volume and maintenance that the external heating sources require as well as the potential applicability of the method, the APC appears as a challenging alternative to preheat the NMC pouch cell. Nevertheless, it would be interesting as a next step to investigate the importance of the frequency and amplitude of the pulse current applied to the battery cell, and how it can be optimized in order to further minimize the cost.
References
Author Contributions
Conceptualization, J.J.; Methodology, J.J.; Software, T.K. and J.J.; Validation, T.K.; Formal Analysis, T.K.; Investigation, T.K.; Resources, N.O. and J.V.M.; Data Curation, T.K. and J.J.; Writing—Original Draft Preparation, T.K.; Writing—Review and Editing, T.K.; Visualization, T.K.; Supervision, N.O., J.V.M. and P.V.D.B.; Project Administration, J.J.; Funding Acquisition, N.O.
Funding
This research was funded by the Flemish Agency for Innovation by Science and Technology (IWT) Grant No. IWT130019.
Acknowledgments
This research has been made possible thanks to the research project ’BATTLE’ and was funded by the Flemish Agency for Innovation and Entrepreneurship (IWT130019). Furthermore, we acknowledge Flanders Make for the support to our research team.
Conflicts of Interest
The authors declare no conflict of interest.
References
- Jaguemont, J.; Boulon, L.; Dubé, Y. A comprehensive review of lithium-ion batteries used in hybrid and electric vehicles at cold temperatures. Appl. Energy 2016, 164, 99–114. [Google Scholar] [CrossRef]
- Ji, Y.; Zhang, Y.; Wang, C.Y. Li-Ion Cell Operation at Low Temperatures. J. Electrochem. Soc. 2013, 160, A636–A649. [Google Scholar] [CrossRef]
- Park, M.; Zhang, X.; Chung, M.; Less, G.B.; Sastry, A.M. A review of conduction phenomena in Li-ion batteries. J. Power Sources 2010, 195, 7904–7929. [Google Scholar] [CrossRef]
- Jaguemont, J.; Boulon, L.; Dubé, Y.; Poudrier, D. Low Temperature Discharge Cycle Tests for a Lithium Ion Cell. In Proceedings of the 2014 IEEE Vehicle Power and Propulsion Conference (VPPC), Coimbra, Portugal, 27–30 October 2014; pp. 1–6. [Google Scholar]
- Shiao, H.C.; Chua, D.; Lin, H.P.; Slane, S.; Salomon, M. Low temperature electrolytes for Li-ion PVDF cells. J. Power Sources 2000, 87, 167–173. [Google Scholar] [CrossRef]
- Zhang, S.S.; Xu, K.; Allen, J.L.; Jow, T.R. Effect of propylene carbonate on the low temperature performance of Li-ion cells. J. Power Sources 2002, 110, 216–221. [Google Scholar] [CrossRef]
- Huang, C.K.; Sakamoto, J.S.; Wolfenstine, J.; Surampudi, S. The Limits of Low-Temperature Performance of Li-Ion Cells. J. Electrochem. Soc. 2002, 147, 2893. [Google Scholar] [CrossRef]
- Fan, J.; Tan, S. Studies on Charging Lithium-Ion Cells at Low Temperatures. J. Electrochem. Soc. 2007, 153, A1081. [Google Scholar] [CrossRef]
- Tippmann, S.; Walper, D.; Balboa, L.; Spier, B.; Bessler, W.G. Low-temperature charging of lithium-ion cells part I: Electrochemical modeling and experimental investigation of degradation behavior. J. Power Sources 2014, 252, 305–316. [Google Scholar] [CrossRef]
- Lei, Z.; Zhang, C.; Li, J.; Fan, G.; Lin, Z. Preheating method of lithium-ion batteries in an electric vehicle. J. Mod. Power Syst. Clean Energy 2015, 3, 289–296. [Google Scholar] [CrossRef]
- Samba, A.; Omar, N.; Gualous, H.; Capron, O.; Van den Bossche, P.; Van Mierlo, J. Impact of Tab Location on Large Format Lithium-Ion Pouch Cell Based on Fully Coupled Tree-Dimensional Electrochemical-Thermal Modeling. Electrochim. Acta 2014, 147, 319–329. [Google Scholar] [CrossRef]
- Vlahinos, A.; Pesaran, A.A. Energy Efficient Battery Heating in Cold Climates. SAE Tech. Pap. Ser. 2002, 1. [Google Scholar] [CrossRef]
- Jaguemont, J.; Nikolian, A.; Omar, N.; Goutam, S.; Van Mierlo, J.; Van Den Bossche, P. Development of a Two-Dimensional-Thermal Model of Three Battery Chemistries. IEEE Trans. Energy Convers. 2017, 32, 1447–1455. [Google Scholar] [CrossRef]
- de Hoog, J.; Jaguemont, J.; Abdel-Monem, M.; Van Den Bossche, P.; Van Mierlo, J.; Omar, N. Combining an Electrothermal and Impedance Aging Model to Investigate Thermal Degradation Caused by Fast Charging. Energies 2018, 11, 804. [Google Scholar] [CrossRef]
- International Electrotechnical Commission. Secondary Lithium-Ion Cells for the Propulsion of Electric Road Vehicles-Part 1: Performance Testing; Technical Report 62660-1; International Electrotechnical Commission: Geneva, Switzerland, 2011. [Google Scholar]
- Electrically Propelled Road Vehicles—Test Specification for Lithium-Ion Traction Battery Packs and Systems—Part 1: High-Power Applications; Technical Report ISO 12405-1:2011; International Organization for Standardization: Geneva, Switzerland, 2011.
- Nikolian, A.; Firouz, Y.; Gopalakrishnan, R.; Timmermans, J.M.; Omar, N.; van den Bossche, P.; van Mierlo, J. Lithium ion batteries-development of advanced electrical equivalent circuit models for nickel manganese cobalt lithium-ion. Energies 2016, 9, 360. [Google Scholar] [CrossRef]
- Farmann, A.; Sauer, D.U. Comparative study of reduced order equivalent circuit models for on-board state-of-available-power prediction of lithium-ion batteries in electric vehicles. Appl. Energy 2018, 225, 1102–1122. [Google Scholar] [CrossRef]
- Lai, X.; Zheng, Y.; Sun, T. A comparative study of different equivalent circuit models for estimating state-of-charge of lithium-ion batteries. Electrochim. Acta 2018, 259, 566–577. [Google Scholar] [CrossRef]
- Nikolian, A.; Jaguemont, J.; de Hoog, J.; Goutam, S.; Omar, N.; Van Den Bossche, P.; Van Mierlo, J. Complete cell-level lithium-ion electrical ECM model for different chemistries (NMC, LFP, LTO) and temperatures—Optimized modelling techniques. Int. J. Electr. Power Energy Syst. 2018, 98, 133–146. [Google Scholar] [CrossRef]
- Forgez, C.; Vinh Do, D.; Friedrich, G.; Morcrette, M.; Delacourt, C. Thermal modeling of a cylindrical LiFePO4/graphite lithium-ion battery. J. Power Sources 2010, 195, 2961–2968. [Google Scholar] [CrossRef]
- Bergman, T.L.; Lavigne, A.S.; Incropera, F.P.; Dewitt, D.P. Fundamentals of Heat and Mass Transfer; Wiley: Hoboken, NJ, USA, 2011; p. 1076. [Google Scholar]
- Jaguemont, J.; Boulon, L.; Dubé, Y. Characterization and modeling of a hybrid-electric-vehicle lithium-ion battery pack at low temperatures. IEEE Trans. Veh. Technol. 2016, 65, 1–14. [Google Scholar] [CrossRef]
- Ji, Y.; Wang, C.Y. Heating strategies for Li-ion batteries operated from subzero temperatures. Electrochim. Acta 2013, 107, 664–674. [Google Scholar] [CrossRef]
- Jaguemont, J.; Omar, N.; Martel, F.; Van den Bossche, P.; Van Mierlo, J. Streamline three-dimensional thermal model of a lithium titanate pouch cell battery in extreme temperature conditions with module simulation. J. Power Sources 2017, 367, 24–33. [Google Scholar] [CrossRef]
- de Hoog, J.; Jaguemont, J.; Nikolian, A.; Van Mierlo, J.; Van Den Bossche, P.; Omar, N. A combined thermo-electric resistance degradation model for nickel manganese cobalt oxide based lithium-ion cells. Appl. Therm. Eng. 2018, 135, 54–65. [Google Scholar] [CrossRef]
- de Hoog, J.; Timmermans, J.M.; Ioan-Stroe, D.; Swierczynski, M.; Jaguemont, J.; Goutam, S.; Omar, N.; Van Mierlo, J.; Van Den Bossche, P. Combined cycling and calendar capacity fade modeling of a Nickel-Manganese-Cobalt Oxide Cell with real-life profile validation. Appl. Energy 2017, 200, 47–61. [Google Scholar] [CrossRef]
- Zhang, G.; Ge, S.; Yang, X.G.; Leng, Y.; Marple, D.; Wang, C.Y. Rapid restoration of electric vehicle battery performance while driving at cold temperatures. J. Power Sources 2017, 371, 35–40. [Google Scholar] [CrossRef]
- Song, W.; Chen, M.; Bai, F.; Lin, S.; Chen, Y.; Feng, Z. Non-uniform effect on the thermal/aging performance of Lithium-ion pouch battery. Appl. Therm. Eng. 2018, 128, 1165–1174. [Google Scholar] [CrossRef]
- Lei, Z.; Zhang, Y.; Lei, X. Temperature uniformity of a heated lithium-ion battery cell in cold climate. Appl. Therm. Eng. 2018, 129, 148–154. [Google Scholar] [CrossRef]
Figure 1.
Structure of the complete modeling of the NMC/G 20 Ah pouch cell.

Figure 2.
Electrical model for the NMC pouch cell.

Figure 3.
1D thermal models for the NMC/G 20Ah pouch cell for the (a) APC—internal and (b) HP—external preheating method.
Figure 3.
1D thermal models for the NMC/G 20Ah pouch cell for the (a) APC—internal and (b) HP—external preheating method.

Figure 4.
Capacity evolution of the NMC cell based on a combined calendar and cycling aging models at various temperatures.
Figure 4.
Capacity evolution of the NMC cell based on a combined calendar and cycling aging models at various temperatures.

Figure 5.
(a) internal bi-directional current preheat and (b) externally heating profiles and models validations.
Figure 5.
(a) internal bi-directional current preheat and (b) externally heating profiles and models validations.

Figure 6.
Infrared (IR) images for (a) internal and (b) external preheat method.

Figure 7.
Simulation results for C ambient temperature with (a) the APC method; (b) the HP. Current (blue) and battery cell’s core temperature (green) maintained between C and C.
Figure 7.
Simulation results for C ambient temperature with (a) the APC method; (b) the HP. Current (blue) and battery cell’s core temperature (green) maintained between C and C.

Figure 8.
Simulation results for C ambient temperature with (a) the APC method; (b) the HP. Current (blue) and battery cell’s core temperature (green) maintained between C and C.
Figure 8.
Simulation results for C ambient temperature with (a) the APC method; (b) the HP. Current (blue) and battery cell’s core temperature (green) maintained between C and C.

Figure 9.
Energy (J) losses at C (red) and C (blue) on the NMC battery cell, for a couple of periods of the bi-directional current preheat method.
Figure 9.
Energy (J) losses at C (red) and C (blue) on the NMC battery cell, for a couple of periods of the bi-directional current preheat method.

Figure 10.
Internal heating temperature behavior and Joule losses on the NMC core at C ambient temperature and for two different cases: temperature window (a) C to C; and temperature window (b) C to C.
Figure 10.
Internal heating temperature behavior and Joule losses on the NMC core at C ambient temperature and for two different cases: temperature window (a) C to C; and temperature window (b) C to C.


Table 1.
Electromechanical properties (manufacturer). NMC pouch cell.
| Main Characteristics | Value | Unit |
|---|---|---|
| Type | NMC/G | [-] |
| Nominal voltage | 3.65 | [V] |
| Nominal capacity | 20 | [Ah] |
| Specific energy | 174 | [Wh/kg] |
| Volumetric energy density | 370 | [Wh/L] |
| End-of-charge maximum voltage | 4.2 | [V] |
| End-of-discharge cut-off voltage | 3 | [V] |
| Volumetric energy density | 370 | [Wh/L] |
| AC impedance (1 KHz) | 3 | [mOhms] |
| Recommended charge current rate | C/2 | [-] |
| Weight | 0.428 | [kg] |
| Dimensions (Length × Width × Thickness) | 217 × 130 × 7 | [mm] |
Table 2.
Heating elements features (manufacturer). NMC/G pouch cell thermal properties [13].
Table 2.
Heating elements features (manufacturer). NMC/G pouch cell thermal properties [13].
| Main Characteristics | Value | Unit |
|---|---|---|
| Specific heat () | 785 | [J/kg·K] |
| Thermal conductivity () | 30 | [W/m·K] |
| Heat transfer coefficient () | 5 | [W/m·K] |
| Density () | 2247 | [kg/m] |
| Insulation material thermal properties | ||
| Main Characteristics | Value | Unit |
| Type | Polystyrene foam | [-] |
| Specific heat () | 1100 | [J/kg·K] |
| Thermal conductivity () | 0.033 | [W/m·K] |
| Mass () | 0.145 | [kg] |
| Area () | 0.0825 | [m] |
| Thickness () | 0.005 | [m] |
| Heat transfer coefficient () | 7.7 | [W/m·K] |
| Dimensions () | 0.0825 | [m] |
| Heating pad thermal properties | ||
| Main Characteristics | Value | Unit |
| Watt densities | 0.78 | [W/cm)] |
| Specific heat () | 900 | [J/kg·K] |
| Thermal Conductivity () | 0.03 | [W/m·K] |
| Area () | 0.031 | [m] |
| Thickness () | 0.0015 | [m] |
| Wire-wound element thickness | 0.0014 | [m] |
| Dimensions () | 0.105 | [m] |
Table 3.
Degradation rate of NMC/G pouch cell.
| Temperature (C) | Degradation rate, (% per Hours of Cycling) |
|---|---|
| −15 | 10.2 |
| 10 | 0.004 |
| 25 | 0.0014 |
| 35 | 0.0034 |
| 45 | 0.0052 |
Table 4.
Costs for 8 h preheat with bi-directional current pulses method for the NMC/G pouch cell.
| Bi-directional current—Internal heating approach | |||
| Ambient Temperature (C) | Energy Cost (euro) | Degradation Cost (euro) | Total Cost (euro) |
| −15 | 0.018 | EoL conditions | EoL conditions |
| 0 | 0.012 | 0.025 | 0.037 |
| 10 | 0.006 | 0.024 | 0.030 |
| Heating pads—External heating approach | |||
| Ambient Temperature (C) | Energy Cost (euro) | Degradation Cost (euro) | Total Cost (euro) |
| −15 | 0.019 | 0.023 | 0.042 |
| 0 | 0.011 | 0.023 | 0.035 |
| 10 | 0.005 | 0.023 | 0.028 |
Table 5.
Costs for 8 h preheat with bi-directional current pulses method for the NMC/G pouch cell at different temperature ranges. Window (a): C to C, window (b): C to C.
Table 5.
Costs for 8 h preheat with bi-directional current pulses method for the NMC/G pouch cell at different temperature ranges. Window (a): C to C, window (b): C to C.
| Bi-directional Current Approach | ||||
|---|---|---|---|---|
| Ambient Temp. (C) | Temp. Window | Energy Cost (euro) | Degradation Cost (euro) | Total Cost (euro) |
| 0 | window (a) | 0.009 | 0.018 | 0.027 |
| window (b) | 0.012 | 0.025 | 0.037 | |
| 10 | window (a) | 0.005 | 0.017 | 0.022 |
| window (b) | 0.006 | 0.024 | 0.030 | |
© 2019 by the authors. Licensee MDPI, Basel, Switzerland. This article is an open access article distributed under the terms and conditions of the Creative Commons Attribution (CC BY) license (http://creativecommons.org/licenses/by/4.0/).
Share and Cite
MDPI and ACS Style
Kalogiannis, T.; Jaguemont, J.; Omar, N.; Van Mierlo, J.; Van den Bossche, P. A Comparison of Internal and External Preheat Methods for NMC Batteries. World Electr. Veh. J. 2019, 10, 18. https://doi.org/10.3390/wevj10020018
AMA Style
Kalogiannis T, Jaguemont J, Omar N, Van Mierlo J, Van den Bossche P. A Comparison of Internal and External Preheat Methods for NMC Batteries. World Electric Vehicle Journal. 2019; 10(2):18. https://doi.org/10.3390/wevj10020018
Chicago/Turabian StyleKalogiannis, Theodoros, Joris Jaguemont, Noshin Omar, Joeri Van Mierlo, and Peter Van den Bossche. 2019. "A Comparison of Internal and External Preheat Methods for NMC Batteries" World Electric Vehicle Journal 10, no. 2: 18. https://doi.org/10.3390/wevj10020018