1. Introduction
Increasing shares of intermittent renewable electricity generation, e.g., realized within the German energy transition, lead to fundamental changes of the electricity supply resulting in strongly fluctuating supply mixes and therefore varying environmental impacts. At the same time, the shift from gasoline and diesel vehicles to electric vehicles (EVs) is under way. A possibility to benefit from both trends is to establish smart charging stations in order to increase the share of renewables mutually for electricity supply and mobility.
In Germany, 99% of the vehicles are parked at home at night. Over a working day, at least 40% of all vehicles are parked at home and more than 80% of all vehicles are parked either at home or at work [
1]. This shows the potential which could be exploited by introducing controlled charging for EVs. The integration of renewable energy via controlled charging is considered within ISO 15118 [
2], which specifies the communication between EVs and the EV supply equipment [
3].
Several studies addressing the life cycle assessment (LCA) of EVs showed that the electricity mix for charging is, besides vehicle production, one of the main drivers for life cycle environmental impacts of EVs [
4,
5,
6,
7,
8,
9,
10,
11,
12,
13].
Using the example of the fluctuating electricity production mix of Belgium in 2011, Rangaraju et al. [
14] and Van Mierlo et al. [
15] showed that charging time frames have a significant impact on the Well-to-Tank emissions of BEVs. The authors in [
14] and [
15] applied the approach of Messagie et al. [
16] for the hourly LCA of the Belgian electricity production in 2011. The Belgian electricity production mix in 2011 is mainly based on nuclear energy, natural gas, and the co-combustion of hard coal and wood. Renewable energy (wood, wind, and solar) accounts for only 2% of the overall electricity production. The GWP of the Belgian electricity in 2011 is varying between 0.102 kg CO
2e/kWh and 0.262 kg CO
2e/kWh. For SO
2, NO
X, and PM emissions of the electricity production, average life cycle emission factors per fuel type are applied. Electricity imports from other countries are not analyzed, and it is assumed that that the production mix perfectly meets the electricity demand.
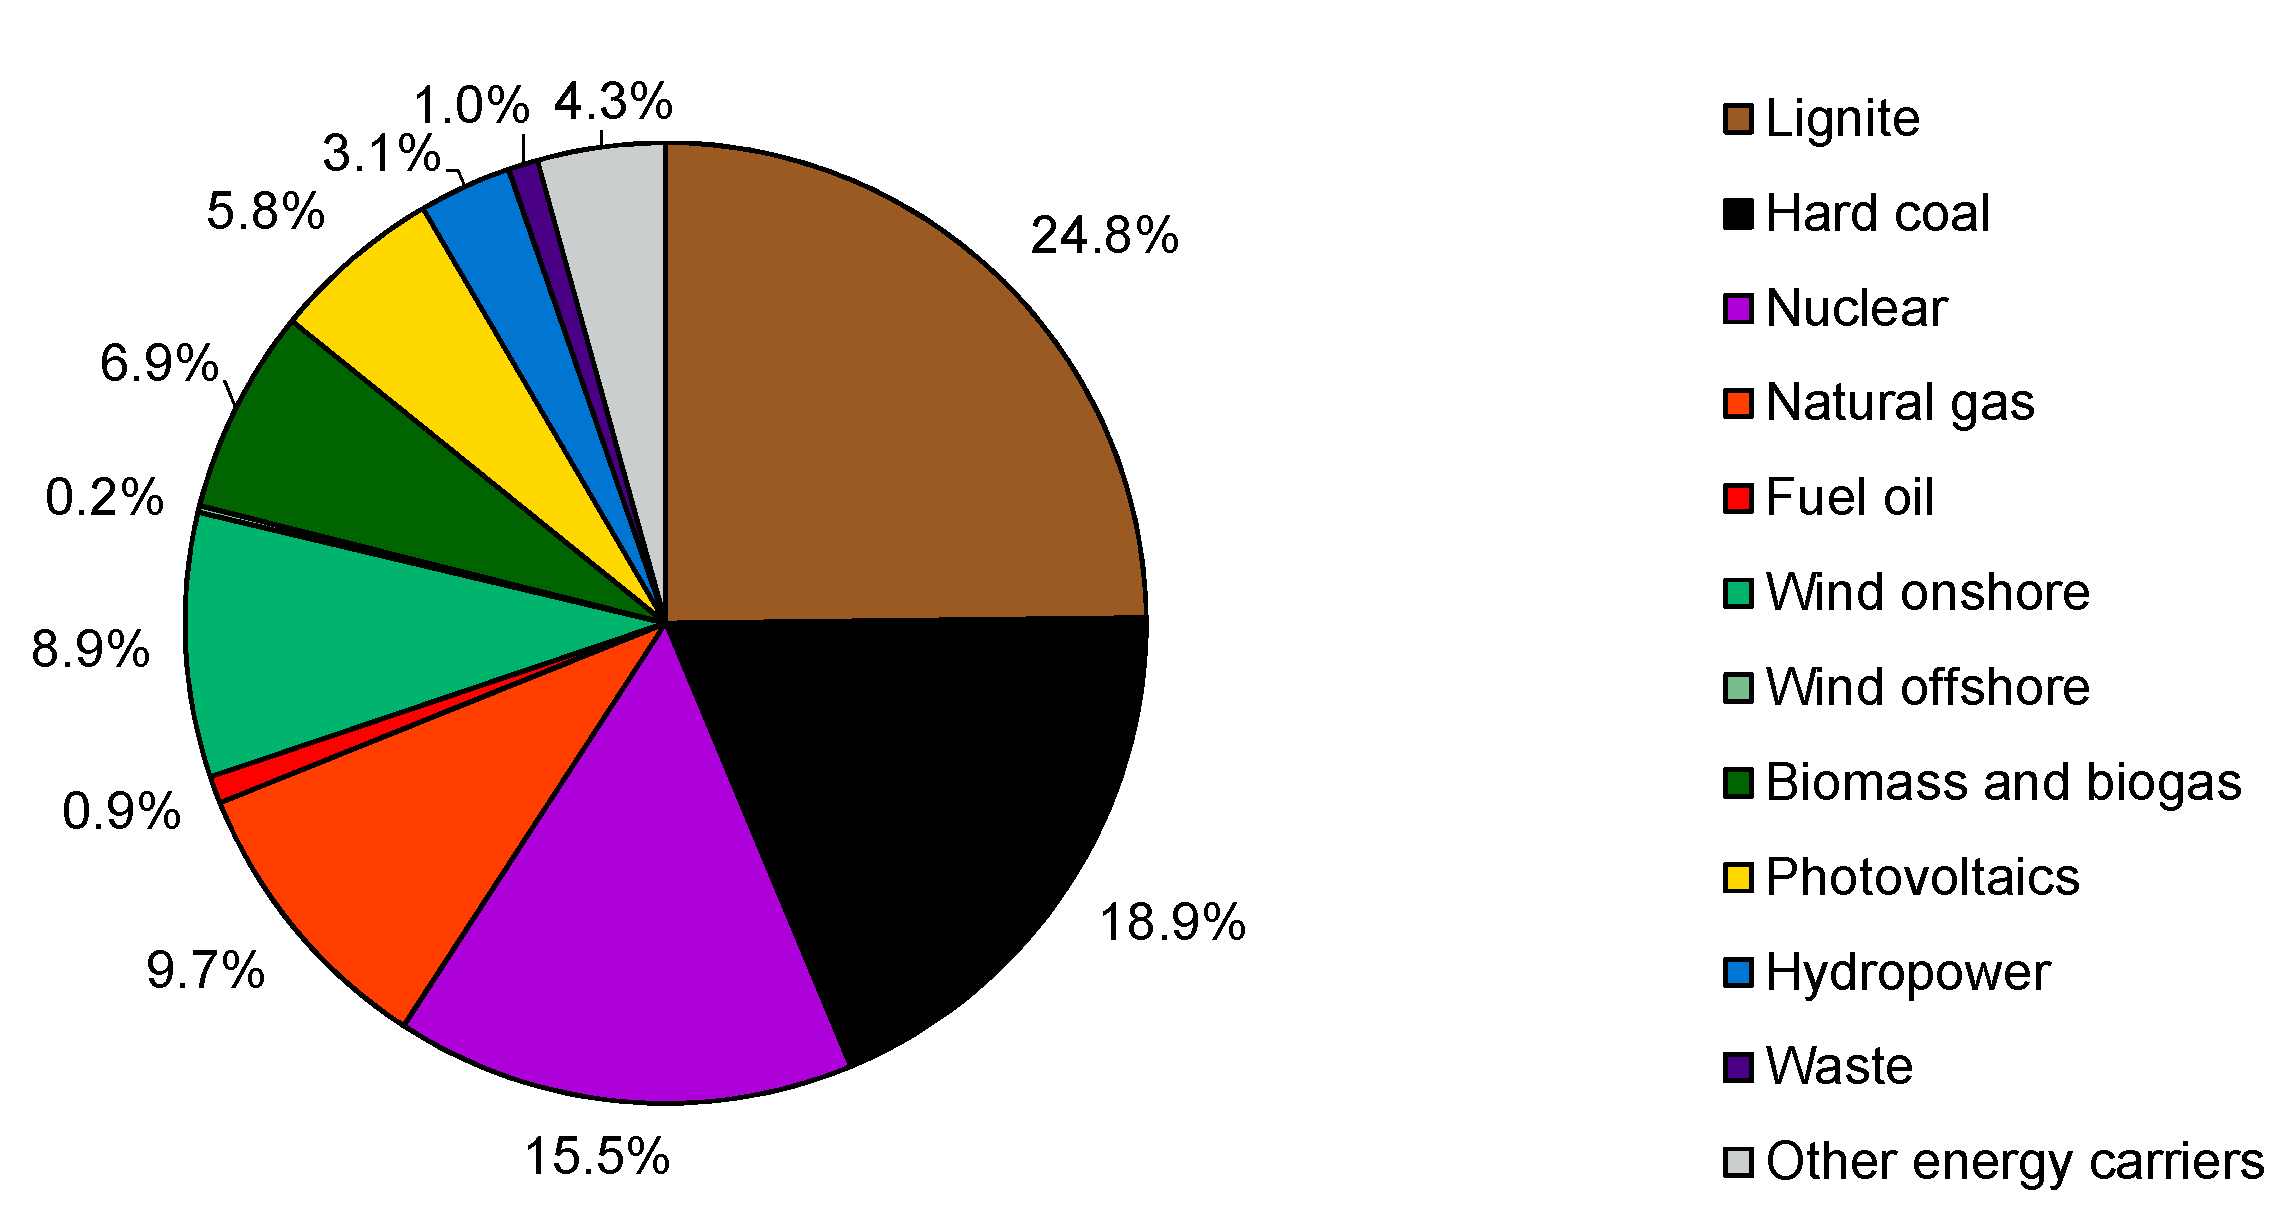
As shown in
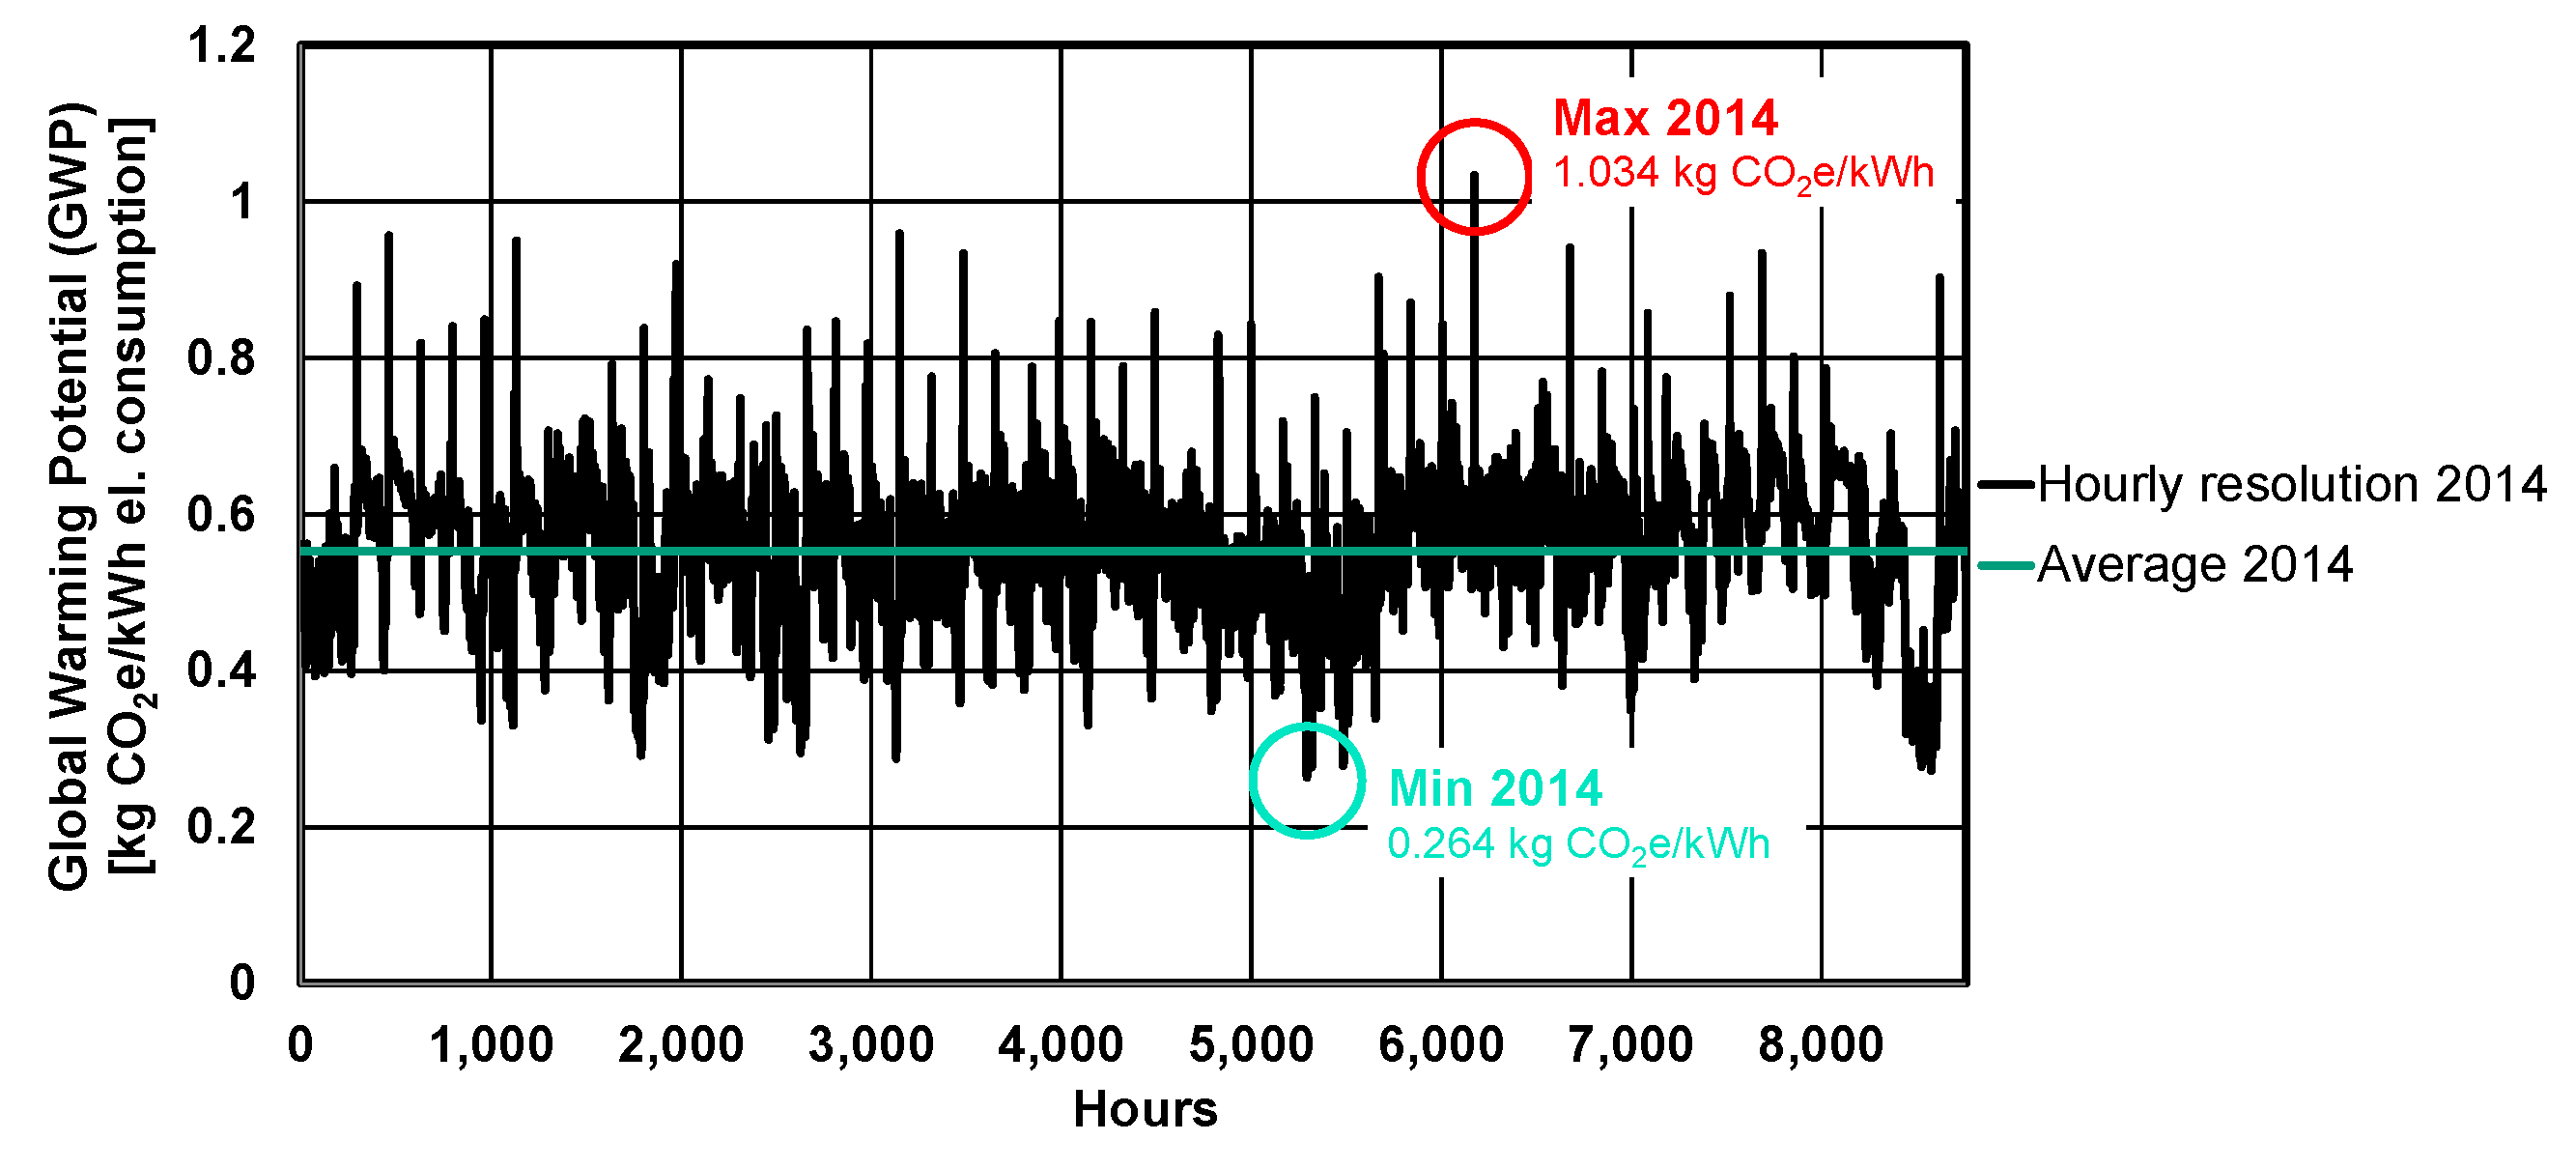
Figure 1, the German electricity production mix of 2014 differs strongly from the Belgian mix in 2011 and has high shares of electricity from dispatchable combustion power plants but also from fluctuating renewables. The GWP of the German electricity is therefore strongly varying between 0.264 and 1.034 kg CO
2e/kWh (see Figure 3).
Existing LCA approaches in common LCA databases such as GaBi [
18] or ecoinvent [
19] only use annual aggregated generation mixes with average efficiencies and emission factors. When applied to supply systems with high shares of intermittent renewables, they are not able to capture resulting varying environmental profiles, which means that high amplitudes of environmental impacts caused by situations with maximum and minimum renewable generation are not yet incorporated. The presented approach, the hourly-defined LCA (HD-LCA), aims to capture the environmental profile of electricity supply in an hourly resolution. By combining the resulting hourly resolved environmental profile and smart charging it also enables an enhancement of the LCA of EVs.
2. Materials and Methods
The results illustrated in this paper are based on the HD-LCA approach, smart charging, and data on the life cycle assessment of battery EVs (BEVs) as well as diesel and gasoline vehicles. To ensure transparency, in the following, the applied methodology and used data are described.
2.1. Hourly-Defined LCA (HD-LCA)
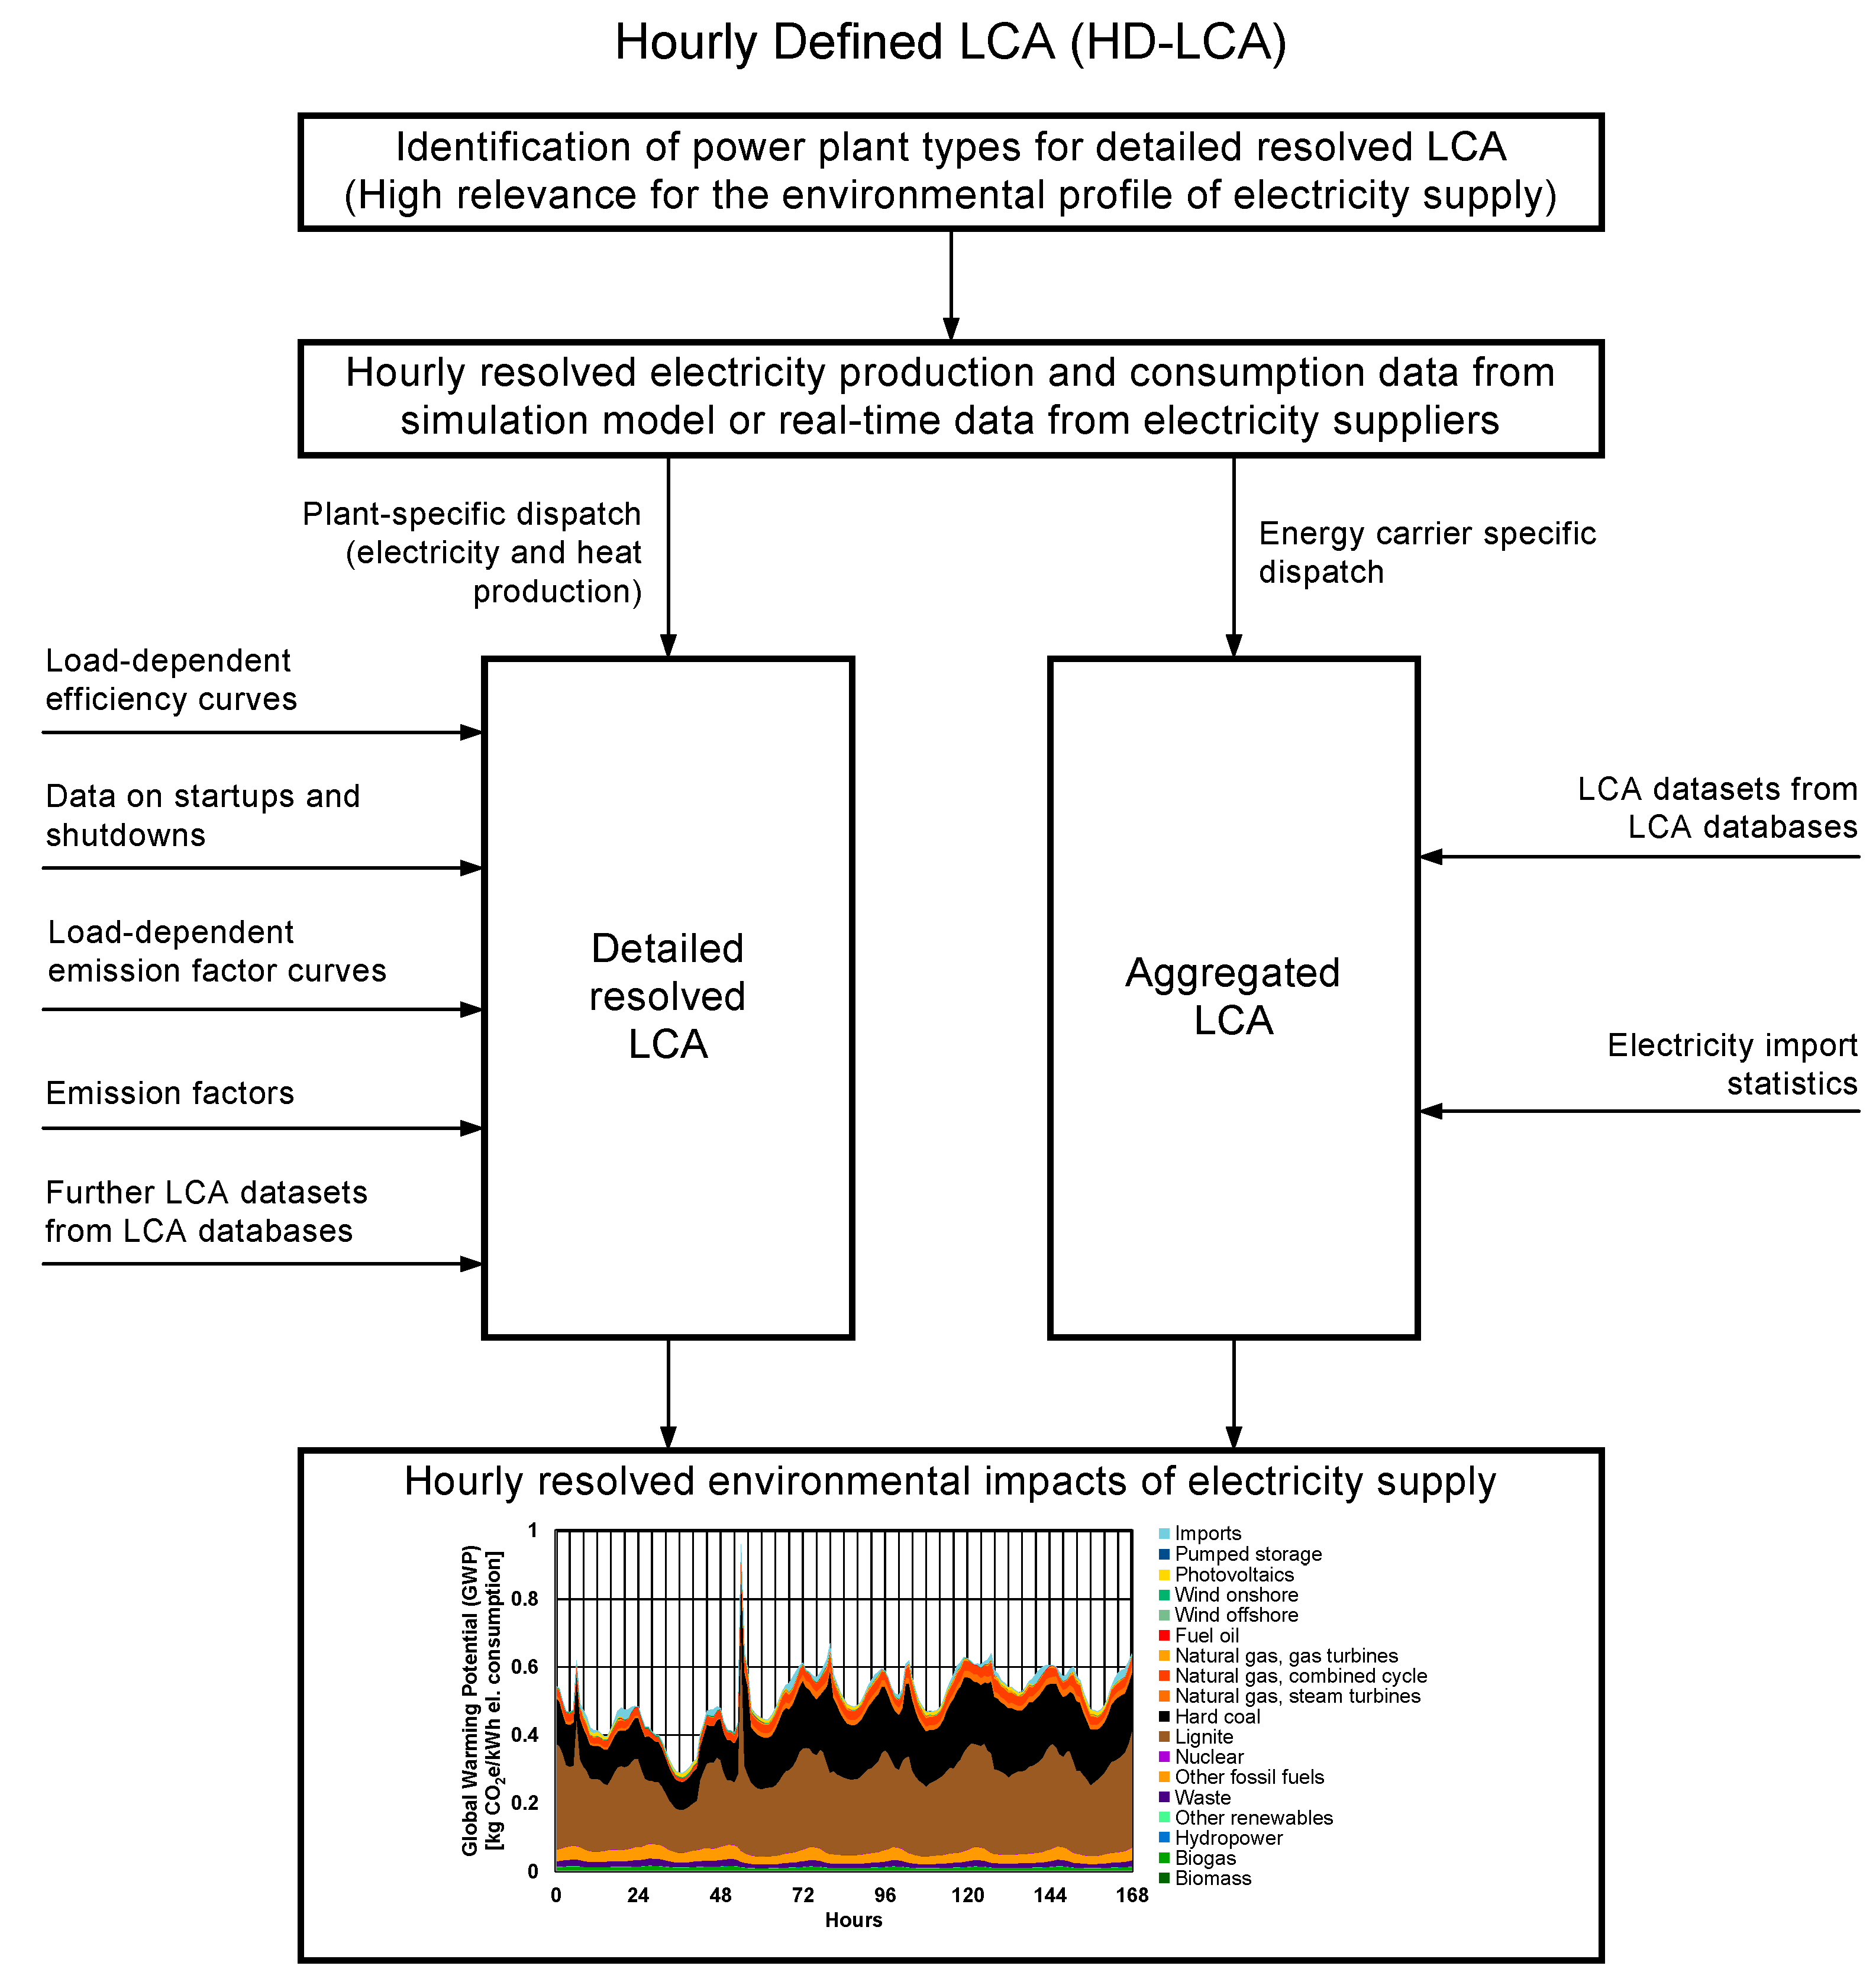
HD-LCA enables an analysis of electricity supply based on future electricity scenarios and on real-time electricity generation and consumption data. It offers a flexible connectivity to unit commitment models or real-time electricity production and consumption data from electricity suppliers or other market participants (e.g., transmission system operators). The main steps of the HD-LCA approach are illustrated in
Figure 2.
The approach provides for the combination of electricity production and consumption data and load-dependent efficiency and emission factors of combustion power plants. Electricity generation types with high relevance for the hourly resolved environmental profile of the electricity supply are analyzed with detailed resolution. The detailed resolved LCA is based on an LCA model that describes plant-specific fuel inputs and emissions in an hourly resolution. The model considers the electricity and heat generation of the single power plants as well as startups and shutdowns. The estimation of fuel inputs and emissions through load-dependent efficiency and emission factor curves (e.g., for SO
2 and NO
X emissions) ensures a realistic consideration of part-load operation. Electricity generation types with less relevance for the environmental profile are analyzed through an aggregated LCA. Detailed resolved and aggregated LCAs consider not only direct emissions from power plants but also LCA data for power plants’ infrastructure, fuel, and auxiliary material supply and disposal. Foreground data of the LCA model is based on literature research and datasets from GaBi databases [
18]. Background data is taken from GaBi databases [
18].
In this paper, HD-LCA is applied exemplarily on the German public electricity supply in 2014. The electricity production and consumption data in this example is derived from a unit commitment model of the Institute of Combustion and Power Plant Technology (IFK) at the University of Stuttgart, which delivers operation data (electricity and heat generation) of all power plants in Germany with a net capacity of >10 MW, taking into account energy-only and control reserve markets [
20,
21]. The application of the HD-LCA approach and its results covers the environmental profile for 8760 h in 2014 and illustrates the contribution of each energy carrier to the environmental profile. The environmental profile includes direct emissions from power plants, power plants’ infrastructure, fuel, and auxiliary material supply and disposal. The functional unit is defined as the provision of 1 kWh electrical energy as low voltage at the electricity consumer including losses of transmission and distribution grids and the temporal varying electricity imports from surrounding countries.
Besides the global warming potential (GWP), environmental impacts for other impact categories such as acidification potential or non-renewable primary energy demand are also available on an hourly basis for the entire year of 2014 and can be assessed for other use cases.
2.2. Smart Charging
According to ISO 15118, vehicle-to-grid communication for smart charging provides for data communication controls for the integration of renewable energy in a charging session by enabling the variation and shifting of charging loads dependent on the electricity price [
3]. As a consequence, charging stations are, in the case of high shares of renewables and potential low electricity prices, able to increase their load and thus support the feed-in of renewable energy. Based on the price and load profile, the billing for the charging session is calculated. The smart charging station described in [
3] allows for a variation of charging load of 6.928, 11.085, or 22.17 kW, depending on the electricity price.
2.3. Life Cycle Assessment of Battery Electric Vehicles
To show the impact of combining HD-LCA and smart charging on the life cycle environmental impacts of BEVs, exemplary LCA results for a compact class BEV are determined and compared to conventional diesel and gasoline vehicles. LCA data for BEV production and energy consumption from BEV usage is taken from Held et al. [
4]. For comparison of the environmental impacts, Held et al. [
4] applied average technical specifications, which were determined based on real data. The diesel and gasoline vehicles are averaged on the basis of the technical specifications of the 10 best-selling diesel and gasoline compact cars in Germany 2013 [
22].
Table 1 shows the applied technical specifications.
The results of the LCA are calculated based on a generic LCA model including vehicle production, use phase, and end-of-life. Held et al. [
4] created this generic LCA model by applying GaBi databases Service Pack 27 [
18].
The production phase includes the production of the different vehicle components and the passenger car platform, taking into account the upstream material chains and energy supply. The life cycle inventory data for material production and energy supply for production is taken from inventories in GaBi databases [
18]. The life cycle inventories of the diesel and gasoline vehicles and the vehicle platform of the BEV are based on the material mixes of comparable vehicles classes, which have been scaled according to the vehicle and platform mass by applying the approach of Held and Baumann [
9]. Life cycle inventory data for electric components (the Li-ion battery system, the electric motor, and power electronics) were also derived from Held and Baumann [
9]. For the assessment of the use phase, specifications from
Table 1 were applied. Tailpipe emissions, electricity consumption values, and fuel consumption values were considered by applying official Euro 6 limit values [
23] and the New European Driving Cycle (NEDC) [
24]. Fuel and electricity consumption values from NEDC were chosen because of their availability for compact electric, diesel, and gasoline cars from 2013. In future, emission and consumption data for comparisons of electric and conventional cars should be based on more realistic measurements, e.g., performed on the basis of the worldwide harmonized light vehicles test procedure (WLTP). The influence of the driving cycle on the fuel consumption of gasoline and diesel cars is analyzed in [
25] and [
26]. Life cycle inventory data for diesel and gasoline supply is based on inventories from GaBi databases [
18] (the well-to-wheel approach). The end-of-life of the vehicles is considered applying a cut-off approach.
3. Results
3.1. Hourly Defined LCA (HD-LCA)
The hourly resolved profile of GWP for the German public electricity supply in 2014 shows considerable positive and negative deviations from the annual average (see
Figure 3). The minimum and maximum values for 2014 are marked in
Figure 3. Both values are later applied to show the impact that the combination of HD-LCA and smart charging has on the life cycle greenhouse gas emissions of BEVs (see
Section 3.3).
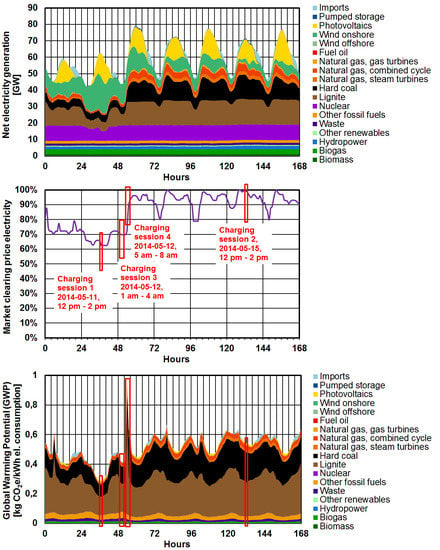
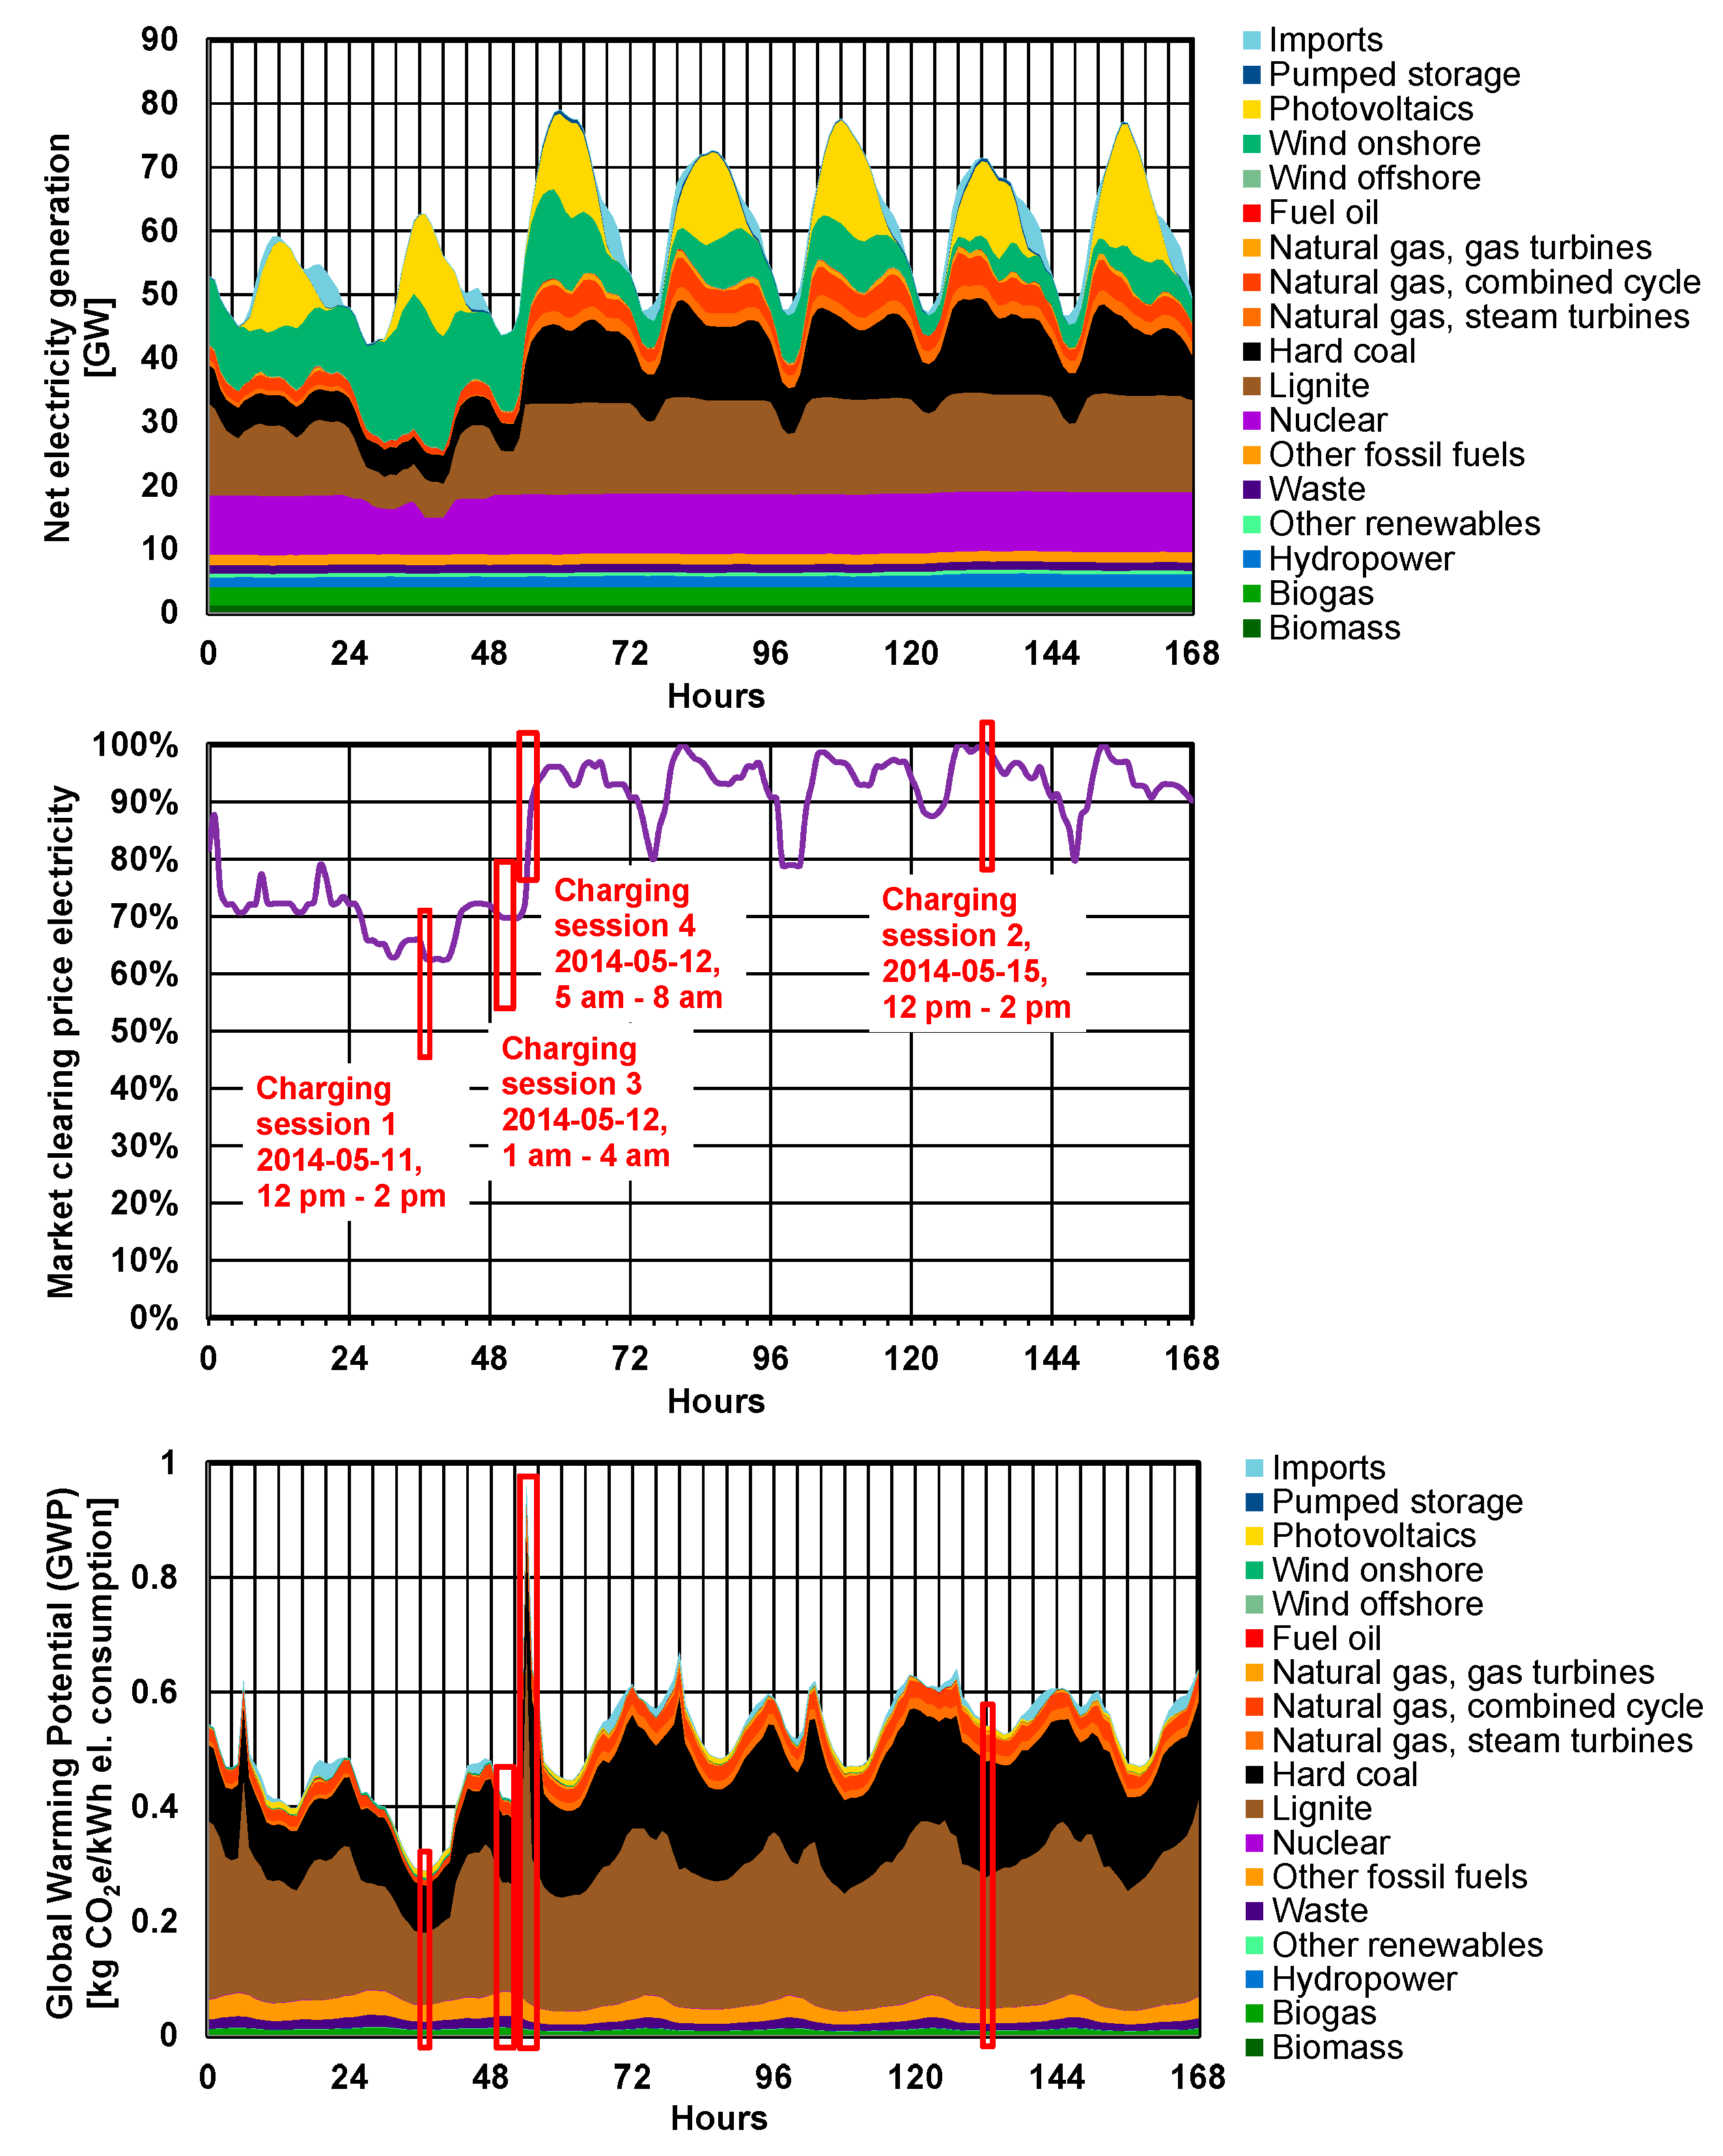
Figure 4 shows results for the net electricity generation, the relative market clearing price (MCP) for electricity, and the GWP for an exemplary week from 10 May 2014 (Saturday) to 16 May 2014 (Friday). The time periods marked in
Figure 4 are used for the calculation of the GWPs of the two exemplary charging sessions (see
Section 3.2). The hourly resolved MCPs are related to the maximum occurring MCP in the exemplary week. The MCPs are a result of the IFK unit commitment model [
20,
21]. The GWP for the exemplary week illustrates how the environmental profile in
Figure 3 is calculated. When electricity generation from wind and photovoltaics decreases, fossil-fueled power plants have to start up, resulting in environmental impact peaks. The contributions to the GWP from startups of lignite, hard coal, and natural gas power plants during hours with decreasing electricity generation from fluctuating renewables and/or increasing electricity demand are significant. Shutdowns contribute to a lesser extent to the environmental profile. However, in hours with increasing electricity generation from fluctuating renewables and/or decreasing electricity consumption, their contribution is also significant.
3.2. Combination of HD-LCA and Smart Charging
As mentioned before, the charging profile of every single controlled charging session is recorded for billing purposes. By combining this detailed charging data with HD-LCA, the detailed environmental profiles of the consumed electricity during the charging sessions can be calculated.
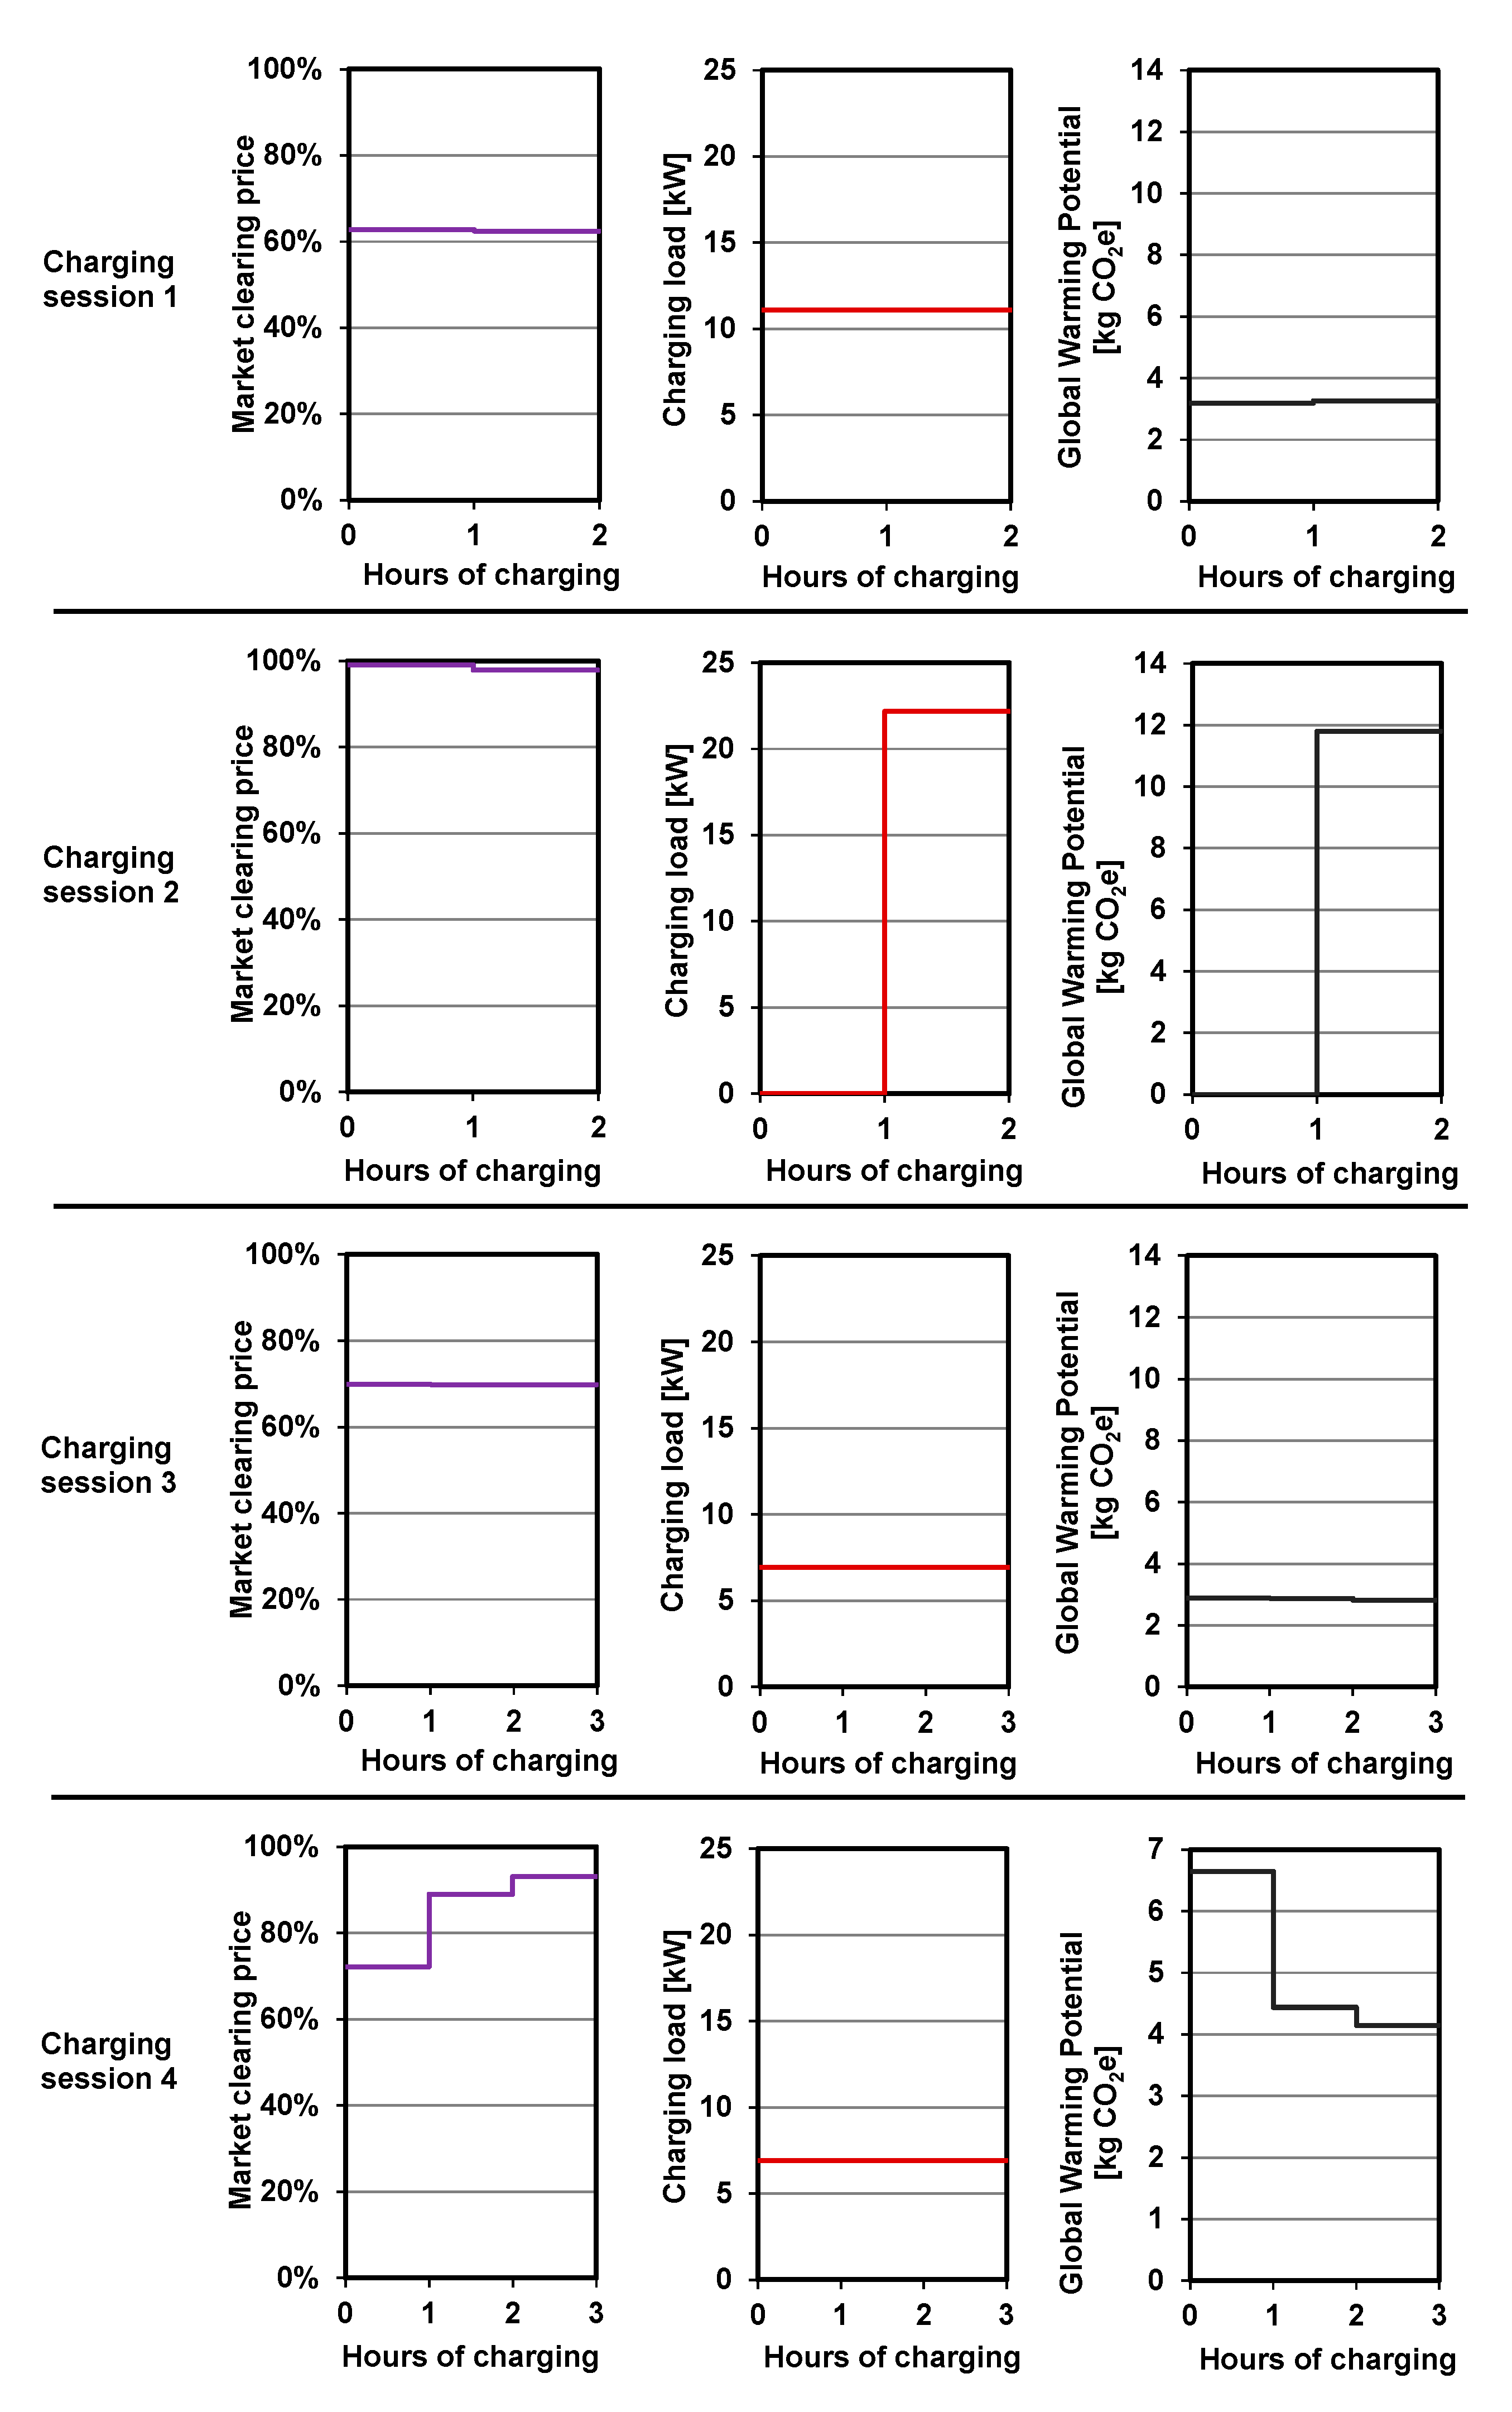
To illustrate the differences resulting from different time periods of the charging sessions, the market clearing price for electricity, the charging load profile, and the resulting GWP of four exemplary charging sessions are compared (see
Figure 5).
Charging Sessions 1 and 2 are assumed to deliver the same amount of electric energy (22.17 kWh) and to be conducted at the same time of day for the same duration (2 h, 12–2 p.m.). Charging Session 1 takes place on Sunday, May 11, 2014, Charging Session 2 on Thursday, May 15, 2014. Due to the different market clearing prices, the charging load profile of the charging sessions is assumed to be different. Since the electricity price is constantly low, Charging Session 1 is conducted with a constant charging load of 11.085 kW. During Charging Session 2, the electricity price decreases, so it is assumed that the charging load is increased from 0 to 22.17 kW between the first and the second hour of charging to optimize the price for the charging session.
Charging Sessions 3 and 4 are assumed to be conducted with a constant load of 6.928 kW over the duration of three hours (20.784 kWh). Both sessions are supposed to be conducted by a charging station without load variation capabilities. The sessions take place in two different time frames (1–4 a.m. and 5–8 a.m.) in the early morning of Monday, May 12, 2014 with the goal to deliver a charged battery to the car driver in the morning. During Charging Session 4, the GWP increases by approximately 120% to 0.959 kg CO2e per kWh electricity consumption due to startups of numerous lignite and hard coal power plants between 5 and 6 a.m.
The GWP of a charging session is calculated by the multiplication of the amount of the electric energy and the GWP per kWh electricity in every hour. The GWP of a charging session is then determined based on the sum of the GWPs of the hours of charging. The GWPs of the four charging sessions are summarized in
Table 2.
As can be seen in
Table 2, the environmental profile of every charging session is strongly dependent on the actual environmental profile of the electricity supply and the charging load profile. Charging Session 2 causes 88% higher greenhouse gas emissions than Charging Session 1. The low GWP of Charging Session 1 is mainly a result of a significant share of electricity from wind power. Charging Session 3 causes 77% higher GHG emissions than Charging Session 4 because of the startups of lignite and hard coal power plants.
3.3. Impacts on Life Cycle Assessment Results of Electric Vehicles
By using the example of the hourly resolved GWP of the German public electricity supply in 2014 (see
Figure 3), the impacts of combining HD-LCA and smart charging on the life cycle environmental impacts of EVs are illustrated. Based on the LCA data for a compact class BEV and compact diesel and gasoline cars (see description in
Section 2.3), the influence of capturing the GWP of electricity supply in an hourly resolution on the greenhouse gas emissions of BEV life cycle is determined.
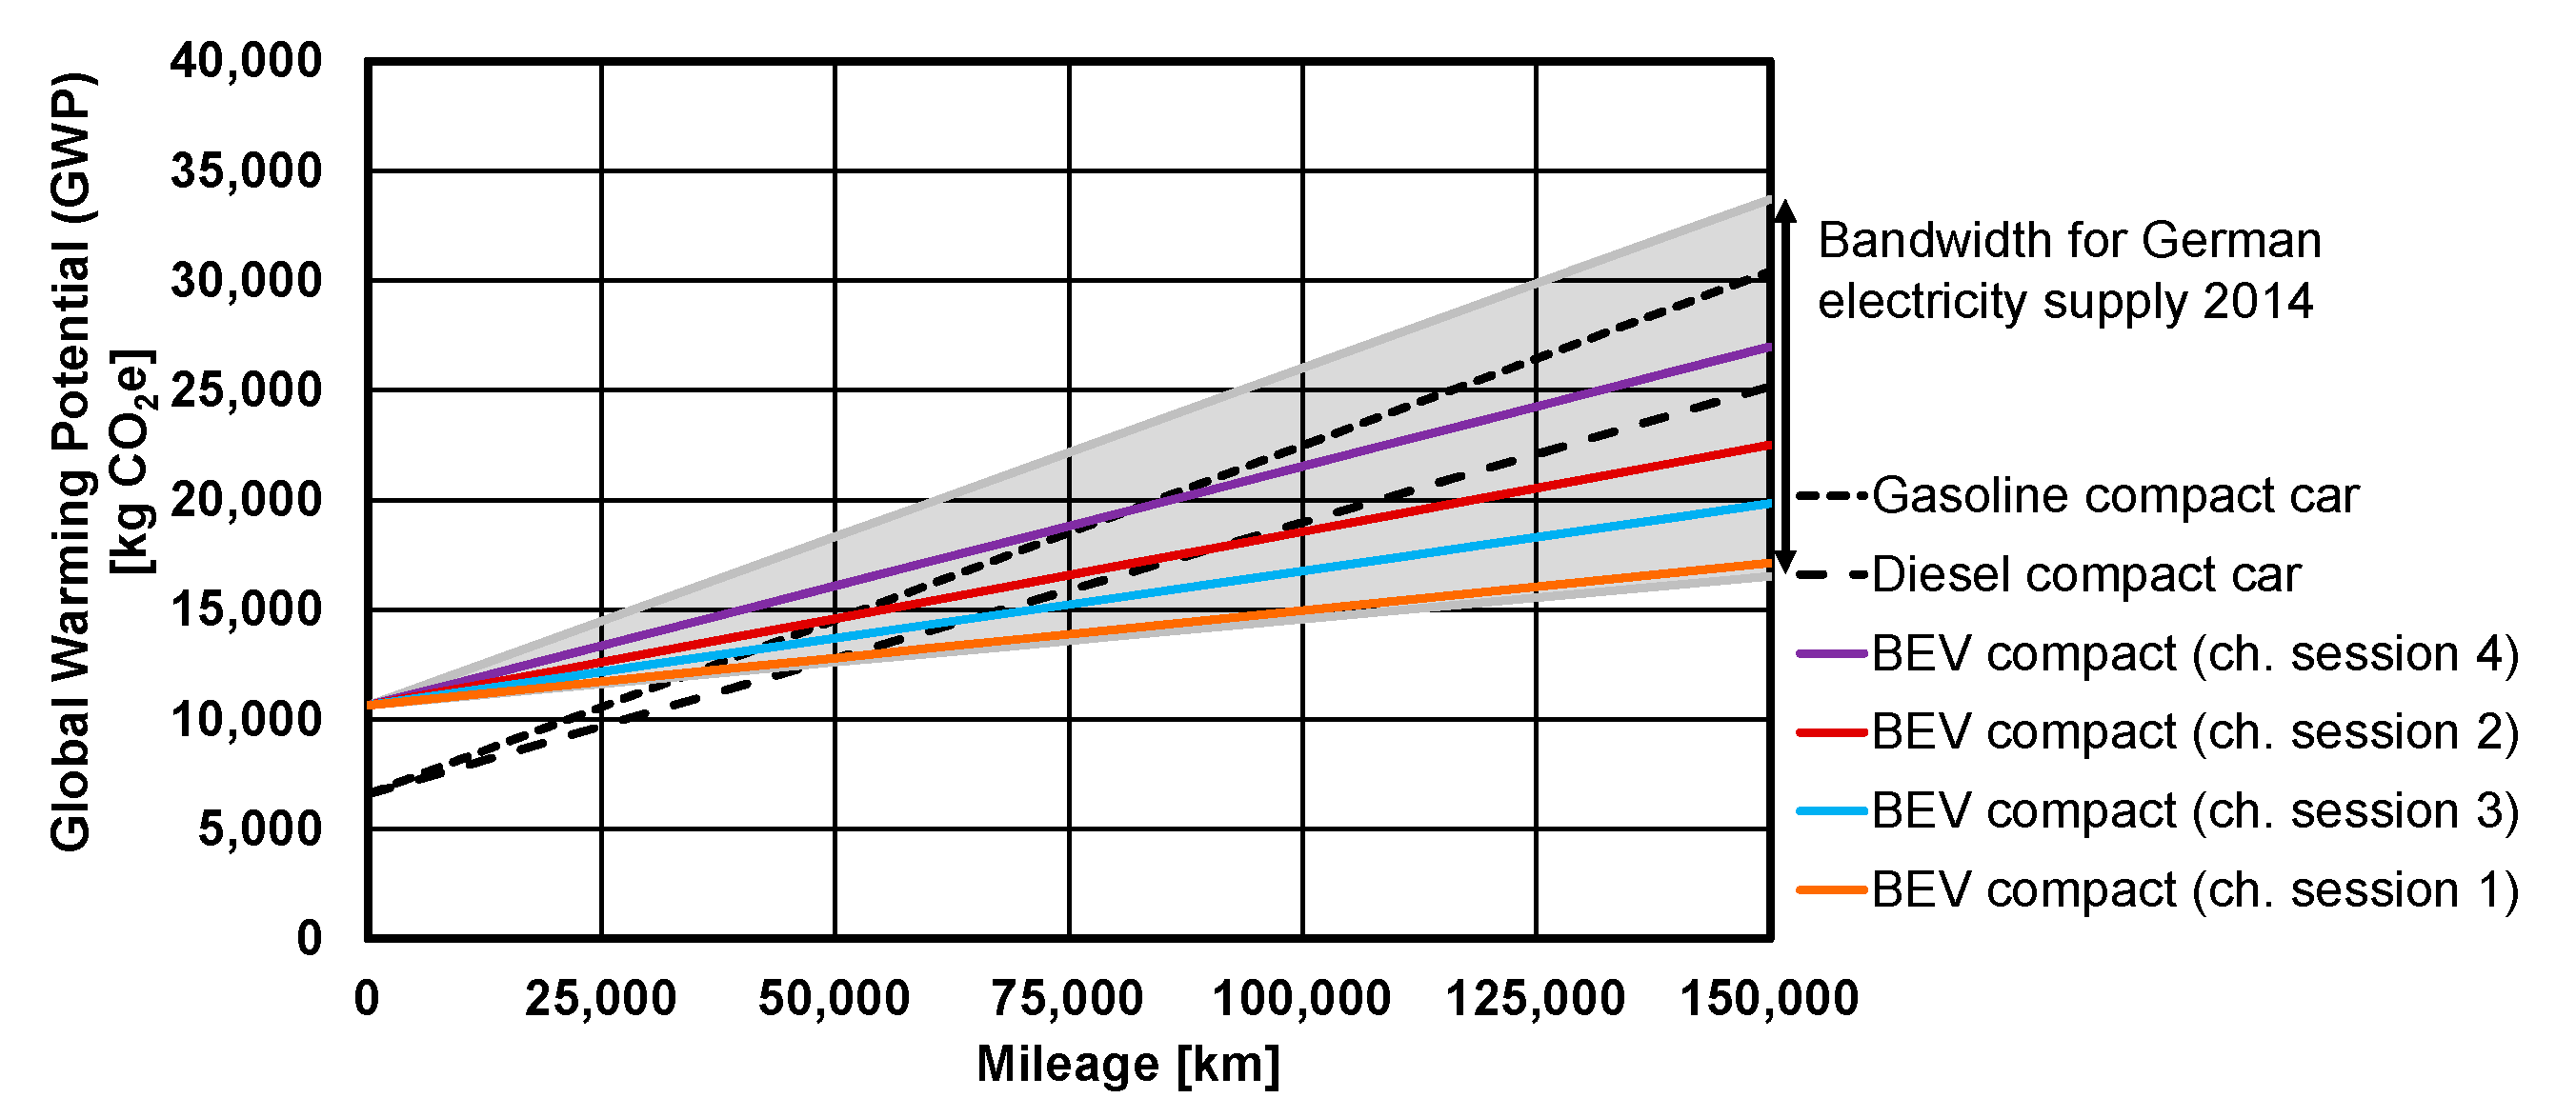
Figure 6 shows the bandwidth between using the minimum and maximum values of GWP of the German electricity supply in 2014 for charging.
When assuming all charging sessions to be conducted with the minimum GWP value of electricity supply in 2014, the GWP after BEV production, use phase, and end-of-life is 16.5 t CO2e. When assuming all charging sessions to be conducted with the maximum GWP value, the GWP of the BEV life cycle counts up to 33.7 t CO2e. The application of the average GWP of electricity supply during Charging Sessions 1 and 2 leads to life cycle GWPs of 17.1 and 22.7 t CO2e. The average GWP of electricity supply during Charging Sessions 3 and 4, on the other hand, results in life cycle GWPs of 19.8 and 27.0 t CO2e.
The results show that the life cycle greenhouse gas emissions of the BEV would be almost doubled when the maximum GWP value is used for charging. Charging the BEV with electricity with low GWP values leads to break-even points after low mileages compared to the gasoline car and to the diesel car. When applying higher GWP values, no break-even point compared to the conventional vehicles is reached, which means that the BEV shows higher greenhouse gas emissions over the life cycle than the conventional vehicles.
Figure 6 shows the potential that a combination of HD-LCA and smart charging can offer on the LCA of EVs. When charging sessions are shifted to periods with high shares of renewable electricity generation and low environmental impacts, the life cycle impacts of EVs can be optimized significantly.
4. Discussion
The results of this study show exemplarily the potential of combining hourly-defined LCA and smart charging according to ISO 15118 to reduce the environmental impacts of EVs.
By applying hourly resolved input data for electricity generation, the electricity price, and the GWP (or other environmental impact categories) of the electricity supply, it is possible to characterize charging sessions in detail. This offers the possibility of calculating, in addition to the costs, the environmental impact of every single charging session. The paper illustrates that the environmental impacts of charging sessions highly vary depending on the actual environmental profile of the electricity supply and the price-dependent charging load profile.
Based on the available LCA data of a BEV, it is shown that the electricity mix used for the charging sessions significantly influences the life cycle greenhouse gas emissions of EVs. Based on the hourly resolved GWP of the public electricity supply of Germany in 2014, minimum and maximum values for GWP in 2014 were determined. In addition, specific GWP values for four exemplary charging sessions were calculated. All values were used for the calculation of the life cycle greenhouse gas emissions of the BEV. The results show that the life cycle greenhouse gas emissions of the BEV would be almost doubled when the maximum GWP value is applied instead of the minimum GWP value. The environmental profile of BEVs strongly depends on the environmental profile of the electricity supply during the charging sessions and their charging load profile.
When hourly resolved electricity production and consumption data is available, the methodology of HD-LCA is a feasible solution to determine the environmental impacts of the electricity supply in an hourly resolution. By accessing electricity production and consumption data from electricity suppliers, LCA data can be generated for the electricity consumed by EVs. By consolidating this data with LCA data from existing databases and studies, such as from Held et al. [
4] (see example in this paper), LCA profiles for EVs can be determined. These LCA profiles are able to be used by involved stakeholders, such as electricity suppliers, charging stations operators, car sharing providers, or fleet operators for verifying and optimizing the environmental impacts of EVs, vehicle fleets, or whole electric mobility systems.
HD-LCA can additionally support electricity suppliers and charging station operators to optimize the load profile of charging sessions from an environmental perspective and thus to reduce environmental impacts from both EVs and electricity supply.
Author Contributions
Conceptualization: M.B.; data curation: M.B., M.S., and S.R.; investigation: M.B.; methodology: M.B.; resources: M.B., M.S., and S.R.; writing—original draft preparation: M.B.; writing—review & editing: M.S., B.S., M.H., and R.G.
Funding
This research received no external funding.
Conflicts of Interest
The authors declare no conflict of interest.
References
- Babrowski, S.; Heinrichs, H.; Jochem, P.; Fichtner, W. Load Shift Potential of Electric Vehicles in Europe. J. Power Sources 2014, 255, 283–293. [Google Scholar] [CrossRef]
- ISO 15118-2:2014. Available online: http://www.iso.org/iso/catalogue_detail.htm?csnumber=55366 (accessed on 30 January 2019).
- Voith, S. Introduction to ISO 15118 Vehicle-to-Grid Communication Interface; Begleitforschung “Schaufenster Elektromobilität”: Frankfurt, Germany, 2015. [Google Scholar]
- Held, M.; Graf, R.; Wehner, D.; Eckert, S.; Faltenbacher, M.; Weidner, S.; Braune, O. Abschlussbericht: Bewertung der Praxistauglichkeit und Umweltwirkungen von Elektrofahrzeugen; Fraunhofer IBP: Berlin, Germany, 2016. [Google Scholar]
- Graf, R.; Held, M.; Eckert, S.; Weidner, S. Usage-Dependent Evaluation of Electromobility; EcoBalance: Kyoto, Japan, 2016. [Google Scholar]
- Held, M. Methodischer Ansatz und Systemmodell zur ökologisch-technischen Analyse Zukünftiger Elektrofahrzeugkonzepte; Fraunhofer Verlag: Stuttgart, Germany, 2014; ISBN 978-3-8396-0752-7. [Google Scholar]
- Baumann, M.; Wehner, D.; Held, M.; Messagie, M.; Van Mierlo, J. Life Cycle Assessment of electric vehicles (Tutorial). In Proceedings of the IEEE Vehicle Power and Propulsion Conference, Coimbra, Portugal, 27 October 2014. [Google Scholar]
- Stark, J.; Weiß, C.; Trigui, R.; Franke, T.; Baumann, M.; Jochem, P.; Brethauer, L.; Chlond, B.; Günther, M.; Klementschitz, R.; et al. Electric Vehicles with Range Extenders: Evaluating the Contribution to the Sustainable Development of Metropolitan Regions. J. Urban Plan. Dev. 2018, 144. [Google Scholar] [CrossRef]
- Held, M.; Baumann, M. Assessment of the Environmental Impacts of Electric Vehicle Concepts. Towards Life Cycle Sustainability Management; Springer: Dordrecht, The Netherlands, 2011; pp. 535–546. [Google Scholar]
- Delogu, M.; Del Pero, F.; Zanchi, L.; Ierides, M.; Fernandez, V.; Seidel, K.; Thirunavukkarasu, D.; Bein, T. Lightweight Automobiles ALLIANCE Project: First Results of Environmental and Economic Assessment from a Life-Cycle Perspective. In Proceedings of the 2nd CO2 Reduction for Transportation Systems Conference, Turin, Italy, 11 July 2018. [Google Scholar] [CrossRef]
- Hawkins, T.R.; Singh, B.; Majeau-Bettez, G.; Strømman, A.H. Comparative Environmental Life Cycle Assessment of Conventional and Electric Vehicles. J. Ind. Ecol. 2013, 17, 53–64. [Google Scholar] [CrossRef]
- Bauer, C.; Hofer, J.; Althaus, H.; Del Duce, A.; Simons, A. The environmental performance of current and future passenger vehicles: Life cycle assessment based on a novel scenario analysis framework. Appl. Energy 2015, 157, 871–883. [Google Scholar] [CrossRef]
- Tagliaferri, C.; Evangelisti, S.; Acconcia, F.; Domenech, T.; Ekins, P.; Barletta, D.; Lettieri, P. Life cycle assessment of future electric and hybrid vehicles: A cradle-to-grave systems engineering approach. Chem. Eng. Res. Des. 2016, 112, 298–309. [Google Scholar] [CrossRef] [Green Version]
- Rangaraju, S.; De Vroey, L.; Messagie, M.; Mertens, J.; Van Mierlo, J. Impacts of electricity mix, charging profile, and driving behavior on the emissions performance of battery electric vehicles: A Belgian case study. Appl. Energy 2015, 148, 496–505. [Google Scholar] [CrossRef]
- Van Mierlo, J.; Messagie, M.; Rangaraju, S. Comparative environmental assessment of alternative fueled vehicles using a life cycle assessment. Transp. Res. Procedia 2017, 25, 3435–3445. [Google Scholar] [CrossRef]
- Messagie, M.; Mertens, J.; Da Quinta, E.; Costa, N.; De Oliveira, L.M.; Rangaraju, S.; Coosemans, T.C.; Van Mierlo, J.; Macharis, C. The hourly life cycle carbon footprint of electricity generation in Belgium, bringing a temporal resolution in life cycle assessment. Appl. Energy 2014, 134, 469–476. [Google Scholar] [CrossRef]
- AG Energiebilanzen e.V. Bruttostromerzeugung in Deutschland ab 1990 nach Energieträgern. Available online: http://www.ag-energiebilanzen.de/index.php?article_id=29&fileName=20151112_brd_stromerzeugung1990-2014.pdf (accessed on 30 January 2019).
- Thinkstep. GaBi Software System and Databases for Life Cycle Engineering; Thinkstep: Leinfelden-Echterdingen, Germany, 1992–2016. [Google Scholar]
- The Ecoinvent Database. Available online: http://www.ecoinvent.org/database/database.html (accessed on 30 January 2019).
- Salzinger, M.; Remppis, S. Influence of Power-to-Heat Systems on the German Energy System; VGB PowerTech 5-2016; The European Technical Association: Essen, Germany, 2016. [Google Scholar]
- Salzinger, M.; Remppis, S.; Scheffknecht, G. Untersuchung zukünftiger Flexibilisierungsanforderungen und -maßnahmen des fossil befeuerten Kraftwerksparks, Tagungsband: 48. In Proceedings of the Kraftwerkstechnisches Kolloquium, Dresden, Germany, 18 October 2016; Kraftwerkstechnik: Berlin, Germany, 2016; pp. 283–294, ISBN 978-3-934409-69-9. [Google Scholar]
- Kraftfahrt-Bundesamt. Fahrzeugzulassungen Neuzulassungen von Kraftfahrzeugen nach Umwelt-Merkmalen Jahr 2013; Kraftfahrt-Bundesamt: Flensburg, Germany, 2014. [Google Scholar]
- The European Parliament and the Council of the European Union: Regulation (EC) No 715/2007. Available online: https://eur-lex.europa.eu/legal-content/EN/TXT/HTML/?uri=CELEX:32007R0715&from=de (accessed on 30 January 2019).
- The Council of the European Communities: Council Directive 70/220/EEC. Available online: https://eur-lex.europa.eu/legal-content/EN/TXT/HTML/?uri=CELEX:31970L0220&from=de (accessed on 30 January 2019).
- Del Pero, F.; Delogu, M.; Pierini, M. The effect of lightweighting in automotive LCA perspective: Estimation of mass-induced fuel consumption reduction for gasoline turbocharged vehicles. J. Clean. Prod. 2017, 154, 566–577. [Google Scholar] [CrossRef]
- Delogu, M.; Del Pero, F.; Pierini, M. Lightweight Design Solutions in the Automotive Field: Environmental Modelling Based on Fuel Reduction Value Applied to Diesel Turbocharged Vehicles. Sustainability 2016, 8, 1167. [Google Scholar] [CrossRef]
© 2019 by the authors. Licensee MDPI, Basel, Switzerland. This article is an open access article distributed under the terms and conditions of the Creative Commons Attribution (CC BY) license (http://creativecommons.org/licenses/by/4.0/).

 ,
, 


