Drug Adverse Event Detection in Health Plan Data Using the Gamma Poisson Shrinker and Comparison to the Tree-based Scan Statistic

Abstract
:1. Introduction
2. Methods
2.1. Overview
2.2. Data and Study Population
2.3. Study Drugs
2.4. Diagnosis Definitions
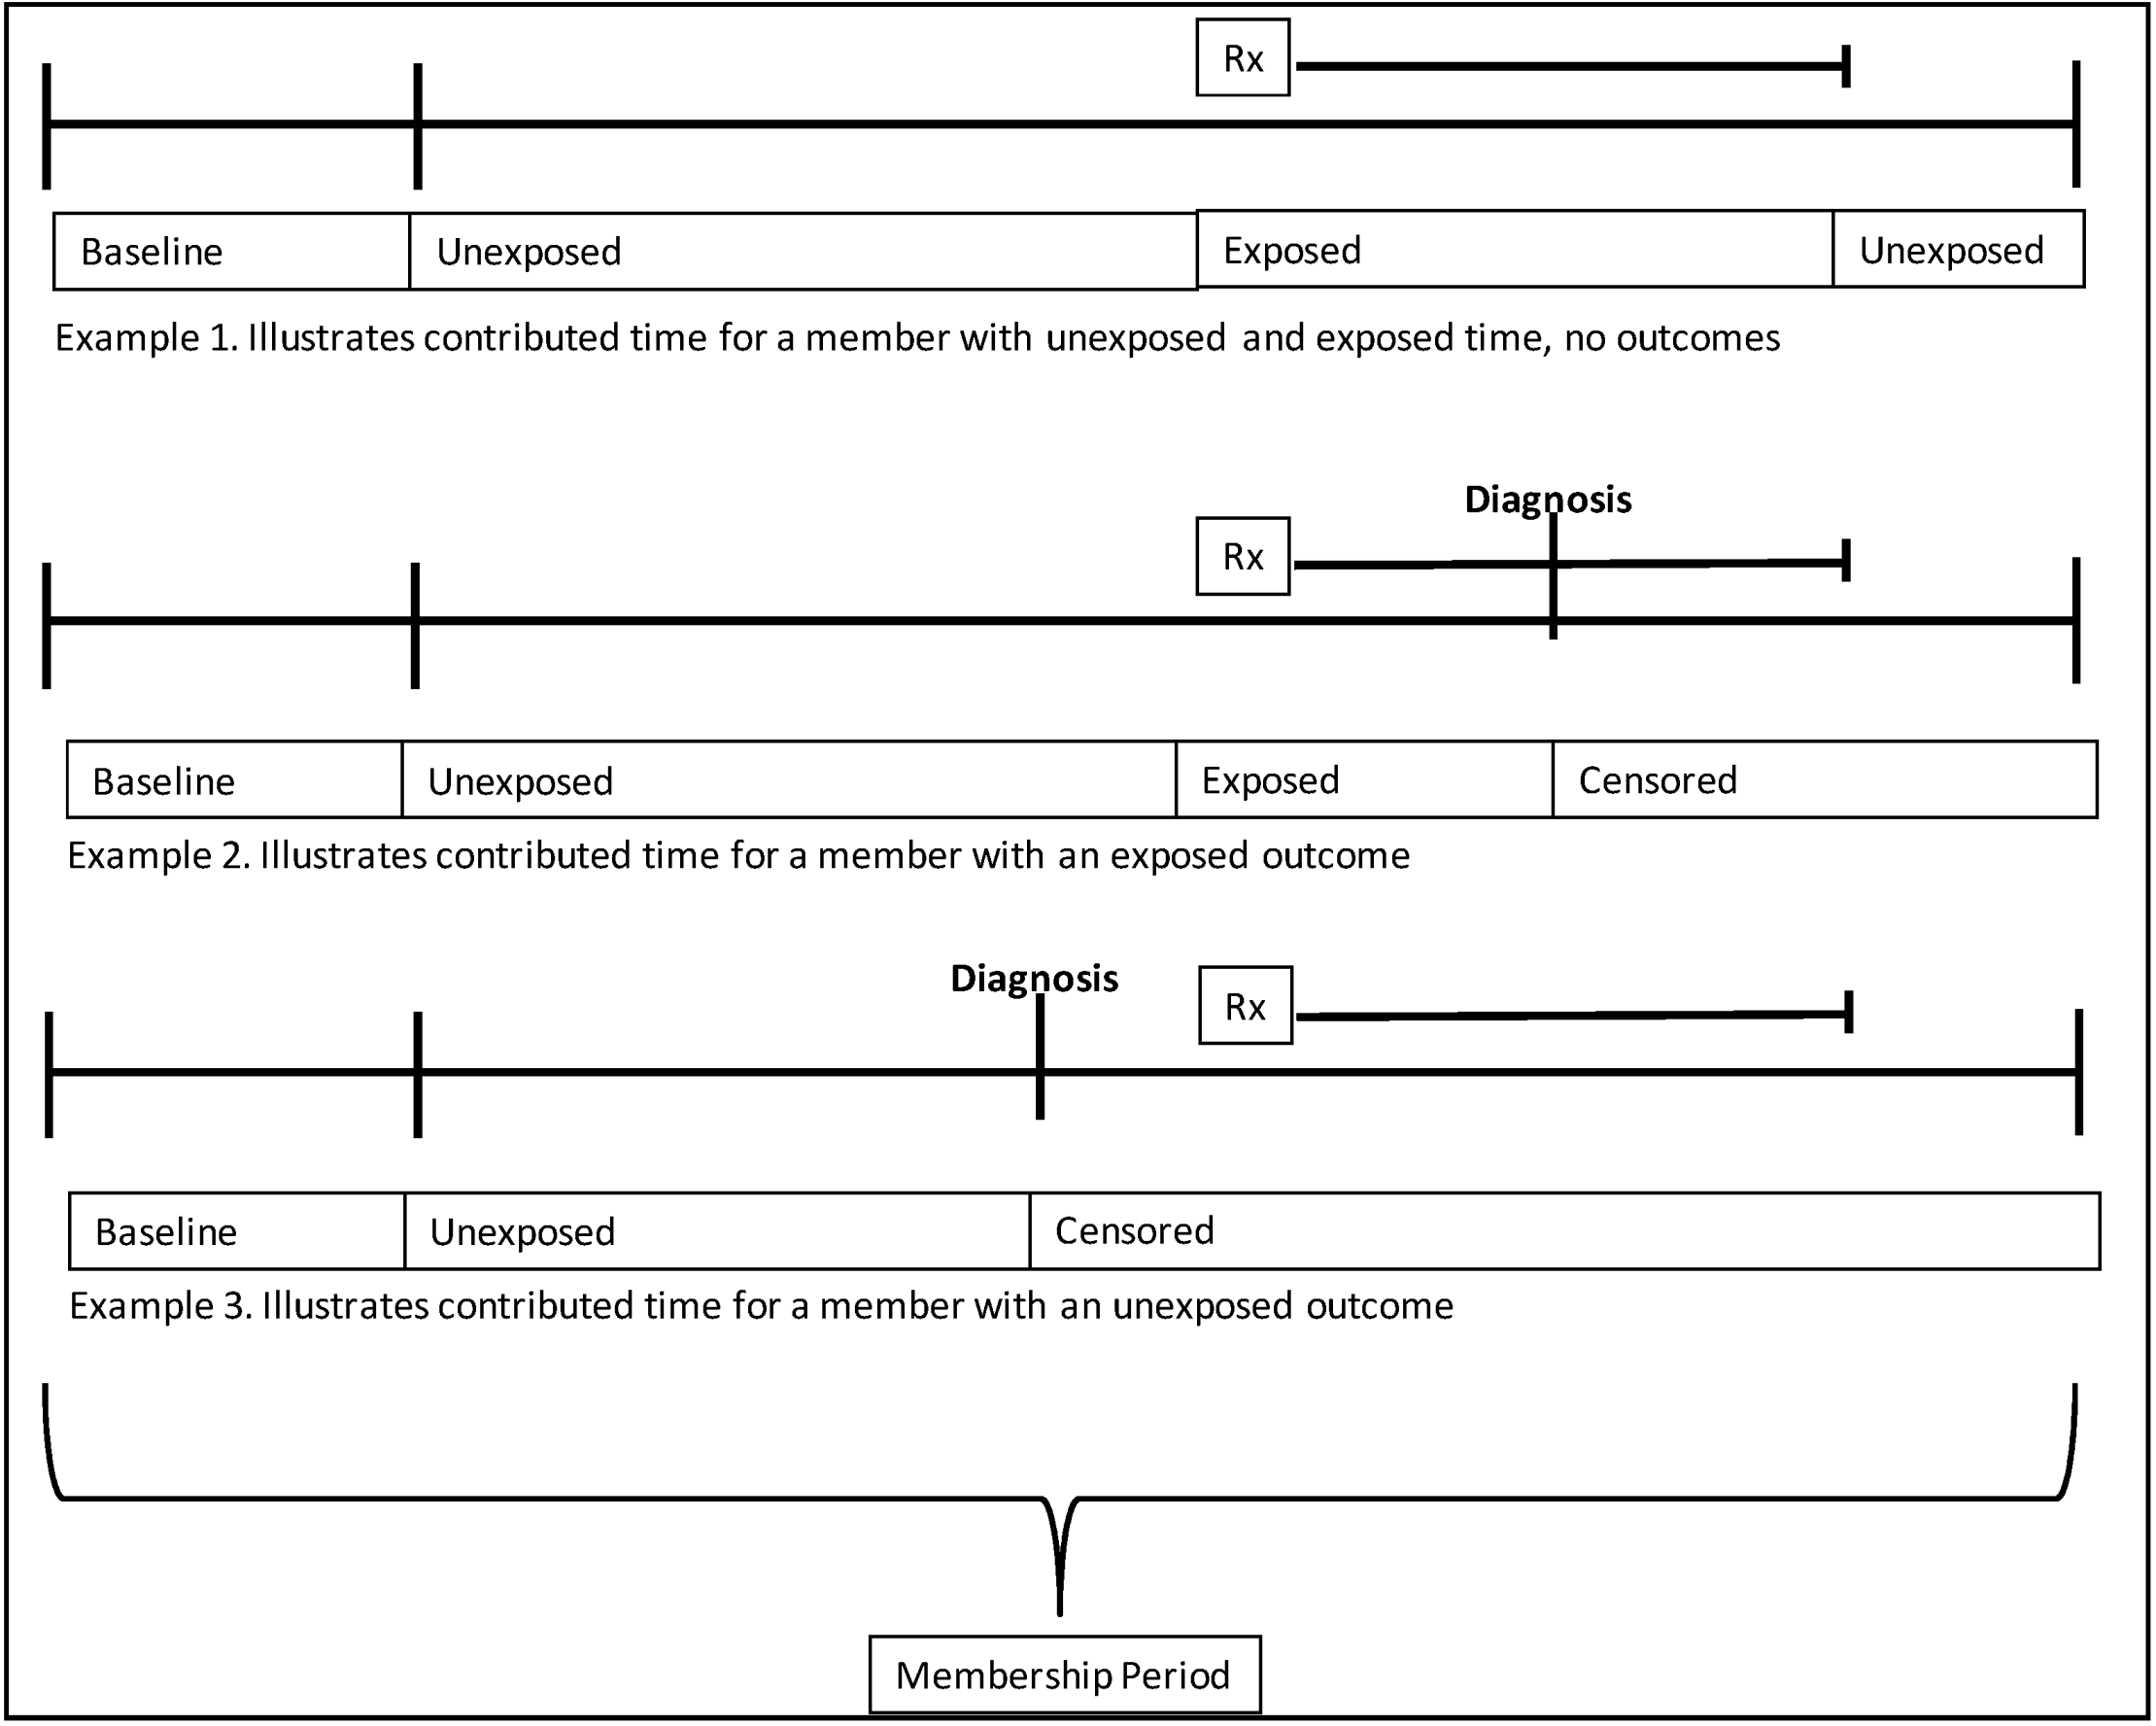
2.5. Contributed Person Time

| 07 | Diseases of the Circulatory System |
| 07.01 | Hypertension |
| 07.01.02 | Hypertension with Complications and Secondary Hypertension |
| 07.01.02.01 | Hypertensive Heart and/or Renal Disease (402.00–404.93) |
| 07.01.02.02 | Other Hypertensive Complications (405.01–405.99,437.2) |
| 07.02 | Diseases of The Heart |
| 07.02.01 | Heart Valve Disorders |
| 07.02.01.02 | Nonrheumatic Mitral Valve Disorders (424.0) |
| 07.02.01.03 | Nonrheumatic Aortic Valve Disorders (424.1) |
| 07.02.01.04 | Other Heart Valve Disorders (424.2, 424.3, 785.2, 785.3) |
| 07.02.02 | Peri; Endo; and Myocarditis; Cardiomyopathy (Except that Caused by TB or STD) |
| 07.02.02.01 | Cardiomyopathy (425.0–425.9) |
| 07.02.03 | Acute Myocardial Infarction (410.0–410.92) |
| 07.02.04 | Coronary Atherosclerosis and Other Heart Disease |
| 07.02.04.01 | Angina Pectoris (413.0–413.9) |
| 07.02.04.02 | Unstable Angina (Intermediate Coronary Syndrome) (411.1) |
| 07.02.04.03 | Other Acute and Subacute Forms of Ischemic Heart Disease (411.0, 411.8–411.89) |
| 07.02.04.04 | Coronary Atherosclerosis (414.05) |
| 07.02.04.05 | Other Forms of Chronic Heart Disease (414.8, 414.9) |
| 07.02.04.00 | Other (414.06) |

2.6. Drug Exposure
2.7. Outcomes
2.8. Calculation of Observed and Expected Counts
2.9. Gamma Poisson Shrinker
2.10. Comparison to Tree-Based Scan Statistic
3. Results
3.1. Terbinafine and Itraconazole
3.2. Pioglitazone and Rosiglitazone
| MLCCS | Diagnosis | Terbinafine | Itraconazole | ||||||||||
|---|---|---|---|---|---|---|---|---|---|---|---|---|---|
| Obs | Exp | O/E | EBGM | GPS Signal | TreeScan p-value | Obs | Exp | O/E | EBGM | GPS Signal | TreeScan p-value | ||
| 05 | Mental Disorders | 0 | 0.6 | 0.0 | 1.3 | . | 0 | 0.1 | 0.0 | 1.4 | . | ||
| 06 | Diseases Of The Nervous System And Sense Organs | 37 | 22.7 | 1.6 | 1.6 | 0.28 | 11 | 5.2 | 2.1 | 1.7 | 0.54 | ||
| 07 | Diseases Of The Circulatory System | 51 | 44.4 | 1.1 | 1.2 | . | 21 | 10.2 | 2.1 | 1.7 | 0.13 | ||
| 07.01 | Hypertension | 1 | 2.0 | 0.5 | 1.3 | . | 1 | 0.6 | 1.8 | 1.5 | . | ||
| 07.02 | Diseases Of The Heart | 24 | 21.4 | 1.1 | 1.2 | . | 9 | 5.0 | 1.8 | 1.6 | . | ||
| 07.02.01 | Heart Valve Disorders | 1 | 2.8 | 0.4 | 1.2 | . | 0 | 0.7 | 0.0 | 1.3 | . | ||
| 07.02.03 | Acute Myocardial Infarction | 0 | 0.8 | 0.0 | 1.3 | . | 1 | 0.2 | 4.7 | 1.7 | . | ||
| 07.02.04 | Coronary Atherosclerosis And Other Heart Disease | 3 | 3.4 | 0.9 | 1.3 | . | 1 | 0.9 | 1.1 | 1.5 | . | ||
| 07.02.07 | Other And Ill-Defined Heart Disease | 3 | 1.0 | 3.1 | 1.7 | . | 3 | 0.2 | 12.3 | 3.9 | 0.09 | ||
| 07.02.08 | Conduction Disorders | 1 | 0.5 | 1.9 | 1.5 | . | 1 | 0.1 | 7.9 | 1.8 | . | ||
| 07.02.09 | Cardiac Dysrhythmias | 16 | 10.1 | 1.6 | 1.5 | . | 3 | 2.2 | 1.4 | 1.5 | . | ||
| 07.03 | Cerebrovascular Disease | 4 | 2.9 | 1.4 | 1.5 | . | 2 | 0.7 | 2.9 | 1.6 | . | ||
| 07.04 | Diseases Of Arteries; Arterioles; And Capillaries | 17 | 13.8 | 1.2 | 1.3 | . | 5 | 3.0 | 1.7 | 1.5 | . | ||
| 07.05 | Diseases Of Veins And Lymphatics | 5 | 4.3 | 1.2 | 1.4 | . | 4 | 0.9 | 4.4 | 1.9 | 0.47 | ||
| 09 | Diseases Of The Digestive System | 63 | 37.2 | 1.7 | 1.6 | 0.007 | 15 | 8.2 | 1.8 | 1.6 | 0.63 | ||
| 09.03 | Diseases Of Mouth; Excluding Dental | 5 | 3.3 | 1.5 | 1.5 | . | 0 | 0.7 | 0.0 | 1.3 | . | ||
| 09.04 | Upper Gastrointestinal Disorders | 8 | 7.2 | 1.1 | 1.3 | . | 5 | 1.5 | 3.3 | 1.8 | 0.53 | ||
| 09.06 | Lower Gastrointestinal Disorders | 1 | 0.8 | 1.3 | 1.5 | . | 1 | 0.2 | 5.8 | 1.7 | . | ||
| 09.07 | Biliary Tract Disease | 2 | 1.6 | 1.3 | 1.4 | . | 1 | 0.3 | 3.1 | 1.6 | . | ||
| 09.08 | Liver Disease | 14 | 3.1 | 4.5 | 3.5 | ** | 0.00005 | 1 | 0.7 | 1.4 | 1.5 | . | |
| 09.08.02 | Other Liver Diseases | 14 | 3.1 | 4.5 | 3.37 | ** | 0.00005 | 1 | 0.7 | 1.4 | 1.5 | . | |
| 09.08.02.04 | Other And Unspecified Liver Disorders | 14 | 2.8 | 5.1 | 4.1 | *** | 0.00002 | 1 | 0.6 | 1.6 | 1.5 | . | |
| 09.09 | Pancreatic Disorders (Not Diabetes) | 2 | 0.3 | 5.9 | 1.9 | . | 1 | 0.1 | 15.0 | 2.0 | . | ||
| 09.09.03 | Other Pancreatic Disorders | 2 | 0.1 | 36.9 | 4.2 | 0.06 | 1 | 0.0 | 69.3 | 2.2 | . | ||
| 09.10 | Gastrointestinal Hemorrhage | 12 | 6.4 | 1.9 | 1.6 | . | 2 | 1.5 | 1.4 | 1.5 | . | ||
| 09.12 | Other Gastrointestinal Disorders | 19 | 14.4 | 1.3 | 1.4 | . | 4 | 3.3 | 1.2 | 1.4 | . | ||
| 10 | Diseases Of The Genitourinary System | 29 | 23.5 | 1.2 | 1.3 | . | 1 | 5.5 | 0.2 | 0.4 | . | ||
| 11 | Complications Of Pregnancy; Childbirth; And The Puerperium | 0 | 0.6 | 0.0 | 1.2 | . | 1 | 0.1 | 8.1 | 1.7 | . | ||
| 12 | Diseases Of The Skin And Subcutaneous Tissue | 125 | 51.6 | 2.4 | 2.2 | ** | 0.00001 | 31 | 11.2 | 2.8 | 2.1 | ** | 0.00001 |
| 12.01 | Skin And Subcutaneous Tissue Infections | 4 | 3.7 | 1.1 | 1.4 | . | 3 | 0.9 | 3.5 | 1.7 | 0.84 | ||
| 12.02 | Other Inflammatory Condition Of Skin | 25 | 10.6 | 2.4 | 1.9 | 0.010 | 9 | 2.1 | 4.2 | 2.4 | 0.02 | ||
| 12.03 | Chronic Ulcer Of Skin | 1 | 0.3 | 3.6 | 1.6 | . | 0 | 0.1 | 0.0 | 1.5 | . | ||
| 12.04 | Other Skin Disorders | 95 | 37.0 | 2.6 | 2.3 | ** | 0.00001 | 19 | 8.1 | 2.3 | 1.8 | 0.05 | |
| 13 | Diseases Of The Musculoskeletal System And Connective Tissue | 60 | 43.3 | 1.4 | 1.4 | 0.59 | 15 | 9.1 | 1.7 | 1.6 | 0.84 | ||
| 13.01 | Infective Arthritis And Osteomyelitis (Except That Caused By TB Or STD | 1 | 0.3 | 3.6 | 1.6 | . | 4 | 0.1 | 56.8 | 19.5 | *** | 0.00001 | |
| 13.08 | Other Connective Tissue Disease | 59 | 42.7 | 1.4 | 1.4 | 0.63 | 11 | 8.9 | 1.2 | 1.4 | . | ||
| 16 | Injury And Poisoning | 2 | 0.8 | 2.6 | 1.6 | . | 0 | 0.2 | 0.0 | 1.4 | . | ||
| 17 | Symptoms; Signs; And Ill-Defined Conditions And Factors Influencing Health | 62 | 38.1 | 1.6 | 1.6 | 0.02 | 15 | 8.5 | 1.8 | 1.6 | 0.75 | ||
| 17.01 | Symptoms; Signs; And Ill-Defined Conditions | 62 | 38.1 | 1.6 | 1.6 | 0.02 | 15 | 8.5 | 1.8 | 1.6 | 0.75 | ||
| 17.01.01 | Syncope | 3 | 2.3 | 1.3 | 1.4 | . | 1 | 0.5 | 1.9 | 1.5 | . | ||
| 17.01.06 | Nausea And Vomiting | 10 | 3.9 | 2.6 | 1.9 | 0.42 | 6 | 0.9 | 6.4 | 3.5 | 0.03 | ||
| 17.01.07 | Abdominal Pain | 21 | 18.1 | 1.2 | 1.3 | . | 2 | 4.1 | 0.5 | 1.1 | . | ||
| 17.01.08 | Malaise And Fatigue | 3 | 2.9 | 1.0 | 1.4 | . | 1 | 0.7 | 1.5 | 1.5 | . | ||
| 17.01.09 | Allergic Reactions | 25 | 10.8 | 2.3 | 2.0 | 0.01 | 5 | 2.2 | 2.3 | 1.7 | . | ||
| MLCCS | Diagnosis | Pioglitazone | Rosiglitazone | ||||||||||
|---|---|---|---|---|---|---|---|---|---|---|---|---|---|
| Obs | Exp | O/E | EBGM | GPS Signal | TreeScan p-value | Obs | Exp | O/E | EBGM | GPS Signal | TreeScan p-value | ||
| 05 | Mental Disorders | 4 | 1.7 | 2.4 | 1.6 | . | 1 | 0.9 | 1.1 | 1.5 | . | ||
| 06 | Diseases Of The Nervous System And Sense Organs | 197 | 90.7 | 2.2 | 2.1 | ** | 0.00001 | 75 | 45.1 | 1.7 | 1.6 | 0.003 | |
| 06.03 | Paralysis | 2 | 1.1 | 1.9 | 1.5 | . | 0 | 0.7 | 0.0 | 1.3 | . | ||
| 06.04 | Epilepsy; Convulsions | 3 | 4.0 | 0.8 | 1.3 | . | 2 | 2.3 | 0.9 | 1.4 | . | ||
| 06.05 | Headache; Including Migraine | 4 | 11.6 | 0.3 | 0.6 | . | 5 | 5.6 | 0.9 | 1.3 | . | ||
| 06.06 | Coma; Stupor; And Brain Damage | 3 | 1.3 | 2.4 | 1.6 | . | 1 | 0.6 | 1.7 | 1.5 | . | ||
| 06.07 | Eye Disorders | 185 | 72.9 | 2.5 | 2.4 | *** | 0.00001 | 67 | 35.9 | 1.9 | 1.8 | 0.00004 | |
| 06.07.01 | Cataract | 123 | 51.4 | 2.4 | 2.3 | ** | 0.00001 | 47 | 24.2 | 1.9 | 1.8 | 0.002 | |
| 06.07.03 | Glaucoma | 62 | 21.4 | 2.9 | 2.6 | *** | 0.00001 | 20 | 11.7 | 1.7 | 1.6 | 0.80 | |
| 07 | Diseases Of The Circulatory System | 378 | 177.7 | 2.1 | 2.1 | ** | 0.00001 | 186 | 94.8 | 2.0 | 1.9 | ** | 0.00001 |
| 07.01 | Hypertension | 34 | 16.3 | 2.1 | 1.8 | 0.009 | 4 | 3.1 | 1.3 | 1.4 | . | ||
| 07.01.02 | Hypertension With Complications And Secondary Hypertension | 34 | 16.3 | 2.1 | 1.9 | 0.009 | 4 | 3.1 | 1.3 | 1.4 | . | ||
| 07.01.02.01 | Hypertensive Heart And/Or Renal Disease | 34 | 16.1 | 2.1 | 1.9 | 0.007 | 4 | 2.9 | 1.4 | 1.5 | . | ||
| 07.02 | Diseases Of The Heart | 190 | 86.6 | 2.2 | 2.1 | ** | 0.00001 | 116 | 51.9 | 2.2 | 2.1 | ** | 0.00001 |
| 07.02.01 | Heart Valve Disorders | 15 | 10.1 | 1.5 | 1.5 | . | 14 | 6.7 | 2.1 | 1.8 | 0.54 | ||
| 07.02.02 | Peri-; Endo-; And Myocarditis; Cardiomyopathy (Except That Caused | 6 | 2.2 | 2.7 | 1.8 | 0.89 | 4 | 1.1 | 3.8 | 1.9 | 0.80 | ||
| 07.02.03 | Acute Myocardial Infarction | 12 | 4.0 | 3.0 | 2.0 | 0.08 | 5 | 1.8 | 2.8 | 1.8 | . | ||
| 07.02.04 | Coronary Atherosclerosis And Other Heart Disease | 51 | 18.2 | 2.8 | 2.4 | ** | 0.00001 | 24 | 10.0 | 2.4 | 2.0 | 0.01 | |
| 07.02.04.00 | Coronary Atherosclerosis And Other Heart Disease | 11 | 3.6 | 3.1 | 2.1 | 0.10 | 3 | 1.6 | 1.8 | 1.6 | . | ||
| 07.02.04.01 | Angina Pectoris | 16 | 6.3 | 2.5 | 2.0 | 0.08 | 8 | 3.1 | 2.6 | 1.8 | 0.66 | ||
| 07.02.04.02 | Unstable Angina (Intermediate Coronary Syndrome) | 5 | 2.0 | 2.5 | 1.7 | . | 6 | 1.5 | 4.1 | 2.2 | 0.26 | ||
| 07.02.04.03 | Other Acute And Subacute Forms Of Ischemic Heart Disease | 4 | 1.0 | 4.2 | 2.0 | 0.70 | 1 | 0.3 | 2.9 | 1.6 | . | ||
| 07.02.04.05 | Other Forms Of Chronic Heart Disease | 15 | 5.2 | 2.9 | 2.1 | 0.03 | 6 | 3.4 | 1.8 | 1.6 | . | ||
| 07.02.05 | Nonspecific Chest Pain | 2 | 1.8 | 1.1 | 1.4 | . | 2 | 1.6 | 1.3 | 1.5 | . | ||
| 07.02.06 | Pulmonary Heart Disease | 1 | 1.2 | 0.8 | 1.4 | . | 4 | 0.8 | 5.0 | 2.2 | 0.48 | ||
| 07.02.07 | Other And Ill-Defined Heart Disease | 5 | 5.2 | 1.0 | 1.3 | . | 11 | 3.1 | 3.5 | 2.2 | 0.03 | ||
| 07.02.08 | Conduction Disorders | 2 | 2.2 | 0.9 | 1.4 | . | 4 | 1.4 | 2.8 | 1.7 | . | ||
| 07.02.09 | Cardiac Dysrhythmias | 48 | 33.3 | 1.4 | 1.5 | 0.63 | 28 | 21.9 | 1.3 | 1.3 | . | ||
| 07.02.10 | Cardiac Arrest And Ventricular Fibrillation | 4 | 0.9 | 4.4 | 2.0 | 0.62 | 0 | 0.4 | 0.0 | 1.4 | . | ||
| 07.02.11 | Congestive Heart Failure; Nonhypertensive | 44 | 7.3 | 6.0 | 5.9 | *** | 0.00001 | 20 | 3.2 | 6.3 | 6.0 | *** | 0.00001 |
| 07.02.11.00 | Congestive Heart Failure; Nonhypertensive | 4 | 0.1 | 54.6 | 14.1 | *** | 0.00002 | 1 | 0.0 | 26.4 | 2.1 | . | |
| 07.02.11.01 | Congestive Heart Failure | 35 | 6.3 | 5.5 | 5.4 | *** | 0.00001 | 16 | 2.7 | 5.8 | 5.3 | *** | 0.00002 |
| 07.02.11.02 | Heart Failure | 5 | 0.9 | 5.4 | 2.5 | 0.19 | 3 | 0.4 | 7.3 | 2.5 | 0.43 | ||
| 07.03 | Cerebrovascular Disease | 40 | 15.1 | 2.6 | 2.2 | ** | 0.00001 | 13 | 7.1 | 1.8 | 1.6 | . | |
| 07.03.01 | Acute Cerebrovascular Disease | 14 | 5.9 | 2.4 | 1.9 | 0.27 | 1 | 2.3 | 0.4 | 1.2 | . | ||
| 07.03.02 | Occlusion Or Stenosis Of Precerebral Arteries | 7 | 2.8 | 2.5 | 1.8 | 0.86 | 8 | 1.3 | 6.1 | 4.1 | ** | 0.00472 | |
| 07.03.03 | Other And Ill-Defined Cerebrovascular Disease | 3 | 1.6 | 1.9 | 1.6 | . | 1 | 1.2 | 0.8 | 1.4 | . | ||
| 07.03.04 | Transient Cerebral Ischemia | 14 | 3.9 | 3.6 | 2.4 | 0.006 | 2 | 1.6 | 1.3 | 1.5 | . | ||
| 07.03.05 | Late Effects Of Cerebrovascular Disease | 2 | 0.9 | 2.2 | 1.6 | . | 1 | 0.7 | 1.5 | 1.5 | . | ||
| 07.04 | Diseases Of Arteries; Arterioles; And Capillaries | 81 | 44.8 | 1.8 | 1.7 | 0.00002 | 41 | 25.7 | 1.6 | 1.6 | 0.28149 | ||
| 07.04.01 | Peripheral And Visceral Atherosclerosis | 33 | 7.6 | 4.4 | 4.1 | *** | 0.00001 | 18 | 3.8 | 4.7 | 4.0 | *** | 0.00002 |
| 07.04.01.01 | Atherosclerosis Of Arteries Of Extremities | 9 | 1.6 | 5.5 | 3.6 | ** | 0.005 | 3 | 0.7 | 4.2 | 1.9 | . | |
| 07.04.01.02 | Peripheral Vascular Disease Unspecified | 21 | 4.9 | 4.3 | 3.5 | *** | 0.00001 | 11 | 2.4 | 4.7 | 3.1 | ** | 0.0023 |
| 07.04.01.03 | Other Peripheral And Visceral Atherosclerosis | 3 | 1.0 | 3.0 | 1.7 | . | 4 | 0.8 | 5.2 | 2.2 | 0.43304 | ||
| 07.04.02 | Aortic; Peripheral; And Visceral Artery Aneurysms | 1 | 1.9 | 0.5 | 1.3 | . | 3 | 1.1 | 2.7 | 1.7 | . | ||
| 07.04.03 | Aortic And Peripheral Arterial Embolism Or Thrombosis | 5 | 0.9 | 5.3 | 2.5 | 0.20 | 2 | 0.4 | 4.6 | 1.8 | . | ||
| 07.04.04 | Other Circulatory Disease | 42 | 34.4 | 1.2 | 1.3 | . | 18 | 20.4 | 0.9 | 1.1 | . | ||
| 07.04.04.01 | Hypotension | 8 | 1.8 | 4.6 | 2.6 | 0.04 | 0 | 0.7 | 0.0 | 1.4 | . | ||
| 07.04.04.02 | Other And Unspecified Circulatory Disease | 34 | 32.7 | 1.0 | 1.1 | . | 18 | 19.6 | 0.9 | 1.1 | . | ||
| 07.05 | Diseases Of Veins And Lymphatics | 33 | 14.9 | 2.2 | 1.9 | 0.004 | 12 | 6.9 | 1.7 | 1.6 | . | ||
| 07.05.01 | Phlebitis; Thrombophlebitis And Thromboembolism | 9 | 4.2 | 2.1 | 1.7 | . | 8 | 2.5 | 3.2 | 2.0 | 0.27 | ||
| 07.05.02 | Varicose Veins Of Lower Extremity | 5 | 5.8 | 0.9 | 1.2 | . | 1 | 2.7 | 0.4 | 1.2 | . | ||
| 07.05.04 | Other Diseases Of Veins And Lymphatics | 19 | 5.0 | 3.8 | 2.9 | ** | 0.00002 | 3 | 1.7 | 1.7 | 1.5 | . | |
| 09 | Diseases Of The Digestive System | 131 | 116.4 | 1.1 | 1.2 | . | 80 | 62.0 | 1.3 | 1.3 | 0.79 | ||
| 10 | Diseases Of The Genitourinary System | 186 | 75.0 | 2.5 | 2.3 | *** | 0.00001 | 96 | 45.4 | 2.1 | 2.0 | ** | 0.00001 |
| 10.01 | Diseases Of The Urinary System | 167 | 63.7 | 2.6 | 2.5 | *** | 0.00001 | 86 | 35.5 | 2.4 | 2.2 | ** | 0.00001 |
| 10.01.01 | Nephritis; Nephrosis; Renal Sclerosis | 28 | 1.2 | 24.3 | 21.0 | *** | 0.00001 | 6 | 0.7 | 8.7 | 5.7 | ** | 0.005 |
| 10.01.02 | Acute And Unspecified Renal Failure | 3 | 1.2 | 2.6 | 1.7 | . | 1 | 0.6 | 1.6 | 1.5 | . | ||
| 10.01.03 | Chronic Renal Failure | 14 | 1.6 | 9.0 | 8.3 | *** | 0.00001 | 7 | 0.7 | 10.1 | 7.8 | *** | 0.0001 |
| 10.01.04 | Urinary Tract Infections | 6 | 1.3 | 4.7 | 2.4 | 0.15 | 2 | 0.6 | 3.4 | 1.7 | . | ||
| 10.01.05 | Calculus Of Urinary Tract | 6 | 8.6 | 0.7 | 1.1 | . | 3 | 4.2 | 0.7 | 1.2 | . | ||
| 10.01.06 | Other Diseases Of Kidney And Ureters | 30 | 6.2 | 4.8 | 4.7 | *** | 0.00001 | 14 | 3.4 | 4.1 | 2.9 | ** | 0.0004 |
| 10.01.06.02 | Other And Unspecified Diseases Of Kidney And Ureters | 30 | 5.5 | 5.5 | 5.3 | *** | 0.00001 | 14 | 3.0 | 4.7 | 3.6 | ** | 0.00004 |
| 10.01.07 | Other Diseases Of Bladder And Urethra | 0 | 1.0 | 0.0 | 1.3 | . | 1 | 0.6 | 1.8 | 1.5 | . | ||
| 10.01.08 | Genitourinary Symptoms And Ill-Defined Conditions | 80 | 42.8 | 1.9 | 1.8 | 0.00002 | 52 | 24.7 | 2.1 | 1.9 | ** | 0.00002 | |
| 10.01.08.01 | Hematuria | 13 | 11.9 | 1.1 | 1.3 | . | 14 | 7.5 | 1.9 | 1.7 | 0.86 | ||
| 10.01.08.02 | Retention Of Urine | 3 | 2.8 | 1.1 | 1.4 | . | 1 | 1.3 | 0.7 | 1.4 | . | ||
| 10.01.08.03 | Other And Unspecified Genitourinary Symptoms | 64 | 28.1 | 2.3 | 2.1 | ** | 0.00001 | 37 | 15.9 | 2.3 | 2.1 | ** | 0.00007 |
| 10.03 | Diseases Of Female Genital Organs | 19 | 11.2 | 1.7 | 1.6 | 0.88 | 10 | 9.9 | 1.0 | 1.3 | . | ||
| 11 | Complications Of Pregnancy; Childbirth; And The Puerperium | 0 | 0.5 | 0.0 | 1.3 | . | 0 | 0.3 | 0.0 | 1.3 | . | ||
| 12 | Diseases Of The Skin And Subcutaneous Tissue | 205 | 166.6 | 1.2 | 1.3 | 0.23 | 78 | 70.5 | 1.1 | 1.2 | . | ||
| 12.01 | Skin And Subcutaneous Tissue Infections | 17 | 7.9 | 2.2 | 1.7 | 0.26 | 9 | 4.2 | 2.1 | 1.6 | . | ||
| 12.02 | Other Inflammatory Condition Of Skin | 41 | 33.8 | 1.2 | 1.3 | . | 15 | 13.1 | 1.1 | 1.3 | . | ||
| 12.03 | Chronic Ulcer Of Skin | 13 | 1.1 | 11.8 | 10.7 | *** | 0.00001 | 9 | 0.4 | 21.2 | 16.4 | *** | 0.00001 |
| 12.03.02 | Chronic Ulcer Of Leg Or Foot | 13 | 1.1 | 11.8 | 10.4 | *** | 0.00001 | 9 | 0.4 | 21.2 | 15.1 | *** | 0.00001 |
| 12.04 | Other Skin Disorders | 134 | 123.8 | 1.1 | 1.1 | . | 45 | 52.7 | 0.9 | 1.0 | . | ||
| 13 | Diseases Of The Musculoskeletal System And Connective Tissue | 187 | 131.8 | 1.4 | 1.4 | 0.00008 | 84 | 57.7 | 1.5 | 1.5 | 0.07 | ||
| 13.01 | Infective Arthritis And Osteomyelitis (Except That Caused By TB Or STD | 2 | 1.0 | 2.0 | 1.5 | . | 1 | 0.6 | 1.6 | 1.5 | . | ||
| 13.07 | Systemic Lupus Erythematosus And Connective Tissue Disorders | 1 | 1.1 | 0.9 | 1.4 | . | 2 | 0.7 | 2.9 | 1.6 | . | ||
| 13.08 | Other Connective Tissue Disease | 184 | 129.6 | 1.4 | 1.4 | 0.0001 | 81 | 56.4 | 1.4 | 1.4 | 0.13 | ||
| 16 | Injury And Poisoning | 2 | 1.8 | 1.1 | 1.4 | . | 1 | 0.9 | 1.1 | 1.4 | . | ||
| 17 | Symptoms; Signs; And Ill-Defined Conditions And Factors Influencing Health | 128 | 106.8 | 1.2 | 1.2 | . | 57 | 50.4 | 1.1 | 1.2 | . | ||
3.3. Overall Signaling Comparison
| Tree-Based Scan Statistic (TreeScan) Signal Thresholds | |||
|---|---|---|---|
| GPS Signal Thresholds | p ≤ 0.001 | 0.001< p ≤ 0.05 | Total (%) |
| High | 23 | 0 | 23 (32) |
| Medium | 21 | 4 | 25 (35) |
| No signal | 5 | 18 | 23 (32) |
| TOTAL | 49 | 22 | 71 |
| GPS Thresholds | |||
| Medium: lower 95% CI bound ≥1.5 | |||
| High: lower 90% CI bound >2.0 | |||
| Thresholds are mutually exclusive | |||
4. Discussion
Acknowledgments
Conflicts of Interest
References
- Bate, A.; Evans, S.J. Quantitative signal detection using spontaneous ADR reporting. Pharmacoepidemiol. Drug Saf. 2009, 18, 427–436. [Google Scholar] [CrossRef]
- Curtis, J.R.; Cheng, H.; Delzell, E.; Fram, D.; Kilgore, M.; Saag, K.; Yun, H.; Dumouchel, W. Adaptation of Bayesian data mining algorithms to longitudinal claims data: Coxib safety as an example. Med. Care 2008, 46, 969–975. [Google Scholar] [CrossRef]
- Schuemie, M.J. Methods for drug safety signal detection in longitudinal observational databases: LGPS and LEOPARD. Pharmacoepidemiol. Drug Saf. 2011, 20, 292–299. [Google Scholar] [CrossRef]
- Norén, G.N.; Bate, A.; Hopstadius, J.; Star, K.; Edwards, I.R. Temporal Pattern Discovery for Treands and Transient Effects: Its Application to Patient Records, Proceedings of The 14th ACM SIGKDD International Conference on Knowledge Discovery and Data Mining, Las Vegas, NV, USA, August 24–27, 2008; pp. 963–971.
- Brown, J.S.; Petronis, K.; Bate, A.; Zhang, F.; Dashevsky, I.; Kulldorff, M.; Avery, T.A.; Davis, R.L.; Andrade, S.E.; Dublin, S.; et al. Comparing Two Methods for Detecting Adverse Event Signals in Observational Data: Empirical Bayes Gamma Poisson Shrinker and Tree-Based Scan Statistic, Proceedings of The 27th International Conference on Pharmacoepidemiology and Therapeutic Risk Management, The International Society for Pharmacoepidemiology Chicago, Chicago, IL, USA, August 14–17, 2011; p. Abstract 575.
- Kulldorff, M.; Dashevsky, I.; Avery, T.A.; Chan, K.A.; Davis, R.L.; Graham, D.; Platt, R.; Andrade, S.E.; Boudreau, D.; Gunter, M.J.; et al. Drug Safety Data Mining with a Tree-Based Scan Statistic, Proceedings of 26th International Conference on Pharmacoepidemiology and Therapeutic Risk Management, Brighton, England, UK, 2010.
- Park, M.Y.; Yoon, D.; Lee, K.; Kang, S.Y.; Park, I.; Lee, S.H.; Kim, W.; Kam, H.J.; Lee, Y.H.; Kim, J.H.; et al. A novel algorithm for detection of adverse drug reaction signals using a hospital electronic medical record database. Pharmacoepidemiol. Drug Saf. 2011, 20, 598–607. [Google Scholar] [CrossRef]
- Jin, H.W.; Chen, J.; He, H.; Williams, G.J.; Kelman, C.; O’Keefe, C.M. Mining unexpected temporal associations: Applications in detecting adverse drug reactions. IEEE Trans. Inf. Technol. Biomed. 2008, 12, 488–500. [Google Scholar] [CrossRef]
- Walker, A.M. Signal detection for vaccine side effects that have not been specified in advance. Pharmacoepidemiol. Drug Saf. 2010, 19, 311–317. [Google Scholar] [CrossRef]
- Harpaz, R.; DuMouchel, W.; Shah, N.H.; Madigan, D.; Ryan, P.; Friedman, C. Novel data-mining methodologies for adverse drug event discovery and analysis. Clin. Pharmacol. Ther. 2012, 91, 1010–1021. [Google Scholar] [CrossRef]
- Zorych, I.; Madigan, D.; Ryan, P.; Bate, A. Disproportionality methods for pharmacovigilance in longitudinal observational databases. Stat. Methods Med. Res. 2011, 22, 39–56. [Google Scholar] [CrossRef]
- Norén, G.N.; Hopstadius, J.; Bate, A.; Star, K.; Edwards, I.R. Temporal pattern discovery in longitudinal electronic patient records. Data Min. Knowl. Discov. 2010, 20, 361–387. [Google Scholar] [CrossRef]
- Schuemie, M.J.; Coloma, P.M.; Straatman, H.; Herings, R.M.; Trifiro, G.; Matthews, J.N.; Prieto-Merino, D.; Molokhia, M.; Pedersen, L.; Gini, R.; et al. Using electronic health care records for drug safety signal detection: a comparative evaluation of statistical methods. Med. Care 2012, 50, 890–897. [Google Scholar] [CrossRef]
- Norén, G.N.; Hopstadius, J.; Bate, A.; Edwards, I.R. Safety surveillance of longitudinal databases: Results on real-world data. Pharmacoepidemiol. Drug Saf. 2012, 21, 673–675. [Google Scholar] [CrossRef]
- Noren, G.N.; Hopstadius, J.; Bate, A.; Edwards, I.R. Safety surveillance of longitudinal databases: Methodological considerations. Pharmacoepidemiol. Drug Saf. 2011, 20, 714–717. [Google Scholar] [CrossRef]
- Schuemie, M.J. Safety surveillance of longitudinal databases: further methodological considerations. Pharmacoepidemiol. Drug Saf. 2012, 21, 670–672. [Google Scholar] [CrossRef]
- Bate, A.; Brown, E.G.; Goldman, S.A.; Hauben, M. Terminological challenges in safety surveillance. Drug Saf. 2012, 35, 79–84. [Google Scholar] [CrossRef]
- Ryan, P.B.; Madigan, D.; Stang, P.E.; Overhage, J.M.; Racoosin, J.A.; Hartzema, A.G. Empirical assessment of methods for risk identification in healthcare data: Results from the experiments of the Observational Medical Outcomes Partnership. Stat. Med. 2012, 31, 4401–4415. [Google Scholar] [CrossRef]
- Vaccine Safety Monitoring—Adverse Events. Available online: http://www.mini-sentinel.org/methods/methods_development/details.aspx?ID=1028 (accessed on 15 August 2012).
- Yih, W.K.; Kulldorff, M.; Fireman, B.H.; Shui, I.M.; Lewis, E.M.; Klein, N.P.; Baggs, J.; Weintraub, E.S.; Belongia, E.A.; Naleway, A.; et al. Active surveillance for adverse events: The experience of the Vaccine Safety Datalink project. Pediatrics 2011, 127, S54–S64. [Google Scholar] [CrossRef]
- Platt, R.; Davis, R.; Finkelstein, J.; Go, A.S.; Gurwitz, J.H.; Roblin, D.; Soumerai, S.; Ross-Degnan, D.; Andrade, S.; Goodman, M.J.; et al. Multicenter epidemiologic and health services research on therapeutics in the HMO Research Network Center for Education and Research on Therapeutics. Pharmacoepidemiol. Drug Saf. 2001, 10, 373–377. [Google Scholar] [CrossRef]
- Platt, R.; Andrade, S.E.; Davis, R.L.; Destefano, F.; Finkelstein, J.A.; Goodman, M.J.; Gurwitz, J.Y.; Go, A.S.; Martinson, B.C.; Raebel, M.A.; et al. Pharmacovigilance in the HMO Research Network. In Pharmacovigilance; Mann, R.D., Andrews, E.B., Eds.; Wiley: New York, NY, USA, 2002; pp. 392–398. [Google Scholar]
- Raebel, M.A.; Lyons, E.E.; Andrade, S.E.; Chan, K.A.; Chester, E.A.; Davis, R.L.; Ellis, J.L.; Feldstein, A.; Gunter, M.J.; Lafata, J.E.; et al. Laboratory monitoring of drugs at initiation of therapy in ambulatory care. J. Gen. Intern. Med. 2005, 20, 1120–1126. [Google Scholar] [CrossRef]
- Raebel, M.A.; McClure, D.L.; Simon, S.R.; Chan, K.A.; Feldstein, A.; Andrade, S.E.; Lafata, J.E.; Roblin, D.; Davis, R.L.; Gunter, M.J.; et al. Laboratory monitoring of potassium and creatinine in ambulatory patients receiving angiotensin converting enzyme inhibitors and angiotensin receptor blockers. Pharmacoepidemiol. Drug Saf. 2007, 16, 55–64. [Google Scholar] [CrossRef]
- Simon, S.R.; Andrade, S.E.; Ellis, J.L.; Nelson, W.W.; Gurwitz, J.H.; Lafata, J.E.; Davis, R.L.; Feldstein, A.; Raebel, M.A. Baseline laboratory monitoring of cardiovascular medications in elderly health maintenance organization enrollees. J. Am. Geriatr. Soc. 2005, 53, 2165–2169. [Google Scholar] [CrossRef]
- Simon, S.R.; Chan, K.A.; Soumerai, S.B.; Wagner, A.K.; Andrade, S.E.; Feldstein, A.C.; Lafata, J.E.; Davis, R.L.; Gurwitz, J.H. Potentially inappropriate medication use by elderly persons in U.S. Health Maintenance Organizations, 2000–2001. J. Am. Geriatr. Soc. 2005, 53, 227–232. [Google Scholar]
- Wagner, A.K.; Chan, K.A.; Dashevsky, I.; Raebel, M.A.; Andrade, S.E.; Lafata, J.E.; Davis, R.L.; Gurwitz, J.H.; Soumerai, S.B.; Platt, R. FDA drug prescribing warnings: is the black box half empty or half full? Pharmacoepidemiol. Drug Saf. 2006, 15, 369–386. [Google Scholar] [CrossRef]
- Chan, J.; Hui, R.L.; Levin, E. Differential association between statin exposure and elevated levels of creatine kinase. Ann. Pharmacother. 2005, 39, 1611–1616. [Google Scholar] [CrossRef]
- Velentgas, P.; Bohn, R.L.; Brown, J.S.; Chan, K.A.; Gladowski, P.; Holick, C.N.; Kramer, J.M.; Nakasato, C.; Spettell, C.M.; Walker, A.M.; et al. A distributed research network model for post-marketing safety studies: The Meningococcal Vaccine Study. Pharmacoepidemiol. Drug Saf. 2008, 17, 1226–1234. [Google Scholar] [CrossRef]
- Brown, J.; Moore, K.; Braun, M.; Ziyadeh, N.; Chan, K.; Lee, G.; Kulldorff, M.; Walker, A.; Platt, R. Active influenza vaccine safety surveillance: Potential within a healthcare claims environment. Med. Care 2009, 47, 1251–1257. [Google Scholar] [CrossRef]
- Behrman, R.E.; Benner, J.S.; Brown, J.S.; McClellan, M.; Woodcock, J.; Platt, R. Developing the Sentinel System—A national resource for evidence development. N. Engl. J. Med. 2011, 364, 498–499. [Google Scholar] [CrossRef]
- Perveze, Z.; Johnson, M.W.; Rubin, R.A.; Sellers, M.; Zayas, C.; Jones, J.L.; Cross, R.; Thomas, K.; Butler, B.; Shrestha, R. Terbinafine-induced hepatic failure requiring liver transplantation. Liver Transpl. 2007, 13, 162–164. [Google Scholar] [CrossRef]
- Lou, H.Y.; Fang, C.L.; Fang, S.U.; Tiong, C.; Cheng, Y.C.; Chang, C.C. Hepatic failure related to itraconazole use successfully treated by corticosteroids. Hepat. Mon. 2011, 11, 843–846. [Google Scholar]
- Nikkels, A.F.; Nikkels-Tassoudji, N.; Pierard, G.E. Oral antifungal-exacerbated inflammatory flare-up reactions of dermatomycosis: Case reports and review of the literature. Am. J. Clin. Dermatol. 2006, 7, 327–331. [Google Scholar] [CrossRef]
- Cançado, G.G.; Fujiwara, R.T.; Freitas, P.A.; Correa-Oliveira, R.; Bethony, J.M. Acute generalized exanthematous pustulosis induced by itraconazole: an immunological approach. Clin. Exp. Dermatol. 2009, 34, e709–e711. [Google Scholar] [CrossRef]
- Elixhauser, A.; Steiner, C.; Palmer, L. Clinical Classifications Software (CCS), 2009. Agency for Healthcare Research and Quality. Available online: http://www.hcup-us.ahrq.gov/toolssoftware/ccs/ccs.jsp (accessed on 15 August 2012).
- DuMouchel, W. Bayesian data mining in large frequency tables, with an application to the FDA spontaneous reporting system. Am. Stat. 1999, 53, 177–190. [Google Scholar]
- Fram, D.; Almenoff, J.S.; Dumouchel, W. Empirical Bayesian Data Mining for Discovering Patterns in Post-Marketing Drug Safety. In Proceedings of the Ninth ACM SIGKDD International Conference on Knowledge Discovery and Data Mining, Washington DC, USA, August 24−27, 2003; pp. 359–368.
- Banks, D.; Woo, E.J.; Burwen, D.R.; Perucci, P.; Braun, M.M.; Ball, R. Comparing data mining methods on the VAERS database. Pharmacoepidemiol. Drug Saf. 2005, 14, 601–609. [Google Scholar] [CrossRef]
- Almenoff, J.S.; DuMouchel, W.; Kindman, L.A.; Yang, X.; Fram, D. Disproportionality analysis using empirical Bayes data mining: A tool for the evaluation of drug interactions in the post-marketing setting. Pharmacoepidemiol. Drug Saf. 2003, 12, 517–521. [Google Scholar] [CrossRef]
- Szarfman, A.; Machado, S.G.; O’Neill, R.T. Use of screening algorithms and computer systems to efficiently signal higher-than-expected combinations of drugs and events in the US FDA’s spontaneous reports database. Drug Saf. 2002, 25, 381–392. [Google Scholar] [CrossRef]
- Kulldorff, M.; Dashevsky, I.; Avery, T.; Chan, A.; Davis, R.; Graham, D.; Platt, R.; Andrade, S.; Boudreau, D.; Dublin, S.; et al. Drug Safety Data Mining with a Tree-Based Scan Statistic. Pharmacoepidemiol. Drug Saf. 2013, in press. [Google Scholar]
- Kulldorff, M.; Fang, Z.; Walsh, S.J. A tree-based scan statistic for database disease surveillance. Biometrics 2003, 59, 323–331. [Google Scholar] [CrossRef]
- Tuccori, M.; Bresci, F.; Guidi, B.; Blandizzi, C.; Del Tacca, M.; Di Paolo, M. Fatal hepatitis after long-term pulse itraconazole treatment for onychomycosis. Ann. Pharmacother. 2008, 42, 1112–1117. [Google Scholar] [CrossRef]
- Kohli, R.; Hadley, S. Fungal arthritis and osteomyelitis. Infect. Dis. Clin. North Am. 2005, 19, 831–851. [Google Scholar] [CrossRef]
- Avorn, J.; Schneeweiss, S. Managing drug-risk information—What to do with all those new numbers. N. Engl. J. Med. 2009, 361, 647–649. [Google Scholar] [CrossRef]
- Robb, M.A.; Racoosin, J.A.; Sherman, R.E.; Gross, T.P.; Ball, R.; Reichman, M.E.; Midthun, K.; Woodcock, J. The US Food and Drug Administration’s Sentinel Initiative: Expanding the horizons of medical product safety. Pharmacoepidemiol. Drug Saf. 2012, 21, 9–11. [Google Scholar] [CrossRef]
- Platt, R.; Carnahan, R.M.; Brown, J.S.; Chrischilles, E.; Curtis, L.H.; Hennessy, S.; Nelson, J.C.; Racoosin, J.A.; Robb, M.; Schneeweiss, S.; et al. The U.S. Food and Drug Administration’s Mini-Sentinel program: Status and direction. Pharmacoepidemiol. Drug Saf. 2012, 21, 1–8. [Google Scholar]
- Olsson, S. The role of the WHO programme on International Drug Monitoring in coordinating worldwide drug safety efforts. Drug Saf. 1998, 19, 1–10. [Google Scholar] [CrossRef]
- Asian Pharmacoepidemiology Network. Available online: http://aspennet.asia/index.html (accessed on 21 November 2012).
- Blake, K.V.; Devries, C.S.; Arlett, P.; Kurz, X.; Fitt, H. Increasing scientific standards, independence and transparency in post-authorisation studies: The role of the European Network of Centres for Pharmacoepidemiology and Pharmacovigilance. Pharmacoepidemiol. Drug Saf. 2012, 21, 690–696. [Google Scholar] [CrossRef]
- Stang, P.E.; Ryan, P.B.; Racoosin, J.A.; Overhage, J.M.; Hartzema, A.G.; Reich, C.; Welebob, E.; Scarnecchia, T.; Woodcock, J. Advancing the science for active surveillance: Rationale and design for the Observational Medical Outcomes Partnership. Ann. Intern. Med. 2010, 153, 600–606. [Google Scholar]
- Coloma, P.M.; Schuemie, M.J.; Trifiro, G.; Gini, R.; Herings, R.; Hippisley-Cox, J.; Mazzaglia, G.; Giaquinto, C.; Corrao, G.; Pedersen, L.; et al. Combining electronic healthcare databases in Europe to allow for large-scale drug safety monitoring: the EU-ADR Project. Pharmacoepidemiol. Drug Saf. 2011, 20, 1–11. [Google Scholar] [CrossRef]
- Pharmacoepidemiological Research on Outcomes of Therapeutics by a European Consortium IMI-PROTECT. Available online: http://www.imi-protect.eu/ (accessed on 21 November 2012).
© 2013 by the authors; licensee MDPI, Basel, Switzerland. This article is an open access article distributed under the terms and conditions of the Creative Commons Attribution license (http://creativecommons.org/licenses/by/3.0/).
Share and Cite
Brown, J.S.; Petronis, K.R.; Bate, A.; Zhang, F.; Dashevsky, I.; Kulldorff, M.; Avery, T.R.; Davis, R.L.; Chan, K.A.; Andrade, S.E.; et al. Drug Adverse Event Detection in Health Plan Data Using the Gamma Poisson Shrinker and Comparison to the Tree-based Scan Statistic. Pharmaceutics 2013, 5, 179-200. https://doi.org/10.3390/pharmaceutics5010179
Brown JS, Petronis KR, Bate A, Zhang F, Dashevsky I, Kulldorff M, Avery TR, Davis RL, Chan KA, Andrade SE, et al. Drug Adverse Event Detection in Health Plan Data Using the Gamma Poisson Shrinker and Comparison to the Tree-based Scan Statistic. Pharmaceutics. 2013; 5(1):179-200. https://doi.org/10.3390/pharmaceutics5010179
Chicago/Turabian StyleBrown, Jeffrey S., Kenneth R. Petronis, Andrew Bate, Fang Zhang, Inna Dashevsky, Martin Kulldorff, Taliser R. Avery, Robert L. Davis, K. Arnold Chan, Susan E. Andrade, and et al. 2013. "Drug Adverse Event Detection in Health Plan Data Using the Gamma Poisson Shrinker and Comparison to the Tree-based Scan Statistic" Pharmaceutics 5, no. 1: 179-200. https://doi.org/10.3390/pharmaceutics5010179
APA StyleBrown, J. S., Petronis, K. R., Bate, A., Zhang, F., Dashevsky, I., Kulldorff, M., Avery, T. R., Davis, R. L., Chan, K. A., Andrade, S. E., Boudreau, D., Gunter, M. J., Herrinton, L., Pawloski, P. A., Raebel, M. A., Roblin, D., Smith, D., & Reynolds, R. (2013). Drug Adverse Event Detection in Health Plan Data Using the Gamma Poisson Shrinker and Comparison to the Tree-based Scan Statistic. Pharmaceutics, 5(1), 179-200. https://doi.org/10.3390/pharmaceutics5010179