Article

Muscle to Brain Partitioning as Measure of Transporter-Mediated Efflux at the Rat Blood–Brain Barrier and Its Implementation into Compound Optimization in Drug Discovery

1
Department of Drug Discovery Sciences, Boehringer Ingelheim Pharma GmbH & Co. KG, 88397 Biberach, Germany
2
Department of Drug Metabolism and Pharmacokinetics, Boehringer Ingelheim Pharma GmbH & Co. KG, 88397 Biberach, Germany
3
Department of Clinical Pharmacy, Institute of Pharmacy, University of Hamburg, 20146 Hamburg, Germany
*
Author to whom correspondence should be addressed.
Pharmaceutics 2019, 11(11), 595; https://doi.org/10.3390/pharmaceutics11110595
Submission received: 2 October 2019 / Revised: 31 October 2019 / Accepted: 8 November 2019 / Published: 11 November 2019
(This article belongs to the Special Issue Drug Delivery to the Brain)

Abstract

:
Movement of xenobiotic substances across the blood–brain barrier (BBB) is tightly regulated by various transporter proteins, especially the efflux transporters P-glycoprotein (P-gp/MDR1) and breast cancer resistance protein (BCRP). Avoiding drug efflux at the BBB is a unique challenge for the development of new central nervous system (CNS) drugs. Drug efflux at the BBB is described by the partition coefficient of unbound drug between brain and plasma (Kp,uu,brain) which is typically obtained from in vivo and often additionally in vitro measurements. Here, we describe a new method for the rapid estimation of the in vivo drug efflux at the BBB of rats: the measurement of the partition coefficient of a drug between brain and skeletal muscle (Kp,brain/muscle). Assuming a closely similar distribution of drugs into the brain and muscle and that the efflux transporters are only expressed in the brain, Kp,brain/muscle, similar to Kp,uu,brain, reflects the efflux at the BBB. The new method requires a single in vivo experiment. For 64 compounds from different research programs, we show the comparability to other approaches used to obtain Kp,uu,brain. P-gp- and BCRP-overexpressing cell systems are valuable in vitro tools for prescreening. Drug efflux at the BBB can be most accurately predicted based on a simple algorithm incorporating data from both in vitro assays. In conclusion, the combined use of our new in vivo method and the in vitro tools allows an efficient screening method in drug discovery with respect to efflux at the BBB.

Graphical Abstract

1. Introduction

The blood–brain barrier (BBB), formed by endothelial cells of the brain capillaries, astrocytes, and pericytes, is a regulatory interface between the central nervous system (CNS) and the circulatory bloodstream [1]. Movement of endogenous and xenobiotic substances across the BBB is tightly regulated by various transporter proteins expressed in the endothelial cells. On the one hand, it is a unique challenge to develop drugs which can overcome the BBB and reach their pharmacological targets within the CNS. On the other hand, it can also be important to prevent drugs with peripheral targets from entering the CNS due to their potential undesired side effects.
Two membrane transporters have been identified as the major players regulating the transport of drugs across the BBB: multidrug resistance 1 (MDR1)/P-glycoprotein (P-gp)/ATP-binding cassette sub-family B member 1 (ABCB1) and breast cancer resistance protein (BCRP)/ATP-binding cassette super-family G member 2 (ABCG2) [2,3]. Both transporters belong to the ATP-binding cassette (ABC) superfamily of transporters and are localized in the luminal membrane of the brain capillary endothelial cells. Due to their very broad substrate spectrum both transporters can efficiently limit the entry of drugs into brain and thus are considered as major hurdles in the discovery of CNS drugs. There is, therefore, a strong interest to evaluate the impact of both transporters on the brain distribution of drug candidates early in the drug discovery process. In recent years, the partition coefficient of unbound drug between brain and plasma (Kp,uu,brain) has become more and more relevant for the description of the extent of brain penetration of a drug [4,5]. Under steady-state conditions, Kp,uu,brain defines the ratio between the unbound drug concentration in brain (Cu,brain), i.e., the interstitial fluid (ISF) and the unbound drug concentration in plasma(Cu,plasma) (Equation (1)).
Kp,uu,brain = Cu,brain/Cu,plasma
Using microdialysis, the concentrations in brain ISF can be determined. Since the concentrations in the ISF are compared to unbound plasma concentrations to derive Kp,uu,brain, in addition to the ISF and plasma concentrations derived from the in vivo experiment, the plasma protein binding of the investigated compound has to be determined by an in vitro method. As method development for microdialysis is time consuming and recovery can be an issue, this method is not suitable for the investigation of large numbers of compounds as typically needed in drug discovery research. A commonly used method with higher throughput is the brain homogenate method where drug concentrations in brain and plasma are determined and converted to the unbound concentrations using fraction unbound in plasma (fu,plasma) and fraction unbound in brain homogenate (fu,brain), both being determined in vitro (Equation (2)).
Kp,uu,brain = Cu,brain/Cu,plasma = (Cbrain × fu,brain)/(Cplasma × fu,plasma) = Kp,brain × (fu,brain/fu,plasma)
where Cplasma and Cbrain are the plasma and brain concentration, respectively. Kp is the partition coefficient of total drug in brain and plasma:
Kp,brain = Cbrain/Cplasma
The assumption behind Equation (2) is that the in vitro fraction unbound in brain homogenate (fu,brain) equals the in vivo fraction unbound in brain. This assumption is, however, no longer valid in case of strong bases which partition strongly into acidic organelles (e.g., lysosomes). The pH partitioning is destroyed by the disruption of organelles during the preparation of brain homogenate, which leads to an overestimation of fu,brain [6,7]. Measurement of volume of distribution of unbound drug (Vu,brain) in brain slices overcomes this partitioning issue [8]; however, it is not feasible for higher throughput either. In the past, the partition coefficient of total drug, Kp, was frequently used to describe the extent of brain distribution. Since the binding of a drug to plasma protein could differ strongly to the binding to brain tissue, use of Kp for this purpose can be misleading [8] and is no longer considered a state of the art approach. Instead of measuring the unbound drug concentration in ISF, drug concentration in the cerebrospinal fluid (CCSF) is often used as a surrogate. Because of the different physiological origin of CSF and ISF and the different expression of drug transporters in the BBB and blood–CSF barrier, the value of CCSF is limited, especially for strong substrates of drug transporters [9,10,11]. Since all these methods include at least one in vivo experiment, their throughput is rather limited. For compound screening in the early drug discovery phase, several in vitro methods have been established in the pharmaceutical industry. P-gp and BCRP-transfected Madin-Darby canine kidney (MDCK) cells were shown to be valuable tools [12,13]. In such assays, the bidirectional transport of a drug across a cell monolayer grown on a Transwell® insert is measured. The transport activities of P-gp or BCRP in these cells for a certain compound are expressed by the efflux ratio (ER):
ER = Papp,BA/Papp,AB = 1 + Jefflux/PSDiff
with PappAB and PappBA being apparent permeability coefficients in the apical to basolateral and basolateral to apical directions, respectively, Jefflux being the rate of transporter-mediated efflux, and PSDiff the rate of passive diffusion. By setting a certain threshold for the ER, compounds can be easily filtered with regard to potential limitation in brain distribution by P-gp and/or BCRP. These in vitro data, however, have to be used with caution. Firstly, the expression levels of the transport proteins in the transfectants may differ to those in the BBB. ER measured in the in vitro assays may therefore over- or underestimate the transporter activities in vivo. Secondly, the plasma exposure of the compounds can differ strongly to the standard concentration used in the in vitro assays and over- or underestimation of transporter activities using in vitro data may occur in case of nonlinearity of the transporter activities.
In the present paper, we describe a new in vivo method for the fast estimation of in vivo Kp,uu,brain. We validated this method with compounds from our running discovery programs by comparing it to literature known in vivo and in vitro methods. We describe the derived screening strategy applied in Boehringer-Ingelheim’s drug discovery research which helps to select compounds more efficiently and more reliably with regard to BBB penetration.

2. Materials and Methods

2.1. Compounds

Test compounds are proprietary compounds of Boehringer Ingelheim as well as reference compounds from literature and patents. They derive from a variety of different research projects. The binned distributions of molecular weight (MW), number of H acceptors (H-AC), calculated log P (clogP, Bio-Loom, BioByte Corporation, Claremont, CA, USA), total polar surface area (TPSA), and the aliphatic indicator (FSP3) are listed in Table 1.

2.2. Animal Studies

All animal experiments were conducted in accordance with the German and European Animal Welfare Act and authorized by the Regierungspräsidium Tübingen as the responsible local German authority under reference numbers 08-006 (21 February 2008), 11-001 (21 February 2011), and 14-009 (25 June 2014). Animal experiments were performed in male rats of different strains (Han Wistar, Sprague Dawley, Lister Hooded, Long-Evans, supplied by commercial breeders, typically Charles River, Sulzfeld, Germany or Janvier Labs, Saint-Berthevin Cedex, France). Only two studies were done in female animals. Typically three animals were used per experiment. For 10.6% of the studies which were performed in an early screening approach, only two animals were used per experiment. Compounds were dosed orally, intravenously, subcutaneously, or intraperitoneally. For tissue sampling animals were anaesthetized with Ketamin/Inactin. After dissection of the cisterna magna, approximately 50 µL CSF was collected via a 0.4-mm cannula. Blood was collected from the retroorbital plexus into K3EDTA coated vials (Sarstedt, Nümbrecht, Germany) and plasma was collected by centrifugation for 5 min at approximately 5000 rpm. Animals were exsanguinated via the vena cava. The femoral muscle was prepared. A small piece (approximately 0.2–0.5 g) was excised, rinsed in cold physiological NaCl, and the remaining fat and superficial vessels were removed. For brain isolation, skin and muscle of head and neck were removed. The cranium was opened with a bone trimmer by one central and two lateral incisions. Cranium and dura matter were removed and the complete brain was culled and washed in physiological NaCl. Muscle and one hemisphere of the brain were transferred into pre-weight homogenization devices (Precellys® kit, 7 mL, CK28, Bertin Instruments, Montigny-le-Bretonneux, France). For homogenization, four parts (v/w) homogenization buffer (37.5% acetonitrile, 37.5% methanol, 25% water) were added. Tissues were homogenized with a Precellys® Evolution homogenizer (Bertin Instruments, Montigny-le-Bretonneux, France) at 5500 rpm (three cycles of 40 s with a 30-s break in between). Five µL of the homogenate were added to 70 µL of a 1 to 1 (v/v) mixture of acetonitrile and methanol and frozen for at least 10 min at approximately −18 °C. For final sample preparation the sample was centrifuged at approximately 4000 rpm for 1 min. Then, 30 µL sample were mixed with 170 µL formic acid prior to injection. Calibration curve was made in plasma. In addition, six tissue quality control (QC) samples were generated. When the accuracy of the tissue QCs was within the range of ± 30% a plasma calibration curve was used, otherwise the tissue QCs were used instead of the calibration curve.

2.3. In Vitro Efflux Measurement

Bidirectional permeability assays were performed as described previously [14] with the exception that MDCK II cells expressing recombinant human MDR1 (MDCK-MDR1) or human BCRP (MDCK-BCRP) were used instead of Caco-2 cells. Briefly, compounds were diluted in transport buffer (128.13 mM NaCl, 5.36 mM KCl, 1 mM MgSO4, 1.8 mM CaCl2, 4.17 mM NaHCO3, 1.19 mM Na2HPO4, 0.41 mM NaH2PO4, 15 mM 2-[4-(2-hydroxyethyl)piperazin-1-yl]ethanesulfonic acid (HEPES), 20 mM glucose, pH 7.4) containing 0.25% bovine serum albumin to a final concentration of 1 or 10 µM and added to the apical or basolateral compartment. Cells were incubated with the compounds for up to 2 h. Samples from the opposite compartment were taken at different time points. Apparent permeability coefficients (Papp,AB, Papp,BA)were calculated as follows:
Papp,AB = QAB/(C0 × s × t)
Papp,BA = QBA/(C0 × s × t)
where Q is the amount of compound recovered in the receiver compartment after the incubation time t, C0 the initial compound concentration given to the donor compartment, and s the surface area of the Transwell inserts. Efflux ratio is calculated as the quotient of Papp,BA (mean of duplicate) to Papp,AB (mean of duplicate). In both MDCK-MDR1 and MDCK-BCRP assay, one reference substrate (apafant for MDR1 and daizein for BCRP) and one low permeable compound (BI internal reference, Papp ≈ 3 × 10⁻⁷ cm/s, no efflux) is included in every assay plate. In addition, Transepithelial electrical resistance (TEER) values are measured for each plate before the permeability assay. All three parameters (efflux of the reference substrates, Papp values of the low permeable compound, and TEER values) are used to ensure the quality of the assays.

2.4. In Vitro Binding Assays

Binding of research compounds to plasma protein and tissue homogenates was determined using the equilibrium dialysis method as described previously [9,15]. Briefly, plasma, brain homogenate, and muscle homogenate were spiked with 1–10 µM of test compound and dialyzed in equilibrium dialysis cells (RED-device, Thermo Scientific/Pierce or Dianorm Equlilibrium Device, Harvard Apparatus Holliston, MA, USA) against 100 mM potassium phosphate buffer pH 7.4 for 2 to 6 h at 37 °C. Unbound plasma concentration (fu,plasma) was calculated as:
fu,plasma = (Cplasma − Cbuffer)/Cplasma,
where Cplasma and Cbuffer are the plasma and buffer concentration, respectively. Unbound tissue concentration (fu,tissue) was calculated as:
fu,tissue = (1/D)/(1/fu,app-1 + 1/D),
with D being the dilution factor and fu,app the observed fraction unbound in the homogenate incubations. All fu values are measured in triplicate.
Compound concentrations were measured using liquid chromatography-tandem mass spectrometry (HPLC-MS/MS) according to the method described below.

2.5. Bioanalytics

Drug concentrations in plasma, CSF, and tissue homogenates were determined by HPLC-MS/MS (standard equipment: HPLC series 1000 or higher from Agilent, Santa Clara, CA, USA and mass spectrometers API 4000 or higher from AB Sciex, Toronto, ON, Canada). Prior to bioanalysis plasma samples and dialysates were spiked with internal standard solution and diluted with acetonitrile for protein precipitation. For CSF no protein precipitation was necessary. Measurement was operated in multiple reaction monitoring (MRM) mode. Quantification was performed using external calibration.

2.6. Statistical Analysis

Prediction bias was calculated as the geometric mean bias:
b i a s = 10 ^ ( i = 1 n [ l o g ( p r e d i / o b s i ) ] / n )
where predi and obsi are the predicted and observed values of the ith observation, respectively, with n as the total number of observations. The average fold error (AFE), which describes the average fold change of the predicted versus the observed values, was calculated as follows:
A F E = 10 ^ i = 1 n [ ( log ( p r e d i ) log ( o b s i ) ) ^ 2 ] / n
Regression analysis was carried out in R [16] (Version 3.3.2). Model parameters were estimated using extended least squares [17] assuming heteroscedastic variability. The predictive performance of different models was compared with regard to the Akaike information criterion (AIC) [18], AFE, bias, and percentage of predictions falling within the two- and three-fold error range.

3. Results

3.1. Kp,brain/muscle (Kp,br/mu) as a Surrogate for In Vivo Blood–Brain Barrier Efflux

Analogous to Equation (2), the Kp,uu of any tissue can be described as
Kp,uu,tissue = Cu,tissue/Cu,plasma = (Ctissue × fu,tissue)/(Cplasma × fu,plasma) = Kp,tissue × (fu,tissue/fu,plasma)
In a tissue without substantial drug transporter mediated active uptake or efflux, Kp,uu approaches 1 under steady-state conditions. Equation (9) can be transformed to
Kp,tissue = fu,plasma/fu,tissue
By combining Equations (2) and (12), the ratio between the partition coefficient of brain and this tissue can be expressed as
Kp,brain/Kp,tissue = (fu,plasma × fu,tissue × Kp,uu,brain)/(fu,brain × fu,plasma) = Kp,uu,brain × (fu,tissue/fu,brain)
with rearrangement leading to
Kp,uu,brain = (Kp,brain/Kp,tissue) × (fu,brain/fu,tissue) = (Cbrain/Ctissue)/(fu,brain/fu,tissue)
As suggested by Equation (16), the Kp,uu,brain of a compound could be simply determined without in vitro measurement of fu in plasma or tissue homogenate as the ratio of the exposure in brain and in a tissue without efflux and with a similar free fraction as in brain:
Kp,uu,brain ≈ Cbrain/Ctissue = Kp,brain/tissue, if fu,brain≈ fu,tissue
Published data show that skeletal muscle has similar fractions of neutral lipids, neutral phospholipids, acidic phospholipids, and intracellular and extracellular tissue water, as well as similar tissue-to-plasma ratios of albumin and lipoprotein as compared to the brain [19,20]. Tissue binding in brain and muscle could be expected to be very similar. Indeed, compounds without blood–brain barrier efflux like midazolam or diazepam show very similar distributions into brain and skeletal muscle [19,20]. Our in-house next generation sequencing (NGS) data indicate very low levels of expression of drug transporters like P-gp and BCRP in skeletal muscle (data not shown). All these data suggest that skeletal muscle could be used as an in vivo reference tissue for a rapid estimation of Kp,uu,brain as described in equation (17).
As a validation of this hypothesis, we measured the fu of 25 internal compounds in muscle and brain homogenate of rat. As depicted in Figure 1, there is a good correlation between the fu in these two tissues with an average fold error (AFE) of 1.82, a bias of 0.721, and 80.8% and 88.5% of compounds within 2-fold and 3-fold error, respectively.
Based on these data and Equation (15), Kp,uu,brain can now be described as follows (Kp,brain/muscle will be abbreviated as Kp,br/mu in the remaining text):
Kp,uu,brain ≈ Cbrain/Cmuscle = Kp,brain/muscle

3.2. Comparison of Kp,Br/Mu With Kp,Uu,Brain Derived from the Brain Homogenate Method and CSF

In order to further validate Equation (16), we compared the Kp,br/mu of 64 internal compounds with two methods frequently used for the determination of BBB efflux: Kp,uu calculation using the brain homogenate method for fu,brain estimation (Kp,uu,brain(hom)) and the method using CCSF as a surrogate for Cu,brain (Kp,uu,CSF). The correlations are depicted in Figure 2. The statistical analysis indicated a good correlation between Kp,br/mu and Kp,uu,brain(hom), with an AFE of 2.42, a bias of 1.80, and 53.1% and 75.0% of data within a 2-fold and 3-fold error, respectively. The correlation between Kp,br/mu and Kp,uu,CSF as surrogate for Kp,uu,brain was comparable with an AFE of 2.59, a bias of 0.998, and 56.3% and 81.3% of data within a 2-fold and 3-fold error, respectively. Interestingly, a simple regression analysis indicates that the correlation between Kp,br/mu and Kp,uu,brain(hom) (R2 0.721) was clearly better than between Kp,br/mu and Kp,uu,CSF (R2 0.365).

3.3. Robustness and Versatility of the Kp,Br/Mu Method

As a further characterization, we checked also the robustness of our new method with one compound being repeatedly tested in independent experiments. The variability of Kp,br/mu values from all experiments was less than 2-fold (Supplement Figure S1).
Typically, the tissues were sampled around the time at maximum plasma compound concentration (Tmax) after oral administration. For selected compounds, we investigated the time-dependence of Kp,br/mu. As shown in Table 2, the influence of sampling time was negligible.
Also, the application route did not influence the Kp,br/mu of a certain compound. The correlation of Kp,br/mu determined after oral and intravenous administration of 29 compounds is depicted in Figure 3. It was found that −67.0% and 82.8% of data were within 2-fold and 3-fold deviation, respectively. Together with the calculated AFE of 1.91 and bias of 0.757 this indicates a good correlation. The same was true for subcutaneous and intraperitoneal application (data not shown).

3.4. Correlations Between Kp,Br/Mu and In Vitro Efflux Measured with Transfected Cells

Bidirectional permeability assay using MDR1-transfected MDCK cells is a well-accepted in vitro screening assay in the pharmaceutical industry to address the blood–brain barrier efflux [12,13,21]. However, since the expression levels of the transporters in the cell lines used in different labs may differ strongly [21], it is important for each lab to calibrate its in vitro screening assay using in vivo data. In our case we compared the in vitro efflux measured in our in-house MDR1-overexpressing MDCK cells (MDCK-MDR1) with Kp,br/mu measured in rats. Figure 4 shows the correlation between Efflux measured in MDCK-MDR1 cells with a substrate concentration of 10 µM and Kp,br/mu for 681 BI research compounds. As some of these compounds were dosed by more than one administration route, the dataset consists of 713 data points. In general, there is a good correlation between the in vitro and in vivo data (AFE 2.34, bias 0.732, 64.6% and 83.1% of data within 2-fold and 3-fold error, respectively).
However, as is obvious in Figure 4, some compounds did show a disconnect between in vitro and in vivo efflux. These are highly permeable compounds with no or low in vitro P-gp efflux; however in tissue distribution studies the Kp,br/mu of these compounds indicated higher in vivo efflux than expected from the in vitro data. After in-depth profiling of these compounds, we could divide these compounds into two subgroups. For one subgroup, the explanation for this disconnect is the rather high concentration (10 µM) in the MDCK-MDR1 assay. Due to the non-linear nature of P-gp transporter activities, the ratio between the rate of efflux and the rate of passive diffusion may decrease with increasing substrate concentration. In such cases, reducing substrate concentrations could improve the in vitro–in vivo correlation (IVIVC) since the plasma exposures in the animal studies were usually much lower than 10 µM. Indeed, when measured at 1 µM in the MDCK-MDR1 assay, the IVIVC for this subgroup of compounds was improved (Figure 5). AFE decreased from 4.00 to 2.00, bias increased from 0.301 to 0.647, and number of compounds within 2-fold/3-fold error increased from 25.0%/47.9% to 70.8%/85.4%, respectively.
For the second subgroup of compounds with IVIVC disconnect, the explanation is the involvement of BCRP, another major drug transporter at the BBB. When tested in the MDCK-BCRP assay, most of these compounds turned out to be BCRP substrates, and some are substrates for both P-gp and BCRP. When correlated with Kp,br/mu, the in vitro BCRP efflux strongly overestimated the in vivo efflux (Figure 6B). The overestimation was mainly due to the very high expression of the recombinant BCRP in our cells (in-house proteomic data). In order to correct the in vitro efflux by the expression level, we used a similar approach as described by Liu et al. [13]: For the BCRP-selective substrate dantrolene [9,13,22] we determined both the in vitro efflux (40.3) in MDCK-BCRP cells and the Kp,br/mu (6.2) in rats, which resulted in a correction factor of about 6. Assuming that the total efflux at the BBB is the sum of efflux by both transporters, the total in vitro efflux from P-gp and BCRP can be calculated as follows:
Effluxtotal = (EffluxPgp − 1) + ((EffluxBCRP − 1)/6) + 1
As shown in Figure 6C, the IVIVC is strongly improved for this subgroup of compounds by using the total in vitro efflux.
Instead of using the correction factor determined with the reference BCRP substrate dantrolene, we tried also to determine correction factors for both in vitro assays with an unbiased approach. As described in Equation (18),
Effluxtotal = ((EffluxPgp − 1)/ΘPGP) + ((EffluxBCRP − 1)/ΘBCRP) + 1
Regression models including correction factors ΘPGP for the term (EffluxPgp − 1) and ΘBCRP for (EffluxBCRP − 1) were fitted to data from 133 compounds. The results are listed in Table 3. The model where ΘBCRP was estimated and ΘPGP was fixed to 1 (BCRP model) resulted in a similar value for this parameter compared to the fixed model as described by Equation (17). While both models were comparable in terms of AIC and AFE, the BCRP model was slightly less biased (calculated bias closer to 1) than the fixed model, but fewer predictions fell within the two- and three-fold error range. Overall, both models performed equally well, confirming the validity of determining the BCRP-related efflux correction directly from the dantrolene in vitro data. Estimating the correction factors for both efflux terms resulted in the numerically best fit, as shown by the lowest AIC and the lowest AFE of all tested models. The difference to the fixed and the BCRP model was, however, only marginal. Sole estimation of ΘPGP (P-gp model), which lacks a scientific rationale, was inferior to all other methods.

4. Discussion

We describe in this publication a new method for the rapid estimation of the in vivo BBB efflux of a compound by using the partition coefficient Kp,br/mu. The underlying assumptions are: (1) that binding within brain and muscle tissue, which is based upon pH partitioning and binding to neutral lipids, neutral phospoholipids and acidic phospholipids [19,20] is comparable due to similar intracellular pH and similar amounts of the different phospholipids in both tissues; and (2) that the efflux transporters which limit distribution into brain, especially P-gp and BCRP, are not expressed in muscle tissue in relevant amounts.
Since the pH of the intracellular water of both brain and muscle tissue is reported to be identical, pH 7.0 [19], pH partitioning should not contribute to differences in distribution of drugs between both tissues. The fractional tissue volume of neutral lipids is approximately four-fold higher in brain than in muscle tissue, whereas the tissue concentration of acidic phospholipids is approximately fourfold higher in muscle than in brain tissue [19,20]. According to the models of Rodgers and Rowland, the dominating factor for moderate to strong bases is binding to acidic phospholipids, whereas for weak bases, acids, and neutral compounds it is binding to neutral lipids [19,20]. Calculation of the distribution of unbound drug between plasma and both tissues (Kp,u,brain and Kp,u,muscle) for the compounds described in both publications shows that both values typically are within a threefold range, what leads to comparable values for the tissue partitioning coefficients Kp,u,brain and K
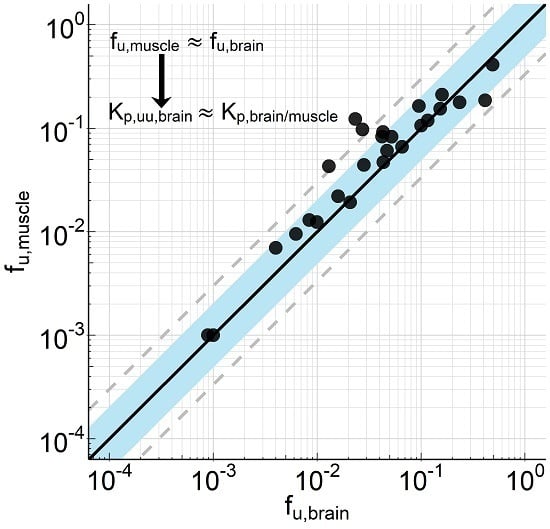
p,u,muscle. Consistent with these considerations, we could show for 26 compounds (for which calculated or measured pKa values ranged between 2 and 11) very similar binding in homogenates from brain and skeletal muscle of rats (Figure 1). Assuming that transporters do not relevantly affect the distribution into muscle, differences in the tissue partitioning coefficients can therefore be attributed to transporters at the blood–brain barrier. That allows us to estimate efflux at the blood–brain barrier (Kp,uu,br) using the ratio of the tissue partitioning coefficients Kp,u,brain/Kp,u,muscle and with the further assumption of identical binding in tissues (fu,brain = fu,muscle) to use the ratio Kp,br/mu. However, for weak bases, acids, and neutral compounds, Kp,u,brain is typically slightly greater than Kp,u,muscle and for moderate to strong bases Kp,u,muscle is typically slightly greater than Kp,u,brain, what would lead to a small overestimation of free brain concentration and underestimation of efflux for weak bases, acids and neutral compounds and a small underestimation of free brain concentration and overestimation of efflux for moderate to strong bases (data not shown). It should be mentioned that we have not done a systematic comparison of partitioning within a broad set of different tissues. Although we see muscle as an appropriate reference tissue, there is a possibility that other tissues could also be suitable or even better for this purpose.
Typical drug transporters like organic anion transporting polypetide (OATP) 1B1, OATP1B3, organic anion transporter (OAT) 1, OAT3, P-gp, BCRP, and multidrug resistance protein (MRP) 2 are not detected in skeletal muscle [23]. However, OATP2B1, MRP1, MRP4, and MRP5, which are relevant for the uptake (OATP2B1) and efflux (MRPs) of statins (e.g., atorvastatin and rosuvastatin) in skeletal muscle, were detected in skeletal muscle by mRNA expression, western blot, and immunolocalization [23]. Thus, if other transporters than P-gp or BCRP are involved in the brain and/or muscle distribution of a drug the potential role of these transporters has therefore to be carefully assessed before applying this method. On the other hand, discrepancies between in vitro efflux data for P-gp/BCRP and Kp,uu,brain determined using Kp,br/m or between Kp,uu,brain determined using Kp,br/m and other methods can be an indication that other transporters or mechanisms are potentially involved.
Our results demonstrate that the new method described here is fast, robust, and versatile and provides sufficient comparability to the standard method for the estimation of BBB efflux (Kp,uu,brain), the brain homogenate method (Kp,uu,brain(hom)). It is certainly debatable whether the Kp,uu,brain calculation using fu,brain determined from brain homogenate is appropriate for all compounds, e.g., the unbound fraction of basic compounds with strong tendency of pH partitioning could be overestimated [6,7,8]. In this regard, the Kp,br/mu method could be even superior to the Kp,uu,brain calculation using fu,brain determined from brain homogenate method since the pH partitioning into brain and skeletal muscle seems to be similar [24]. A more accurate method to determine the unbound concentration of basic compounds in brain is the determination of Vu,brain with the brain slice method [6,7,8]. Due to the limited throughput of this method, however, it is not suitable for large-scale compound screening. Moreover, most of our compounds with CNS targets are neutral or weakly basic. For those compounds, the effect of pH partitioning on tissue distribution is considered minor. Indeed, we measured the Vu,brain of a small set of our compounds and could confirm the minor effect of pH partitioning on the Kp,uu,brain calculation using the brain homogenate method (data not shown). For the brain homogenate method three separate experiments are necessary: one in vivo tissue distribution study and two in vitro studies to determine fu,plasma and fu,brain. For Kp,br/mu determination, one single in vivo tissue distribution study is sufficient. In addition to the lower experimental effort needed, Kp,br/mu determination is considered less prone to experimental variability than the brain homogenate method: Since experimental variability is intrinsic in all data, the more data points are used in a calculation, the stronger the amplification of the variability. Especially for highly bound compounds, the unbound fraction measurement in the screening assays is often hampered by the limit of quantification in the analytical assay, despite the use of LC-MS/MS. In those cases the Kp,uu,brain calculation using the brain homogenate method can become unreliable. Here, Kp,br/mu measurement provides a more reliable estimation of in vivo efflux at BBB as it does not need those very high sensitivity of the analytical methods. As discussed earlier [9,11], CSF is a less reliable surrogate for Cu,brain compared to other methods when the compounds are substrates of efflux transporters. The poorer correlation between Kp,uu,CSF and Kp,br/mu compared to Kp,uu,brain and Kp,br/mu in our experiments (Figure 2) confirm this.
A few compounds tested are reference compounds with published brain partitioning data. As shown in Table 4, Kp,uu,brain values of the P-gp substrate quinidine and the non-efflux compound carbamazapine reported by Kodaira et al. fit well to our Kp,br/mu values [11]. For the BCRP substrate dantrolene, however, there is a strong discrepancy between the value reported by Kodaira et al. and the Kp,br/mu in this study. Interestingly, our Kp,uu,brain value determined using the brain homogenate method is only 2-fold higher than that reported by Kodaira et al., suggesting that the discrepancy might not result from lab-to-lab variability, but rather from the difference in the methods. Moreover, brain distribution studies with dantrolene in Bcrp knockout rats demonstrated that dantrolene is rather a low efflux substrate with a Kp,uu,brain of 0.27 [22], very close to our Kp,br/mu value. Since Kp,uu,brain calculation using brain slice method or brain homogenate method includes an in vitro fu,brain determination, whereas distribution studies using knockout animals and the Kp,br/mu method include only in vivo measurements, the discrepancy might represent a underestimation of fu,brain by the in vitro measurements. Consistent to this consideration, we observed a 2-fold bias of Kp,br/mu towards higher values compared to Kp,uu,brain values (Figure 2A). Underestimation of Kp,uu,brain might result from the underestimation of fu,brain by the in vitro method.
Bidirectional permeability measurement using transfected MDCK cells is a well-accepted in vitro screening assay in the pharmaceutical industry to address the blood–brain barrier efflux [12,13,21]. We describe in this work the calibration of our in-house transfected cell lines with the in vivo Kp,br/mu data. The IVIVC is in general very good with regard to P-gp mediated efflux, although the substrate concentration in the permeability assay has to be reduced for certain compound classes. Our standard substrate concentration of 10 µM was a balance between assay efficiency and relevance of the results. The unbound plasma concentration of a test compound in a pharmacokinetic (PK) or a pharmacodynamics (PD) study is in most cases lower than 10 µM, therefore a lower substrate concentration in the in vitro assay would be more appropriate. However, especially for compounds with lower permeability or those with bad ionization behavior, sensitivity issues of the LC-MS/MS methods prevent investigations at lower substrate concentration. A retrospective analysis showed that for ~20% of our research compounds the limit of quantification would be insufficient for a substrate concentration of 1 µM (data not shown). Using such a concentration as standard substrate concentration would lead to too many repeats of the experiments at higher concentrations. Our screening strategy was thus to get an IVIVC using standard substrate concentration of 10 µM at an early stage of a research project. In case of insufficient correlation, the substrate concentration can be reduced to 1 µM accompanied by investment in improving the analytical methods for these specific compounds/compound classes. Otherwise, IVIVC needs to be spot-checked regularly.
For some of compounds, insufficient IVIVC with MDCK-MDR1 cells was not resolved by applying a lower substrate concentration, but rather caused by the involvement of other transporters at the BBB. The MDCK-BCRP assay was a valuable tool to identify such compounds. Due to the very high expression level of recombinant BCRP in the transfected cells, a correction factor has to be applied for translation of the in vitro efflux to in vivo efflux. Using the reference BCRP substrate dantrolene, we determined a correction factor of about 6. A similar approach was already described by Liu et al. [13]. Since some compounds are substrates of both P-gp and BCRP, estimation of in vivo efflux needs to combine data from both in vitro assays. Although a synergism between P-gp and BCRP at the BBB was hypothesized [25], the total efflux of both transporters is considered rather additive [26]. Based on these considerations, we developed Equation (17) to calculate a total in vitro efflux using data from both in vitro assays. The validity of this equation was confirmed by the regression analysis of data from a set of 133 compounds (Table 3). As the expression of recombinant transporters differs from laboratory to laboratory, our equation is essentially laboratory-specific and needs an individual calibration for the respective transfected cell lines in the different laboratories. It is important to note that all in vitro data were obtained with cells expressing recombinant human transporters and the in vivo data were from rats. The reported similar activities of rodent and human P-gp in vitro is consistent with the good IVIVC we observed here [12]. Quantitative proteomics indicates a three to four-fold higher P-gp protein concentration in the BBB of rat than in human BBB, while BCRP protein concentrations are comparable in rats and humans [27,28]. Consistent with these data, positron emission tomography studies with [11C]verapamil indicated a roughly three-fold higher BBB efflux of Verapamil in rat than in human [29]. However, Braun et al. demonstrated in dogs that up to 5-fold expression differences of P-gp as well as BCRP between cerebrum, cerebellum, and brain stem of dogs did not affect the Kp,brain of quinidine, apafant, dantrolene, and daidzeine, two P-gp and two BCRP substrates in these brain regions of the same dogs [9]. Thus it is currently unclear whether differences in transporter expression really affect the drug concentrations in brain. Due to the proposed, at maximum three fold difference between rats and humans, it is thus reasonable to assume that the efflux measured in rats is close to that in humans. The good correlation between in vivo data in rat and data from our in vitro assays therefore qualifies these assays for compound screening and selection of development candidates.
The rat is our primary species for pharmacokinetic optimization and thus also used in screening for optimization of BBB penetration since the available plasma pharmacokinetic profiles allow to select appropriate doses and time points for the brain distribution experiments. Since the mouse is often used for pharmacology studies there is also an interest in assessing the BBB efflux in this species. For a set of 135 compounds we investigated the correlation between in vitro efflux derived from MDCK-MDR1 cells with the mouse Kp,br/mu. We found, as for the rat, there was a good correlation, as depicted in Supplement Figure S2 (data in Table S7). Thus, the method is in principle also working in mice, which can be rationalized by the comparable expression of P-gp and BCRP in the BBB of rat and mouse (BCRP mouse/rat: 4.41 ± 0.69 fmol/µg protein/4.95 ± 0.32 fmol/µg protein; P-gp mouse/rat: 14.1 ± 2.1 fmol/µg protein/19.1 ± 1.0 fmol/µg protein) [27,28].
Our CNS screening strategies have changed over the last decade(s), driven by better understanding of the BBB as well as new assays being available for screening and in depth investigations. While considering CSF as major determinant of unbound brain concentrations in the past, we moved to determination of Kp,uu,br and now Kp,br/mu as efficient in vivo approach. Even more influence on our screening cascades came from the availability of the efflux transporter expressing MDCK cells. The improved predictivity of the in vitro assays generated the necessary trust in this data, thus ultimately reduced the number of compounds tested in vivo and sped up the decision process. Scheme 1 depicts the CNS-specific ADME (absorption, distribution, metabolism, excretion) assays of a generic screening cascade applied at Boehringer Ingelheim. It applies to compounds with a reasonable potency, selectivity, and metabolic stability. In the CNS screening part of the cascade, in vitro efflux and fu,plasma are measured in tier one. Usually, the MDCK-MDR1 assay is used as first line screening assay. As discussed above, spot-checking of the IVIVC by pharmacokinetic (PK) studies with the measurement of Kp,br/mu is performed in order to determine the optimal substrate concentration in the MDCK-MDR1 assay or the necessity of including the MDCK-BCRP assay. During regular compound screening, Equation (17) is used to calculate the total in vitro efflux.
There are two ways to rank the compounds with regard to efflux. If high systemic exposure is undesired, e.g., due to target-related side effects in peripheral tissues, a general cutoff can be used to filter out high-efflux compounds. Taking all experimental variabilities into account, a Kp,br/mu greater than 0.3 indicates a rather low or negligible efflux at BBB. A lower cutoff is conceivable depending on the nature of the off-targets and the associated side effects. If the question is whether or not a compound could achieve efficacious exposure in brain with a realistic plasma exposure at all, in vitro potency, in vitro efflux, and fu,plasma can be used in combination to estimate the total plasma exposure (Cplasma,total) to be achieved in a pharmacodynamic (PD) study based on a simple equation:
Cplasma,total = (potencyin vitro × effluxin vitro)/(fu,plasma)
Together with the in vitro data of metabolic stability, compounds can be rank-ordered for further profiling. Both approaches helped to reduce the number of compounds to be tested in PK and/or PD studies. In 2007, when the MDCK assay had not yet been established, brain exposure of nearly 500 compounds was investigated in rats through routine CSF sampling. In 2018, after implementation of our strategy, around 2000 Boehringer Ingelheim compounds were tested in at least one of the two in vitro efflux assays. Only about 100 compounds were further tested in a PK study with the measurement of Kp,br/mu. For development candidates, we perform in depth CNS profiling to further improve understanding of the compound(s). This includes determining Kp,uu,brain with the brain homogenate method and investigation of the time-dependence of brain exposure. Microdialysis and measurement of Vu,brain in brain slices (both considered to generate the most accurate data for estimation of unbound brain concentration) and in vivo studies with efflux transporter knock out animals are considered when we observe discrepancies in the available BBB data or an exact (less than 2-fold error) prediction of the human free brain concentrations is essential for the project. In case CSF sampling is considered for clinical development, we investigate this also in animals to provide the necessary translational data. Besides the CNS profiling, a battery of candidate profiling studies are done, such as in vitro drug-drug interaction (DDI) assessment and in vitro as well as in vivo metabolite identification (MetID) studies, via non-rodent PK studies enabling human PK prediction to perform selection and general pharmacology investigations.

5. Conclusions

In summary, we describe here the establishment and validation of a new method to use the partition coefficient Kp,br/mu as a descriptor of in vivo efflux at the BBB. Kp,br/mu in rats correlates well with the more broadly used Kp,uu,brain using the brain homogenate method and the in vitro efflux measured in our in-house transfected MDCK cell lines. The combination of both in vitro and in vivo tools ensures a fast and efficient compound screening and optimization procedure during drug discovery. Despite the good comparability between Kp,br/mu and Kp,uu,brain, using the brain homogenate method we are aware of the fact that Kp,br/mu is only an approximation of the real in vivo efflux at the BBB. Nevertheless, it is a helpful parameter for speeding up compound screening and for shortening optimization cycles. For compounds approaching candidate selection, we measure fu,brain or, if necessary, Vu,brain, and use Kp,uu,brain for the estimation of in vivo efflux.

Supplementary Materials

The following are available online at https://www.mdpi.com/1999-4923/11/11/595/s1. Table S1: Raw data Figure 1 (Correlation of fu,brain and fu,muscle.); Table S2: Raw data Figure 2 (Correlation of Kp,br/mu with (a) Kp,uu,brain(hom) and (b) Kp,uu,CSF.); Table S3: Raw data Figure 3 (Correlation of Kp,br/mu values obtained following intravenous and oral dosing for a set of 29 compounds.); Table S4: Raw data Figure 4 (In vitro–in vivo correlation of MDR1 P-gp efflux and Kp,br/mu.); Table S5: Raw data Figure 5 (Correlation of Kp,br/mu with in vitro efflux measured in MDCK-MDR1 cells for compounds of three research projects (n = 48)).; Table S6: Raw data Figure 6 (Correlation of Kp,br/mu with in vitro efflux measured in MDCK-MDR1 and MDCK-BCRP cells for compounds from two research projects (n = 39)). Table S7: Raw data Figure S2 (In vitro–in vivo correlation of MDCK P-gp efflux and mouse Kp,br/mu (n = 135)); Figure S1: Reproducibility of Kp,br/mu; Figure S2: In vitro–in vivo correlation of MDR1 P-gp efflux and mouse Kp,br/mu.

Author Contributions

Conceptualization, R.L. and Y.C.; methodology, R.L., Y.C., K.K., and A.S.; formal analysis, H.R. and A.H.; investigation, R.L., Y.C., K.K., and A.S.; resources, A.S.; data curation, H.R.; writing—original draft preparation, R.L., Y.C., and A.S.; writing—review and editing, R.L., Y.C., and A.S.; visualization, A.H.; supervision, A.S.

Funding

This research received no external funding.

Acknowledgments

We thank Clemens Braun, Holger Fuchs, Michel Garneau, and Wolfgang Rist for the valuable contributions to the discussion of the CNS screening strategies, the scientific and technical staff of the Drug Discovery Sciences DMPK groups for the excellent performance of the in vitro and in vivo experiments as well as bioanalytics, and Christopher Tautermann for the computational chemistry consulting.

Conflicts of Interest

The authors declare no conflict of interest. Y.C., R.L., H.R., K.K. and A.S. are employees of Boehringer Ingelheim Pharma GmbH & Co. KG. A.H. is PhD student at the University of Hamburg. Here PhD work is sponsored by Boehringer Ingelheim Pharma GmbH & Co. KG. The company had no role in the design, execution, interpretation, or writing of the study.

References

  1. Brightman, M.W. Ultrastructure of Brain Endothelium, in Physiology and Pharmacology of the Blood-Brain Barrier. In Handbook of Experimental Pharmacology; Bradbury, M.W.B., Ed.; Springer: Berlin, Germany, 1992; pp. 1–22. [Google Scholar]
  2. Enokizono, J.; Kusuhara, H.; Ose, A.; Schinkel, A.H.; Sugiyama, Y. Quantitative investigation of the role of breast cancer resistance protein (Bcrp/Abcg2) in limiting brain and testis penetration of xenobiotic compounds. Drug Metab. Dispos. 2008, 36, 995–1002. [Google Scholar] [CrossRef] [PubMed]
  3. Schinkel, A.H. P-Glycoprotein, a gatekeeper in the blood-brain barrier. Adv. Drug Deliv. Rev. 1999, 36, 179–194. [Google Scholar] [CrossRef]
  4. Gupta, A.; Chatelain, P.; Massingham, R.; Jonsson, E.N.; Hammarlund-Udenaes, M. Brain distribution of cetirizine enantiomers: Comparison of three different tissue-to-plasma partition coefficients: K(p), K(p,u), and K(p,uu). Drug Metab. Dispos. 2006, 34, 318–323. [Google Scholar] [CrossRef] [PubMed]
  5. Hammarlund-Udenaes, M.; Fridén, M.; Syvänen, S.; Gupta, A. On the rate and extent of drug delivery to the brain. Pharm. Res. 2008, 25, 1737–1750. [Google Scholar] [CrossRef] [PubMed]
  6. Friden, M.; Bergström, F.; Wan, H.; Rehngren, M.; Ahlin, G.; Hammarlund-Udenaes, M.; Bredberg, U. Measurement of unbound drug exposure in brain: Modeling of pH partitioning explains diverging results between the brain slice and brain homogenate methods. Drug Metab. Dispos. 2011, 39, 353–362. [Google Scholar] [CrossRef] [PubMed]
  7. Friden, M.; Ducrozet, F.; Middleton, B.; Antonsson, M.; Bredberg, U.; Van Peer, A.; Hammarlund-Udenaes, M.; Morrison, D.; Monshouwer, M.; Heald, D. Development of a high-throughput brain slice method for studying drug distribution in the central nervous system. Drug Metab. Dispos. 2009, 37, 1226–1233. [Google Scholar] [CrossRef] [PubMed]
  8. Loryan, I.; Sinha, V.; Mackie, C.; Van Peer, A.; Drinkenburg, W.; Vermeulen, A. Mechanistic understanding of brain drug disposition to optimize the selection of potential neurotherapeutics in drug discovery. Pharm. Res. 2014, 31, 2203–2219. [Google Scholar] [CrossRef] [PubMed]
  9. Braun, C.; Sakamoto, A.; Fuchs, H.; Ishiguro, N.; Suzuki, S.; Cui, Y.; Klinder, K.; Watanabe, M.; Terasaki, T.; Sauer, A. Quantification of Transporter and Receptor Proteins in Dog Brain Capillaries and Choroid Plexus: Relevance for the Distribution in Brain and CSF of Selected BCRP and P-gp Substrates. Mol. Pharm. 2017, 14, 3436–3447. [Google Scholar] [CrossRef] [PubMed]
  10. de Lange, E.C. Utility of CSF in translational neuroscience. J. Pharmacokinet. Pharmacodyn. 2013, 40, 315–326. [Google Scholar] [CrossRef] [PubMed]
  11. Kodaira, H.; Kusuhara, H.; Fujita, T.; Ushiki, J.; Fuse, E.; Sugiyama, Y. Quantitative Evaluation of the Impact of Active Efflux by P-Glycoprotein and Breast Cancer Resistance Protein at the Blood-Brain Barrier on the Predictability of the Unbound Concentrations of Drugs in the Brain Using Cerebrospinal Fluid Concentration as a Surrogate. J. Pharmacol. Exp. Ther. 2011, 339, 935–944. [Google Scholar] [PubMed]
  12. Feng, B.; Mills, J.B.; Davidson, R.E.; Mireles, R.J.; Janiszewski, J.S.; Troutman, M.D.; de Morais, S.M. In vitro P-glycoprotein assays to predict the in vivo interactions of P-glycoprotein with drugs in the central nervous system. Drug Metab. Dispos. 2008, 36, 268–275. [Google Scholar] [CrossRef] [PubMed]
  13. Liu, H.; Huang, L.; Li, Y.; Fu, T.; Sun, X.; Zhang, Y.Y.; Gao, R.; Chen, Q.; Zhang, W.; Sahi, J.; et al. Correlation between Membrane Protein Expression Levels and Transcellular Transport Activity for Breast Cancer Resistance Protein. Drug Metab. Dispos. 2017, 45, 449–456. [Google Scholar] [CrossRef] [PubMed]
  14. Sieger, P.; Cui, Y.; Scheuerer, S. pH-dependent solubility and permeability profiles: A useful tool for prediction of oral bioavailability. Eur. J. Pharm. Sci. 2017, 105, 82–90. [Google Scholar] [CrossRef] [PubMed]
  15. Just, S.; Chenard, B.L.; Ceci, A.; Strassmaier, T.; Chong, J.A.; Blair, N.T.; Gallaschun, R.J.; del Camino, D.; Cantin, S.; D’Amours, M.; et al. Treatment with HC-070, a potent inhibitor of TRPC4 and TRPC5, leads to anxiolytic and antidepressant effects in mice. PLoS ONE 2018, 13, e0191225. [Google Scholar] [CrossRef] [PubMed]
  16. Team, R.C. R: A Language and Environment for Statistical Computing; R Foundation for Statistical Computing: Vienna, Austria, 2016. [Google Scholar]
  17. Spilker, M.E. An Evaluation of Extended vs Weighted Least Squares for Parameter Estimation in Physiological Modeling. J. Biomed. Inform. 2001, 34, 348–364. [Google Scholar] [CrossRef] [PubMed]
  18. Akaike, H. A New Look at the Statistical Model Identification. In Selected Papers of Hirotugu Akaike; Parzen, E., Tanabe, K., Kitagawa, G., Eds.; Springer: New York, NY, USA, 1998; pp. 215–222. [Google Scholar]
  19. Rodgers, T.; Leahy, D.; Rowland, M. Physiologically based pharmacokinetic modeling 1: Predicting the tissue distribution of moderate-to-strong bases. J. Pharm. Sci. 2005, 94, 1259–1276. [Google Scholar] [CrossRef] [PubMed]
  20. Rodgers, T.; Rowland, M. Physiologically based pharmacokinetic modelling 2: Predicting the tissue distribution of acids, very weak bases, neutrals and zwitterions. J. Pharm. Sci. 2006, 95, 1238–1257. [Google Scholar] [CrossRef] [PubMed]
  21. Feng, B.; West, M.; Patel, N.C.; Wager, T.; Hou, X.; Johnson, J.; Tremaine, L.; Liras, J. Validation of Human MDR1-MDCK and BCRP-MDCK Cell Lines to Improve the Prediction of Brain Penetration. J. Pharm. Sci. 2019, 108, 2476–2483. [Google Scholar] [CrossRef] [PubMed]
  22. Fuchs, H.; Kishimoto, W.; Gansser, D.; Tanswell, P.; Ishiguro, N. Brain penetration of WEB 2086 (Apafant) and dantrolene in Mdr1a (P-glycoprotein) and Bcrp knockout rats. Drug Metab. Dispos. 2014, 42, 1761–1765. [Google Scholar] [CrossRef] [PubMed]
  23. Knauer, M.J.; Urquhart, B.L.; Schwabedissen, H.E.M.Z.; Schwarz, U.I.; Lemke, C.J.; Leake, B.F.; Kim, R.B.; Tirona, R.G. Human skeletal muscle drug transporters determine local exposure and toxicity of statins. Circ. Res. 2010, 106, 297–306. [Google Scholar] [CrossRef] [PubMed]
  24. Daniel, W.A.; Bickel, M.H.; Honegger, U.E. The contribution of lysosomal trapping in the uptake of desipramine and chloroquine by different tissues. Pharmacol. Toxicol. 1995, 77, 402–406. [Google Scholar] [CrossRef] [PubMed]
  25. Zhou, L.; Schmidt, K.; Nelson, F.R.; Zelesky, V.; Troutman, M.D.; Feng, B. The effect of breast cancer resistance protein and P-glycoprotein on the brain penetration of flavopiridol, imatinib mesylate (Gleevec), prazosin, and 2-methoxy-3-(4-(2-(5-methyl-2-phenyloxazol-4-yl)ethoxy)phenyl)propanoic acid (PF-407288) in mice. Drug Metab. Dispos. 2009, 37, 946–955. [Google Scholar] [CrossRef] [PubMed]
  26. Kusuhara, H.; Sugiyama, Y. In vitro-in vivo Extrapolation of Transporter-mediated Clearance in the Liver and Kidney. Drug Metab. Pharmacokinet. 2009, 24, 37–52. [Google Scholar] [CrossRef] [PubMed]
  27. Hoshi, Y.; Uchida, Y.; Tachikawa, M.; Inoue, T.; Ohtsuki, S.; Terasaki, T. Quantitative atlas of blood-brain barrier transporters, receptors, and tight junction proteins in rats and common marmoset. J. Pharm. Sci. 2013, 102, 3343–3355. [Google Scholar] [CrossRef] [PubMed]
  28. Uchida, Y.; Ohtsuki, S.; Katsukura, Y.; Ikeda, C.; Suzuki, T.; Kamiie, J.; Terasaki, T. Quantitative targeted absolute proteomics of human blood-brain barrier transporters and receptors. J. Neurochem. 2011, 117, 333–345. [Google Scholar] [CrossRef] [PubMed]
  29. Mullauer, J.; Kuntner, C.; Bauer, M.; Bankstahl, J.P.; Müller, M.; Voskuyl, R.A.; Langer, O.; Syvänen, S. Pharmacokinetic modeling of P-glycoprotein function at the rat and human blood-brain barriers studied with (R)-[11C]verapamil positron emission tomography. EJNMMI Res. 2012, 2, 58. [Google Scholar] [CrossRef] [PubMed] [Green Version]
Figure 1. Correlation of fraction unbound in brain homogenate (fu,brain) and muscle homogenate (fu,muscle). Unbound brain and muscle concentrations were determined by means of equilibrium dialysis of compound spiked into tissue homogenate. Experiments were performed in triplicate. The compounds derive from 10 different research projects with a molecular weight (MW) range from 305 to 563, a clogP range from 0.7 to 5.2, a total polar surface area (TPSA) from 46 to 119, an H-acceptor range from 2 to 8, and a FSP3 range from 0.19 to 0.62. Data are listed in Supplement Table S1.
Pharmaceutics 11 00595 g001
Figure 2. Correlation of the partition coefficient of a drug between brain and skeletal muscle (Kp,br/mu) with (a) partition coefficient of unbound drug (Kp,uu) calculation using the brain homogenate method for fu,brain estimation (Kp,uu,brain(hom)) and (b) CCSF as a surrogate for Cu,brain (Kp,uu,CSF). Symbols represent average values (n = 2–3). The compounds derive from 10 different research projects with a MW range from 194 to 589, a clogP range from 1.0 to 5.2, a TPSA from 25 to 122, a number of H-acceptor range from 1 to 7 and a FSP3 range from 0.07 to 0.62. Data are listed in Supplement Table S2.
Pharmaceutics 11 00595 g002
Figure 3. Correlation of Kp,br/mu values obtained following intravenous and oral dosing for a set of 29 compounds. Symbols represent average values (n = 2–3). Data are listed in Supplement Table S3.
Pharmaceutics 11 00595 g003
Figure 4. In vitro–in vivo correlation of efflux in multidrug resistance 1 transfected Madin-Darby canine kidney (MDCK-MDR1) cells and Kp,br/mu. Kp,br/mu is depicted as function of efflux derived from in vitro transporter experiments at 10 µM compound concentration in MDCK-MDR1 cells (MDCKPgp_10_Efflux). Regression analysis was performed with all data depicted in this plot. Solid line represents regression, blue area indicates the 2-fold error range, dashed lines are 3-fold error lines. Compounds from subgroup 1 (red circles) and subgroup 2 are highlighted because they were tested in additional in vitro transporter assays (see Figure 5; Figure 6 and corresponding text). Symbols represent average values (n = 2–3 for Kp,br/mu and n = 2 for in vitro efflux). Data are listed in Supplement Table S4.
Pharmaceutics 11 00595 g004
Figure 5. Correlation of Kp,br/mu with in vitro efflux measured in MDCK-MDR1 cells for compounds of three research projects (N = 48). The in vitro assay was performed at compound concentration of 10 µM (A) or 1 µM (B). Form of the symbols indicates individual research projects. Solid line represents regression; blue area is the 2-fold error range, dashed lines are 3-fold error lines. Symbols represent average values (n = 2–3 for Kp,br/mu and n = 2 for in vitro efflux). Data are listed in Supplement Table S5.
Pharmaceutics 11 00595 g005
Figure 6. Correlation of Kp,br/mu with in vitro efflux measured in MDCK-MDR1 and breast cancer resistance protein transfected Madin-Darby canine kidney (MDCK-BCRP) cells for compounds from two research projects (n = 39). In vitro efflux determined at 10 µM compound concentration in (a) MDCK-MDR1 cells or (b) MDCK-BCRP cells was correlated with Kp,br/mu. (c) Correlation of Kp,br/mu with in vitro efflux calculated using equation (17). (d) Regression line statistics. Solid line represents regression; blue area is the 2-fold error range, dashed lines indicate 3-fold error. Symbols represent average values (n = 2–3 for Kp,br/mu and n = 2 for in vitro efflux). Data are listed in Supplement Table S6.
Pharmaceutics 11 00595 g006
Scheme 1. Screening cascade with focus on the central nervous system (CNS) specific ADME (absorption, distribution, metabolism, excretion) assays. “…” = placeholder for additional profiling assays. CSF = cerebrospinal fluid; DDI = drug-drug interaction; DMPK = drug metabolism and pharmacokinetics; IVIVC = in vitro–in vivo correlation; MetID = metabolite identification; PK = pharmacokinetics; PPB = plasma protein binding; Time-dep = time dependence;
Pharmaceutics 11 00595 sch001
Table 1. Distribution of binned (Bin) molecular descriptors of the investigated compounds.
BinMW1H-AC2ClogP3TPSA4FSP35
124928
2419451052
333689529205
411516615847187
515822623088137
617416911910364
7130221715917
84623946
912----88--
102----39--
11------13--
12------4--
1 Molecular weight (MW): from ≤200 (Bin 1) to >600 (Bin 10) with increments of 50. 2 Number of H acceptors (H-AC): from 1 (Bin 1) to 8 (Bin 8) with increments of 1. 3 Calculated log P (clogP): from ≤0 (Bin 1) to >6 (Bin 8) with increments of 1. 4 Total polar surface area (TPSA): from ≤30 (Bin 1) to >130 (Bin 12) with increments of 10. 5 Aliphatic indicator (FSP3): from ≤0.1 (Bin 1) to >0.7 (Bin 8) with increments of 0.1. --: empty bin.
Table 2. Time dependency of Kp,br/mu values for five compounds (Cpd). Tissues were collected at the indicated time points after oral administration of the compounds. Data are mean ± SD, n = 3.
Time (h)Cpd 5Cpd 168Cpd 270Cpd 603Cpd 609
0.50.089 ± 0.011 0.339 ± 0.0322.13 ± 0.07
1 0.039 ± 0.002
20.144 ± 0.0870.666 ± 0.153 2.37 ± 1.52
4 0.348 ± 0.082
6 0.089 ± 0.005
8 0.664 ± 0.086
9 0.080 ± 0.013
24 0.544 ± 0.072
Table 3. Regression analysis for Kp,br/mu and efflux models. For the fixed model, the correction factor for the term EffluxPgp − 1 (ΘPGP) and the correction factor for the term EffluxBCRP − 1 (ΘBCRP) in Equation (18) were set to 1 and 6, respectively. For the P-gp model, ΘPGP was estimated and for the BCRP model ΘBCRP was estimated. For the full model, correction factors for both terms were estimated. AIC = Akaike information criterion, AFE = average fold error, Bias = geometric mean bias, RSE = relative standard error of the correction factor estimate.
ParameterFixed ModelP-gp ModelBCRP ModelFull Model
AIC606666605600
ΘBCRP6 (fixed)1 (fixed)4.283.43
ΘPGP1 (fixed)2.181 (fixed)1.24
AFE2.062.462.062.02
Bias0.8500.9480.8790.876
Within 2-fold71.4%53.4%67.7%69.9%
Within 3-fold89.5%78.9%88.7%89.5%
Table 4. Comparison of brain partitioning data in rats from this study with literature data.
DrugKp,uu,brain*
(Literature)
Kp,uu,brain(hom)**
(This publication)
Kp,br/mu
(This publication)
Carbamazapine0.771 1.44
Dantrolene0.02970.0610.19
Quinidine0.0260.02760.056
*: [11], Partition coefficient of unbound drug between brain and plasma (Kp,uu,brain) determined with brain slice method.; **: Kp,uu,brain determined with brain homogenate method.

