Article

Temperature Effects on the Cryphonectria hypovirus 1 Accumulation and Recovery within Its Fungal Host, the Chestnut Blight Pathogen Cryphonectria parasitica

1
Forest Research, Plant Pathology Department, Alice Holt Research Station, Surrey GU104LH, UK
2
Forest Research, Tree Health Diagnostics and Advisory Service (THDAS), Alice Holt, Surrey GU104LH, UK
3
Swiss Federal Institute for Forest, Snow and Landscape Research WSL, Zuercherstrasse 111, 8903 Birmensdorf, Switzerland
*
Author to whom correspondence should be addressed.
Viruses 2023, 15(6), 1260; https://doi.org/10.3390/v15061260
Submission received: 9 May 2023 / Revised: 24 May 2023 / Accepted: 25 May 2023 / Published: 27 May 2023
(This article belongs to the Collection Mycoviruses)

Abstract

:
Biological control of Cryphonectria parasitica fungus, the causal agent of chestnut blight, by virus infection (hypovirulence) is an effective control strategy against chestnut blight in Europe and some parts of North America. The most studied mycovirus is the Cryphonectria hypovirus 1 (CHV1) type species of the Hypoviridae family. In this study, the CHV1 virus was studied within some highly infected British isolates of Cryphonectria parasitica, gained in the past through co-culture transmissions. The effects of six temperatures (5–30 °C, in 5 °C steps) on six infected isolates (three with viral strain E-5, and other three with viral strain L-18) and their respective negative non-infected controls, three isogenic virulent fungal isolates, were examined. Experiments were performed with the nine isolate types with three replicates on potato dextrose agar (PDA) with cellophane sheets per isolate and temperature. A recently developed rapid, specific, quantitative reverse transcription PCR (RT-qPCR) screening method was used. This enabled quantifying the concentration (nanograms per microliter or copy numbers) of the virus within each isolate repetition. The presence of the virus had a significant negative effect between 20 and 25 °C on the C. parasitica growth rate, which was anyway highly influenced by and positively correlated with the temperature. The temperature clearly determined the virus accumulation and its recovery from cold or heat, and the virus optimum temperature was estimated at 15–25 °C.

1. Introduction

Viruses occur commonly in all major groups of true fungi [1,2] and some Oomycetes [3,4]. Fungal viruses are classified into nine double-stranded RNA families (Chrysoviridae, Spinoreoviridae, Partitiviridae, Totiviridae, Polymycoviridae, Quadriviridae, Megabirnaviridae, Amalgaviridae, and Curvulaviridae) and the genus Botybirnavirus, twelve single-stranded RNA families (Endornaviridae, Barnaviridae, Hypoviridae, Narnaviridae, Alphaflexiviridae, Gammaflexiviridae, Hadakaviridae, Botourmiaviridae, Mitoviridae, Mymonaviridae, Yadokariviridae, and Phenuiviridae), two reverse-transcribing virus families Metaviridae and Pseudoviridae, and one ssDNA family Genomoviridae [5]. Some act as antagonists of their fungal hosts, decreasing their growth, pigmentation, conidiation and/or virulence. Examples include the fungal genera Cryphonectria [6], Diaporthe [7], Fusarium [8], Rosellinia [9], etc. Some other fungal viruses develop neutral effects on their host, e.g., Hymenoscyphus fraxineus mitovirus 1 [10], or have a positive association with their host such as Nectria radicicola virus L1 [11].
Cryphonectria parasitica, a fungus with an Asiatic origin (native in China, Japan, and Korea) [12], causes chestnut tree blight in North America [13], Europe [14], and England [15] in geographical areas where the pathogen has been introduced multiple times, mainly by trade in chestnut plants and reforestation.
England was considered free of chestnut blight until 2011, when C. parasitica infections were discovered on 90 young saplings of sweet chestnut planted in a nursery farm in Warwickshire. They originated from the same nursery in Europe; the saplings were imported and planted in 2007 and some trees died and were replaced in 2010. This stimulated surveys between 2011 and 2012 where the fungus was identified on recently planted saplings at a further eight orchard sites located in Devon, Herefordshire, Kent, Norfolk, Somerset, and Sussex. All affected trees were eliminated. In 2013, United Kingdom introduced tighter import controls, meaning that the movement of sweet chestnut trees in, around and out of England needed to be accompanied by official documentation confirming that they were from an area free of the disease. In August 2016, chestnut blight was confirmed on a recently planted tree in Kent that was removed. Until 2016, all findings of the disease in the UK were exclusively in orchards or recently planted individual young trees, and therefore their eradication was relatively easy. However, in December 2016, C. parasitica was isolated from four mature trees growing in a car park in Devon. Additional Forestry Commission of England and Animal and Plant Health Agency surveys were initiated, and C. parasitica was subsequently diagnosed in a woodland about 1 km away from the last infected site. A trace-forward and trace-back exercise was initiated, which revealed multiple positive findings in England between 2017 and 2020.
Eradication efforts, cutting and burning the infected trees/branches, are especially difficult in some areas and have mostly failed [16]. Therefore, interest in biocontrol is growing. The fungus can be infected, for example, by a mycovirus called Cryphonectria hypovirus 1 (CHV1), which is the prototype of the family Hypoviridae [17]. Hypoviruses are RNA viruses located in the cytoplasm membrane vesicles of their fungal hosts. They are without a coat protein, and their replicative form is dsRNA [18]. CHV1 acts as a biocontrol agent of chestnut blight in Europe and some parts of North America (Virginia, Wisconsin, Maryland), where it has been released, because it induces reduced growth, pigmentation, sporulation, and virulence on its fungal host [16]. This virus is vertically transmitted (to the progeny) through fungal conidia–with rates between 77 and 100% depending on fungal and viral types [19]. It can also be horizontally transmitted through anastomosis between mycelia of two isolates of the same vegetative compatibility group (VCG) at around 100% transmission–or between different VCGs at 0–100% transmission [20,21]. In England, CHV1 was detected for the first time in November 2017 [15]. It has been recorded in low frequency and concentration.
There is a low prevalence and load thus of CHV1 in the Forest Research collection of English isolates. The low temperatures in England, with CHV1’s more common occurrence at higher loads in the temperate areas of continental Europe, led to a hypothesis that the concentration of this mycovirus might be influenced by climate, particularly temperature.
Recently highly CHV1-infected isolates of VCG EU-10 (dominant in London and ranging between 234.4 and 407.1 ng/µL of viral amplicon after RT-PCR) and VCG EU-9 (dominant in Devon and ranging between 343.0 and 612.8 ng/µL of viral amplicon after RT-PCR) were achieved by co-culture transmissions with CHV1-infected cultures from Switzerland [22]. The aims of the present study were: (i) to analyse the influence of six temperatures (5–30 °C, in 5 °C steps) on the mycovirus accumulation levels in those highly infected British isolates of C. parasitica; (ii) to assess the relationship between temperature, mycovirus accumulation, and C. parasitica growth; and (iii) to determine the capacity of the virus to recover after each temperature treatment.

2. Material and Methods

2.1. Viral and Fungal Strains

Viral and fungal strains used in the current study are shown in Table 1. Two CHV1 strains were tested: CHV1-M2273 haplotype E-5, and CHV1-M2357 haplotype L-18, previously horizontally transmitted to the British fungal isolates FTC687, WAP706, and POWP709 by coculture of virus-infected donor and recipient fungal isolates on a PDA plate (9 cm in diameter) as described previously [23].
On the other hand, three non-infected virulent British fungal isolates were used: FTC687 (isolated in 2021 from London), WAP706, and POWP709 (both isolated in 2021 from Devon) [24], belonging to the EU-10, and EU-9 VC groups respectively.

2.2. Culture Conditions

The effect of temperature on the mycelial growth was investigated by incubating the cultures in the dark in six independent MIR-554-PE growth chambers (PHCBI, Loughborough, UK) at 5, 10, 15, 20, 25, and 30 °C. Each isolate had three replicates; consequently 162 dishes were measured after one week. Two perpendicular lines were drawn on the back side of each dish of 20 mL of potato dextrose agar (PDA) medium overlaid with a cellophane sheet. A mycelial plug (5 mm in diam.) from each 7 days-old isolate was placed on the intersection of both lines on top of a squared cellophane sheet. The response variables were the two diameters measured along the lines. After the experimental week, RNA was extracted, and the virus was quantified as described below.

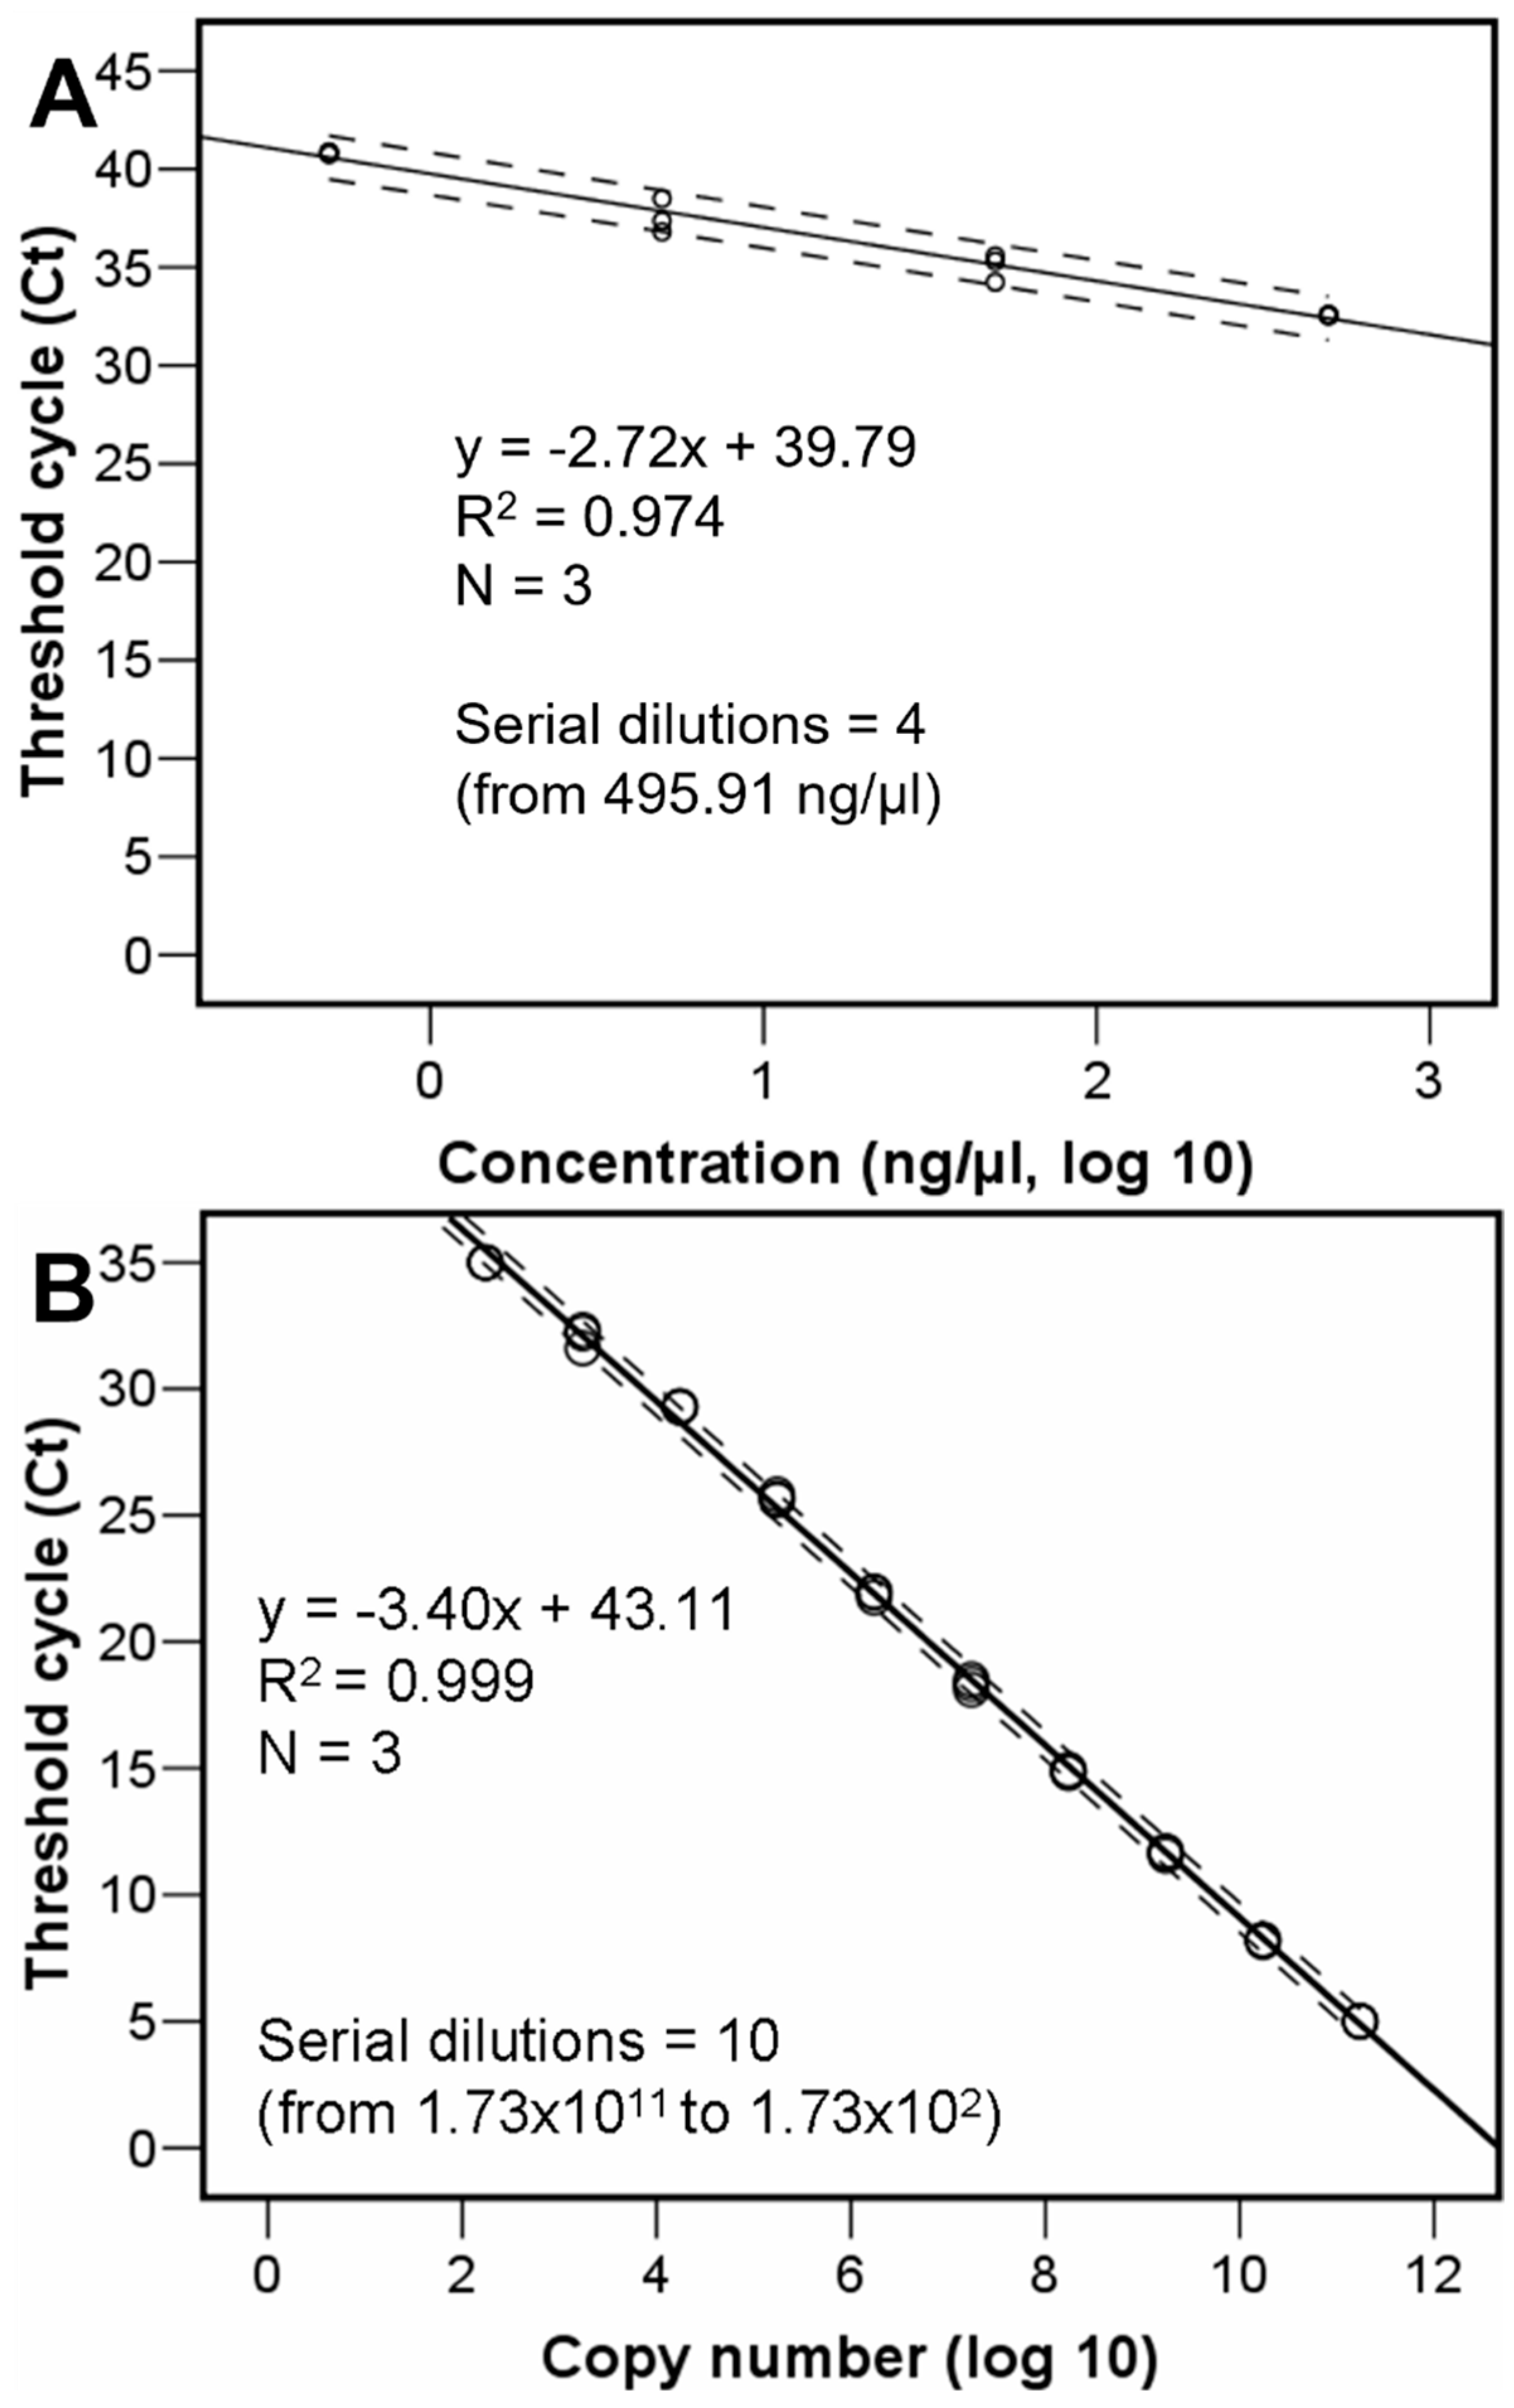
2.3. RNA Extraction and Reverse Transcription PCR

Fungi were cultivated on PDA plates covered by cellophane membranes and incubated at the different temperatures. After one week, the diameters of the cultures were traced and measured. The mycelium of each culture was removed from the cellophane and weighed. RNA was extracted with the RNeasy Plant Mini Kit (Qiagen, Manchester, UK), with an on-column simultaneous DNA digestion with the following modifications (per tube). RLT lysis buffer (450 µL) prepared with 6 ng/µL glycogen as RNA carrier (Sigma-Aldrich, Gillingham, UK) was added to the tissue. Each sample was homogenized using a QIAshredder column. Final eluates were stored at −80 °C. RNA was quantified using a Nanodrop spectrophotometer (Fisherscientific, Loughborough, UK).
RNA was then reverse transcribed and amplified through a one-step quantitative reverse transcription polymerase chain reaction (RT-qPCR), using One Step PrimeScript III RT-qPCR kit (TaKaRa Bio, Saint-Germain-en-Laye, France). Real-time PCRs were carried out on a LightCycler 480 (Roche, Welwyn, UK), targeting both CHV1 and the fungal actin mRNA. For the assay, 400 nM of each of the primers CHV1-F (5′-TGAGGAACGTCAACTTCG-3′), CHV1-R (5′-TTGTGACGACGGAAATAATC-3′), CpActinmRNAF1 (5′-CCATGGTATCATGATTGGTATG-3′), and CpActinmRNAR1 (5′-TACCGCAGAGTCAGGATA-3′) were used, and 400 nM of each of the probes HVEP1 Fluo (5′-56-FAM/TGACACGGAAGCTGAGTGTC/3BHQ1/-3′) and CpActinmRNAP1 (5′-56-JOE/TCATCACCAACATACGAGTCCTTCTG/3BHQ1/-3′).
Twenty microliters reaction volume was used, comprising per reaction 10 µL 2X One Step Primescript III RT-qPCR Mix, 0.4 µL of each primer and probe, 6.6 µL RNase free water, and 1 µL of RNA sample. Each sample was assayed in triplicate. Thermal cycling conditions were 50 °C for 30 min and 95 °C for 50 s, followed by 40 cycles of 95 °C for 25 s and 53 °C for 1 min. Fluorescent detection occurred at the end of each 53 °C step. The cycle threshold (Ct) value was calculated automatically using the LightCycler software with absolute quantification using second derivative maximum setting with 465–510 and 533–580 nm channel filters respectively for analysing the specific amplicons and the actin RNA quality control [22].
The 94 bp qPCR product was synthesised de novo and cloned into a plasmid pUC-GW-Kan (Azenta Life Sciences, Leipzig, Germany). The fragment copy number, actual number of CHV1 virus particles, was estimated using a ten point 1:10 serial dilution of the plasmid and subsequent posterior regression equation analyses (Figure 1B). For calculating the copy number in the original plasmid aliquot, the copy number was calculated using the following formula: number of copies/µL = [(6 × 10²³) × (DNA concentration, 500 ng/µL)/molecular weight of one plasmid], where Avogadro’s number is the number of copies per mole, DNA concentration is given in grams per microliter, and the molecular weight of one plasmid is in grams per mole, assuming a plasmid size of 2627 bp and a 1 bp molecular weight of 660 g/mole. The threshold cycle values permitted also calculating the viral concentration (in nanograms per microliter) after building up an equation with a four points serial dilution of known concentrations standard (Figure 1A) submitted to the same RT-qPCR.
The complete experimental protocol but without cellophane was repeated to test for potential recoveries from cold or heat. After the temperature treatments, a 5 mm diameter mycelial plug per repetition was further incubated in 1 mL malt extract broth (MEB) in 2-mL Eppendorf tubes at 25 °C for one week, before quantifying the virus concentration and copy number as above.

2.4. Statistical Analyses

Differences in virus load were analysed in two ways–using viral concentration in nanograms per microliter and by using the variable virus copy number per microliter. Multivariate general linear model ANOVA-type-III analyses were used to assess for significant differences, using Tukey’s HSD adjustments for determining statistical significance with IBM SPSS 13.0 software, and building up regression equations when appropriate.

3. Results

Virus concentration, within C. parasitica colonies along the trial with cellophane, was influenced by the original virus concentration in the inoculated plugs (Fisher variances ratio, F = 4.51, Probability, p = 0.002), and the temperature, but was independent of the haplotype of the two tested virus strains (Table 2 top analysis, Figure 2A). The maximum virus concentration was achieved at 15 to 25 °C. Viral concentration (in nanograms per microliter) marked the differences better than using virus copy number per microliter in all assays using cellophane because the copy number data was highly influenced by the much higher values at 25 °C of the viral strain L-18 (Table 2, Figure 2B). Thus, virus concentration resulted more reliable data.
The colony diameter was positively influenced by increasing temperatures, and negatively influenced due to the virus presence between 20 and 25 °C, with the virus-infected cultures slightly smaller than the non-infected ones at 20 °C and approximately half the size at 25 °C (Table 3, Figure 3). There were no significant differences between the two viral strains. Therefore, CHV1 presence did significantly impair the growth of C. parasitica isolates between the mentioned two temperatures. In general, the temperature significantly affected the fungal growth rate. At a temperature of 30 °C, C. parasitica grew the most and at 5/10 °C the least. These data (high square R values) supported building up respective regression equations relating the fungal growth diameter and the temperature to the viral negative and positive isolate repetitions (Figure 3).
If we divide the virus concentration by the extracted RNA concentration, the virus concentration was significantly dependent on temperature, resembling a negative Gauss curve (Figure 4A), as opposite to the parabola in Figure 2A. The same parameter divided by the weighed mycelial tissue was influenced by the temperature and the original virus concentration (F = 7.545, p = 0.0001) (Table 2 most bottom analysis, Figure 4B).
The capacity of the viral strain E-5 to recover in concentration and copy numbers was always greater than that of strain L-18 (Table 4, Figure 5A,B), at all the tested original temperatures except from 25 °C.

4. Discussion

Cryphonectria hypovirus 1 is known to induce hypovirulence in C. parasitica by reducing pathogenic growth and sporulation, hence the virus is used in Europe for disease control. The virus has been introduced into continental Europe on multiple occasions in association with C. parasitica from countries such as Japan, China, and Korea, which are known to be the geographical origin of the fungus. Since those introductions, both C. parasitica and CHV1 have spread widely. Originally, such introductions are most likely to have occurred through the plant trade and/or the importation of Asiatic planting stock, often intended for use in breeding resistance programs to chestnut ink disease caused by Phytophthora cinnamomi and P. cambivora. Six genetically distinct CHV1 subtypes have been identified in Europe (I, D, E, F1, F2 and G) [25]. Subtype I (also known as the Italian subtype), which is the only subtype that has been detected in England [15,24], is the most widespread, because it is commonly associated with mild hypovirulence. It is dominant in Italy, Switzerland, south-eastern France, Greece [26], Bosnia [27], Croatia [28], Slovenia [29], Macedonia [30], Turkey [31], and now also England [15,24], where the haplotype exactly matches haplotype E-5. The European distribution of the E-5 haplotype has not been well studied. It was described as a rare haplotype, and it has been introduced in an experimental site near Monthey (Switzerland), where it became widely established [32].
To the best of our knowledge, this is the first time that the effect of temperature on CHV1 has been evaluated. The fact that the biological replicate effect was not significant along the different models, and the original virus concentration being significant, gave a high level of confidence to the whole assay.
The low prevalence of CHV1 (17 out of 350 isolates) and the naturally low virus concentration in these isolates (1.9 to 48.1 ng/µL of viral amplicon after RT-PCR, [15,24]) in England is most likely related to a mean monthly temperature below 7.7 °C between November and April and a mean of 15.2 °C the rest of the months, over the last 8 years [33]). In contrast, the higher viral loads in the warmer temperate areas of continental Europe [34], leads us to hypothesize that the concentration and hypovirulence of this mycovirus is proportionally related to higher mean temperatures around 25 °C [22], therefore the prevailing climate is likely to have a significant influence on its success as a biocontrol agent.
That temperature can modulate the outcome of the chestnut blight fungus and its CHV1 hypovirus interaction was already suggested by a previous study [35]. Somehow, opposite effects (mycovirus-mediated temperature tolerance) have been found for examples of the Curvularia thermal tolerance virus infecting Curvularia protuberata [36] and sometimes in the Heterobasidion RNA virus 6 infecting Heterobasidion annosum sensu lato [37].
Considering the mentioned hypothesis, we analysed the accumulation of the CHV1 virus at different temperatures and its possible effect on the growth of highly infected (gained by transmissions [22]) British isolates of C. parasitica. The results revealed a clear relationship between the virus concentration and temperature. The accumulation of CHV1 within all six virus-infected cultures was shown to be higher between 15 to 25 °C than at lower or higher temperatures.
On the other hand, temperature regulates the fungal growth, with 30 °C the optimum temperature for C. parasitica in the present study, which could explain why the chestnut blight situation in England is also quite stable, as temperatures are generally much lower than this [24]. Taken together, these results suggest that temperature modulates both the fungal growth and the virus accumulation. CHV1 infection was substantially almost neutral for the growth of C. parasitica at 5, 10, 15 and 30 °C but had a reducing effect at 20 and 25 °C, which makes sense with the highest detected transcription levels. The same fungal isolates proved to be less pathogenic in a previous study compared to non-infected isolates when inoculated into chestnut branches and seedlings that were constantly kept at 25 °C [22].
One conclusion noted is that the distribution of the virus load along the different parts of a fungal colony is not uniform, tending to be more concentrated in the central parts than in the periphery of the colony, as suggested here in Figure 4, but also indicated previously [38]. As another conclusion, since the highest monthly mean air temperatures in England are typically recorded in July and August of each year (since 2015 the highest monthly mean temperature was measured in July 2018, at 18.8 °C), the best season to detect operative virus in England and/or to perform inoculations with the highly infected isolates gained by transmissions will be summer. Current weather patterns and further climate change could increase the amount of time that the temperature is over 25 °C, as well as widen the geographical areas experiencing those temperatures, which may have a clear impact both on the fungus (growth promotion) and the virus (virulence increment) and thus in the outcome of this important fungal, forest pathosystem.

Author Contributions

Conceptualization, P.R.-O., D.R. and A.P.-S.; Data curation, P.R.-O.; Formal analysis, P.R.-O.; Funding acquisition, D.R. and A.P.-S.; Investigation, P.R.-O., O.S., A.L., Q.K., W.S. and D.R.; Methodology, P.R.-O., O.S., A.L., Q.K., W.S. and D.R.; Supervision, Q.K., W.S., D.R., A.P.-S. and L.W.; Writing—original draft, P.R.-O. All authors have read and agreed to the published version of the manuscript.

Funding

The project was funded by the Department for Environment, Food & Rural Affairs (TH3_1). W.S. was supported by the Croatian-Swiss Research Programme (project IZHRZ0_180651).

Data Availability Statement

The data that support the findings of this study are available under reasonable request.

Acknowledgments

The authors thank Forestry Commission England Tree Health Officers in England for all the survey from which the respective isolates arise.

Conflicts of Interest

The authors declare no conflict of interest.

References

  1. Ghabrial, S.A.; Suzuki, N. Viruses of plant pathogenic fungi. Annu. Rev. Phytopathol. 2009, 47, 353–384. [Google Scholar] [CrossRef] [PubMed]
  2. Pearson, M.N.; Beever, R.E.; Boine, B.; Arthur, K. Mycoviruses of filamentous fungi and their relevance to plant pathology. Mol. Plant Pathol. 2009, 10, 115–128. [Google Scholar] [CrossRef] [PubMed]
  3. Botella, L.; Jung, M.H.; Rost, M.; Jung, T. Natural populations from the Phytophthora palustris complex show a high diversity and abundance of ssRNA and dsRNA viruses. J. Fungi 2022, 8, 1118. [Google Scholar] [CrossRef]
  4. Xu, Z.; Khalifa, M.E.; Frampton, R.A.; Smith, G.R.; McDougal, R.L.; MacDiarmid, R.M.; Kalamorz, F. Characterization of a novel double-stranded RNA virus from Phytophthora pluvialis in New Zealand. Viruses 2022, 14, 247. [Google Scholar] [CrossRef] [PubMed]
  5. International Committee on Taxonomy of Viruses (ICTV). Report on Virus Classification and Taxon Nomenclature. Available online: https://ictv.global/report# (accessed on 18 May 2023).
  6. Hillman, B.I.; Shapira, R.; Nuss, D.L. Hypovirulence-associated suppression of host functions in Cryphonectria parasitica can be partially relieved by high light intensity. Phytopathology 1990, 80, 950–956. [Google Scholar] [CrossRef]
  7. Preisig, O.; Moleleki, N.; Smit, W.A.; Wingfield, B.D.; Wingfield, M.J. A novel RNA mycovirus in a hypovirulent isolate of the plant pathogen Diaporthe ambigua. J. Gen. Virol. 2000, 81, 3107–3114. [Google Scholar] [CrossRef]
  8. Chu, Y.; Jeon, J.; Yea, S.; Kim, Y.; Yun, S.; Lee, Y.; Kim, K. Double-stranded RNA mycovirus from Fusarium graminearum. Appl. Environ. Microbiol. 2002, 68, 2529–2534. [Google Scholar] [CrossRef]
  9. Chiba, S.; Salaipeth, L.; Lin, Y.H.; Sasaki, A.; Kanematsu, S.; Suzuki, N. A novel bipartite double-stranded RNA mycovirus from the white root rot fungus Rosellinia necatrix: Molecular and biological characterization, taxonomic considerations, and potential for biological control. J. Virol. 2009, 83, 12801–12812. [Google Scholar] [CrossRef]
  10. Schoebel, C.N.; Botella, L.; Lygis, V.; Rigling, D. Population genetic analysis of a parasitic mycovirus to infer the invasion history of its fungal host. Mol. Ecol. 2017, 26, 2482–2497. [Google Scholar] [CrossRef]
  11. Ahn, I.P.; Lee, Y.H. A viral double-stranded RNA up regulates the fungal virulence of Nectria radicicola. Mol. Plant-Microbe Interact. 2001, 14, 496–507. [Google Scholar] [CrossRef]
  12. Liu, Y.C.; Dynek, J.N.; Hillman, B.I.; Milgroom, M.G. Diversity of viruses in Cryphonectria parasitica and C. nitschkei in Japan and China, and partial characterization of a new chrysovirus species. Mycol. Res. 2007, 111, 433–442. [Google Scholar] [CrossRef]
  13. Anagnostakis, S.L. Chestnut blight: The classical problem of an introduced pathogen. Mycologia 1987, 79, 23–37. [Google Scholar] [CrossRef]
  14. EPPO. Cryphonectria Parasitica. Bull. EPPO 2005, 35, 295–298. [Google Scholar] [CrossRef]
  15. Pérez-Sierra, A.; Romon-Ochoa, P.; Gorton, C.; Lewis, A.; Rees, H.; Van Der Linde, S.; Webber, J. High vegetative compatibility diversity of Cryphonectria parasitica infecting sweet chestnut (Castanea sativa) in Britain indicates multiple pathogen introductions. Plant Pathol. 2019, 68, 727–737. [Google Scholar] [CrossRef]
  16. Rigling, D.; Prospero, S. Cryphonectria parasitica, the causal agent of chestnut blight: Invasion history, population biology and disease control. Mol. Plant Pathol. 2018, 19, 7–20. [Google Scholar] [CrossRef]
  17. Choi, G.H.; Nuss, D.L. Hypovirulence of chestnut blight fungus conferred by an infectious viral cDNA. Science 1992, 257, 800–803. [Google Scholar] [CrossRef]
  18. Fahima, T.; Kazmierczak, P.; Hansen, D.R.; Pfeiffer, P.; Vanalfen, N.K. Membrane-associated replication of an unencapsidated double-strand RNA of the fungus, Cryphonectria parasitica. Virology 1993, 195, 81–89. [Google Scholar] [CrossRef] [PubMed]
  19. Peever, T.L.; Liu, Y.C.; Cortesi, P.; Milgroom, M.G. Variation in tolerance and virulence in the chestnut blight fungus–hypovirus interaction. Appl. Environ. Microbiol. 2000, 66, 4863–4869. [Google Scholar] [CrossRef]
  20. Liu, Y.-C.; Milgroom, M.G. Correlation between hypovirus transmission and the number of vegetative incompatibility (vic) genes different among isolates from a natural population of Cryphonectria parasitica. Phytopathology 1996, 86, 79–86. [Google Scholar] [CrossRef]
  21. Cortesi, P.; McCulloch, C.E.; Song, H.; Lin, H.; Milgroom, M.G. Genetic control of horizontal virus transmission in the chestnut blight fungus, Cryphonectria Parasitica. Genetics 2001, 159, 107–118. [Google Scholar] [CrossRef]
  22. Romon-Ochoa, P.; Foster, J.; Chitty, R.; Gorton, C.; Lewis, A.; Eacock, A.; Kupper, Q.; Rigling, D.; Pérez-Sierra, A. Canker development and biocontrol potential of CHV-1 infected English isolates of Cryphonectria parasitica is dependent on the virus concentration and the compatibility of the fungal inoculums. Viruses 2022, 14, 2678. [Google Scholar] [CrossRef]
  23. Aulia, A.; Andika, I.B.; Kondo, H.; Hillman, B.I.; Suzuki, N. A symptomless hypovirus, CHV4, facilitates stable infection of the chestnut blight fungus by a coinfecting reovirus likely through suppression of antiviral RNA silencing. Virology 2019, 533, 99–107. [Google Scholar] [CrossRef] [PubMed]
  24. Romon-Ochoa, P.; Kranjec Orlovic, J.; Gorton, C.; Lewis, A.; van der Linde, S.; Pérez-Sierra, A. New detections of chestnut blight in Great Britain during 2019–2020 reveal high Cryphonectria parasitica diversity and limited spread of the disease. Plant Pathol. 2021, 71, 793–804. [Google Scholar] [CrossRef]
  25. Rigling, D.; Borst, N.; Cornejo, C.; Supatashvili, A.; Prospero, S. Genetic and phenotypic characterization of Cryphonectria hypovirus 1 from Eurasian Georgia. Viruses 2018, 10, 687. [Google Scholar] [CrossRef]
  26. Allemann, C.; Hoegger, P.; Heiniger, U.; Rigling, D. Genetic variation of Cryphonectria hypoviruses (CHV1) in Europe, assessed using restriction fragment length polymorphism (RFLP) markers. Mol. Ecol. 1999, 8, 843–854. [Google Scholar] [CrossRef] [PubMed]
  27. Bryner, S.F.; Rigling, D. Hypovirus virulence and vegetative incompatibility in populations of the chestnut blight fungus. Phytopathology 2012, 102, 1161–1167. [Google Scholar] [CrossRef] [PubMed]
  28. Krstin, L.; Novak-Agbaba, S.; Rigling, D.; Krajacic, M.; Curkovic-Perica, M. Chestnut blight fungus in Croatia: Diversity of vegetative compatibility types and genetic variability of associated Cryphonectria hypovirus 1. Plant Pathol. 2008, 57, 1086–1096. [Google Scholar] [CrossRef]
  29. Krstin, L.; Novak-Agbaba, S.; Rigling, D.; Curkovic-Perica, M. Diversity of vegetative compatibility types and mating types of Cryphonectria parasitica in Slovenia and occurrence of associated Cryphonectria hypovirus 1. Plant Pathol. 2011, 60, 752–761. [Google Scholar] [CrossRef]
  30. Sotiroski, K.; Milgroom, M.G.; Rigling, D.; Heiniger, U. Occurrence of Cryphonectria hypovirus 1 in the chestnut blight fungus in Macedonia. For. Pathol. 2006, 36, 136–143. [Google Scholar] [CrossRef]
  31. Akilli, S.; Serce, C.U.; Katircioglu, Y.Z.; Maden, S.; Rigling, D. Characterization of hypovirulent isolates of the chestnut blight fungus, Cryphonectria parasitica from the Marmara and Black Sea regions of Turkey. Eur. J. Plant Pathol. 2013, 135, 323–334. [Google Scholar] [CrossRef]
  32. Hoegger, P.J.; Heiniger, U.; Holdenrieder, O.; Rigling, D. Differential transfer and dissemination of hypovirus and nuclear and mitochondrial genomes of a hypovirus-infected Cryphonectria parasitica strain after introduction into a natural population. Appl. Environ. Microbiol. 2003, 69, 3767–3771. [Google Scholar] [CrossRef] [PubMed]
  33. Statista. Monthly Mean Air Temperature in England from 2015 to 2022; UK Department for Business, Energy, and Industrial Strategy: London, UK, 2022.
  34. Ježić, M.; Schwarz, J.M.; Prospero, S.; Sotirovski, K.; Risteski, M.; Ćurković-Perica, M.; Nuskern, L.; Krstin, L.; Katanić, Z.; Maleničić, E.; et al. Temporal and spatial genetic population structure of Cryphonectria parasitica and its associated hypovirus across an invasive range of chestnut blight in Europe. Phytopathology 2021, 111, 1327–1337. [Google Scholar] [CrossRef]
  35. Bryner, S.F.; Rigling, D. Temperature-dependent genotype-by-genotype interaction between a pathogenic fungus and its hyperparasitic virus. Am. Nat. 2011, 177, 65–74. [Google Scholar] [CrossRef] [PubMed]
  36. Marquez, L.M.; Redman, R.S.; Rodriguez, R.; Stout, R.G.; Rodriguez, R.J.; Roossinck, M. A virus in a fungus in a plant: Three-way symbiosis required for thermal tolerance. Science 2007, 315, 513–515. [Google Scholar] [CrossRef] [PubMed]
  37. Vainio, E.J.; Hyder, R.; Aday, G.; Hansen, E.; Piri, T.; Doğmuş-Lehtijärvi, T.; Hantula, J. Population structure of a novel putative mycovirus infecting the conifer root-rot fungus Heterobasidion annosum sensu lato. Virology 2012, 422, 366–376. [Google Scholar] [CrossRef]
  38. Romon-Ochoa, P.; Lewis, A.; Gorton, C.; van der Linde, S.; Pérez-Sierra, A. Effects of growth medium, temperature and mycelium age on CHV-1 accumulation and transmission. For. Ecol. Manag. 2023, 529, 120705–120717. [Google Scholar] [CrossRef]
Figure 1. Regression equations respectively relating the CHV1 nanograms (A) and copy numbers (B) per microliter with threshold cycle values.
Viruses 15 01260 g001
Figure 2. Virus concentration (A) and virus copy number (B) at each temperature for viral strains E-5 (red lanes) and L-18 (blue lanes). Lanes with the same letter are not significantly different based on a Tukey′ s test. Lanes with an asterisk indicate significant differences between the two virus haplotypes.
Viruses 15 01260 g002
Figure 3. Maximum diameter (cm) at each temperature for viral negative and positive isolates, with representation of the potential regression equations relating growth and temperature for each viral strain (nil, black lanes; E-5, red lanes; L-18, blue lanes). Lanes with the same letter are not significantly different based on a Tukey′ s test. Lanes with an asterisk indicate significant differences between the two virus haplotypes or virulent isogenic isolates.
Viruses 15 01260 g003
Figure 4. Viral concentration at each temperature and viral strain divided by extracted RNA (A) or mycelium weight (B) plus viral copy number at each temperature and viral strain divided per extracted RNA (C) or mycelium weight (D). Viral strains (E-5, red lanes; L-18, blue lanes). Lanes with the same letter are not significantly different based on a Tukey′ s test. Lanes with an asterisk indicate significant differences between the two virus haplotypes.
Viruses 15 01260 g004
Figure 5. Virus concentration (A) and virus copy number (B) at each temperature for viral strains E-5 (red lanes) and L-18 (blue lanes) after additional incubation in broth at 25 °C for one week. Lanes with the same letter are not significantly different based on a Tukey′ s test. Lanes with an asterisk indicate significant differences between the two virus haplotypes.
Viruses 15 01260 g005
Table 1. Virus-infected and virus-free Cryphonectria parasitica strains used in this study.
Treatment NumberStrainTransmitted fromVCG (vic Genotype)Mating TypeVirus Haplotype
1FTC687(SDA540 M2273)EU10 (2122-11)MAT-2E-5
2WAR706(WAP125 M2273)EU9 (2111-11)MAT-2E-5
3POWP709(WAP125 M2273)EU9 (2111-11)MAT-2E-5
4FTC687(SDA540 M2357)EU10 (2122-11)MAT-2L-18
5WAR706(WAP125 M2357)EU9 (2111-11)MAT-2L-18
6POWP709(WAP125 M2357)EU9 (2111-11)MAT-2L-18
7FTC687 NON-INFECTEDVirus-freeEU10 (2122-11)MAT-2N/A
8WAR706 NON-INFECTEDVirus-freeEU9 (2111-11)MAT-2N/A
9POWP709 NON-INFECTEDVirus-freeEU9 (2111-11)MAT-2N/A
Table 2. Model tests of between-subjects effects with Type-III Analysis of Variance (ANOVA) for testing the effect of several parameters on virus concentration and virus copy number when using cellophane PDA plates. Shaded areas represent significant effects while non-shaded areas are non-significant.
Virus Concentration (ng/µL)Virus Copy Number
ModelTemperatureFungal ReplicateViral StrainModelTemperatureFungal ReplicateViral Strain
Type III Sum of Squares6,012,136.815,978,713.1913,605.3819,818.23685,529,198,694,467.0604,331,700,009,547.02,224,111,442,904.9578,973,387,242,015
df85218521
Mean Square751,517.101,195,742.636802.6919,818.2385,691,149,836,808.40120,866,340,001,909.51,112,055,721,452.4778,973,387,242,015
Observed Power1.001.000.060.080.990.990.060.58
R20.500.500.500.500.290.290.290.29
F12.6620.150.110.335.197.320.064.78
p0.00010.00010.890.560.00010.00010.930.03
Virus Concentration/Extracted RNA (ng/µL)Virus Copy Number/Extracted RNA
ModelTemperatureFungal ReplicateViral StrainModelTemperatureFungal ReplicateViral Strain
Type III Sum of Squares699,833.66609,462.9386,195.184175.54145,068,661,314.46136,296,027,364.271,366,249,325.827,406,384,624.36
df85218521
Mean Square87,479.20121,892.5843,097.594175.5418,133,582,664.3027,259,205,472.85683,124,662.917,406,384,624.36
Observed Power0.930.940.300.061.001.000.090.43
R20.190.190.190.190.390.390.390.39
F2.904.041.420.137.9411.940.293.24
p0.0060.0020.240.710.00010.00010.740.05
Virus Concentration/Mycelial Weight (ng/µL)Virus Copy Number/Mycelial Weight
ModelTemperatureFungal ReplicateViral StrainModelTemperatureFungal ReplicateViral Strain
Type III Sum of Squares7,634,052,101.537,540,863,471.7079,309,812.2213,878,817.5933,464,956,110,528,40029,013,085,112,384,300321,942,634,010,970.64,129,928,364,133,164
df85218521
Mean Square954,256,512.691,508,172,694.3439,654,906.1113,878,817.594,183,119,513,816,050.005,802,617,022,476,860.00160,971,317,005,485.30412,992,836,413,3164.00
Observed Power1.001.000.220.090.980.980.070.50
R20.670.670.670.670.240.240.240.24
F25.2539.901.040.364.005.560.153.95
p0.00010.00010.350.540.00010.00010.850.04
Table 3. Model tests of between-subjects effects with Type-III Analysis of Variance (ANOVA) for testing the effect of several parameters on colony diameter in general and with only positives. Shaded areas represent significant effects while non-shaded areas are non-significant.
Colony Diameter (Overall)Colony Diameter (without Negatives)
ModelTemperatureFungal ReplicateViral StrainModelTemperatureFungal ReplicateViral Strain
Type III Sum of Squares177.931170.400.207.32745.70745.600.0750.03
df95228521
Mean Square130.88234.080.103.6693.21149.120.0370.03
Observed Power1.001.000.070.871.001.000.060.05
R20.920.920.920.920.940.940.940.94
F211.43378.140.165.91222.94356.660.080.07
p0.00010.00010.840.0030.00010.00010.910.78
Table 4. Model tests of between-subjects effects with Type-III Analysis of Variance (ANOVA) for testing the effect of several parameters on virus concentration and virus copy number when using broth cultures. Shaded areas represent significant effects while non-shaded areas are non-significant.
Virus Concentration (ng/µL)Virus Copy Number
ModelTemperatureFungal ReplicateViral StrainModelTemperatureFungal ReplicateViral Strain
Type III Sum of Squares1,556,364.86207,684.7181643.771,267,036.3714,143,441,842.833,703,425,992.141,119,836,716.479,320,179,134.21
df85218521
Mean Square194,545.6041,536.9440,821.881,267,036.371,767,930,230.35740,685,198.42559,918,358.249,320,179,134.21
Observed Power1.000.830.551.001.000.760.381.00
R20.520.520.520.520.320.320.320.32
F13.742.932.8889.545.942.491.8831.33
p0.00010.010.060.00010.00010.030.150.0001
Disclaimer/Publisher’s Note: The statements, opinions and data contained in all publications are solely those of the individual author(s) and contributor(s) and not of MDPI and/or the editor(s). MDPI and/or the editor(s) disclaim responsibility for any injury to people or property resulting from any ideas, methods, instructions or products referred to in the content.

