
High-Fat High-Sugar Diet-Induced Changes in the Lipid Metabolism Are Associated with Mildly Increased COVID-19 Severity and Delayed Recovery in the Syrian Hamster

 , , , , and
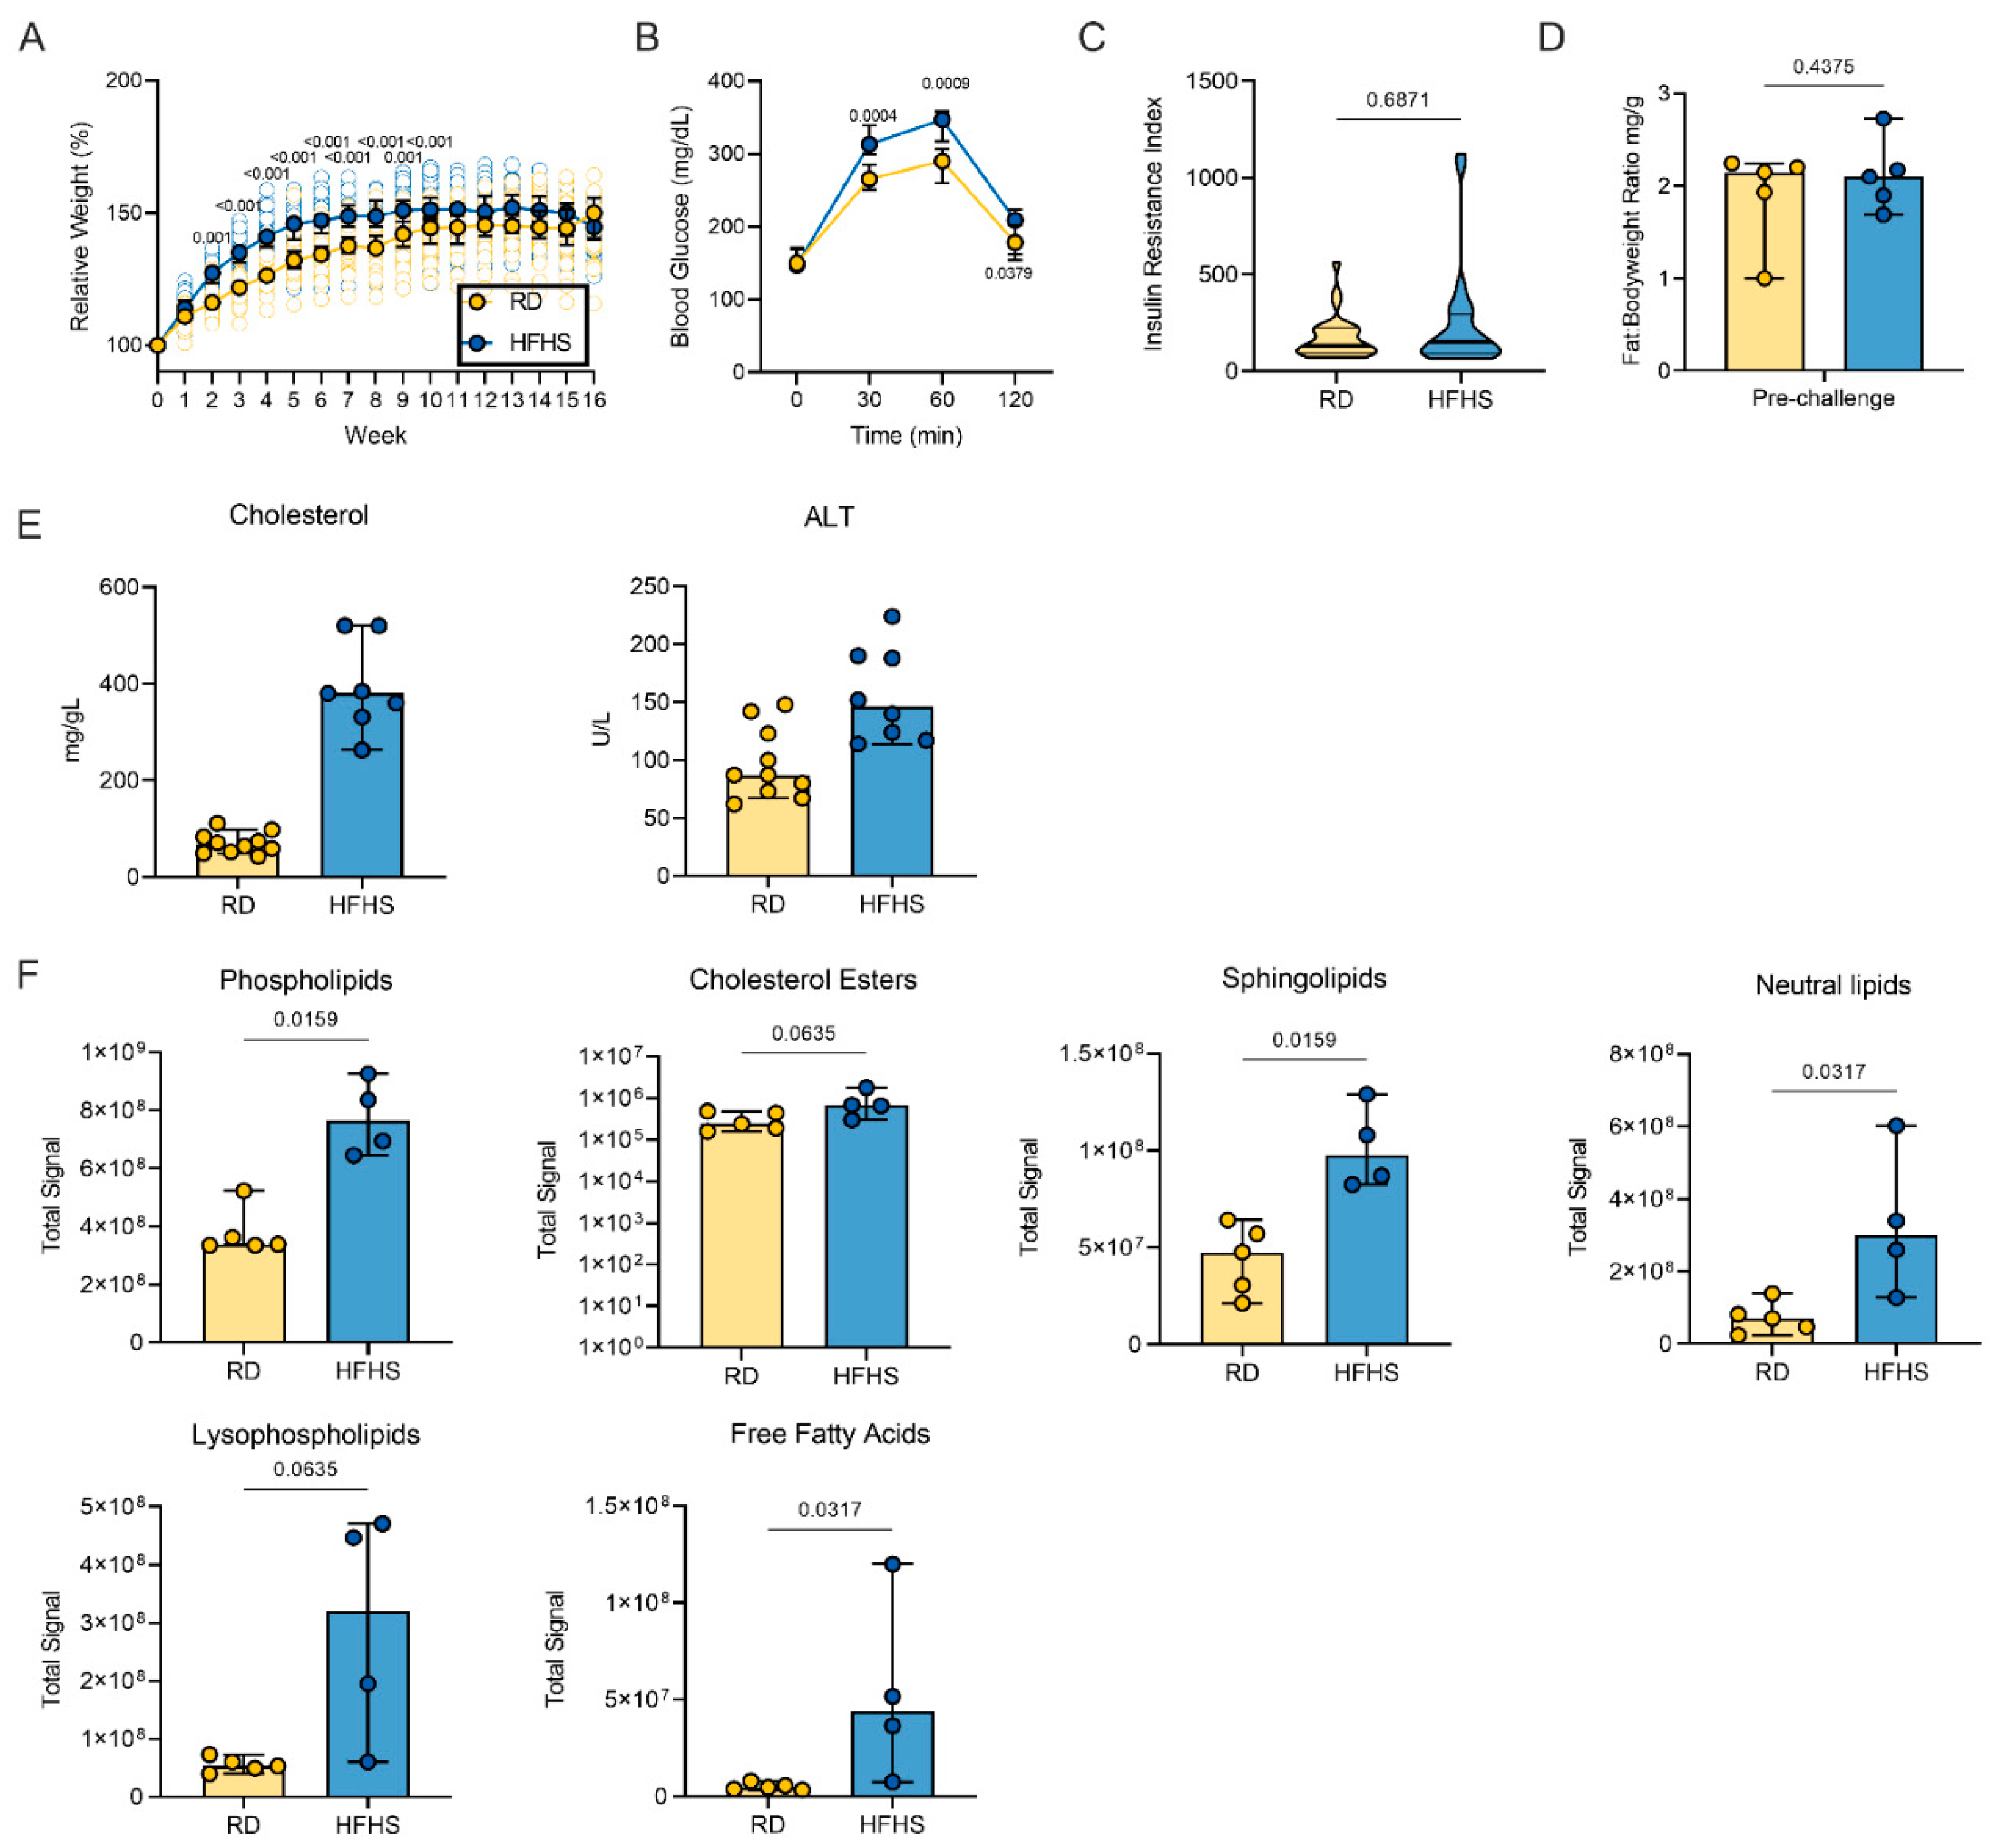
Abstract
:1. Introduction
2. Materials and Methods
2.1. Ethics Statement
2.2. Virus and Cells
2.3. High-Fat High-Sugar Diet
2.4. Assessment of Glucose Tolerance
2.5. Lipidomics
2.6. Next-Generation Sequencing of Liver mRNA
2.7. Next-Generation Sequencing of Virus
2.8. Inoculation Experiments
2.9. Lung Function Analyses
2.10. Histopathology and Immunohistochemistry
2.11. Morphometric Analysis
2.12. Viral RNA Detection
2.13. Viral Titration
2.14. Serology
2.15. Cytokine Analysis
2.16. Serum Lipid Analysis
2.17. Statistical Analysis
3. Results
3.1. High-Fat and High-Sugar Diet Induces Metabolic Changes Characterized by Increased Early Weight Gain and Glucose Tolerance
3.2. High-Fat and High-Sugar Diet Induces Liver Damage and Systemic Hyperlipidemia
3.3. High-Fat and High-Sugar Diet Exacerbated Disease Severity after SARS-CoV-2 Infection
3.4. High-Fat and High-Sugar Diet Is Associated with Exudate, Vasculitis, Inflammation of the Epithelia and Hemorrhage, Fibrin and Edema, and Decreased Viral Clearance
3.5. Immune Infiltration in the Lung during the Acute-Phase of Infection and Humoral Immunity Are Not Significantly Affected by High-Fat High-Sugar Diet
3.6. Prolonged SARS-CoV-2 Shedding, Systemic Immune and Metabolomic Dysregulation after High-Fat High-Sugar Diet
4. Discussion
Supplementary Materials
Author Contributions
Funding
Institutional Review Board Statement
Informed Consent Statement
Data Availability Statement
Acknowledgments
Conflicts of Interest
References
- Nie, S.; Han, S.; Ouyang, H.; Zhang, Z. Coronavirus Disease 2019-related dyspnea cases difficult to interpret using chest computed tomography. Respir. Med. 2020, 167, 105951. [Google Scholar] [CrossRef]
- Parry, A.H.; Wani, A.H.; Yaseen, M.; Dar, K.A.; Choh, N.A.; Khan, N.A.; Shah, N.N.; Jehangir, M. Spectrum of chest computed tomographic (CT) findings in coronavirus disease-19 (COVID-19) patients in India. Eur. J. Radiol. 2020, 129, 109147. [Google Scholar] [CrossRef]
- Butler, M.J.; Barrientos, R.M. The impact of nutrition on COVID-19 susceptibility and long-term consequences. Brain Behav. Immun. 2020, 87, 53–54. [Google Scholar] [CrossRef] [PubMed]
- Li, G.; Liu, X.; Zhu, H.; Huang, L.; Liu, Y.; Ma, C.; Qin, C. Insulin resistance in insulin-resistant and diabetic hamsters (Mesocricetus auratus) is associated with abnormal hepatic expression of genes involved in lipid and glucose metabolism. Comp. Med. 2009, 59, 449–458. [Google Scholar] [PubMed]
- Petrakis, D.; Margină, D.; Tsarouhas, K.; Tekos, F.; Stan, M.; Nikitovic, D.; Kouretas, D.; Spandidos, D.A.; Tsatsakis, A. Obesity—A risk factor for increased COVID-19 prevalence, severity and lethality (Review). Mol. Med. Rep. 2020, 22, 9–19. [Google Scholar] [CrossRef] [PubMed]
- Simonnet, A.; Chetboun, M.; Poissy, J.; Raverdy, V.; Noulette, J.; Duhamel, A.; Labreuche, J.; Mathieu, D.; Pattou, F.; Jourdain, M.; et al. High Prevalence of Obesity in Severe Acute Respiratory Syndrome Coronavirus-2 (SARS-CoV-2) Requiring Invasive Mechanical Ventilation. Obesity 2020, 28, 1994. [Google Scholar] [CrossRef]
- Swinburn, B.A.; Sacks, G.; Hall, K.D.; McPherson, K.; Finegood, D.T.; Moodie, M.L.; Gortmaker, S.L. The global obesity pandemic: Shaped by global drivers and local environments. Lancet 2011, 378, 804–814. [Google Scholar] [CrossRef]
- Araújo, J.; Cai, J.; Stevens, J. Prevalence of Optimal Metabolic Health in American Adults: National Health and Nutrition Examination Survey 2009–2016. Metab. Syndr. Relat. Disord. 2019, 17, 46–52. [Google Scholar] [CrossRef] [PubMed]
- Saklayen, M.G. The Global Epidemic of the Metabolic Syndrome. Curr. Hypertens. Rep. 2018, 20, 12. [Google Scholar] [CrossRef] [Green Version]
- Cordain, L.; Eaton, S.B.; Sebastian, A.; Mann, N.; Lindeberg, S.; Watkins, B.A.; O’Keefe, J.H.; Brand-Miller, J. Origins and evolution of the Western diet: Health implications for the 21st century. Am. J. Clin. Nutr. 2005, 81, 341–354. [Google Scholar] [CrossRef]
- Green, W.D.; Beck, M.A. Obesity altered T cell metabolism and the response to infection. Curr. Opin. Immunol. 2017, 46, 1–7. [Google Scholar] [CrossRef]
- Green, W.D.; Beck, M.A. Obesity Impairs the Adaptive Immune Response to Influenza Virus. Ann. Am. Thorac. Soc. 2017, 14, S406–S409. [Google Scholar] [CrossRef] [PubMed]
- Rogero, M.M.; Calder, P.C. Obesity, Inflammation, Toll-Like Receptor 4 and Fatty Acids. Nutrients 2018, 10, 432. [Google Scholar] [CrossRef] [Green Version]
- Cefalu, W.T.; Rodgers, G.P. COVID-19 and metabolic diseases: A heightened awareness of health inequities and a renewed focus for research priorities. Cell Metab. 2021, 33, 473–478. [Google Scholar] [CrossRef]
- Dalbøge, L.S.; Pedersen, P.J.; Hansen, G.; Fabricius, K.; Hansen, H.B.; Jelsing, J.; Vrang, N. A Hamster Model of Diet-Induced Obesity for Preclinical Evaluation of Anti-Obesity, Anti-Diabetic and Lipid Modulating Agents. PLoS ONE 2015, 10, e0135634. [Google Scholar] [CrossRef] [PubMed] [Green Version]
- Kasim-Karakas, S.E.; Vriend, H.; Almario, R.; Chow, L.C.; Goodman, M.N. Effects of dietary carbohydrates on glucose and lipid metabolism in golden Syrian hamsters. J. Lab. Clin. Med. 1996, 128, 208–213. [Google Scholar] [CrossRef]
- Chan, J.F.-W.; Zhang, A.J.; Yuan, S.; Poon, V.K.-M.; Chan, C.C.-S.; Lee, A.C.-Y.; Chan, W.-M.; Fan, Z.; Tsoi, H.-W.; Wen, L.; et al. Simulation of the Clinical and Pathological Manifestations of Coronavirus Disease 2019 (COVID-19) in a Golden Syrian Hamster Model: Implications for Disease Pathogenesis and Transmissibility. Clin. Infect. Dis. 2020, 71, 2428–2446. [Google Scholar] [CrossRef]
- Sia, S.F.; Yan, L.M.; Chin, A.W.H.; Fung, K.; Choy, K.T.; Wong, A.Y.L.; Kaewpreedee, P.; Perera, R.; Poon, L.L.M.; Nicholls, J.M.; et al. Pathogenesis and transmission of SARS-CoV-2 in golden hamsters. Nature 2020, 583, 834–838. [Google Scholar] [CrossRef] [PubMed]
- Rosenke, K.; Meade-White, K.; Letko, M.; Clancy, C.; Hansen, F.; Liu, Y.; Okumura, A.; Tang-Huau, T.L.; Li, R.; Saturday, G.; et al. Defining the Syrian hamster as a highly susceptible preclinical model for SARS-CoV-2 infection. Emerg. Microbes Infect. 2020, 9, 2673–2684. [Google Scholar] [CrossRef] [PubMed]
- Haddock, E.; Feldmann, F.; Shupert, W.L.; Feldmann, H. Inactivation of SARS-CoV-2 Laboratory Specimens. Am. J. Trop. Med. Hyg. 2021, 104, 2195–2198. [Google Scholar] [CrossRef] [PubMed]
- Wang, P.-R.; Guo, Q.; Ippolito, M.; Wu, M.; Milot, D.; Ventre, J.; Doebber, T.; Wright, S.D.; Chao, Y.-S. High fat fed hamster, a unique animal model for treatment of diabetic dyslipidemia with peroxisome proliferator activated receptor alpha selective agonists. Eur. J. Pharmacol. 2001, 427, 285–293. [Google Scholar] [CrossRef]
- Kim, D.; Langmead, B.; Salzberg, S.L. HISAT: A fast spliced aligner with low memory requirements. Nat. Methods 2015, 12, 357–360. [Google Scholar] [CrossRef] [Green Version]
- Anders, S.; Pyl, P.T.; Huber, W. HTSeq—A Python framework to work with high-throughput sequencing data. Bioinformatics 2015, 31, 166–169. [Google Scholar] [CrossRef]
- Love, M.I.; Huber, W.; Anders, S. Moderated estimation of fold change and dispersion for RNA-seq data with DESeq2. Genome Biol. 2014, 15, 550. [Google Scholar] [CrossRef] [Green Version]
- McGovern, T.K.; Robichaud, A.; Fereydoonzad, L.; Schuessler, T.F.; Martin, J.G. Evaluation of Respiratory System Mechanics in Mice using the Forced Oscillation Technique. JoVE 2013, 75, e50172. [Google Scholar] [CrossRef] [PubMed]
- Corman, V.M.; Landt, O.; Kaiser, M.; Molenkamp, R.; Meijer, A.; Chu, D.K.; Bleicker, T.; Brunink, S.; Schneider, J.; Schmidt, M.L.; et al. Detection of 2019 novel coronavirus (2019-nCoV) by real-time RT-PCR. Eurosurveillance 2020, 25, 2000045. [Google Scholar] [CrossRef] [Green Version]
- van Doremalen, N.; Falzarano, D.; Ying, T.; de Wit, E.; Bushmaker, T.; Feldmann, F.; Okumura, A.; Wang, Y.; Scott, D.P.; Hanley, P.W.; et al. Efficacy of antibody-based therapies against Middle East respiratory syndrome coronavirus (MERS-CoV) in common marmosets. Antivir. Res. 2017, 143, 30–37. [Google Scholar] [CrossRef]
- Yinda, C.K.; Port, J.R.; Bushmaker, T.; Owusu, I.O.; Avanzato, V.A.; Fischer, R.J.; Schulz, J.E.; Holbrook, M.G.; Hebner, M.J.; Rosenke, R.; et al. K18-hACE2 mice develop respiratory disease resembling severe COVID-19. bioRxiv 2021, 17, e1009195. [Google Scholar] [CrossRef] [PubMed]
- Hayashi, T.; Boyko, E.J.; Sato, K.K.; McNeely, M.J.; Leonetti, D.L.; Kahn, S.E.; Fujimoto, W.Y. Patterns of insulin concentration during the OGTT predict the risk of type 2 diabetes in Japanese Americans. Diabetes Care 2013, 36, 1229–1235. [Google Scholar] [CrossRef] [Green Version]
- Washington, I.M.; Van Hoosier, G. Clinical Biochemistry and Hematology. In The Laboratory Rabbit, Guinea Pig, Hamster, and Other Rodents; Elsevier: Waltham, MA, USA, 2012; pp. 57–116. [Google Scholar] [CrossRef]
- Hussain, A.; Mahawar, K.; Xia, Z.; Yang, W.; El-Hasani, S. Obesity and mortality of COVID-19. Meta-analysis. Obes. Res. Clin. Pract. 2020, 14, 295–300. [Google Scholar] [CrossRef]
- Korakas, E.; Ikonomidis, I.; Kousathana, F.; Balampanis, K.; Kountouri, A.; Raptis, A.; Palaiodimou, L.; Kokkinos, A.; Lambadiari, V. Obesity and COVID-19: Immune and metabolic derangement as a possible link to adverse clinical outcomes. Am. J. Physiol. Endocrinol. Metab. 2020, 319, E105–E109. [Google Scholar] [CrossRef]
- Sanyal, A.J. Past, present and future perspectives in nonalcoholic fatty liver disease. Nat. Rev. Gastroenterol. Hepatol. 2019, 16, 377–386. [Google Scholar] [CrossRef]
- Bramante, C.; Tignanelli, C.J.; Dutta, N.; Jones, E.; Tamariz, L.; Clark, J.M.; Usher, M.; Metlon-Meaux, G.; Ikramuddin, S. Non-alcoholic fatty liver disease (NAFLD) and risk of hospitalization for Covid-19. medRxiv 2020. [Google Scholar] [CrossRef]
- Rathnasinghe, R.; Jangra, S.; Cupic, A.; Martinez-Romero, C.; Mulder, L.C.F.; Kehrer, T.; Yildiz, S.; Choi, A.; Mena, I.; De Vrieze, J.; et al. The N501Y mutation in SARS-CoV-2 spike leads to morbidity in obese and aged mice and is neutralized by convalescent and post-vaccination human sera. medRxiv 2021. [Google Scholar] [CrossRef]
- Osterrieder, N.; Bertzbach, L.D.; Dietert, K.; Abdelgawad, A.; Vladimirova, D.; Kunec, D.; Hoffmann, D.; Beer, M.; Gruber, A.D.; Trimpert, J. Age-Dependent Progression of SARS-CoV-2 Infection in Syrian Hamsters. Viruses 2020, 12, 779. [Google Scholar] [CrossRef]
- Winkler, E.S.; Bailey, A.L.; Kafai, N.M.; Nair, S.; McCune, B.T.; Yu, J.; Fox, J.M.; Chen, R.E.; Earnest, J.T.; Keeler, S.P.; et al. SARS-CoV-2 infection of human ACE2-transgenic mice causes severe lung inflammation and impaired function. Nat. Immunol. 2020, 21, 1327–1335. [Google Scholar] [CrossRef]
- Lu, L.; Zhang, H.; Dauphars, D.J.; He, Y.-W. A Potential Role of Interleukin 10 in COVID-19 Pathogenesis. Trends Immunol. 2021, 42, 3–5. [Google Scholar] [CrossRef]
- Chen, G.; Wu, D.; Guo, W.; Cao, Y.; Huang, D.; Wang, H.; Wang, T.; Zhang, X.; Chen, H.; Yu, H.; et al. Clinical and immunological features of severe and moderate coronavirus disease 2019. J. Clin. Invest. 2020, 130, 2620–2629. [Google Scholar] [CrossRef] [Green Version]
- Wang, J.; Jiang, M.; Chen, X.; Montaner, L.J. Cytokine storm and leukocyte changes in mild versus severe SARS-CoV-2 infection: Review of 3939 COVID-19 patients in China and emerging pathogenesis and therapy concepts. J. Leukoc. Biol. 2020, 108, 17–41. [Google Scholar] [CrossRef]
- Dhar, S.K.; K, V.; Damodar, S.; Gujar, S.; Das, M. IL-6 and IL-10 as predictors of disease severity in COVID 19 patients: Results from Meta-analysis and Regression. medRxiv 2020, 7, e06155. [Google Scholar] [CrossRef] [PubMed]
- Schwarz, B.; Sharma, L.; Roberts, L.; Peng, X.; Bermejo, S.; Leighton, I.; Casanovas-Massana, A.; Minasyan, M.; Farhadian, S.; Ko, A.I.; et al. Cutting Edge: Severe SARS-CoV-2 Infection in Humans Is Defined by a Shift in the Serum Lipidome, Resulting in Dysregulation of Eicosanoid Immune Mediators. J. Immunol. 2021, 206, 329–334. [Google Scholar] [CrossRef] [PubMed]
- Demasi, M. COVID-19 and metabolic syndrome: Could diet be the key? BMJ Evid. Based Med. 2021, 26, 1–2. [Google Scholar] [CrossRef]
- Zhong, J.; Tang, J.; Ye, C.; Dong, L. The immunology of COVID-19: Is immune modulation an option for treatment? Lancet Rheumatol. 2020, 2, e428–e436. [Google Scholar] [CrossRef]
- Portincasa, P.; Krawczyk, M.; Smyk, W.; Lammert, F.; Di Ciaula, A. COVID-19 and non-alcoholic fatty liver disease: Two intersecting pandemics. Eur. J. Clin. Investig. 2020, 50, e13338. [Google Scholar] [CrossRef] [PubMed]


Publisher’s Note: MDPI stays neutral with regard to jurisdictional claims in published maps and institutional affiliations. |
© 2021 by the authors. Licensee MDPI, Basel, Switzerland. This article is an open access article distributed under the terms and conditions of the Creative Commons Attribution (CC BY) license (https://creativecommons.org/licenses/by/4.0/).
Share and Cite
Port, J.R.; Adney, D.R.; Schwarz, B.; Schulz, J.E.; Sturdevant, D.E.; Smith, B.J.; Avanzato, V.A.; Holbrook, M.G.; Purushotham, J.N.; Stromberg, K.A.; et al. High-Fat High-Sugar Diet-Induced Changes in the Lipid Metabolism Are Associated with Mildly Increased COVID-19 Severity and Delayed Recovery in the Syrian Hamster. Viruses 2021, 13, 2506. https://doi.org/10.3390/v13122506
Port JR, Adney DR, Schwarz B, Schulz JE, Sturdevant DE, Smith BJ, Avanzato VA, Holbrook MG, Purushotham JN, Stromberg KA, et al. High-Fat High-Sugar Diet-Induced Changes in the Lipid Metabolism Are Associated with Mildly Increased COVID-19 Severity and Delayed Recovery in the Syrian Hamster. Viruses. 2021; 13(12):2506. https://doi.org/10.3390/v13122506
Chicago/Turabian StylePort, Julia R., Danielle R. Adney, Benjamin Schwarz, Jonathan E. Schulz, Daniel E. Sturdevant, Brian J. Smith, Victoria A. Avanzato, Myndi G. Holbrook, Jyothi N. Purushotham, Kaitlin A. Stromberg, and et al. 2021. "High-Fat High-Sugar Diet-Induced Changes in the Lipid Metabolism Are Associated with Mildly Increased COVID-19 Severity and Delayed Recovery in the Syrian Hamster" Viruses 13, no. 12: 2506. https://doi.org/10.3390/v13122506