
Spatial Distribution Patterns of Parthenolecanium corni (Hemiptera, Coccidae) and of the Ampelovirus GLRaV-1 and the Vitivirus GVA in a Commercial Vineyard


Abstract
:1. Introduction
2. Materials and Methods
2.1. Mapping Viruses in the Plot
2.2. Distribution of Soft Scales
2.3. Distribution of Viruses
2.4. Statistical Tools
2.5. Meteorological Records
3. Results
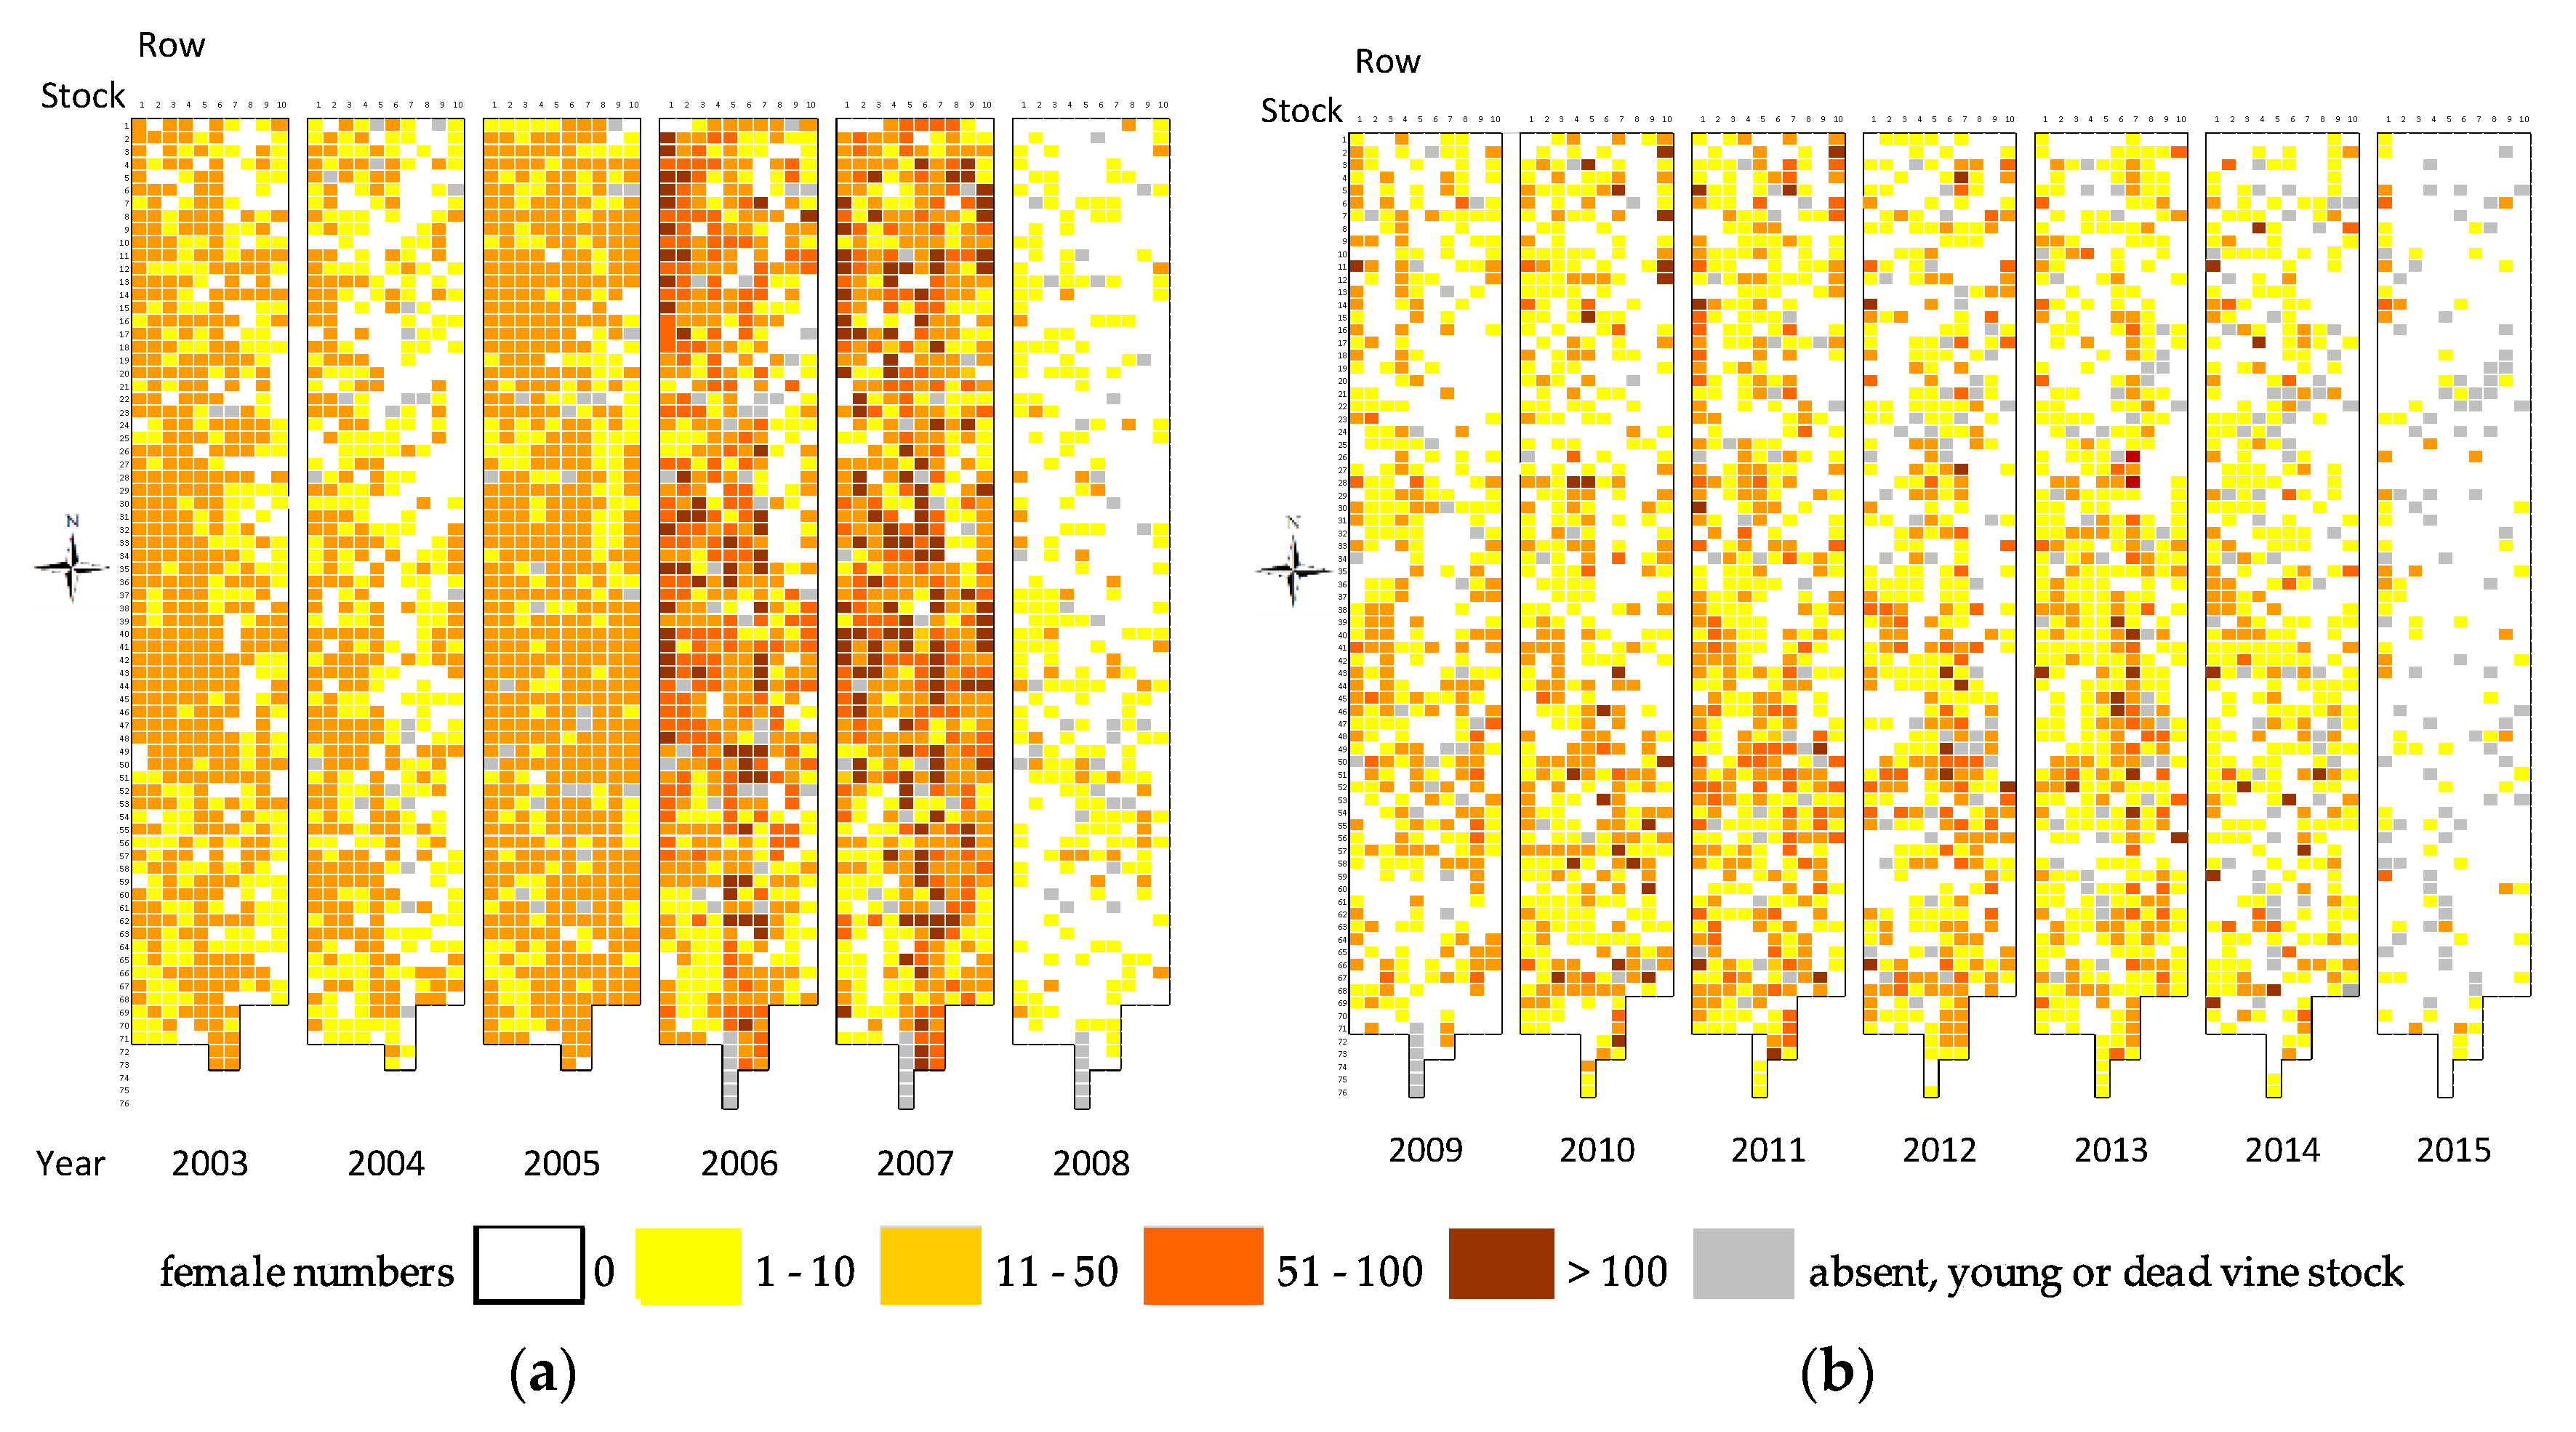
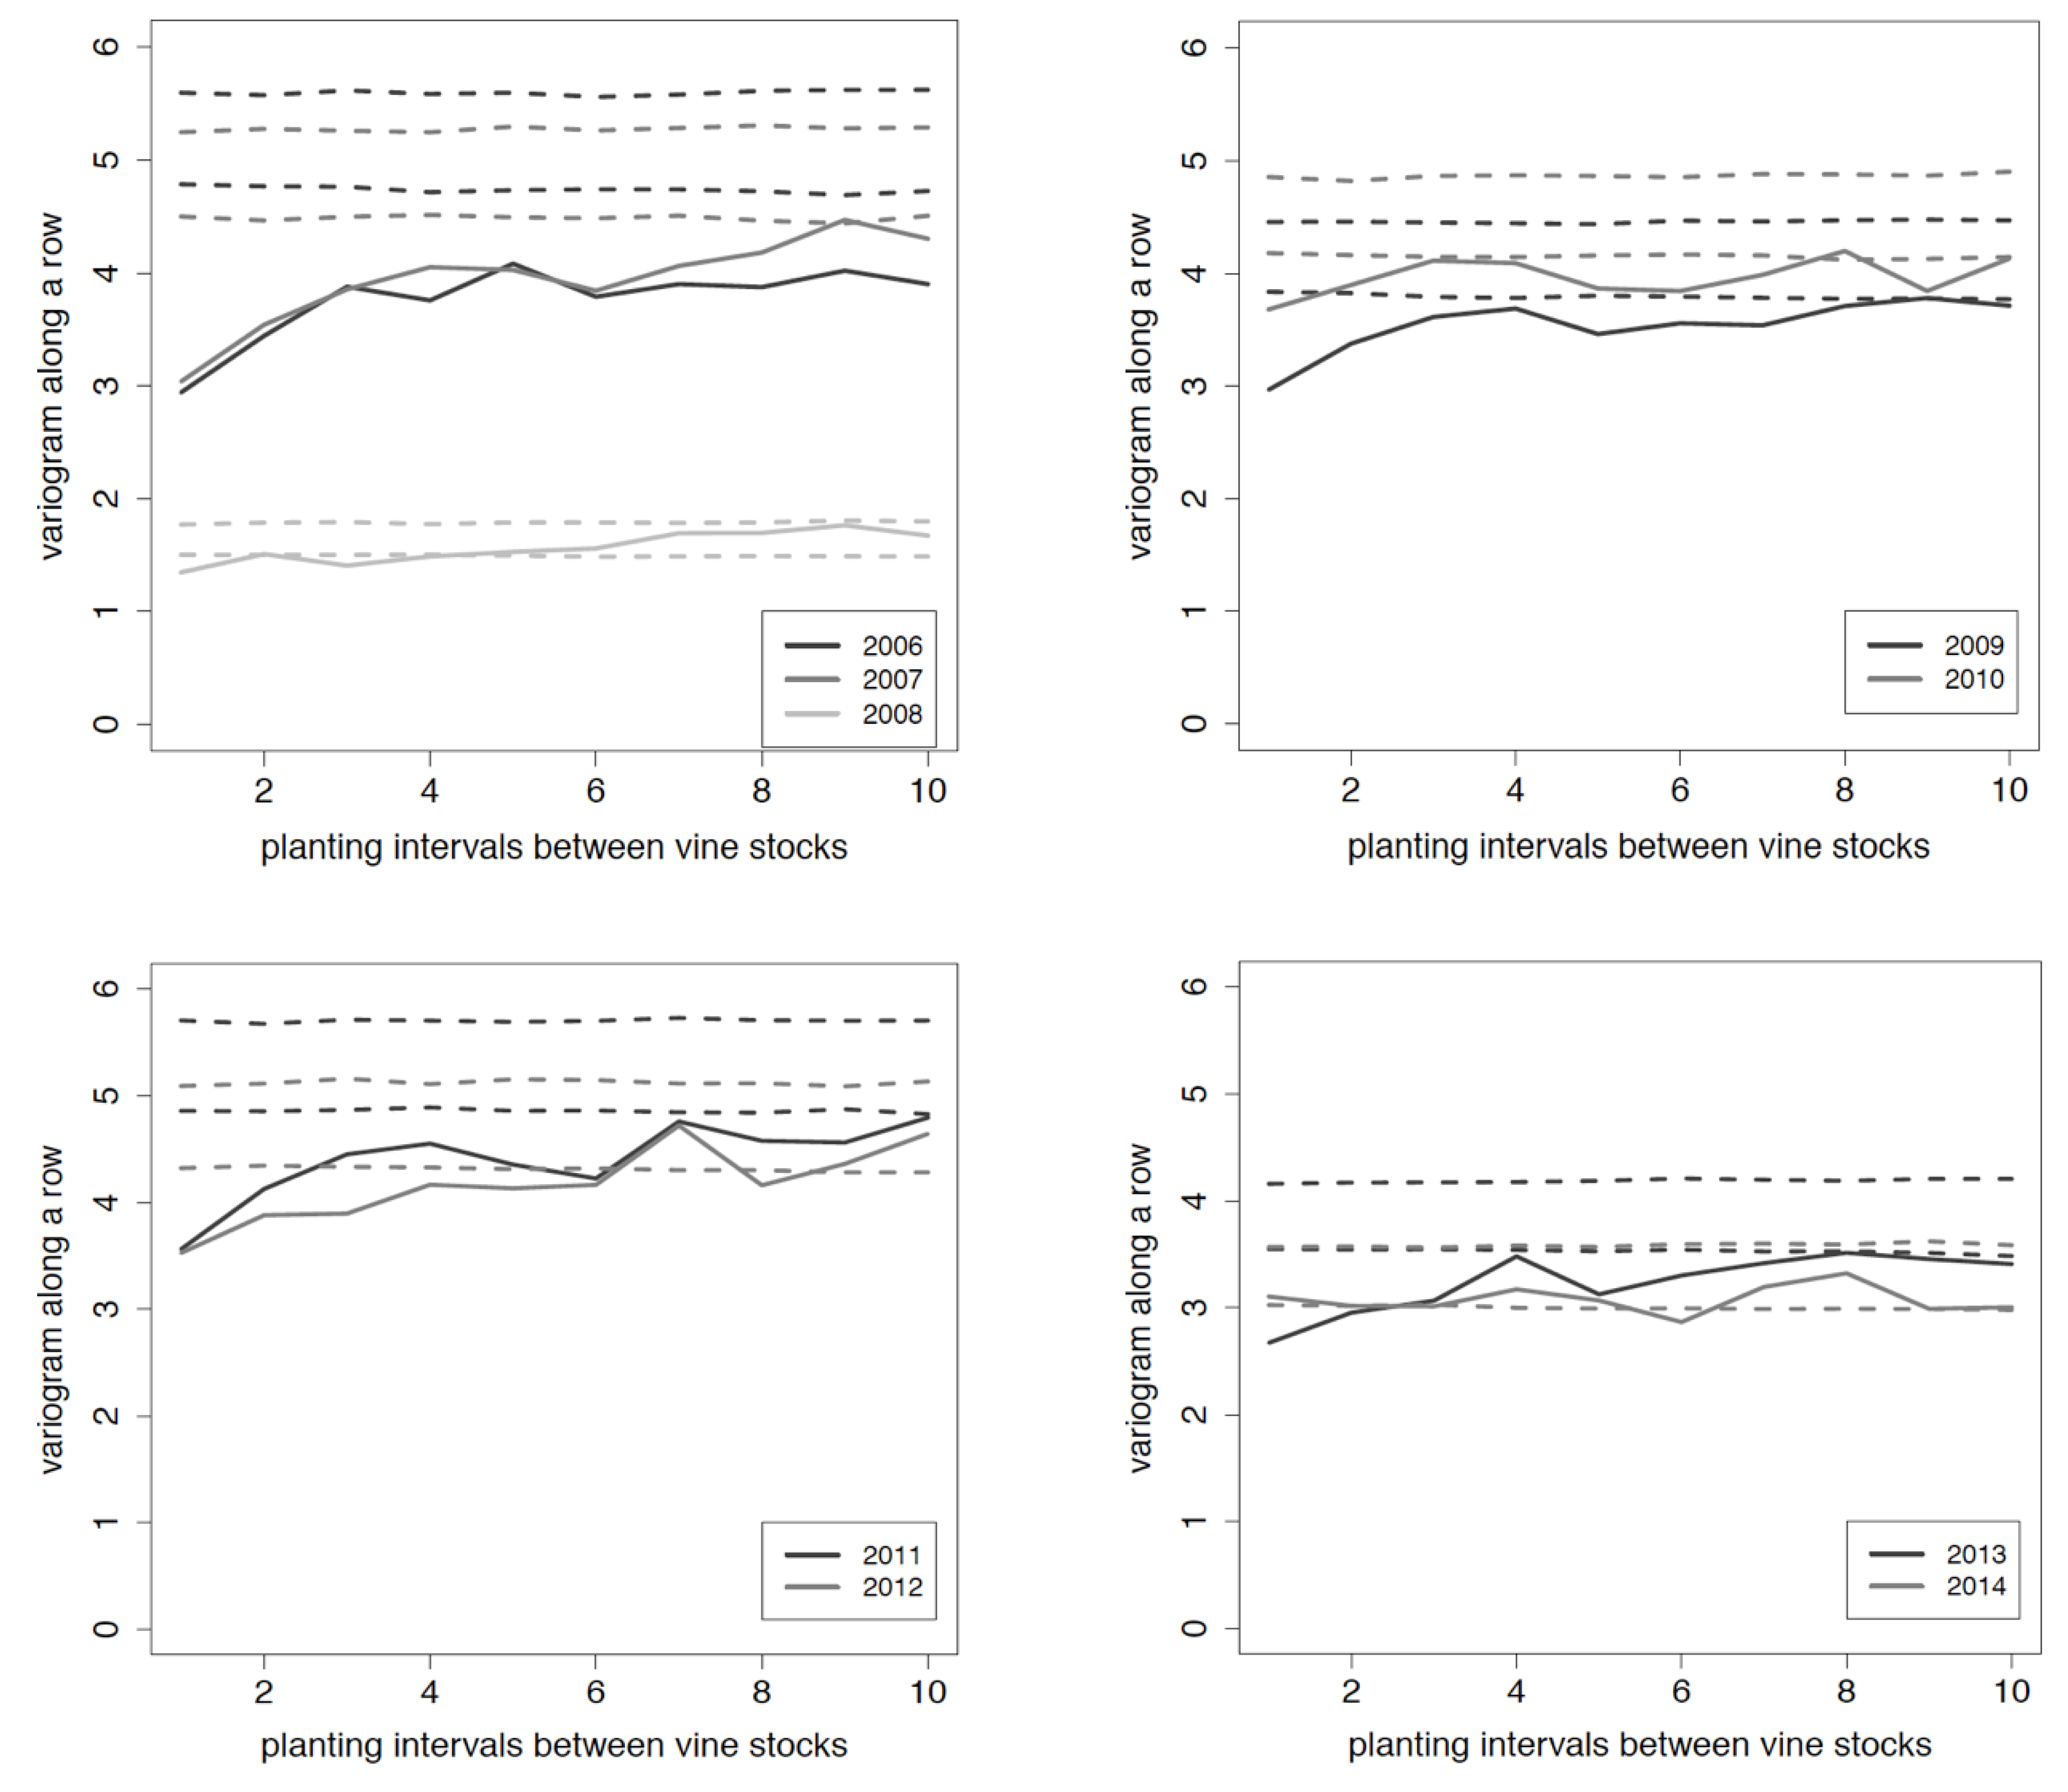
3.1. Distribution of P. corni Young Adult Females
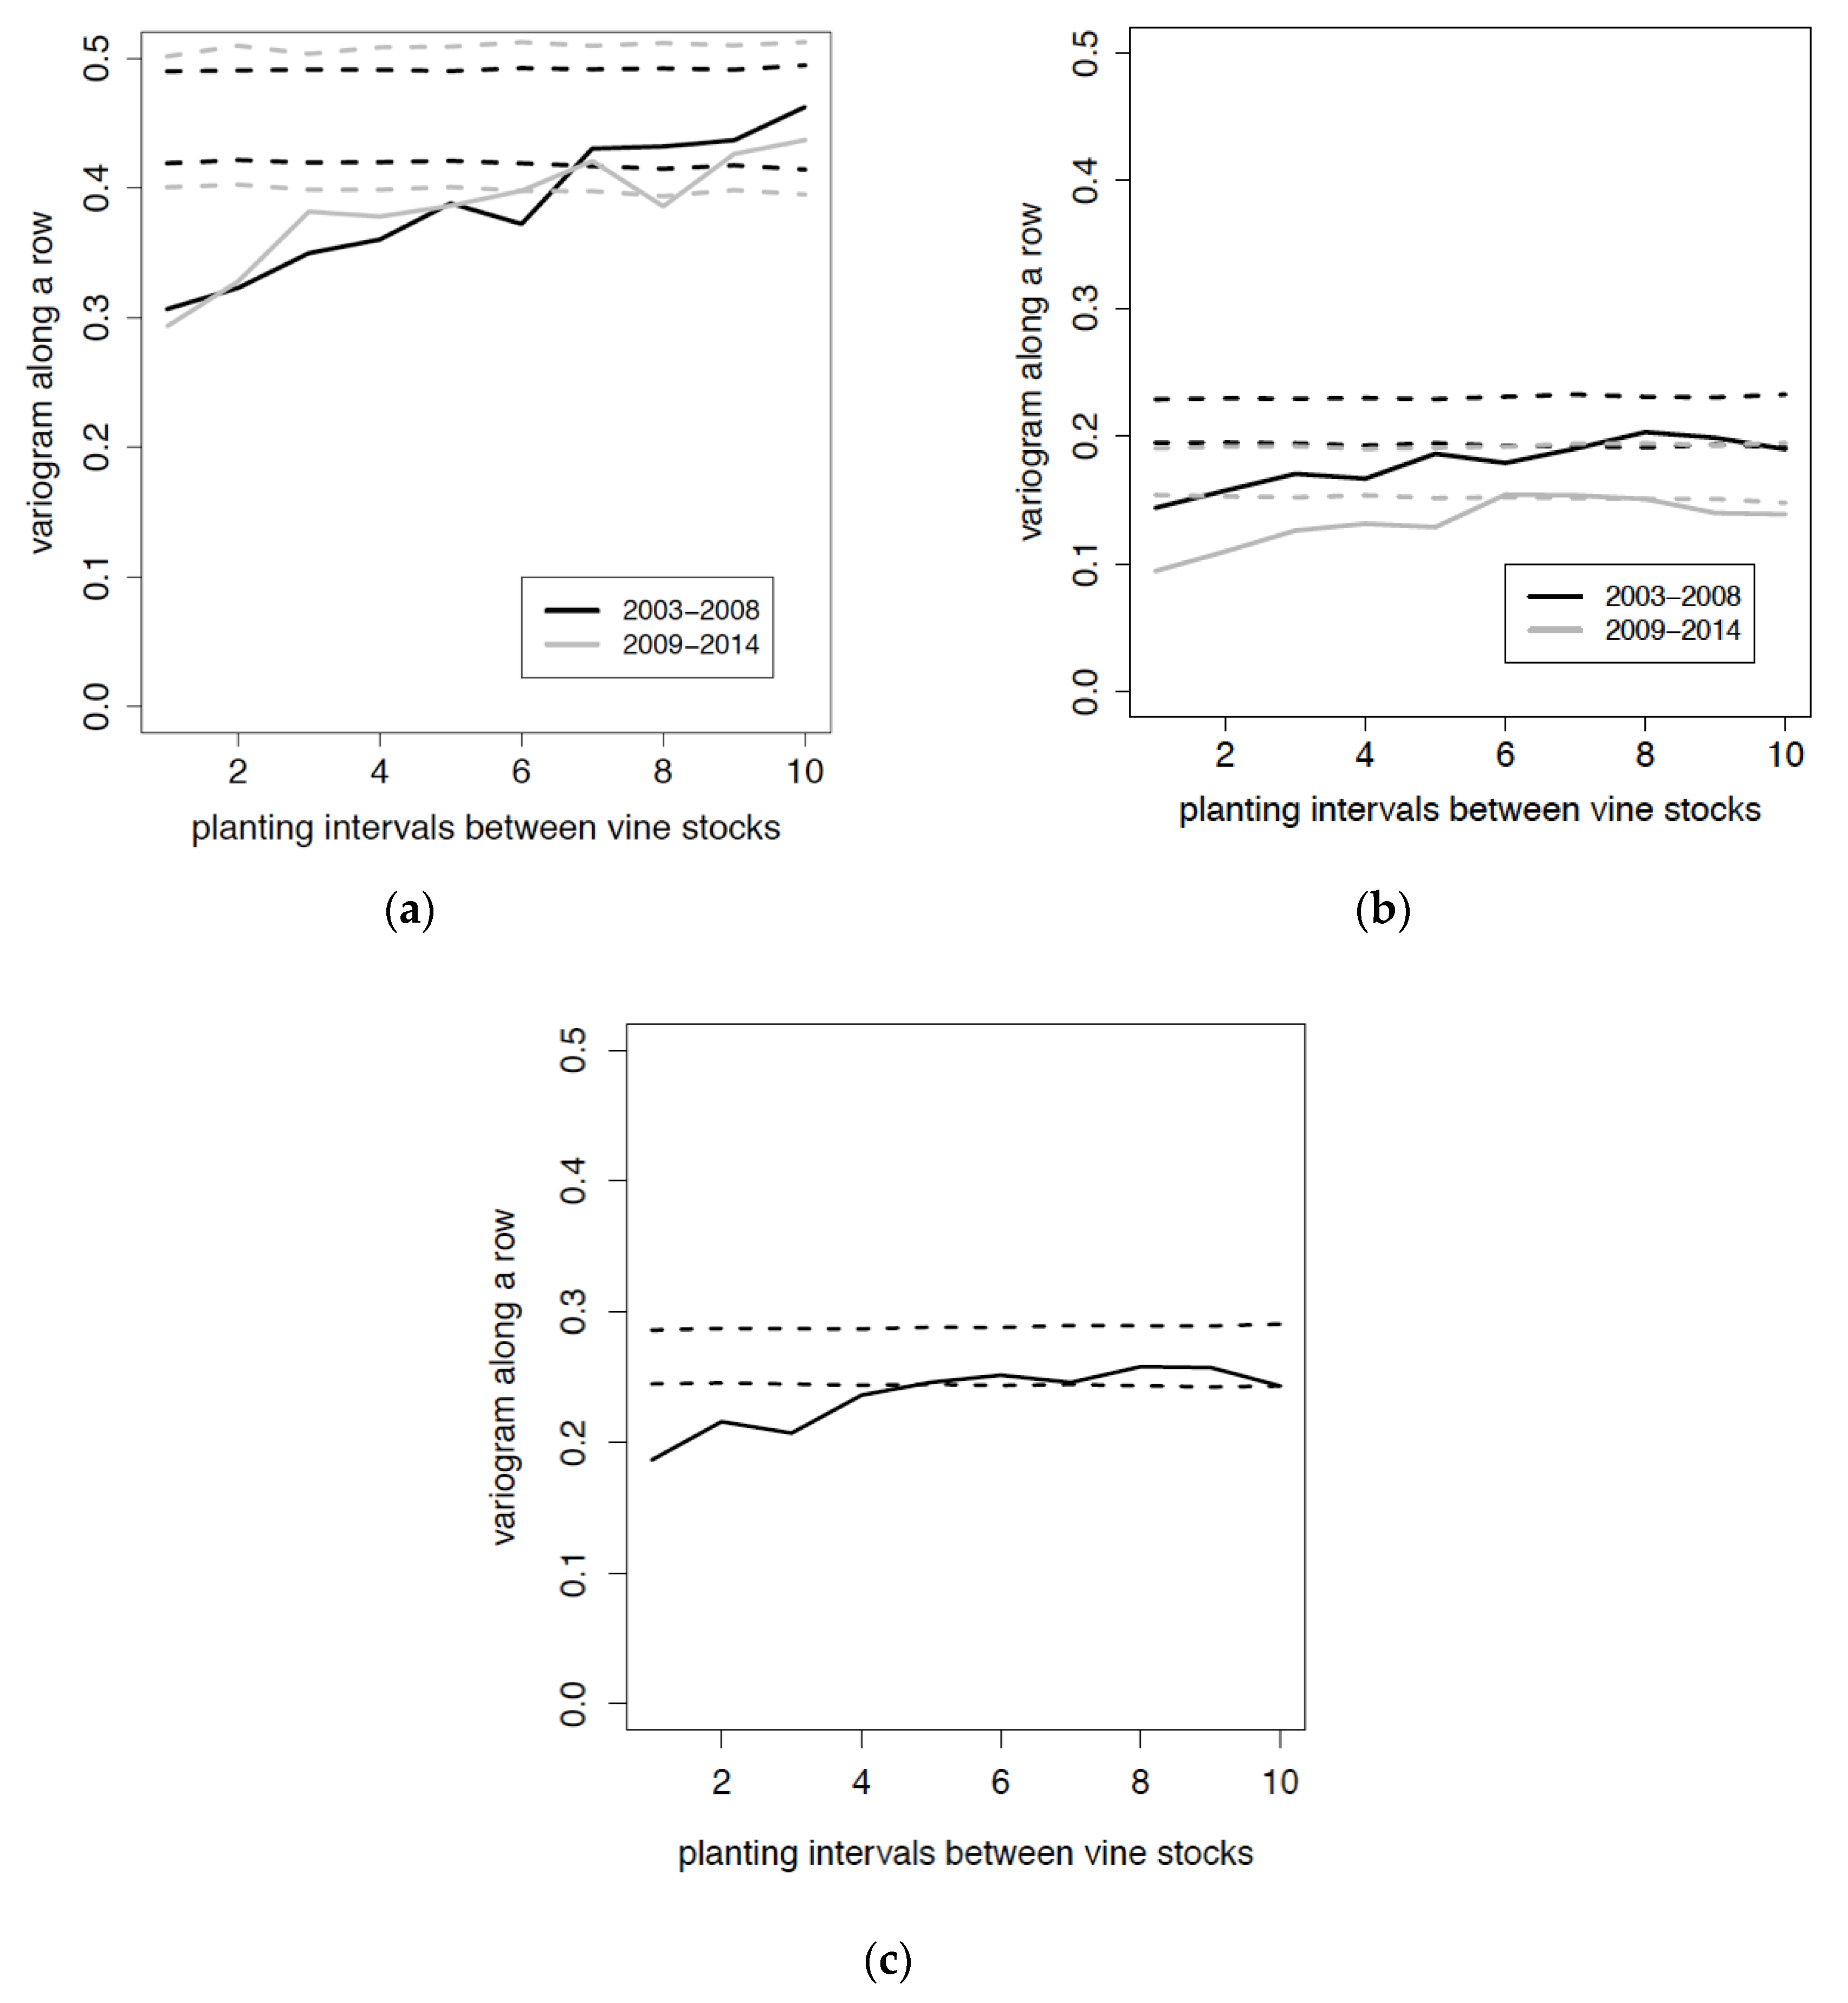
3.2. Distribution of Viruses
3.3. Relation between Viruses and Mealybug Distributions
4. Discussion
Author Contributions
Funding
Acknowledgments
Conflicts of Interest
References
- Herrbach, E.; Le Maguet, J.; Hommay, G. Virus transmission by mealybugs and soft scales (Hemiptera, Coccoidea). In Vector-Mediated Transmission of Plant Pathogens; Brown, J.K., Ed.; American Phytopathological Society Press: St. Paul, MN, USA, 2016; pp. 147–161. [Google Scholar]
- Herrbach, E.; Alliaume, A.; Prator, C.A.; Daane, K.M.; Cooper, M.L.; Almeida, R.P.P. Vector transmission of grapevine-leafroll associated viruses. In Grapevine Viruses: Molecular Biology, Diagnostics and Management; Meng, B., Martelli, G.P., Fuchs, M., Golino, D., Eds.; Springer International Publishing AG: Cham, Switzerland, 2017; pp. 483–503. [Google Scholar]
- Abou Ghanem-Sabanadzovic, N.; Sabanadzovic, S.; Gugerli, P.; Rowhani, A. Genome organization, serology and phylogeny of Grapevine leafroll-associated viruses 4 and 6, taxonomic implications. Virus Res. 2012, 163, 120–128. [Google Scholar] [CrossRef] [PubMed]
- Al Rwahnih, M.; Dolja, V.V.; Daubert, S.; Koonin, E.V.; Rowhani, A. Genomic and biological analysis of Grapevine leafroll-associated virus 7 reveals a possible new genus within the family Closteroviridae. Virus Res. 2012, 163, 302–309. [Google Scholar] [CrossRef] [PubMed]
- Martelli, G.P. Directory of virus and virus-like diseases of the grapevine and their agents. J. Plant Pathol. 2014, 96, 1–136. [Google Scholar] [CrossRef]
- Pietersen, G. Spatio-temporal dynamics of grapevine leafroll disease in Western Cape vineyards. In Proceedings of the Extended Abstracts of the 15th Meeting of the International Council for the Study of Virus and Virus-like Diseases of the Grapevine (ICVG), Stellenbosch, South Africa, 3–7 April 2006; pp. 126–127. [Google Scholar]
- Cabaleiro, C. Current advances in the epidemiology of grapevine leafroll disease. In Proceedings of the 16th Meeting of the ICVG, Dijon, France, 31 August–4 September 2009; Boudon-Padieu, E., Ed.; Hors-Série Spécial Congrès ICVG; Le Progrès Agricole et Viticole: Dijon, France, 2009; pp. 264–268. [Google Scholar]
- Cabaleiro, C.; Couceiro, C.; Pereira, S.; Cid, M.; Barrasa, M.; Segura, A. Spatial analysis of epidemics of Grapevine leafroll associated virus-3. Eur. J. Plant Pathol. 2008, 121, 121–130. [Google Scholar] [CrossRef]
- Pietersen, G.; Bell, V.A.; Krüger, K. Management of Grapevine Leafroll Disease and Associated Vectors in Vineyards. In Grapevine Viruses: Molecular Biology, Diagnostics and Management; Meng, B., Martelli, G.P., Fuchs, M., Golino, D., Eds.; Springer International Publishing AG: Cham, Switzerland, 2017; pp. 531–560. [Google Scholar]
- Habili, N.; Nutter, F.W. Temporal and spatial analysis of Grapevine leafroll-associated virus 3 in Pinot Noir grapevines in Australia. Plant Dis. 1997, 81, 625–628. [Google Scholar] [CrossRef] [Green Version]
- Charles, J.G.; Froud, K.J.; van den Brink, R.; Allan, D.J. Mealybugs and the spread of grapevine leafroll-associated virus 3 (GLRaV-3) in a New Zealand vineyard. Australas. Plant Pathol. 2009, 38, 576–583. [Google Scholar] [CrossRef]
- Sokolsky, T.; Cohen, Y.; Zahavi, T.; Sapir, G.; Sharon, R. Potential efficiency of grapevine leafroll disease management strategies using simulation and real spatio-temporal disease infection data. Aust. J. Grape Wine Res. 2013, 19, 431–438. [Google Scholar] [CrossRef]
- Golino, D.A.; Weber, E.; Sim, S.; Rowhani, A. Leafroll disease is spreading rapidly in a Napa Valley vineyard. Calif. Agric. 2008, 62, 156–160. [Google Scholar] [CrossRef] [Green Version]
- Le Maguet, J.; Fuchs, J.J.; Chadoeuf, J.; Beuve, M.; Herrbach, E.; Lemaire, O. The role of the mealybug Phenacoccus aceris in the spread of Grapevine leafroll-associated virus-1 (GLRaV-1) in two French vineyards. Eur. J. Plant Pathol. 2013, 102, 717–723. [Google Scholar] [CrossRef] [Green Version]
- Arnold, K.; Golino, D.A.; McRoberts, N. A synoptic analysis of the temporal and spatial aspects of grapevine leafroll disease in a historic Napa vineyard and experimental vine blocks. Phytopathology 2017, 107, 418–426. [Google Scholar] [CrossRef] [Green Version]
- Cooper, M.L.; Daugherty, M.P.; Jeske, D.R.; Almeida, R.P.P.; Daane, K.M. Incidence of grapevine leafroll disease: Effects of grape mealybug (Pseudococcus maritimus) abundance and pathogen supply. J. Econ. Entomol. 2018, 111, 1542–1550. [Google Scholar] [CrossRef] [PubMed]
- Le Maguet, J.; Herrbach, E.; Hommay, G.; Beuve, M.; Boudon-Padieu, E.; Lemaire, O. Monitoring of Grapevine leafroll-associated virus 1 (GLRaV-1) dispersion by the mealybug Phenacoccus aceris. In Proceedings of the 16th Meeting of the ICVG, Dijon, France, 31 August–4 September 2009; Boudon-Padieu, E., Ed.; Hors-Série Spécial Congrès ICVG; Le Progrès Agricole et Viticole: Dijon, France, 2009; pp. 283–284. [Google Scholar]
- Poojari, S.; Boulé, J.; DeLury, N.; Lowery, D.T.; Rott, M.; Schmidt, A.M.; Úrbez-Torres, J.R. Epidemiology and genetic diversity of Grapevine leafroll-associated viruses in British Columbia. Plant Dis. 2017, 101, 2088–2097. [Google Scholar] [CrossRef] [PubMed] [Green Version]
- Pietersen, G.; Spreeth, N.; Oosthuizen, T.; Van Rensburg, A.; Van Rensburg, M.; Lottering, D.; Rossouw, N.; Tooth, D. Control of grapevine leafroll disease spread at a commercial wine estate in South Africa, A case study. Am. J. Enol. Vitic. 2013, 64, 296–305. [Google Scholar] [CrossRef]
- Bell, V.A.; Hedderley, D.I.; Pietersen, G.; Lester, P.J. Vineyard-wide control of grapevine leafroll-associated virus 3 requires an integrated response. J. Plant Pathol. 2018, 100, 399–408. [Google Scholar] [CrossRef]
- Atallah, S.; Gomez, M.; Fuchs, M.; Martinson, T. Economic impact of grapevine leafroll disease on Vitis vinifera cv. Cabernet franc in Finger Lakes vineyards of New York. Am. J. Enol. Vitic. 2012, 63, 73–79. [Google Scholar] [CrossRef] [Green Version]
- Greathead, D.J. 1.3.3 Crawler behaviour and dispersal. In Soft Scale Insects—Their Biology, Natural Enemies and Control; Ben-Dov, Y.H., Hodgson, C.J., Eds.; World Crop Pests; Elsevier: Amsterdam, The Netherlands; New York, NY, USA, 1997; Volume 7A, pp. 339–342. [Google Scholar]
- Rohrbach, K.G.; Beardsley, J.W.; German, T.L.; Reimer, N.J.; Sanford, W.G. Mealybug wilt, mealybugs and ants on pineapple. Plant Dis. 1988, 72, 558–565. [Google Scholar] [CrossRef]
- Phillips, P.A.; Sherk, C.J. To control mealybugs, stop honeydew-seeking ants. Calif. Agric. 1991, 45, 26–28. [Google Scholar] [CrossRef] [Green Version]
- Daane, K.M.; Sime, K.R.; Fallon, J.; Cooper, M.L. Impacts of Argentine ants on mealybugs and their natural enemies in California’s coastal vineyards. Ecol. Entomol. 2007, 32, 583–596. [Google Scholar] [CrossRef]
- Mgocheki, N.; Addison, P. Interference of ants (Hymenoptera: Formicidae) with biological control of the vine mealybug Planococcus ficus (Signoret) (Hemiptera: Pseudococcidae). Biol. Control 2009, 49, 180–185. [Google Scholar] [CrossRef]
- Barrass, I.C.; Jerie, P.; Ward, S.A. Aerial dispersal of first and second instar longtailed mealybug, Pseudococcus longispinus (Targioni Tozzetti) (Pseudococcidae, Hemiptera). Aust. J. Exp. Agric. 1994, 34, 1205–1208. [Google Scholar] [CrossRef]
- Grasswitz, T.R.; James, D.G. Movement of grape mealybug, Pseudococcus maritimus, on and between host plants. Entomol. Exp. Appl. 2008, 129, 268–275. [Google Scholar] [CrossRef]
- Hommay, G.; Wiss, L.; Herrbach, E. Une méthode de piégeage multidirectionnel pour évaluer la dispersion éolienne de larves de cochenilles dans le vignoble. Cah. Techn. INRA 2017, 186–195. Available online: https://www6.inrae.fr/cahier_des_techniques/content/download/4991/50310/version/2/file/CTh2017_Art+21_HOM.pdf (accessed on 20 October 2020).
- Hommay, G.; Wiss, L.; Chadoeuf, J.; Le Maguet, J.; Beuve, M.; Herrbach, E. Gone with the wind: Aerial dispersal of Parthenolecanium corni crawlers in a newly planted grapevine plot. Ann. Appl. Biol. 2019, 174, 372–387. [Google Scholar] [CrossRef]
- Lo, P.L.; Bell, V.A.; Walker, J.T.S.; Cole, L.C.; Rogers, D.J.; Charles, J.G. Ecology and Management of Mealybugs in Vineyards; HortResearch Client Report No. 19636; The Horticulture and Food Research Institute of New Zealand: Auckland, New Zealand, 2006. [Google Scholar]
- Charles, J.G.; Cohen, D.; Walker, J.T.S.; Forgie, S.A.; Bell, V.A.; Breen, K.C. A Review of Grapevine Leafroll Associated Virus Type 3 (GLRaV-3) for the New Zealand Wine Industry, Report to New Zealand Winegrowers; Auckland, New Zealand, HortResearch Client Report No 18447. 2006; Unpublished.
- Canard, M. Recherches sur la morphologie et la biologie de la cochenille Eulecanium corni Bouché (Homoptères-Coccoidea). Ann. Ecol. Nat. Sup. Agron. Toulouse 1958, 6, 185–271. [Google Scholar]
- Dubrovskaya, N.A. On the number of generations in Parthenolecanium corni Bouché (Homoptera, Coccoidea, Coccidae). J. Zool. 1959, 3, 1368–1374. [Google Scholar]
- Kosztarab, M.; Kozár, F. Scale Insects of Central Europe; Series Entomologica; Kluwer Academic: Dordrecht, The Netherlands, 1988; 456p. [Google Scholar]
- Ciampolini, M.; Guarnone, A. Pullulazioni su vigneti di Parthenolecanium corni. Inf. Agrar. 2003, 59, 81–85. [Google Scholar]
- Fortusini, A.G.; Scattini, G.; Prati, S.; Cinquanta, S.; Belli, G. Transmission of Grapevine leafroll virus 1 (GLRaV-1) and Grapevine virus A (GVA) by scale insects. In Proceedings of the 12th Meeting of the ICVG, Lisbon, Portugal, 29 September–2 October 1997; pp. 121–122. [Google Scholar]
- Sforza, R.; Boudon-Padieu, E.; Greif, C. New mealybug species vectoring Grapevine leafroll associated viruses-1 and -3 (GLRaV-1 and -3). Eur. J. Plant Pathol. 2003, 109, 975–981. [Google Scholar] [CrossRef]
- Hommay, G.; Komar, V.; Lemaire, O.; Herrbach, E. Grapevine virus A transmission by larvae of Parthenolecanium corni. Eur. J. Plant Pathol. 2008, 121, 185–188. [Google Scholar] [CrossRef]
- Bahder, B.W.; Poojari, S.; Alabi, O.J.; Naidu, R.A.; Walsh, D.B. Pseudococcus maritimus (Hemiptera: Pseudococcidae) and Parthenolecanium corni (Hemiptera: Coccidae) are capable of transmitting Grapevine leafroll-associated virus 3 between Vitis x labruscana and Vitis vinifera. Environ. Entomol. 2013, 42, 1292–1298. [Google Scholar] [CrossRef]
- Grenan, S.; Boidron, R. Amélioration de la Qualité Sanitaire des Bois et Plants de Vigne Vis à Vis de L’enroulement: Épidémiologie Appliquée à la Sélection Sanitaire. ENTAV, Contrat de Branche 1998–2001. Unpublished.
- Le Maguet, J. Épidémiologie de l’Enroulement Viral de la Vigne dans les Vignobles Français Septentrionaux et Transmission par Cochenilles Vectrices. Ph.D. Thesis, Strasbourg University, Strasbourg, France, 2012; 204 p. Available online: https://tel.archives-ouvertes.fr/tel-00768382 (accessed on 20 October 2020).
- Zimmermann, D.; Bass, P.; Legin, R.; Walter, B. Characterization and serological detection of four closterovirus-like particles associated with leafroll disease on grapevine. J. Phytopathol. 1990, 130, 205–218. [Google Scholar] [CrossRef]
- Hommay, G.; Le Maguet, J.; Komar, V.; Lemaire, O.; Herrbach, E. Transmission of Grapevine leafroll-associated virus-1 and -3 (Ampelovirus) and Grapevine virus A (Vitivirus) by natural populations of soft scales and mealybugs in the North-eastern French vineyard. In Proceedings of the 16th Meeting of the ICVG, Dijon, France, 31 August–4 September 2009; Boudon-Padieu, E., Ed.; Hors-Série Spécial Congrès ICVG; Le Progrès Agricole et Viticole: Dijon, France, 2009; pp. 286–287. [Google Scholar]
- Beuve, M.; Moury, B.; Spilmont, A.S.; Sempé-Ignatovic, L.; Hemmer, C.; Lemaire, O. Viral sanitary status of declining grapevine Syrah clones and genetic diversity of Grapevine Rupestris stem pitting-associated virus. Eur. J. Plant Pathol. 2013, 135, 439–452. [Google Scholar] [CrossRef]
- Kuntzmann, P. Les antagonistes naturels des cochenilles P. corni (Bouché) et Phenacoccus aceris (Signoret) et Heliococcus bohemicus (Sulc). Rapp. Annu. ITV Colmar. Unpublished.
- Kuntzmann, P. Les antagonistes naturels de la cochenille P. corni (Bouché). Rapp. Annu. ITV Colmar 2004, 1–5, Unpublished. [Google Scholar]
- Kuntzmann, P. Les antagonistes naturels de la cochenille P. corni (Bouché). Rapp. Annu. ITV Colmar 2005, 1–7, Unpublished. [Google Scholar]
- Peyrard, N.; Calonnec, A.; Bonnot, F.; Chadoeuf, J. Explorer un jeu de données sur grille par tests de permutation. Rev. Stat. Appliquée 2005, 53, 59–78. Available online: http://www.numdam.org/item/RSA_2005__53_1_59_0/ (accessed on 20 October 2020).
- Sharon, R.; Zahavi, T.; Sokolski, T.; Sofer-Arad, C.; Sapir, G.; Mawassi, M.; Cohen, Y. The combined effect of preliminary infested vines, spatial spread pattern and the VMB population level on the grapevine leafroll disease infestation rate. In Proceedings of the 17th Congress of the ICVG, Davis, CA, USA, 7–14 October 2012; pp. 182–183. [Google Scholar]
- R Development Core Team. R: A Language and Environment for Statistical Computing; R Foundation for Statistical Computing: Vienna, Austria, 2011; ISBN 3-900051-07-0. [Google Scholar]
- Sentenac, G.; Kuntzmann, P. Étude des cochenilles et des antagonistes qui leur sont associés dans des vignobles en Bourgogne et en Alsace de 2000 à 2002. IOBC/WPRS Bull. 2003, 26, 247–252. [Google Scholar]
- Sentenac, G. Essai d’utilisation de la chrysope Chrysoperla lucasina comme agent de lutte biologique contre des cochenilles farineuses sur vigne. Phytoma. La Défense Des Végétaux 2008, 621, 25–29. [Google Scholar]
- Sentenac, G.; Pham, T.; Salaun, A.; Souvignet, J. Lutte biologique contre les cochenilles farineuses Heliococcus bohemicus Sulc et Phenacoccus aceris (Signoret) au moyen de lâchers de Chrysoperla lucasina (Lacroix). IOBC/WPRS Bull. 2008, 36, 343–349. [Google Scholar]
- Kuntzmann, P. Les antagonistes naturels des cochenilles Parthenolecanium corni (Bouché) et Phenacoccus aceris (Signoret). Rapp. Annu. ITV Colmar. Unpublished.
- McLeod, P.; Diaz, J.; Vasquez, L.; Johnson, D.T. Within-plant distribution and sampling of mealybugs in plantain var. FHIA 21. Trop. Agric. 2002, 79, 150–153. [Google Scholar]
- Cid, M.; Pereira, S.; Cabaleiro, C.; Segura, A. Monitoring of the population of Planococcus citri (Risso) (Hemiptera: Pseudococcidae) in a vineyard in Rias Baixas (Galicia). Bol. De Sanid. Veg. Plagas 2006, 32, 339–344. [Google Scholar]
- Browning, T.O. The long-tailed mealybug, Pseudococcus adonidum (L.) in South Australia. Aust. J. Agric. Res. 1959, 10, 322–339. [Google Scholar] [CrossRef]
- McClure, M.S. Importance of weather to the distribution and abundance of introduced adelgid and scale insects. Agric. For. Meteorol. 1989, 47, 291–302. [Google Scholar] [CrossRef]
- Hayes, A.; Neeman, T.; Cooper, P.D. Overwintering survival of grapevine scale Parthenolecanium persicae (Hemiptera, Coccidae) in the Canberra region of Australia. Austral Entomol. 2019, 58, 346–353. [Google Scholar] [CrossRef]
- Bonnemaison, L. Les Ennemis Animaux des Plantes Cultivées et des Forêts; Editions SEP: Paris, France, 1961; Volume Tome I, 605p. [Google Scholar]
- Le Rü, B.; Iziquel, Y. Experimental study on mechanical effect of rainfall using a rain simulator on cassava mealybug populations, Phenacoccus manihoti. Acta Oecologica 1990, 11, 741–754. [Google Scholar]
- Hogendorp, B.K.; Cloyd, R.A.; Swiader, J.M. Effect of nitrogen fertility on reproduction and development of citrus mealybug, Planococcus citri Risso (Homoptera, Pseudococcidae), feeding on two colors of coleus, Solenostemon scutellarioides L. Codd. Environ. Entomol. 2006, 35, 201–211. [Google Scholar] [CrossRef] [Green Version]
- Cocco, A.; Mura, A.; Muscas, E.; Lentini, A. Variation of life-history parameters of Planococcus ficus (Hemiptera: Pseudococcidae) in response to grapevine nitrogen fertilization. J. Appl. Entomol. 2015, 139, 519–528. [Google Scholar] [CrossRef]
- Esmenjaud, D.; Kreiter, S.; Martinez, M.; Sforza, R.; Thiéry, D.; Van Helden, M.; Yvon, M. Ravageurs de la Vigne, 2nd ed.; Féret, Ed.; Michel Féret Fils: Bordeaux, France, 2008; p. 392. [Google Scholar]
- Ouguas, Y.; Chemseddine, M. Effect of pruning and chemical control on Saissetia oleae (Olivier) (Hemiptera, Coccidae) in olives. Fruits 2011, 66, 225–234. [Google Scholar] [CrossRef]
- Geiger, C.A.; Daane, K. Seasonal movement and distribution of the grape mealybug (Homoptera Pseudococcidae): Developping a sample program for San Joaquin valley vineyards. J. Econ. Entomol. 2001, 94, 291–301. [Google Scholar] [CrossRef]
- Cabaleiro, C.; Segura, A. Field transmission of grapevine leafroll associated virus 3 (GLRaV-3) by the mealybug Planococcus citri. Plant Dis. 1997, 81, 283–287. [Google Scholar] [CrossRef] [Green Version]
- Cabaleiro, C.; Segura, A. Temporal analysis of grapevine leafroll associated virus 3 epidemics. Eur. J. Plant Pathol. 2006, 114, 441–446. [Google Scholar] [CrossRef]
- Gribaudo, I.; Gambino, G.; Bertin, S.; Bosco, D.; Cotroneo, A.; Mannini, F. Monitoring the spread of viruses after vineyard replanting with heat-treated clones of Vitis vinifera ‘Nebbiolo’. J. Plant Pathol. 2009, 91, 741–744. [Google Scholar] [CrossRef]
- Bertin, S.; Pacifico, D.; Cavalieri, V.; Marzachi, C.; Bosco, D. Transmission of Grapevine virus A and Grapevine leafroll-associated viruses 1 and 3 by Planococcus ficus and Planococcus citri fed on mixed-infected plants. Ann. Appl. Biol. 2016, 169, 53–63. [Google Scholar] [CrossRef]
- Zorloni, A.; Prati, S.; Bianco, P.A.; Belli, G. Transmission of Grapevine virus A and Grapevine leafroll-associated virus 3 by Heliococcus bohemicus. J. Plant Pathol. 2006, 88, 325–328. [Google Scholar]
- Reed, D.; Hart, W.; Ingle, S. Influence of windbreaks on distribution and abundance of brown soft scale in citrus groves. Ann. Entomol. Soc. Am. 1970, 63, 792–794. [Google Scholar] [CrossRef]


| Date | 31/10/06 | 8/10/07 | 5/10/08 | 3/10/09 | 19/10/10 | 16/10/11 | 8/10/12 | 11/10/13 | 24/10/14 | 12/10/15 |
| Temperature | 4.8 °C | 5 °C | 3 °C | 5 °C | 2 °C | 1 °C | 5 °C | 4.5 °C | 4 °C | 5 °C |
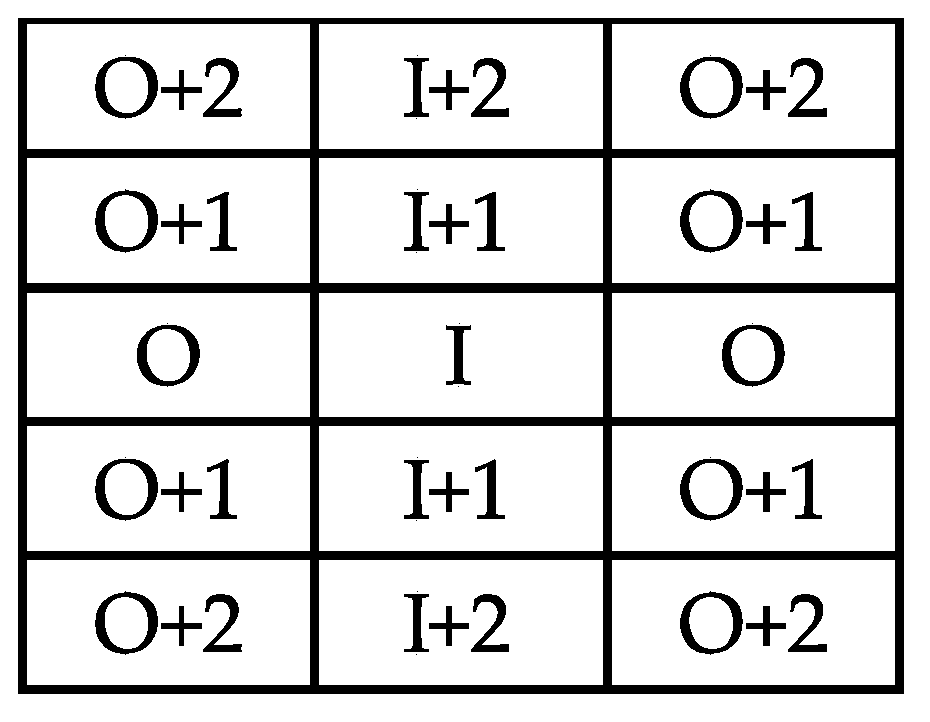
| Vine Position | ||||||
|---|---|---|---|---|---|---|
| New Infected Vines | I + 1 | O | I + 2 | O + 1 | O + 2 | B |
| GLRaV-1 | 83 | 25 | 23 | 10 | 6 | 8 |
| GVA | 27 | 5 | 9 | 5 | 0 | 5 |
Publisher’s Note: MDPI stays neutral with regard to jurisdictional claims in published maps and institutional affiliations. |
© 2020 by the authors. Licensee MDPI, Basel, Switzerland. This article is an open access article distributed under the terms and conditions of the Creative Commons Attribution (CC BY) license (http://creativecommons.org/licenses/by/4.0/).
Share and Cite
Hommay, G.; Wiss, L.; Reinbold, C.; Chadoeuf, J.; Herrbach, E. Spatial Distribution Patterns of Parthenolecanium corni (Hemiptera, Coccidae) and of the Ampelovirus GLRaV-1 and the Vitivirus GVA in a Commercial Vineyard. Viruses 2020, 12, 1447. https://doi.org/10.3390/v12121447
Hommay G, Wiss L, Reinbold C, Chadoeuf J, Herrbach E. Spatial Distribution Patterns of Parthenolecanium corni (Hemiptera, Coccidae) and of the Ampelovirus GLRaV-1 and the Vitivirus GVA in a Commercial Vineyard. Viruses. 2020; 12(12):1447. https://doi.org/10.3390/v12121447
Chicago/Turabian StyleHommay, Gérard, Louis Wiss, Catherine Reinbold, Joël Chadoeuf, and Etienne Herrbach. 2020. "Spatial Distribution Patterns of Parthenolecanium corni (Hemiptera, Coccidae) and of the Ampelovirus GLRaV-1 and the Vitivirus GVA in a Commercial Vineyard" Viruses 12, no. 12: 1447. https://doi.org/10.3390/v12121447
APA StyleHommay, G., Wiss, L., Reinbold, C., Chadoeuf, J., & Herrbach, E. (2020). Spatial Distribution Patterns of Parthenolecanium corni (Hemiptera, Coccidae) and of the Ampelovirus GLRaV-1 and the Vitivirus GVA in a Commercial Vineyard. Viruses, 12(12), 1447. https://doi.org/10.3390/v12121447