The Transcriptional Landscape of Marek’s Disease Virus in Primary Chicken B Cells Reveals Novel Splice Variants and Genes

 , , , , and
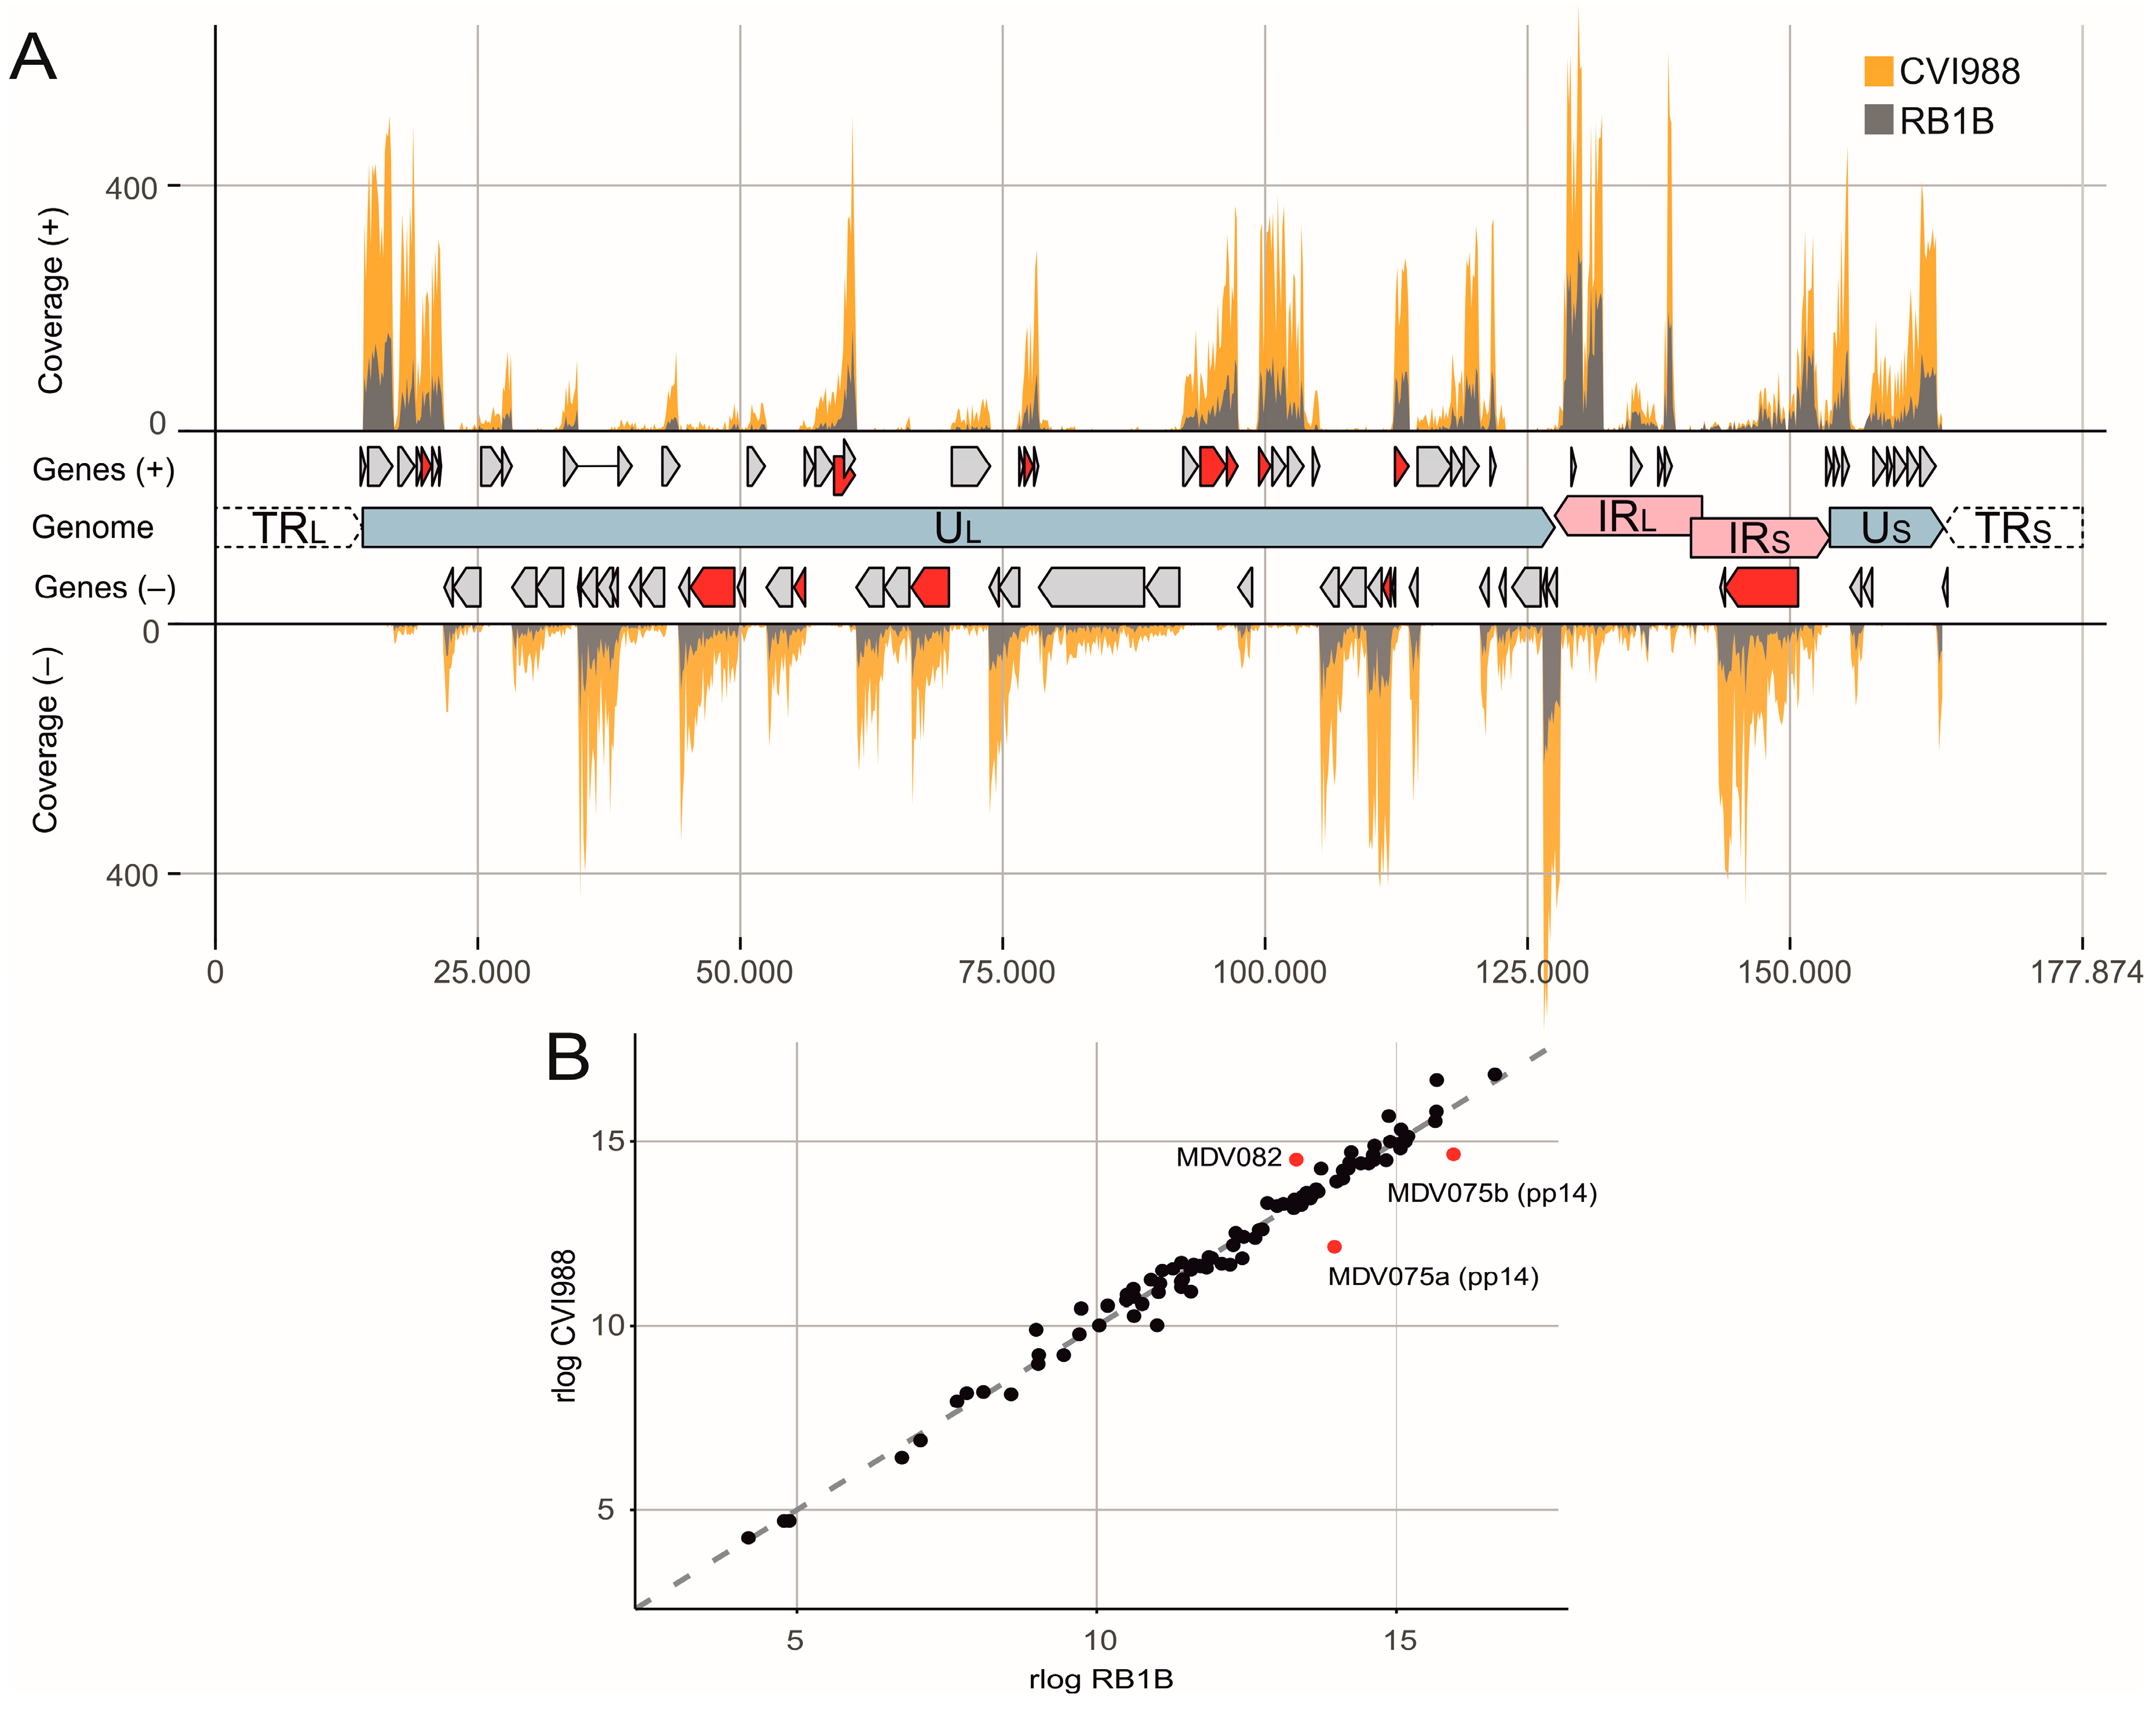
Abstract
:1. Introduction
2. Materials and Methods
2.1. Ethics Statement
2.2. Cells
2.3. Viruses
2.4. Infection of Primary Chicken B Cells
2.5. Flow Cytometry
2.6. High-Throughput RNA-Sequencing
2.7. Sequence and Bioinformatic Analyses
2.8. LC-MALDI TOF/TOF Mass Spectrometry
2.9. Reverse Transcription and PCR over Splice Junctions
2.10. Data Availability
3. Results and Discussion
3.1. The MDV Transcriptional Landscape
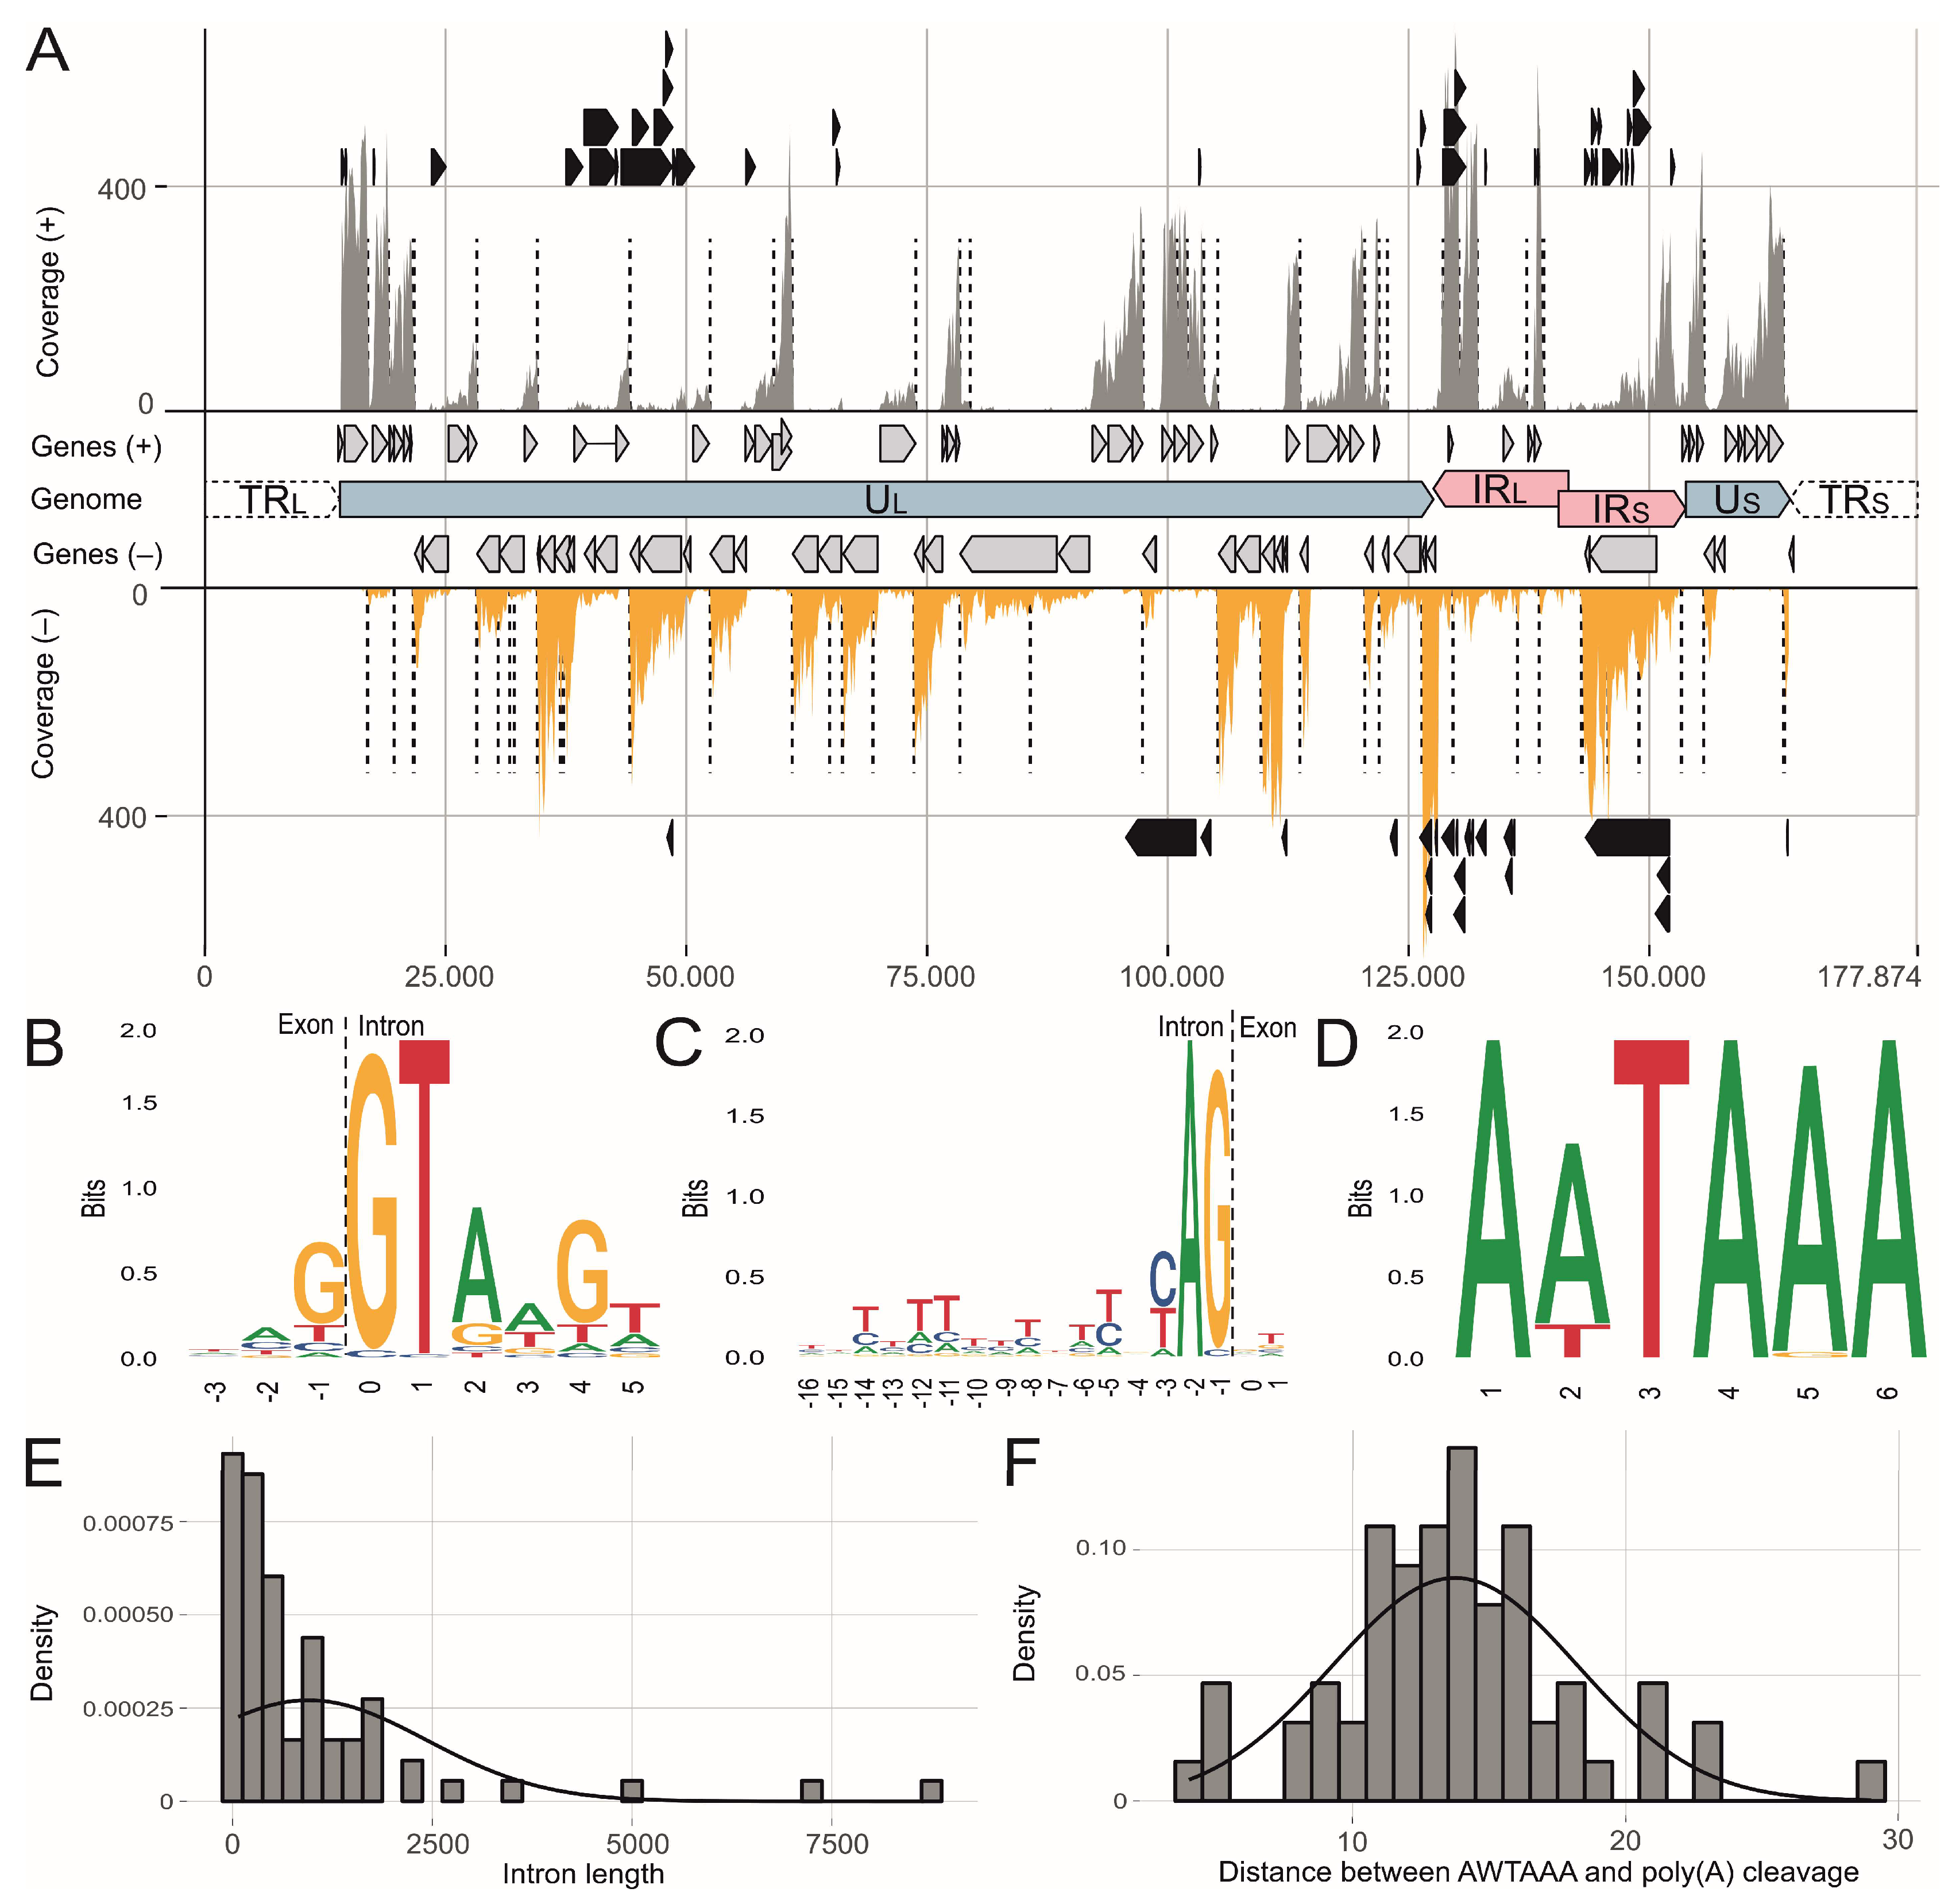
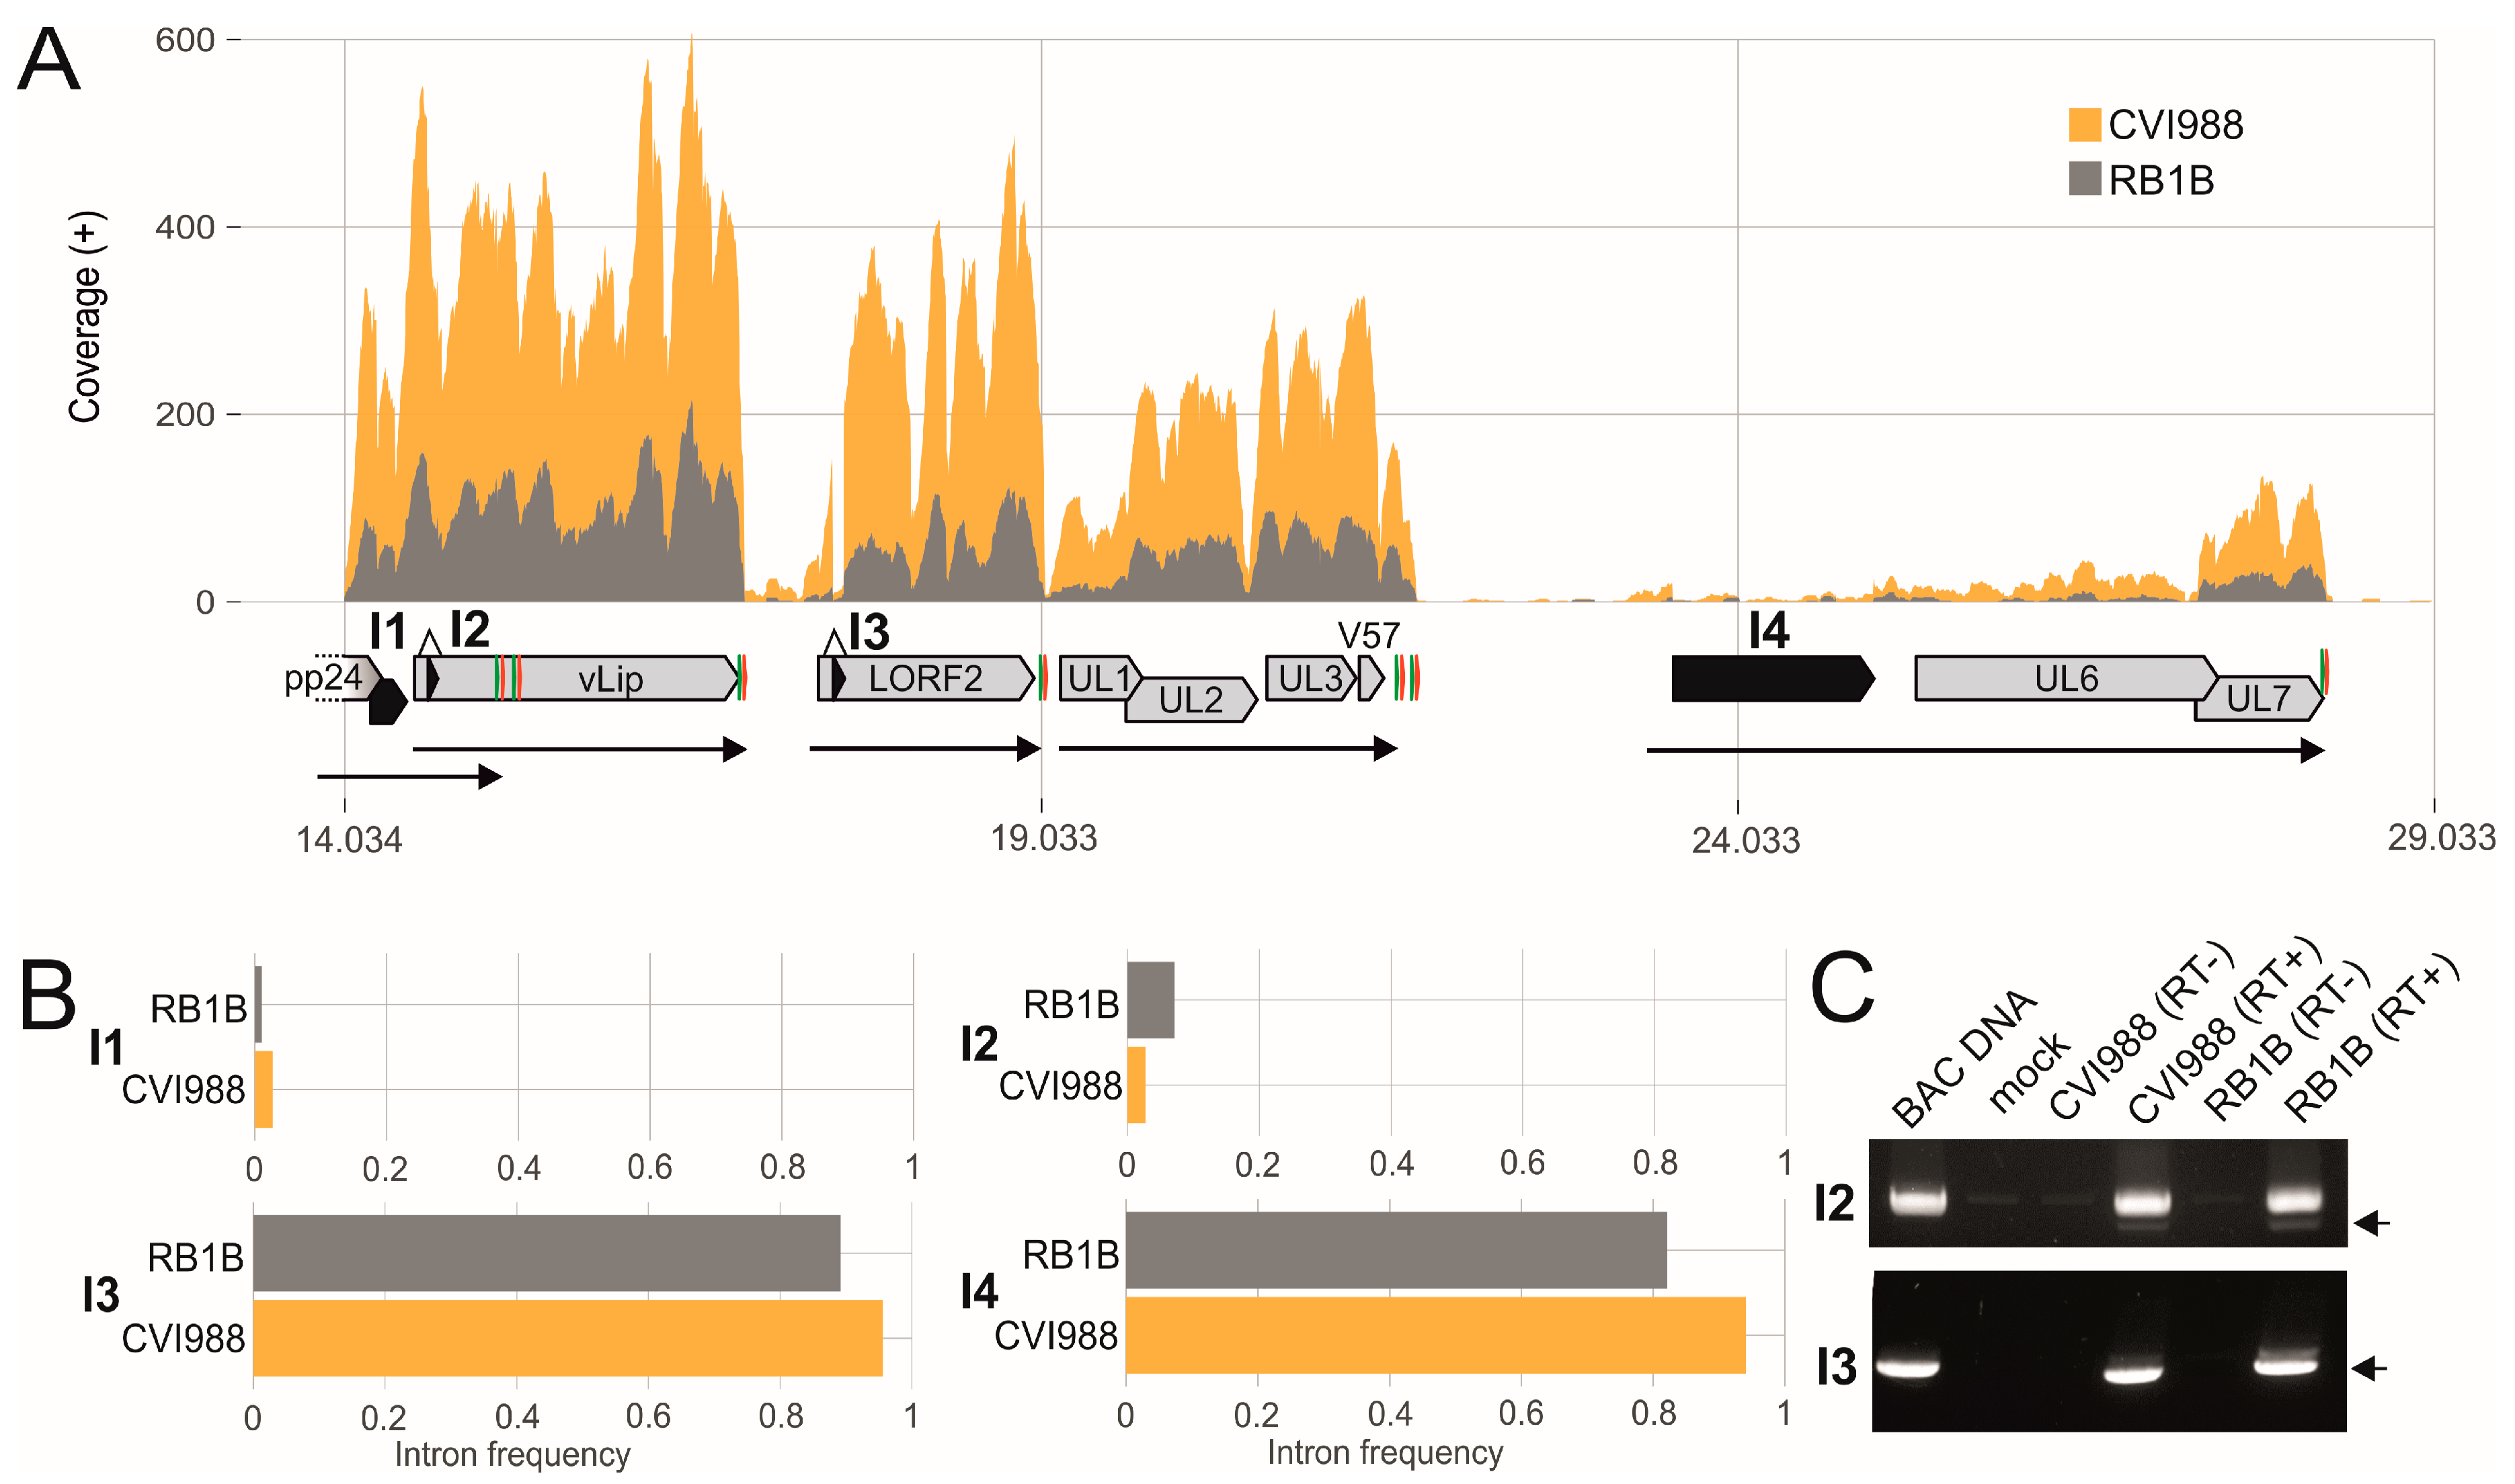
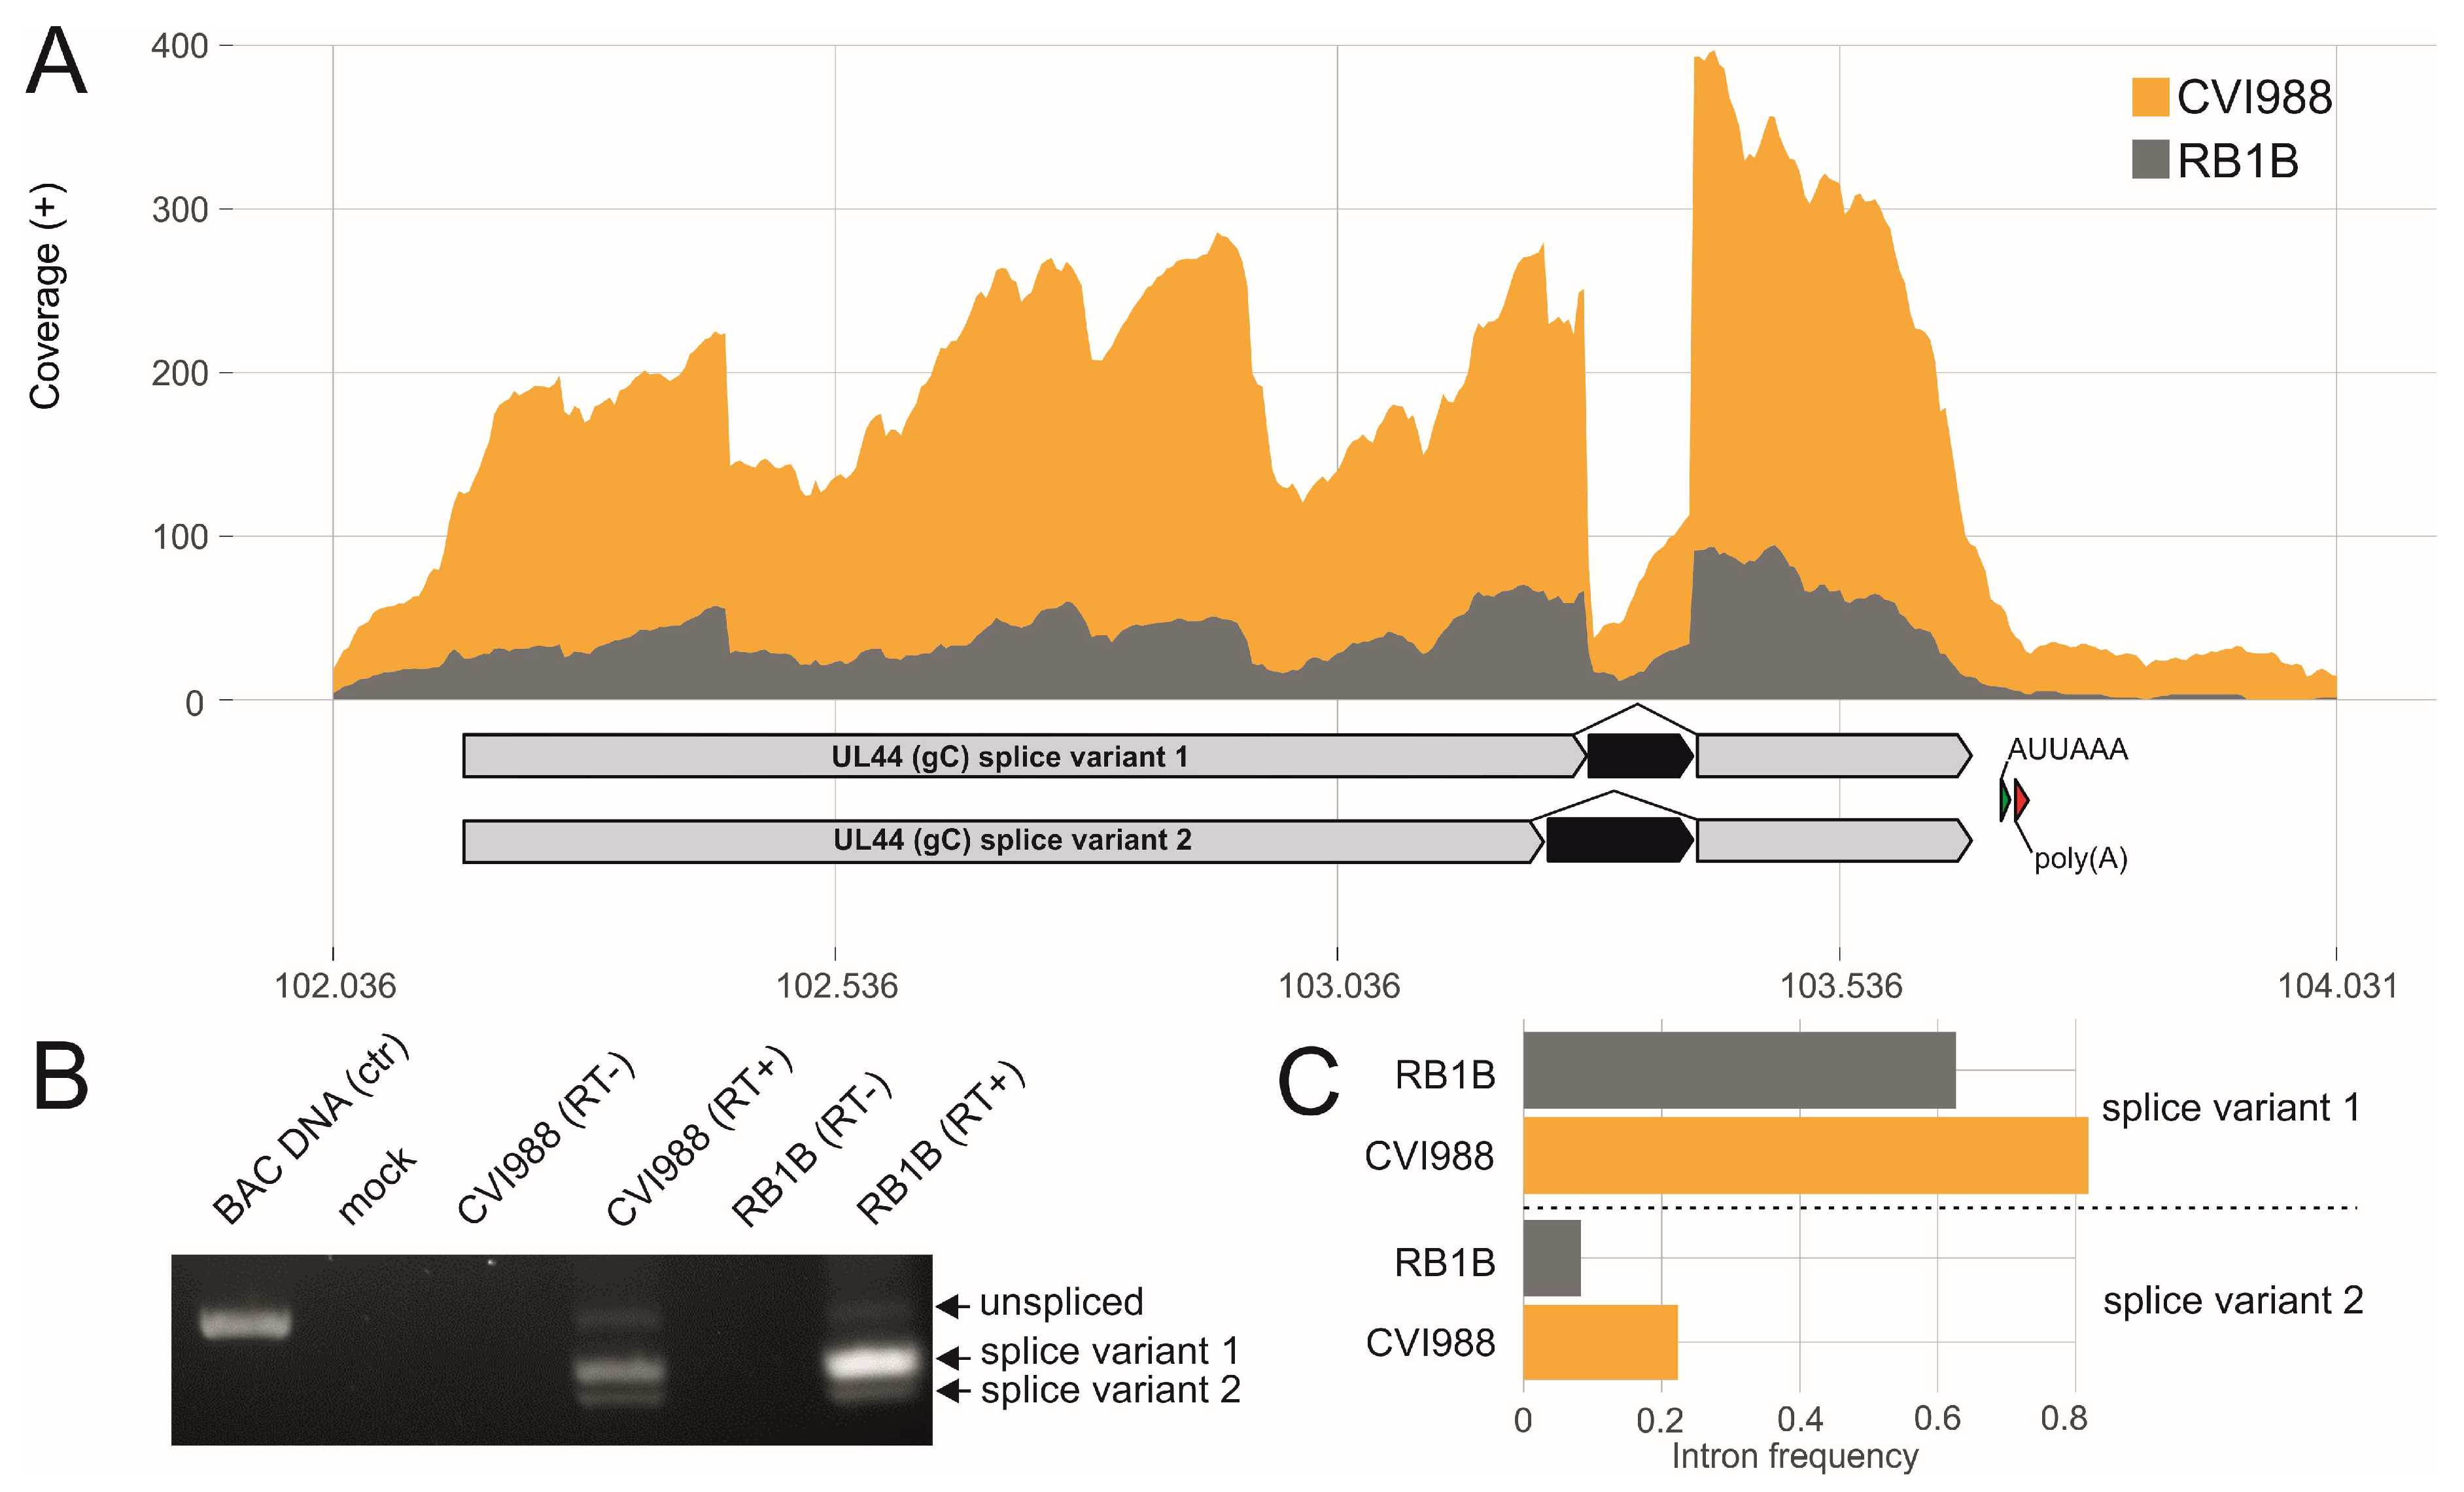
3.2. Splicing of Polycistronic MDV Transcripts
3.3. The Transcriptional Makeup of the MDV Unique Long Region (UL).
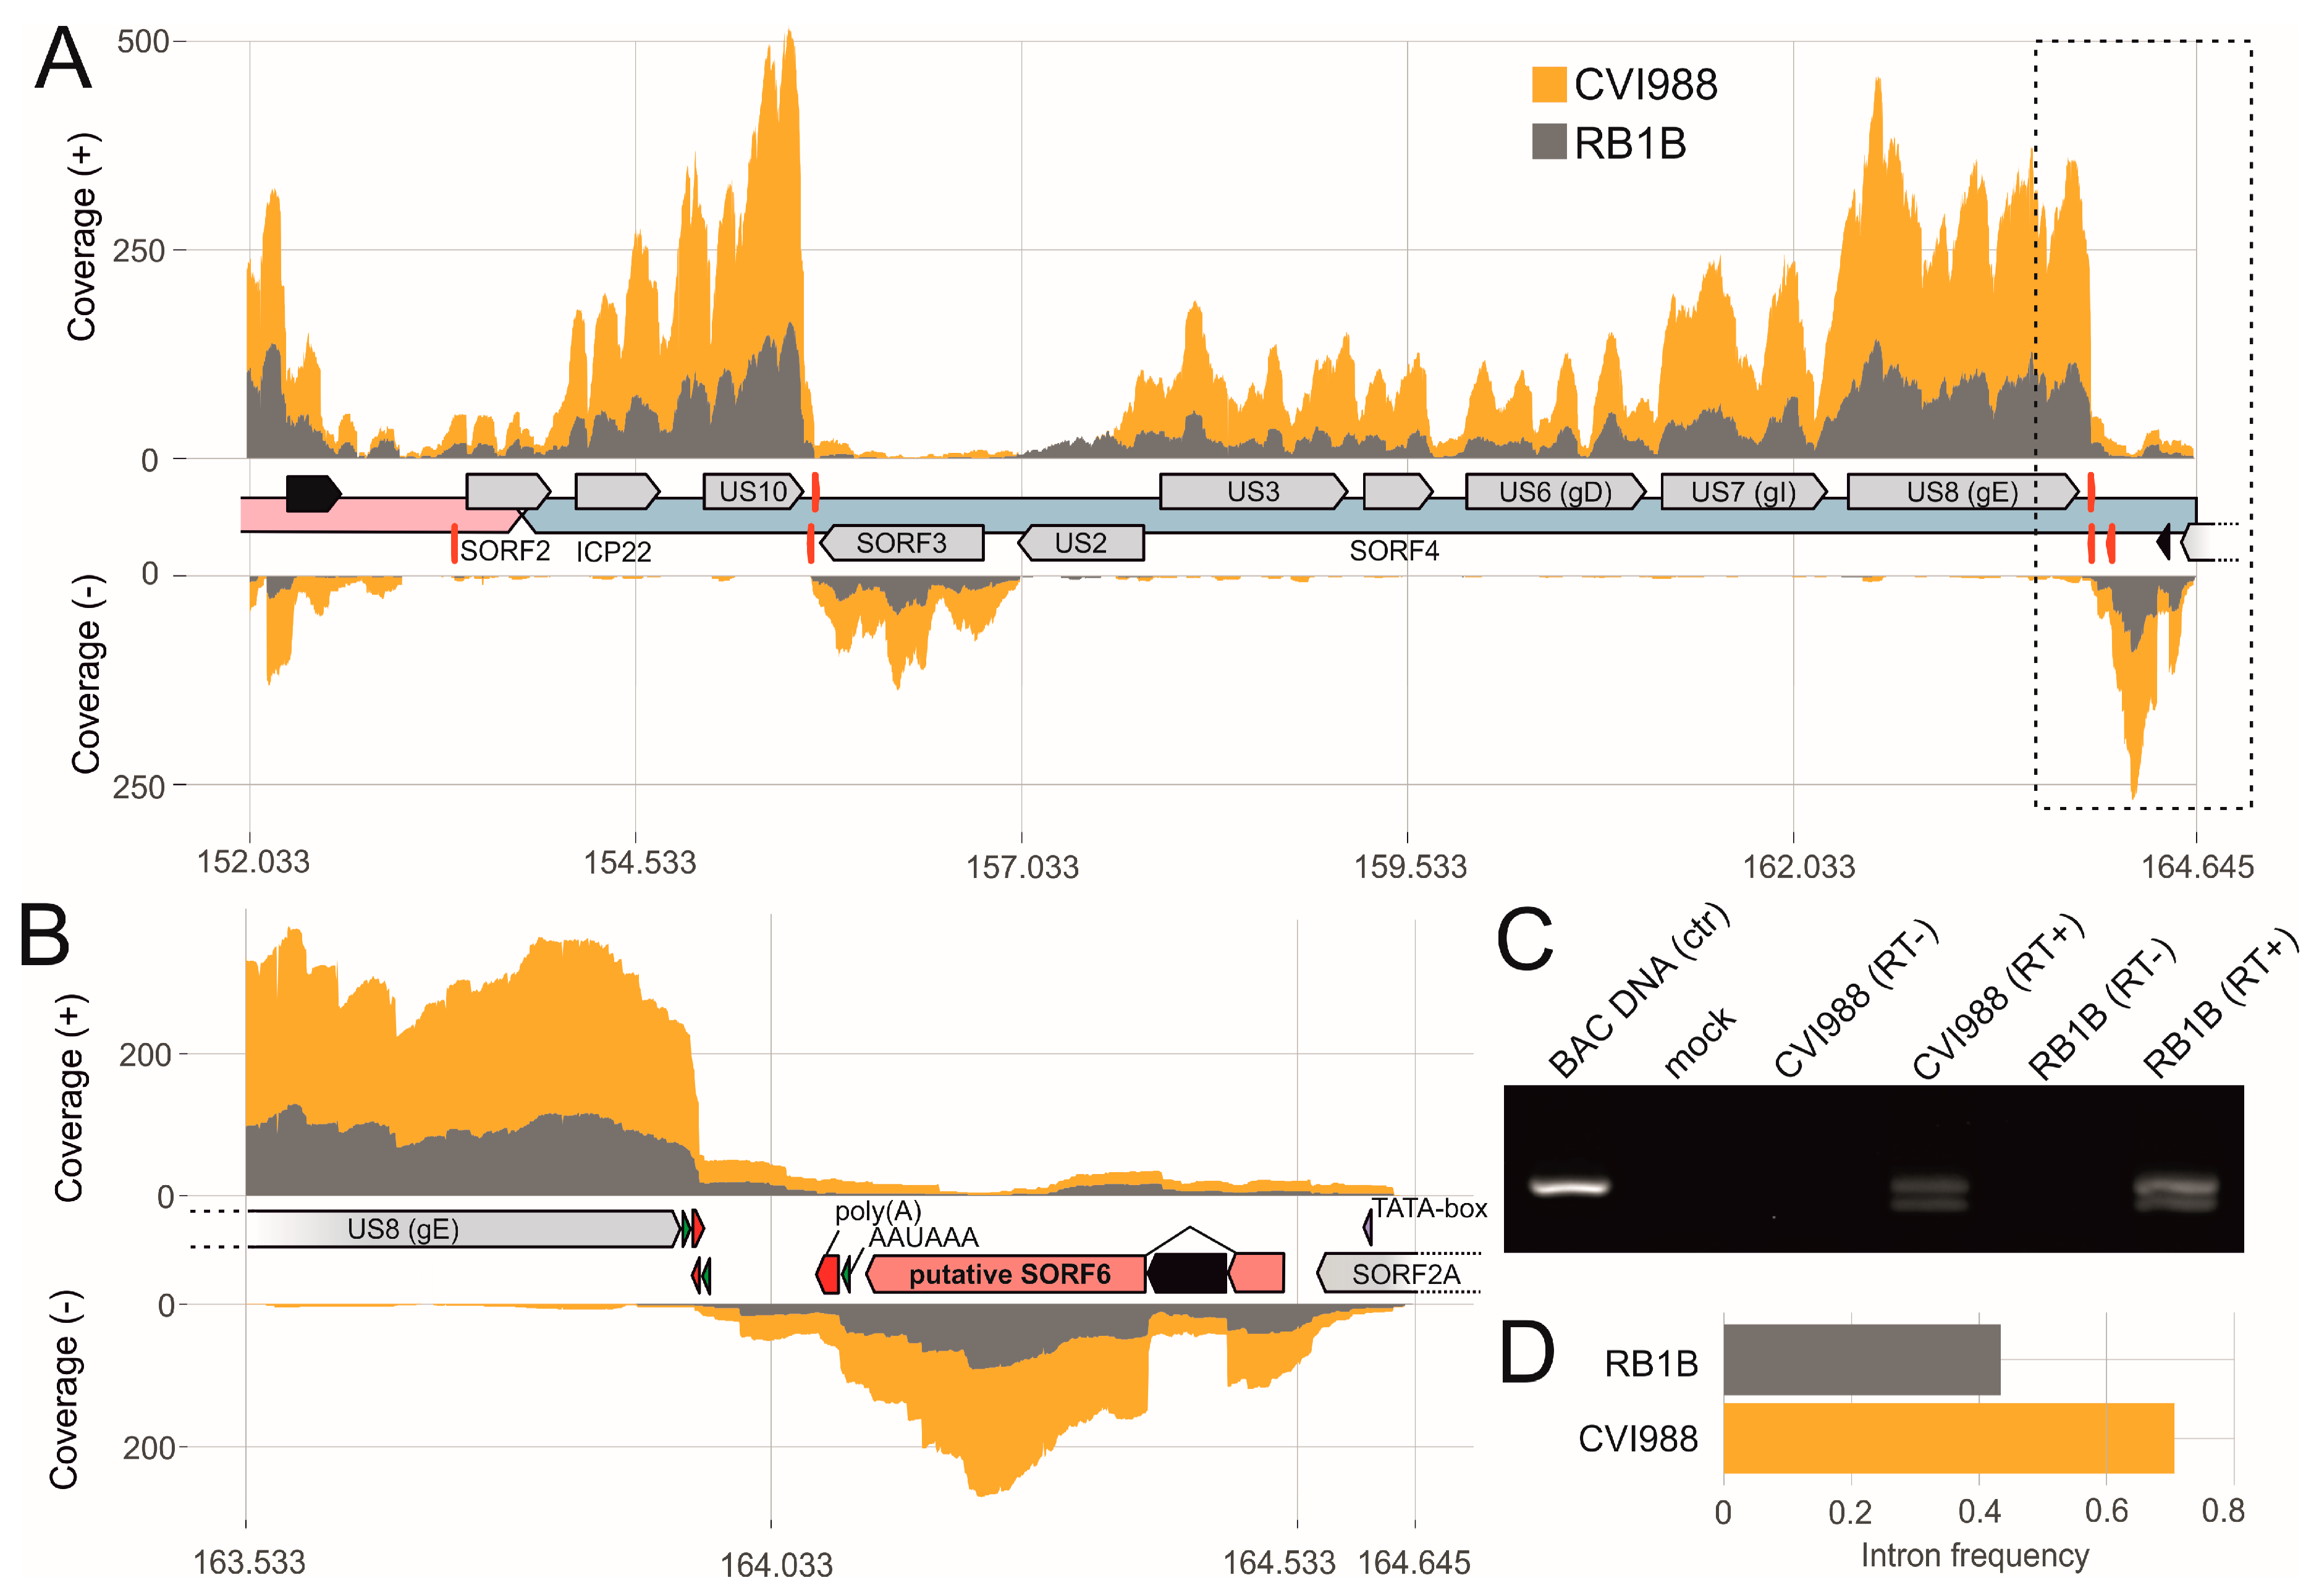
3.4. The Transcriptional Makeup of the MDV Unique Short Region (US).
3.5. The Transcriptional Makeup of the MDV Repeat Regions
3.6. MDV Noncoding RNAs
4. Conclusions
Supplementary Materials
Author Contributions
Funding
Acknowledgments
Conflicts of Interest
References
- Nair, V. Evolution of Marek’s disease—A paradigm for incessant race between the pathogen and the host. Vet. J. 2005, 170, 175–183. [Google Scholar] [CrossRef]
- Davison, T.F.; Nair, V. Marek’s Disease: An Evolving Problem; Elsevier: Amsterdam, The Netherlands, 2004. [Google Scholar]
- Davison, F.; Nair, V. Use of Marek’s disease vaccines: Could they be driving the virus to increasing virulence? Expert Rev. Vaccines 2005, 4, 77–88. [Google Scholar] [CrossRef]
- Witter, R.L. Increased virulence of Marek’s disease virus field isolates. Avian Dis. 1997, 41, 149–163. [Google Scholar] [CrossRef]
- Baigent, S.J.; Nair, V.K.; Le Galludec, H. Real-time PCR for differential quantification of CVI988 vaccine virus and virulent strains of Marek’s disease virus. J. Virol. Methods 2016, 233, 23–36. [Google Scholar] [CrossRef] [Green Version]
- Jarosinski, K.W.; Tischer, B.K.; Trapp, S.; Osterrieder, N. Marek’s disease virus: Lytic replication, oncogenesis and control. Expert Rev. Vaccines 2006, 5, 761–772. [Google Scholar] [CrossRef]
- Baigent, S.J.; Ross, L.J.; Davison, T.F. Differential susceptibility to Marek’s disease is associated with differences in number, but not phenotype or location, of pp38+ lymphocytes. J. Gen. Virol. 1998, 79 Pt 11, 2795–2802. [Google Scholar] [CrossRef]
- Baaten, B.J.; Staines, K.A.; Smith, L.P.; Skinner, H.; Davison, T.F.; Butter, C. Early replication in pulmonary B cells after infection with Marek’s disease herpesvirus by the respiratory route. Viral Immunol. 2009, 22, 431–444. [Google Scholar] [CrossRef]
- Shek, W.; Calnek, B.; Schat, K.; Chen, C. Characterization of Marek’s disease virus-infected lymphocytes: Discrimination between cytolytically and latently infected cells. J. Natl. Cancer Inst. 1983, 70, 485–491. [Google Scholar]
- Bertzbach, L.D.; Laparidou, M.; Hartle, S.; Etches, R.J.; Kaspers, B.; Schusser, B.; Kaufer, B.B. Unraveling the role of B cells in the pathogenesis of an oncogenic avian herpesvirus. Proc. Natl. Acad. Sci. USA 2018, 115, 11603–11607. [Google Scholar] [CrossRef]
- Calnek, B.W.; Schat, K.A.; Ross, L.J.; Shek, W.R.; Chen, C.L. Further characterization of Marek’s disease virus-infected lymphocytes. I. In vivo infection. Int. J. Cancer 1984, 33, 389–398. [Google Scholar] [CrossRef]
- Tulman, E.R.; Afonso, C.L.; Lu, Z.; Zsak, L.; Rock, D.L.; Kutish, G.F. The genome of a very virulent Marek’s disease virus. J. Virol. 2000, 74, 7980–7988. [Google Scholar] [CrossRef]
- Davison, A.J. Comparative analysis of the genomes. In Human Herpesviruses: Biology, Therapy, and Immunoprophylaxis; Arvin, A., Campadelli-Fiume, G., Mocarski, E., Moore, P.S., Roizman, B., Whitley, R., Yamanishi, K., Eds.; Cambridge University Press: Cambridge, UK, 2007. [Google Scholar]
- Bertzbach, L.D.; Kheimar, A.; Ali, F.A.Z.; Kaufer, B.B. Viral Factors Involved in Marek’s Disease Virus (MDV) Pathogenesis. Curr. Clin. Microbiol. Rep. 2018, 5, 238–244. [Google Scholar] [CrossRef]
- Heidari, M.; Huebner, M.; Kireev, D.; Silva, R.F. Transcriptional profiling of Marek’s disease virus genes during cytolytic and latent infection. Virus Genes 2008, 36, 383–392. [Google Scholar] [CrossRef]
- Neerukonda, S.N.; Tavlarides-Hontz, P.; McCarthy, F.; Pendarvis, K.; Parcells, M.S. Comparison of the Transcriptomes and Proteomes of Serum Exosomes from Marek’s Disease Virus-Vaccinated and Protected and Lymphoma-Bearing Chickens. Genes 2019, 10, 116. [Google Scholar] [CrossRef]
- Mwangi, W.N.; Vasoya, D.; Kgosana, L.B.; Watson, M.; Nair, V. Differentially expressed genes during spontaneous lytic switch of Marek’s disease virus in lymphoblastoid cell lines determined by global gene expression profiling. J. Gen. Virol. 2017, 98, 779–790. [Google Scholar] [CrossRef]
- Baigent, S.J.; Ross, L.J.; Davison, T.F. A flow cytometric method for identifying Marek’s disease virus pp38 expression in lymphocyte subpopulations. Avian Pathol. 1996, 25, 255–267. [Google Scholar] [CrossRef]
- Schermuly, J.; Greco, A.; Hartle, S.; Osterrieder, N.; Kaufer, B.B.; Kaspers, B. In vitro model for lytic replication, latency, and transformation of an oncogenic alphaherpesvirus. Proc. Natl. Acad. Sci. USA 2015, 112, 7279–7284. [Google Scholar] [CrossRef] [Green Version]
- Schat, K.; Purchase, H. Cell-Culture Methods. A Laboratory Manual for the Isolation and Identification of Avian Pathogens; American Association of Avian Pathologists: Kennett Square, PA, USA, 1998. [Google Scholar]
- Martin, A.; Lillehoj, H.S.; Kaspers, B.; Bacon, L.D. Antigen-specific T cell proliferation following coccidia infection. Poult Sci. 1993, 72, 2084–2094. [Google Scholar] [CrossRef]
- Kothlow, S.; Morgenroth, I.; Tregaskes, C.A.; Kaspers, B.; Young, J.R. CD40 ligand supports the long-term maintenance and differentiation of chicken B cells in culture. Dev. Comp. Immunol. 2008, 32, 1015–1026. [Google Scholar] [CrossRef]
- Engel, A.T.; Selvaraj, R.K.; Kamil, J.P.; Osterrieder, N.; Kaufer, B.B. Marek’s disease viral interleukin-8 promotes lymphoma formation through targeted recruitment of B cells and CD4+ CD25+ T cells. J. Virol. 2012, 86, 8536–8545. [Google Scholar] [CrossRef]
- Pfaff, F.; Hägglund, S.; Zoli, M.; Blaise-Boisseau, S.; Laloy, E.; Koethe, S.; Zühlke, D.; Riedel, K.; Zientara, S.; Bakkali-Kassimi, L.; et al. Proteogenomics Uncovers Critical Elements of Host Response in Bovine Soft Palate Epithelial Cells Following In Vitro Infection with Foot-And-Mouth Disease Virus. Viruses 2019, 11, 53. [Google Scholar] [CrossRef]
- Dobin, A.; Davis, C.A.; Schlesinger, F.; Drenkow, J.; Zaleski, C.; Jha, S.; Batut, P.; Chaisson, M.; Gingeras, T.R. STAR: Ultrafast universal RNA-seq aligner. Bioinformatics 2013, 29, 15–21. [Google Scholar] [CrossRef]
- Lee, L.F.; Wu, P.; Sui, D.; Ren, D.; Kamil, J.; Kung, H.J.; Witter, R.L. The complete unique long sequence and the overall genomic organization of the GA strain of Marek’s disease virus. Proc. Natl. Acad. Sci. USA 2000, 97, 6091–6096. [Google Scholar] [CrossRef]
- Davison, A.J. Herpesvirus systematics. Vet. Microbiol. 2010, 143, 52–69. [Google Scholar] [CrossRef] [Green Version]
- Li, H.; Handsaker, B.; Wysoker, A.; Fennell, T.; Ruan, J.; Homer, N.; Marth, G.; Abecasis, G.; Durbin, R. 1000 Genome Project Data Processing Subgroup. The Sequence Alignment/Map format and SAMtools. Bioinformatics 2009, 25, 2078–2079. [Google Scholar] [CrossRef]
- Quinlan, A.R.; Hall, I.M. BEDTools: A flexible suite of utilities for comparing genomic features. Bioinformatics 2010, 26, 841–842. [Google Scholar] [CrossRef]
- R Core Team. R: A Language and Environment for Statistical Computing; R Core Team: Vienna, Austria, 2017. [Google Scholar]
- Wagih, O. ggseqlogo: A versatile R package for drawing sequence logos. Bioinformatics 2017, 33, 3645–3647. [Google Scholar] [CrossRef]
- Bonfert, T.; Kirner, E.; Csaba, G.; Zimmer, R.; Friedel, C.C. ContextMap 2: Fast and accurate context-based RNA-seq mapping. BMC Bioinform. 2015, 16, 122. [Google Scholar] [CrossRef]
- Langmead, B.; Salzberg, S.L. Fast gapped-read alignment with Bowtie 2. Nat. Methods 2012, 9, 357–359. [Google Scholar] [CrossRef] [Green Version]
- Pauws, E.; van Kampen, A.H.; van de Graaf, S.A.; de Vijlder, J.J.; Ris-Stalpers, C. Heterogeneity in polyadenylation cleavage sites in mammalian mRNA sequences: Implications for SAGE analysis. Nucl. Acids Res. 2001, 29, 1690–1694. [Google Scholar] [CrossRef]
- Bailey, T.L.; Boden, M.; Buske, F.A.; Frith, M.; Grant, C.E.; Clementi, L.; Ren, J.; Li, W.W.; Noble, W.S. MEME SUITE: Tools for motif discovery and searching. Nucl. Acids Res. 2009, 37, W202–W208. [Google Scholar] [CrossRef]
- Grant, C.E.; Bailey, T.L.; Noble, W.S. FIMO: Scanning for occurrences of a given motif. Bioinformatics 2011, 27, 1017–1018. [Google Scholar] [CrossRef]
- Patro, R.; Duggal, G.; Love, M.I.; Irizarry, R.A.; Kingsford, C. Salmon provides fast and bias-aware quantification of transcript expression. Nat. Methods 2017, 14, 417–419. [Google Scholar] [CrossRef]
- Love, M.I.; Huber, W.; Anders, S. Moderated estimation of fold change and dispersion for RNA-seq data with DESeq2. Genome Biol. 2014, 15, 550. [Google Scholar] [CrossRef]
- Blom, N.; Gammeltoft, S.; Brunak, S. Sequence and structure-based prediction of eukaryotic protein phosphorylation sites. J. Mol. Biol. 1999, 294, 1351–1362. [Google Scholar] [CrossRef]
- Szilagyi, A.; Skolnick, J. Efficient prediction of nucleic acid binding function from low-resolution protein structures. J. Mol. Biol. 2006, 358, 922–933. [Google Scholar] [CrossRef]
- Neuhoff, V.; Arold, N.; Taube, D.; Ehrhardt, W. Improved staining of proteins in polyacrylamide gels including isoelectric focusing gels with clear background at nanogram sensitivity using Coomassie Brilliant Blue G-250 and R-250. Electrophoresis 1988, 9, 255–262. [Google Scholar] [CrossRef]
- Laemmli, U.K. Cleavage of structural proteins during the assembly of the head of bacteriophage T4. Nature 1970, 227, 680–685. [Google Scholar] [CrossRef]
- Wisniewski, J.R.; Zougman, A.; Nagaraj, N.; Mann, M. Universal sample preparation method for proteome analysis. Nat. Methods 2009, 6, 359–362. [Google Scholar] [CrossRef]
- Boersema, P.J.; Aye, T.T.; van Veen, T.A.; Heck, A.J.; Mohammed, S. Triplex protein quantification based on stable isotope labeling by peptide dimethylation applied to cell and tissue lysates. Proteomics 2008, 8, 4624–4632. [Google Scholar] [CrossRef]
- Pauker, V.I.; Bertzbach, L.D.; Hohmann, A.; Kheimar, A.; Teifke, J.P.; Mettenleiter, T.C.; Karger, A.; Kaufer, B.B. Imaging Mass Spectrometry and Proteome Analysis of Marek’s Disease Virus-Induced Tumors. mSphere 2019, 4. [Google Scholar] [CrossRef]
- Henning, A.K.; Groschup, M.H.; Mettenleiter, T.C.; Karger, A. Analysis of the bovine plasma proteome by matrix-assisted laser desorption/ionisation time-of-flight tandem mass spectrometry. Vet. J. 2014, 199, 175–180. [Google Scholar] [CrossRef]
- Aken, B.L.; Achuthan, P.; Akanni, W.; Amode, M.R.; Bernsdorff, F.; Bhai, J.; Billis, K.; Carvalho-Silva, D.; Cummins, C.; Clapham, P.; et al. Ensembl 2017. Nucl. Acids Res. 2017, 45, D635–D642. [Google Scholar] [CrossRef]
- Ishihama, Y.; Oda, Y.; Tabata, T.; Sato, T.; Nagasu, T.; Rappsilber, J.; Mann, M. Exponentially modified protein abundance index (emPAI) for estimation of absolute protein amount in proteomics by the number of sequenced peptides per protein. Mol. Cell. Proteom. 2005, 4, 1265–1272. [Google Scholar] [CrossRef]
- Chakraborty, P.; Kuo, R.; Vervelde, L.; Dutia, B.M.; Kaiser, P.; Smith, J. Macrophages from Susceptible and Resistant Chicken Lines have Different Transcriptomes following Marek’s Disease Virus Infection. Genes 2019, 10, 74. [Google Scholar] [CrossRef]
- Tahiri-Alaoui, A.; Smith, L.P.; Kgosana, L.; Petherbridge, L.J.; Nair, V. Identification of a neurovirulence factor from Marek’s disease virus. Avian Dis. 2013, 57, 387–394. [Google Scholar] [CrossRef] [PubMed]
- Hong, Y.; Coussens, P.M. Identification of an immediate-early gene in the Marek’s disease virus long internal repeat region which encodes a unique 14-kilodalton polypeptide. J. Virol. 1994, 68, 3593–3603. [Google Scholar] [PubMed]
- Tahiri-Alaoui, A.; Smith, L.P.; Baigent, S.; Kgosana, L.; Petherbridge, L.J.; Lambeth, L.S.; James, W.; Nair, V. Identification of an intercistronic internal ribosome entry site in a Marek’s disease virus immediate-early gene. J. Virol. 2009, 83, 5846–5853. [Google Scholar] [CrossRef]
- Hearn, C.; Preeyanon, L.; Hunt, H.D.; York, I.A. An MHC class I immune evasion gene of Mareks disease virus. Virology 2015, 475, 88–95. [Google Scholar] [CrossRef]
- Becker, Y.; Asher, Y.; Tabor, E.; Davidson, I.; Malkinson, M. Open reading frames in a 4556 nucleotide sequence within MDV-1 BamHI-D DNA fragment: Evidence for splicing of mRNA from a new viral glycoprotein gene. Virus Genes 1994, 8, 55–69. [Google Scholar] [CrossRef]
- Schippers, T.; Jarosinski, K.; Osterrieder, N. The ORF012 gene of Marek’s disease virus type 1 produces a spliced transcript and encodes a novel nuclear phosphoprotein essential for virus growth. J. Virol. 2015, 89, 1348–1363. [Google Scholar] [CrossRef] [PubMed]
- Jarosinski, K.W.; Osterrieder, N. Marek’s disease virus expresses multiple UL44 (gC) variants through mRNA splicing that are all required for efficient horizontal transmission. J. Virol. 2012, 86, 7896–7906. [Google Scholar] [CrossRef] [PubMed]
- Liu, J.L.; Lin, S.F.; Xia, L.; Brunovskis, P.; Li, D.; Davidson, I.; Lee, L.F.; Kung, H.J. MEQ and V-IL8: Cellular genes in disguise? Acta Virol. 1999, 43, 94–101. [Google Scholar] [PubMed]
- Tombacz, D.; Csabai, Z.; Szucs, A.; Balazs, Z.; Moldovan, N.; Sharon, D.; Snyder, M.; Boldogkoi, Z. Long-Read Isoform Sequencing Reveals a Hidden Complexity of the Transcriptional Landscape of Herpes Simplex Virus Type 1. Front. Microbiol. 2017, 8, 1079. [Google Scholar] [CrossRef] [PubMed]
- Gimeno, I.; Silva, R.F. Deletion of the Marek’s disease virus UL41 gene (vhs) has no measurable effect on latency or pathogenesis. Virus Genes 2008, 36, 499–507. [Google Scholar] [CrossRef] [PubMed]
- Sadek, J.; Read, G.S. The Splicing History of an mRNA Affects Its Level of Translation and Sensitivity to Cleavage by the Virion Host Shutoff Endonuclease during Herpes Simplex Virus Infections. J. Virol. 2016, 90, 10844–10856. [Google Scholar] [CrossRef] [PubMed] [Green Version]
- Mandel, C.R.; Bai, Y.; Tong, L. Protein factors in pre-mRNA 3′-end processing. Cell. Mol. Life Sci. 2008, 65, 1099–1122. [Google Scholar] [CrossRef]
- Proudfoot, N.J. Ending the message: Poly(A) signals then and now. Genes Dev. 2011, 25, 1770–1782. [Google Scholar] [CrossRef]
- Kamil, J.P.; Tischer, B.K.; Trapp, S.; Nair, V.K.; Osterrieder, N.; Kung, H.J. vLIP, a viral lipase homologue, is a virulence factor of Marek’s disease virus. J. Virol. 2005, 79, 6984–6996. [Google Scholar] [CrossRef]
- Hardy, W.R.; Sandri-Goldin, R.M. Herpes-Simplex Virus Inhibits Host-Cell Splicing, and Regulatory Protein Icp27 Is Required for This Effect. J. Virol. 1994, 68, 7790–7799. [Google Scholar] [PubMed]
- Zhu, H.; Li, H.; Han, Z.; Shao, Y.; Wang, Y.; Kong, X. Identification of a spliced gene from duck enteritis virus encoding a protein homologous to UL15 of herpes simplex virus 1. Virol. J. 2011, 8, 156. [Google Scholar] [CrossRef] [PubMed]
- Zhu, G.S.; Iwata, A.; Gong, M.; Ueda, S.; Hirai, K. Marek’s disease virus type 1-specific phosphorylated proteins pp38 and pp24 with common amino acid termini are encoded from the opposite junction regions between the long unique and inverted repeat sequences of viral genome. Virology 1994, 200, 816–820. [Google Scholar] [CrossRef]
- Lv, H.; Zhang, Y.; Sun, G.; Bao, K.; Gao, Y.; Qi, X.; Cui, H.; Wang, Y.; Li, K.; Gao, L.; et al. Genetic evolution of Gallid herpesvirus 2 isolated in China. Infect. Genet. Evol. 2017, 51, 263–274. [Google Scholar] [CrossRef] [PubMed]
- Morgan, R.W.; Xie, Q.; Cantello, J.L.; Miles, A.M.; Bernberg, E.L.; Kent, J.; Anderson, A. Marek’s disease virus latency. Curr. Top. Microbiol. Immunol. 2001, 255, 223–243. [Google Scholar]
- Cantello, J.L.; Parcells, M.S.; Anderson, A.S.; Morgan, R.W. Marek’s disease virus latency-associated transcripts belong to a family of spliced RNAs that are antisense to the ICP4 homolog gene. J. Virol. 1997, 71, 1353–1361. [Google Scholar] [PubMed]
- Burnside, J.; Bernberg, E.; Anderson, A.; Lu, C.; Meyers, B.C.; Green, P.J.; Jain, N.; Isaacs, G.; Morgan, R.W. Marek’s disease virus encodes MicroRNAs that map to meq and the latency-associated transcript. J. Virol. 2006, 80, 8778–8786. [Google Scholar] [CrossRef] [PubMed]
- Yao, Y.; Zhao, Y.; Xu, H.; Smith, L.P.; Lawrie, C.H.; Watson, M.; Nair, V. MicroRNA profile of Marek’s disease virus-transformed T-cell line MSB-1: Predominance of virus-encoded microRNAs. J. Virol. 2008, 82, 4007–4015. [Google Scholar] [CrossRef]
- Jarosinski, K.W.; Schat, K.A. Multiple alternative splicing to exons II and III of viral interleukin-8 (vIL-8) in the Marek’s disease virus genome: The importance of vIL-8 exon I. Virus Genes 2007, 34, 9–22. [Google Scholar] [CrossRef]
- Anobile, J.M.; Arumugaswami, V.; Downs, D.; Czymmek, K.; Parcells, M.; Schmidt, C.J. Nuclear localization and dynamic properties of the Marek’s disease virus oncogene products Meq and Meq/vIL8. J. Virol. 2006, 80, 1160–1166. [Google Scholar] [CrossRef]
- Okada, T.; Takagi, M.; Murata, S.; Onuma, M.; Ohashi, K. Identification and characterization of a novel spliced form of the meq transcript in lymphoblastoid cell lines derived from Marek’s disease tumours. J. Gen. Virol. 2007, 88, 2111–2120. [Google Scholar] [CrossRef]
- Trapp, S.; Parcells, M.S.; Kamil, J.P.; Schumacher, D.; Tischer, B.K.; Kumar, P.M.; Nair, V.K.; Osterrieder, N. A virus-encoded telomerase RNA promotes malignant T cell lymphomagenesis. J. Exp. Med. 2006, 203, 1307–1317. [Google Scholar] [CrossRef] [PubMed] [Green Version]
- Tycowski, K.T.; Guo, Y.E.; Lee, N.; Moss, W.N.; Vallery, T.K.; Xie, M.; Steitz, J.A. Viral noncoding RNAs: More surprises. Genes Dev. 2015, 29, 567–584. [Google Scholar] [CrossRef] [PubMed]
- Zhuang, G.; Sun, A.; Teng, M.; Luo, J. A Tiny RNA that Packs a Big Punch: The Critical Role of a Viral miR-155 Ortholog in Lymphomagenesis in Marek’s Disease. Front. Microbiol. 2017, 8, 1169. [Google Scholar] [CrossRef] [PubMed]
- Figueroa, T.; Boumart, I.; Coupeau, D.; Rasschaert, D. Hyperediting by ADAR1 of a new herpesvirus lncRNA during the lytic phase of the oncogenic Marek’s disease virus. J. Gen. Virol. 2016, 97, 2973–2988. [Google Scholar] [CrossRef]
- Wyler, E.; Menegatti, J.; Franke, V.; Kocks, C.; Boltengagen, A.; Hennig, T.; Theil, K.; Rutkowski, A.; Ferrai, C.; Baer, L.; et al. Widespread activation of antisense transcription of the host genome during herpes simplex virus 1 infection. Genome Biol. 2017, 18, 209. [Google Scholar] [CrossRef] [PubMed]
- Greninger, A.L.; Knudsen, G.M.; Roychoudhury, P.; Hanson, D.J.; Sedlak, R.H.; Xie, H.; Guan, J.; Nguyen, T.; Peddu, V.; Boeckh, M.; et al. Comparative genomic, transcriptomic, and proteomic reannotation of human herpesvirus 6. BMC Genom. 2018, 19, 204. [Google Scholar] [CrossRef]
- Olah, P.; Tombacz, D.; Poka, N.; Csabai, Z.; Prazsak, I.; Boldogkoi, Z. Characterization of pseudorabies virus transcriptome by Illumina sequencing. BMC Microbiol. 2015, 15, 130. [Google Scholar] [CrossRef] [PubMed]
- Shabalina, S.A.; Ogurtsov, A.Y.; Spiridonov, N.A.; Koonin, E.V. Evolution at protein ends: Major contribution of alternative transcription initiation and termination to the transcriptome and proteome diversity in mammals. Nucl. Acids Res. 2014, 42, 7132–7144. [Google Scholar] [CrossRef] [PubMed]


© 2019 by the authors. Licensee MDPI, Basel, Switzerland. This article is an open access article distributed under the terms and conditions of the Creative Commons Attribution (CC BY) license (http://creativecommons.org/licenses/by/4.0/).
Share and Cite
Bertzbach, L.D.; Pfaff, F.; Pauker, V.I.; Kheimar, A.M.; Höper, D.; Härtle, S.; Karger, A.; Kaufer, B.B. The Transcriptional Landscape of Marek’s Disease Virus in Primary Chicken B Cells Reveals Novel Splice Variants and Genes. Viruses 2019, 11, 264. https://doi.org/10.3390/v11030264
Bertzbach LD, Pfaff F, Pauker VI, Kheimar AM, Höper D, Härtle S, Karger A, Kaufer BB. The Transcriptional Landscape of Marek’s Disease Virus in Primary Chicken B Cells Reveals Novel Splice Variants and Genes. Viruses. 2019; 11(3):264. https://doi.org/10.3390/v11030264
Chicago/Turabian StyleBertzbach, Luca D., Florian Pfaff, Viktoria I. Pauker, Ahmed M. Kheimar, Dirk Höper, Sonja Härtle, Axel Karger, and Benedikt B. Kaufer. 2019. "The Transcriptional Landscape of Marek’s Disease Virus in Primary Chicken B Cells Reveals Novel Splice Variants and Genes" Viruses 11, no. 3: 264. https://doi.org/10.3390/v11030264