Baseline Serum Vitamin A and D Levels Determine Benefit of Oral Vitamin A&D Supplements to Humoral Immune Responses Following Pediatric Influenza Vaccination

 , , , ,
Abstract
:1. Introduction
2. Materials and Methods
2.1. Clinical Protocol
2.1.1. Enrollment
2.1.2. Randomization and Masking
2.1.3. Vaccine Components
2.1.4. Blood Sample Collection
2.2. RBP, Retinol, and 25(OH)D Measurements
2.3. Hemagglutination Inhibition (HAI) Assay
2.4. Statistical Analyses
3. Results
3.1. Participant Characteristics
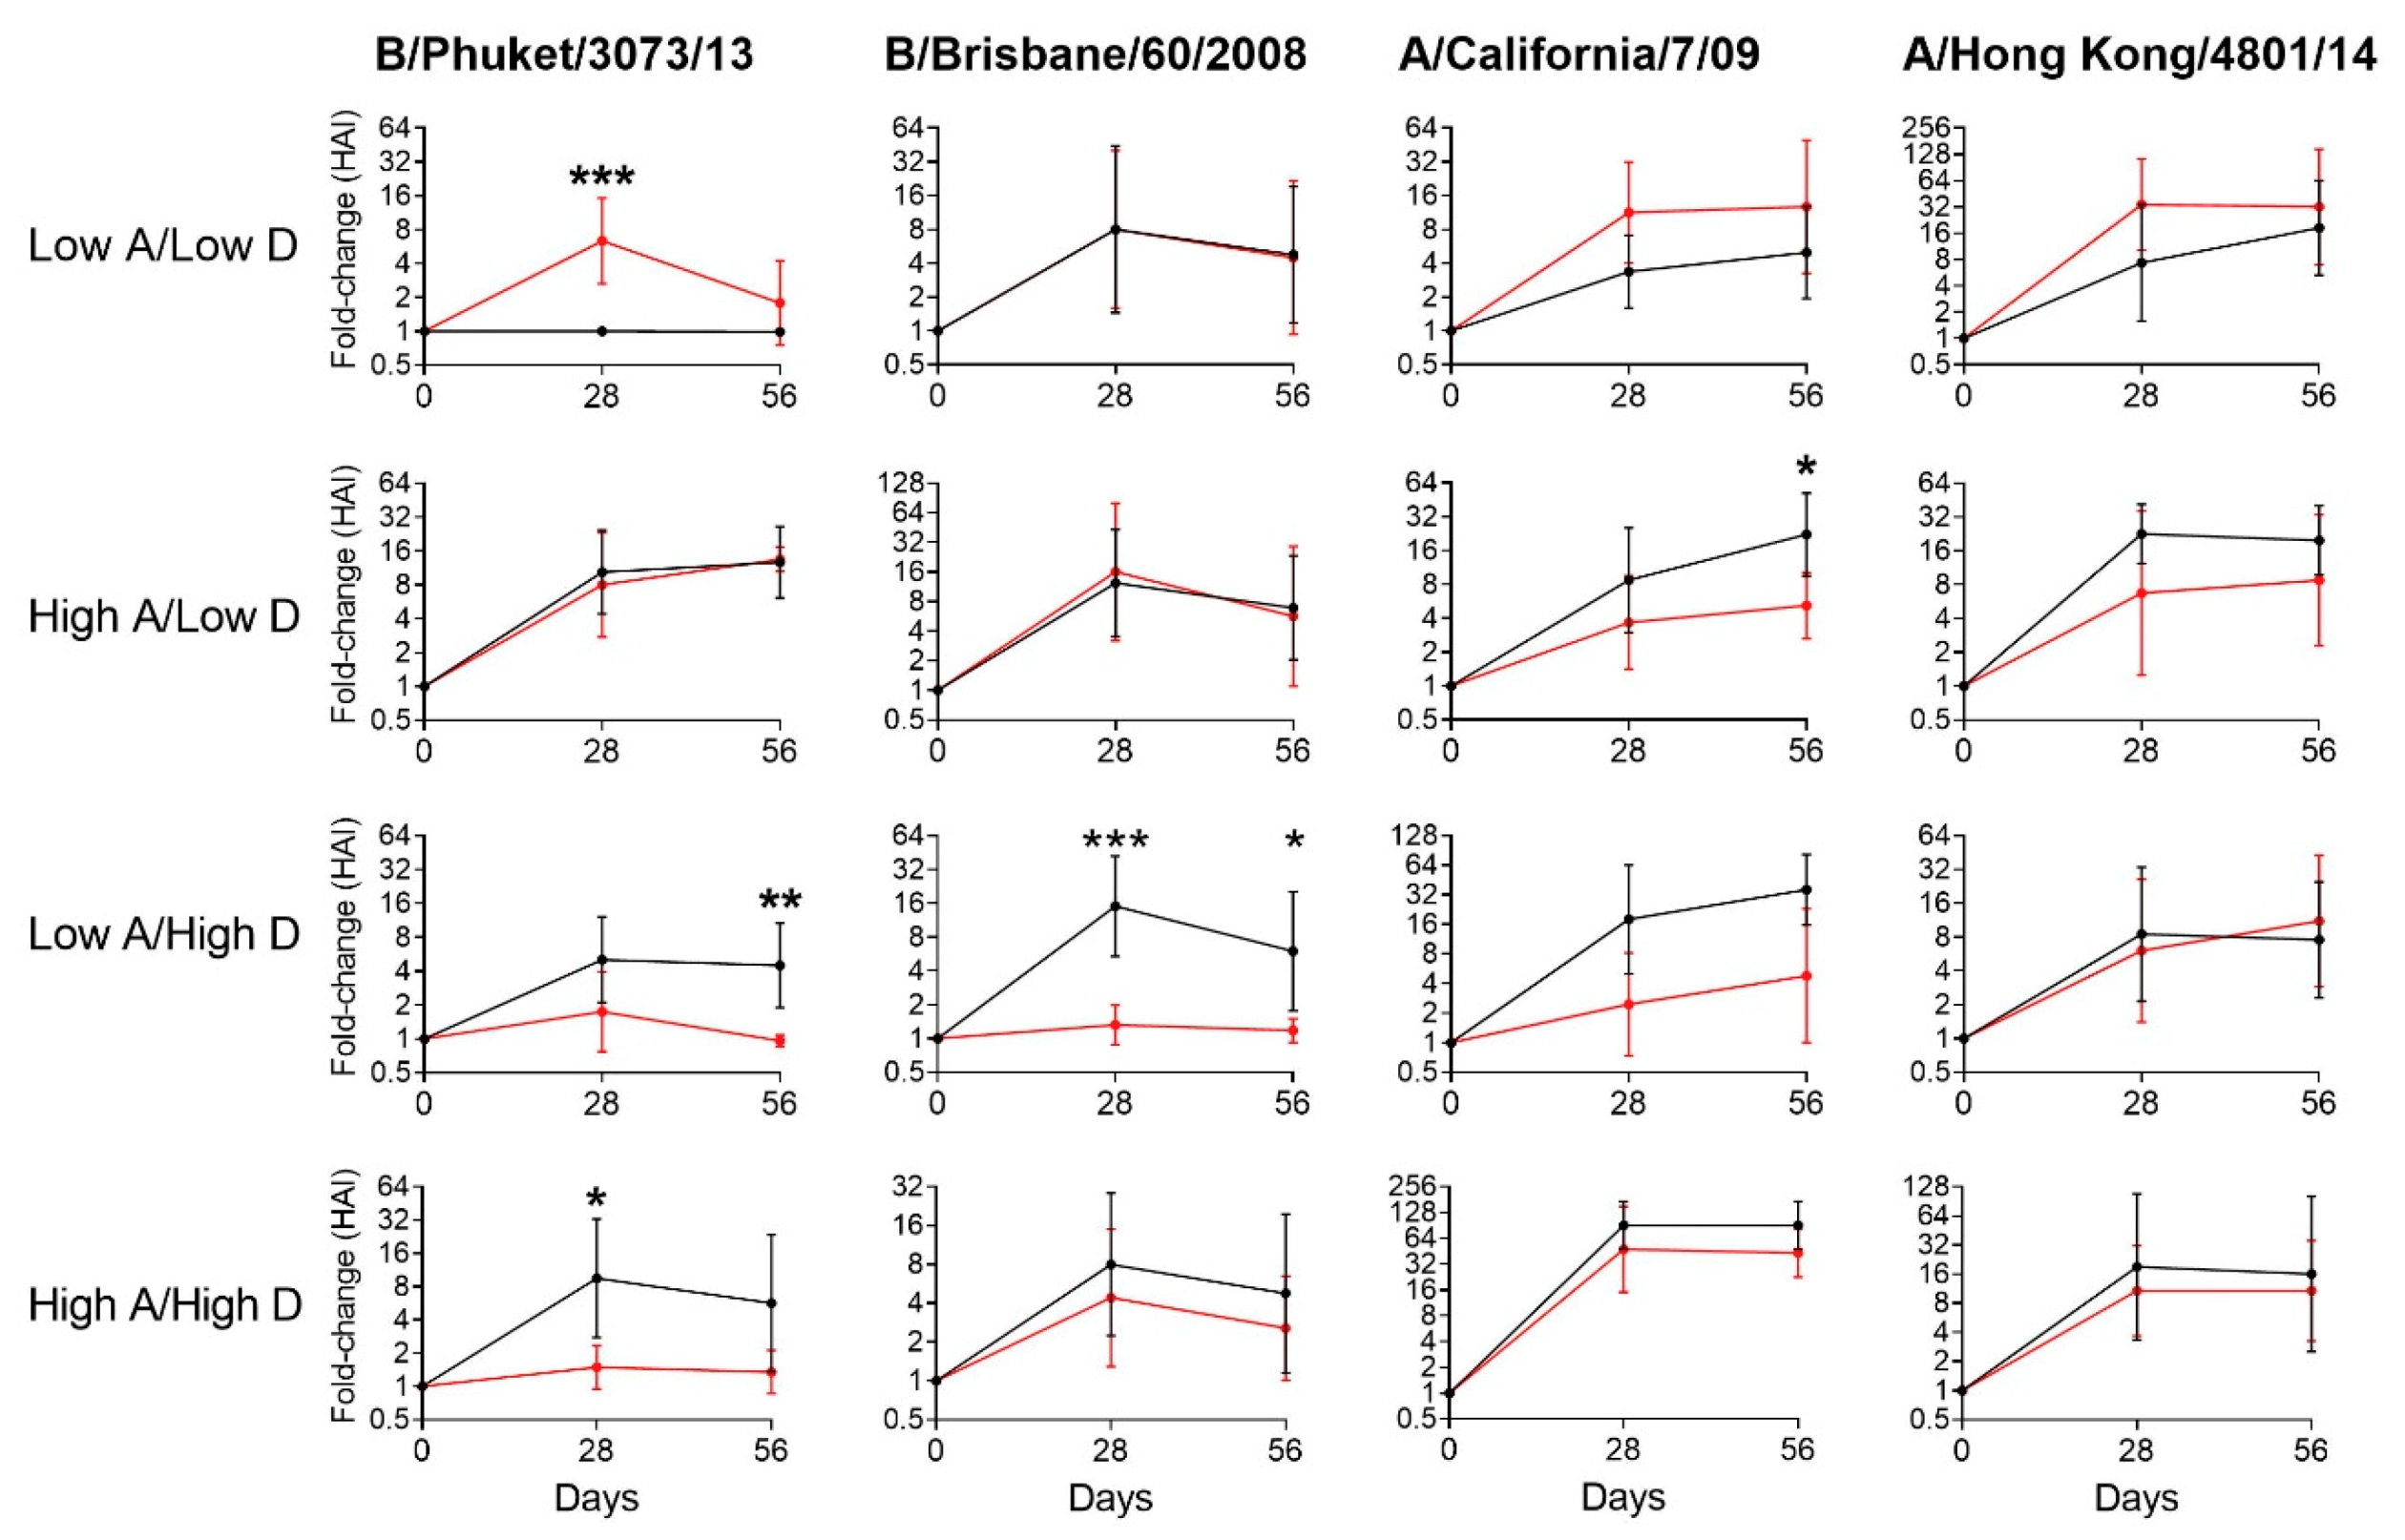
3.2. Vitamin Supplements were Beneficial to Children with Insufficient Vitamin A and D Levels at Baseline
3.3. Vitamin Supplements were Ineffective or Inhibitory of Vaccine Responses among Children with Sufficient Levels of Vitamins A and/or D
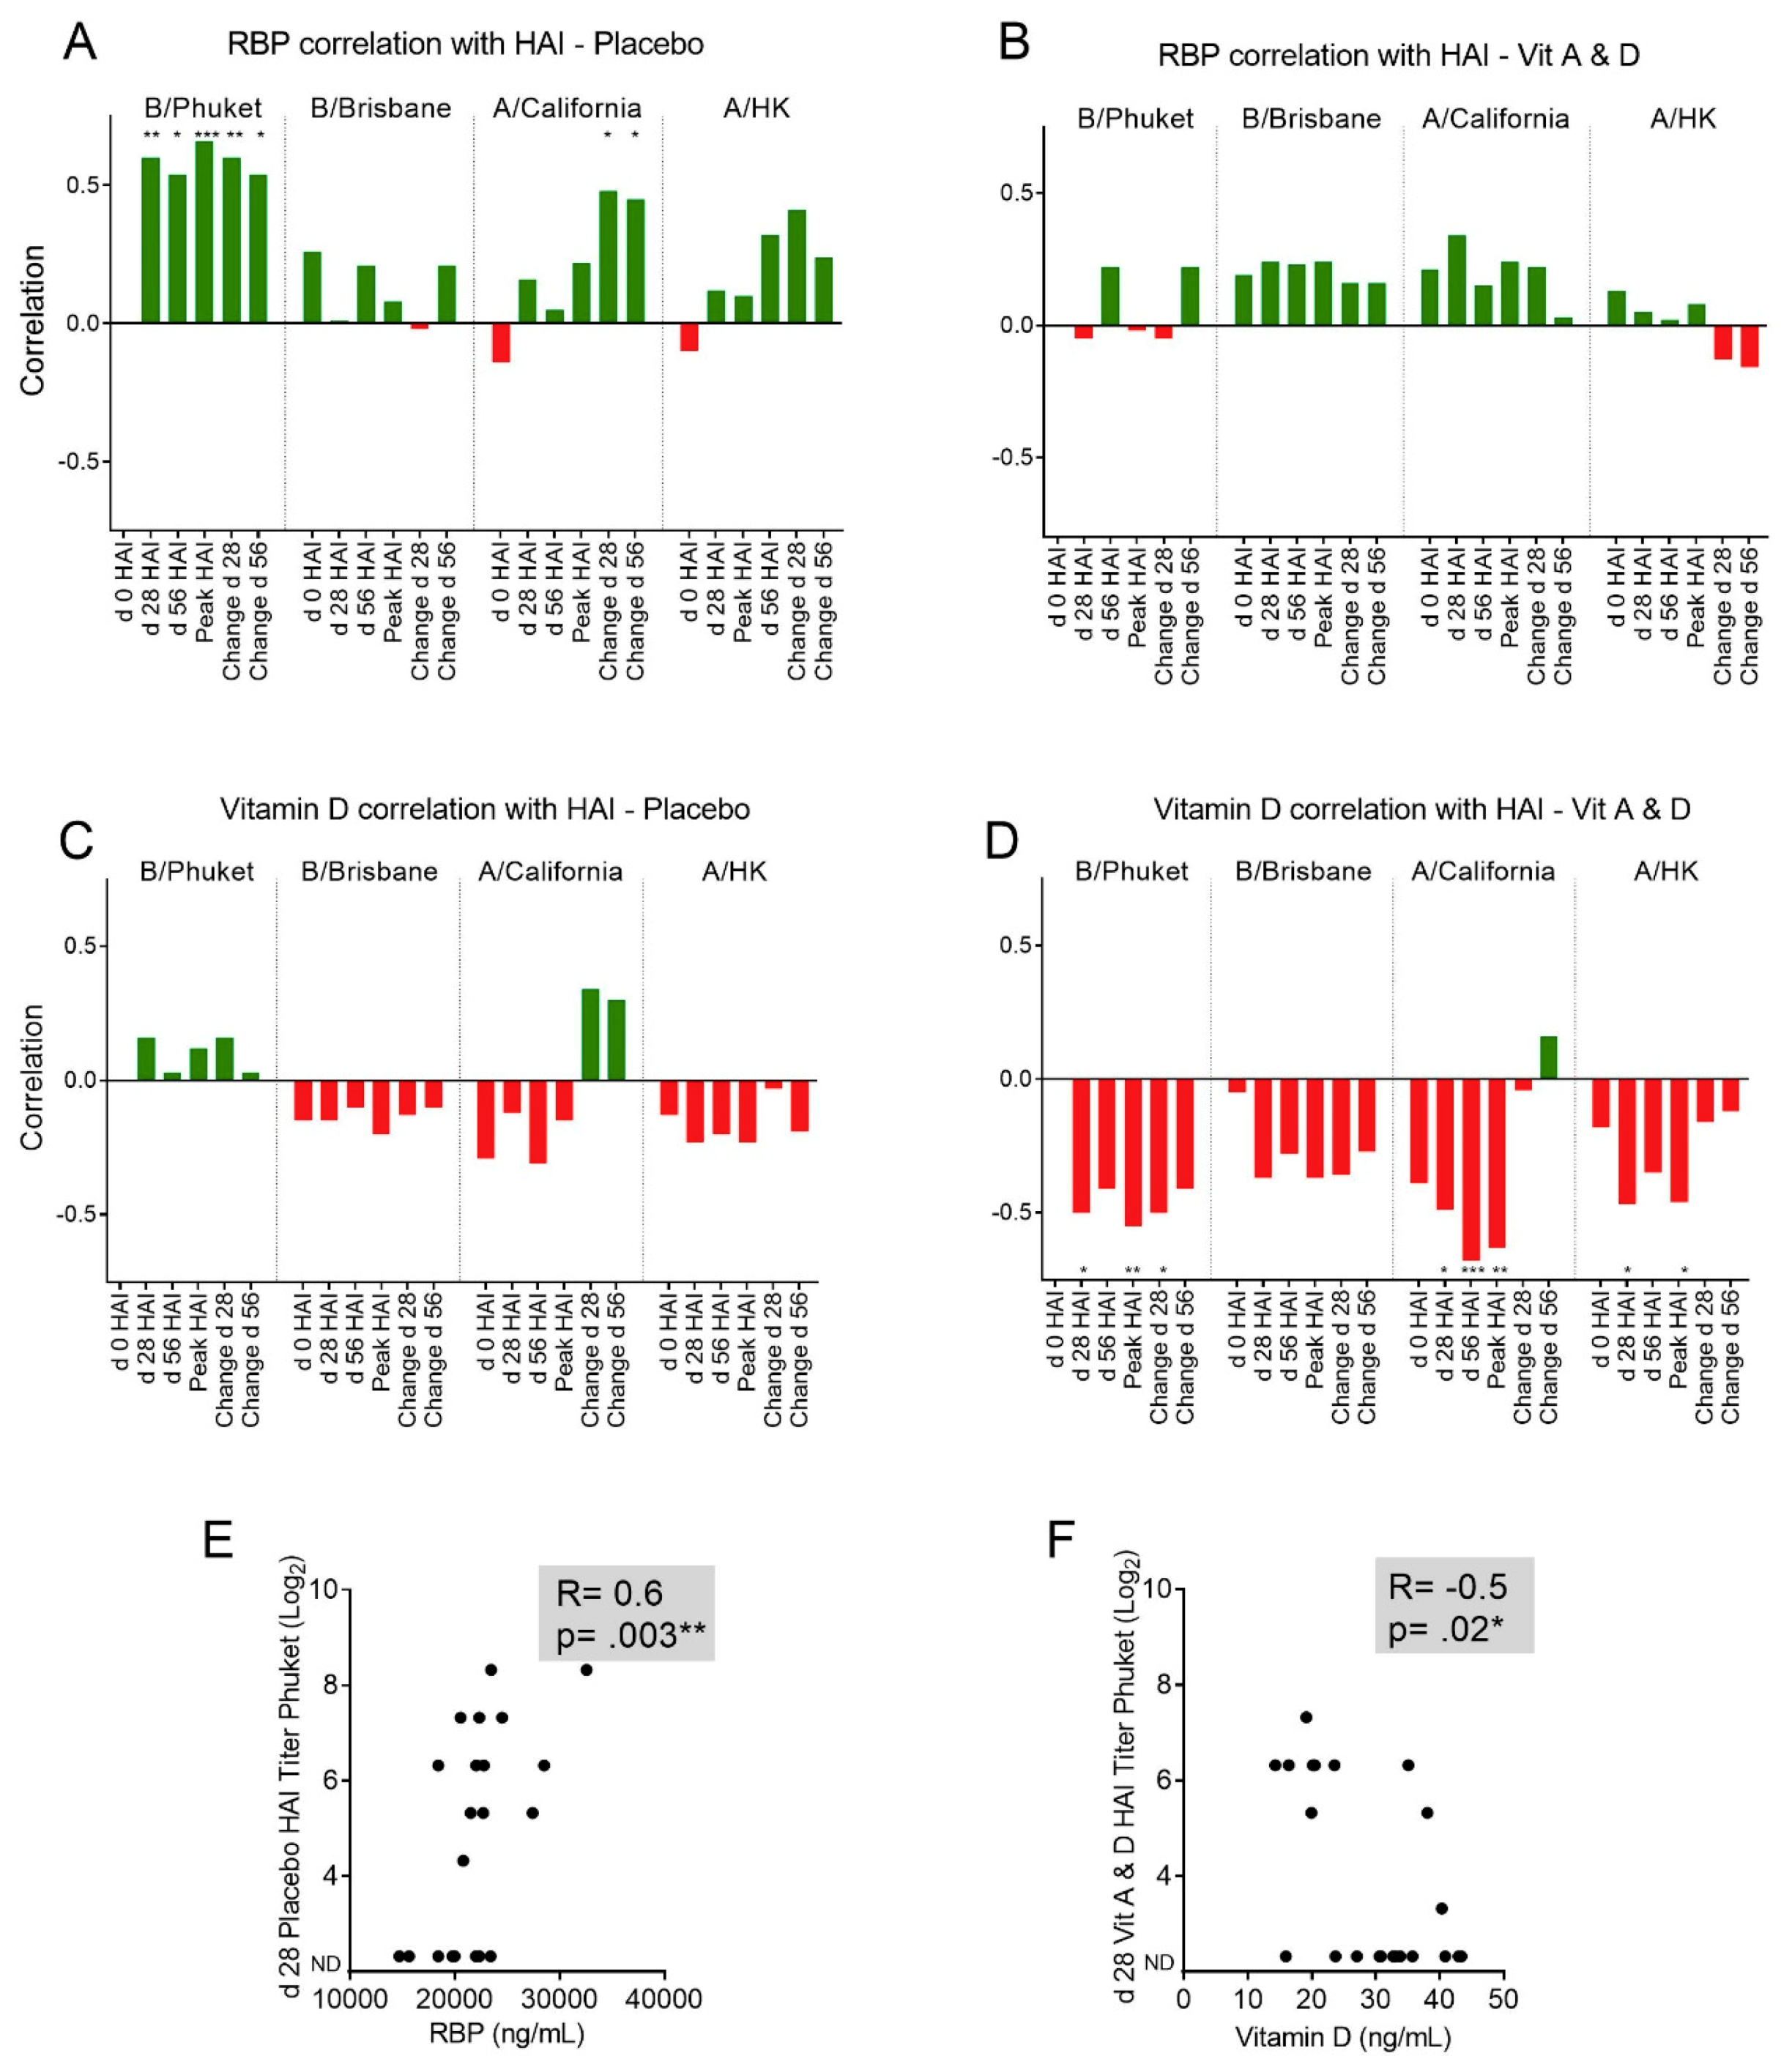
3.4. Baseline RBP Correlates Positively, while Baseline 25(OH)D Correlates Negatively, with Immune Responses Toward Influenza Vaccine Components.
4. Discussion
Author Contributions
Funding
Acknowledgments
Conflicts of Interest
Appendix A

| ID | Sex | Age | Race | Date | RBP (ng/mL) | Retinol (µg/dL) | Vitamin D (ng/mL) | Assn. |
|---|---|---|---|---|---|---|---|---|
| 1 | Female | 3 | Black | 2/11/2016 | 27,123 | 26.58 | 41.66 | A |
| 2 | Male | 7 | Black | 2/15/2016 | 25,607 | 31.36 | 21.14 | B |
| 3 | Female | 2 | Black | 2/15/2016 | 25,056 | 23.06 | 23.99 | A |
| 4 | Female | 8 | Black | 2/16/2016 | 20,523 | 30.98 | 14.39 | B |
| 5 | Male | 4 | Black | 2/24/2016 | 12,970 | 12.15 | 17.76 | A |
| 6 | Female | 6 | Black | 2/24/2016 | 16,248 | 22.10 | 24.3 | B |
| 7 | Female | 8 | Black | 2/24/2016 | 24,314 | 37.77 | 17.16 | B |
| 8 | Male | 4 | Black | 2/29/2016 | 21,660 | 33.59 | 21.52 | B |
| 9 | Female | 5 | Black | 2/29/2016 | 19,773 | 21.49 | 22.29 | A |
| ID | Sex | Age | Race | Date | RBP (ng/mL) | Retinol (µg/dL) | Vitamin D (ng/mL) | Assn. |
|---|---|---|---|---|---|---|---|---|
| 13 | Female | 8 | White | 9/26/2016 | 26,208 | 31.48 | 40.32 | B |
| 14 | Male | 7 | Black | 10/6/2016 | 19,967 | 40.69 | 25.67 | A |
| 15 | Male | 2 | Black | 10/6/2016 | 18,628 | 25.42 | 40.83 | B |
| 16 | Male | 5 | Black | 10/14/2016 | 29,270 | 40.74 | 20.46 | B |
| 17 | Male | 7 | Black | 10/14/2016 | 22,039 | 42.72 | 17.83 | A |
| 19 | Male | 3 | Black | 10/18/2016 | 14,717 | 17.48 | 17.52 | A |
| 20 | Female | 5 | Black | 10/21/2016 | 28,408 | 33.55 | 19.94 | B |
| 21 | Female | 2 | Black | 10/21/2016 | 22,691 | 33.41 | 24.42 | A |
| 22 | Male | 2 | White | 10/31/2016 | 22,773 | 32.63 | 32.1 | A |
| 23 | Male | 4 | Black | 11/1/2016 | 25,284 | 38.87 | 38.07 | B |
| 24 | Female | 4 | Black | 11/1/2016 | 21,511 | 34.75 | 32.94 | A |
| 25 | Female | 8 | Black | 11/4/2016 | 28,509 | 41.73 | 26.36 | A |
| 26 | Female | 8 | Black | 11/4/2016 | 27,407 | 37.28 | 31.06 | A |
| 27 | Male | 3 | Black | 11/2/2016 | 21,077 | 34.72 | 43.38 | B |
| 28 | Female | 8 | White | 11/10/2016 | 31,602 | 45.56 | 33.12 | B |
| 29 | Female | 5 | White | 11/10/2016 | 28,462 | 36.71 | 35.72 | B |
| 30 | Female | 8 | White | 11/18/2016 | 16,262 | 37.40 | 35.09 | B |
| 31 | Female | 6 | White | 11/18/2016 | 18,033 | 34.69 | 33.81 | B |
| 32 | Female | 7 | White | 11/18/2016 | 16,513 | 27.47 | 30.6 | B |
| 33 | Male | 2 | White | 11/18/2016 | 20,789 | 32.81 | 33.9 | A |
| 34 | Female | 3 | White | 11/22/2016 | 19,763 | 30.25 | 47.91 | A |
| 35 | Male | 7 | Black | 11/29/2016 | 21,604 | 37.01 | 23.56 | B |
| 36 | Female | 4 | Black | 12/5/2016 | 22,322 | 33.55 | 18.34 | A |
| 38 | Female | 2 | Black | 12/13/2016 | 9,563 | 18.06 | 14.29 | B |
| 39 | Male | 3 | Black | 12/13/2016 | 18,423 | 37.10 | 38.66 | A |
| 40 | Female | 5 | Black | 12/13/2016 | 20,554 | 43.13 | 41.98 | A |
| 41 | Female | 2 | Black | 12/29/2016 | 15,620 | 29.52 | 18.44 | A |
| 42 | Female | 8 | Black | 12/29/2016 | 23,453 | 31.06 | 21.21 | A |
| 45 | Female | 3 | Black | 1/5/2017 | 28,088 | 54.87 | 27.05 | B |
| 46 | Female | 4 | Black | 1/5/2017 | 18,416 | 30.00 | 23.72 | A |
| 47 | Female | 3 | Black | 1/13/2017 | 23,044 | 34.92 | 30.79 | B |
| 48 | Female | 8 | Black | 1/19/2017 | 27,113 | 39.94 | 19.17 | B |
| 49 | Female | 2 | Black | 1/20/2017 | 18,946 | 26.15 | 20.18 | B |
| 50 | Male | 6 | Black | 1/20/2017 | 21,196 | 34.16 | 16.4 | B |
| 51 | Male | 4 | Black | 1/24/2017 | 23,402 | 36.74 | 20.44 | A |
| 53 | Female | 5 | Black | 1/26/2017 | 24,518 | 35.92 | 21.74 | A |
| 54 | Female | 6 | Black | 1/26/2017 | 22,327 | 32.28 | 27.14 | A |
| 55 | Female | 6 | Black | 1/27/2017 | 14,551 | 19.57 | 23.7 | B |
| 57 | Male | 7 | White | 2/9/2017 | 32,563 | 55.81 | 31.88 | A |
| 58 | Female | 8 | White | 2/20/2017 | 19,934 | 29.56 | 31.52 | A |
| 60 | Female | 6 | Black | 3/3/2017 | 21,408 | 33.01 | 15.95 | B |
| 61 | Female | 4 | White | 3/7/2017 | 22,007 | 31.90 | 35.13 | A |
| 62 | Male | 5 | White | 3/7/2017 | 24,650 | 30.95 | 32.71 | B |
| 64 | Male | 2 | Black | 3/31/2017 | 28,602 | 36.90 | 42.95 | B |
| ID | Sex | Age | Race | Date | RBP (ng/mL) | Retinol (µg/dL) | Vitamin D (ng/mL) | Assn. |
|---|---|---|---|---|---|---|---|---|
| 66 | Male | 3 | White | 9/18/2017 | 26,710 | 38.11 | 33.6 | B |
| 67 | Female | 8 | Black | 9/20/2017 | 30,555 | 43.65 | 31.28 | B |
| 68 | Female | 8 | White | 10/13/2017 | 25,711 | 37.70 | 43.25 | A |
| 70 | Male | 2 | White | 10/20/2017 | 22,600 | 34.30 | 39.52 | B |
| 71 | Male | 8 | White | 10/20/2017 | 21,556 | 43.41 | 30.74 | A |
| 72 | Male | 2 | White | 10/20/2017 | 30,109 | 36.38 | 34.36 | A |
| 73 | Male | 2 | White | 10/20/2017 | 29,917 | 41.63 | 53.05 | A |
| 74 | Female | 2 | White | 10/30/2017 | 17,973 | 26.53 | 34.74 | B |
| 75 | Female | 2 | Black | 11/2/2017 | 22,499 | 33.34 | 17.04 | B |
| 78 | Female | 2 | Black | 11/15/2017 | 20,178 | 28.53 | 56.76 | A |
| 79 | Male | 6 | Black | 11/16/2017 | 20,113 | 34.33 | 26.05 | A |
| 80 | Female | 8 | Black | 11/17/2017 | 16,137 | 25.51 | 13.68 | B |
| 81 | Female | 2 | Black | 11/17/2017 | 20,112 | 29.38 | 23.76 | A |
| 83 | Male | 2 | Black | 12/5/2017 | 35,501 | 47.44 | 31.49 | B |
| 84 | Female | 8 | Black | 12/8/2017 | 15,692 | 21.53 | 23.13 | A |
| 85 | Male | 3 | Black | 12/12/2017 | 18,809 | 26.27 | 28.4 | B |
| 86 | Male | 8 | Black | 12/12/2017 | 31,920 | 44.38 | 18.75 | A |
| 87 | Male | 8 | Black | 1/9/2018 | 37,539 | 51.88 | 35.06 | B |
| 88 | Male | 7 | Black | 1/9/2018 | 23,074 | 30.49 | 37.53 | A |
| 89 | Female | 7 | White | 2/19/2018 | 19,055 | 27.30 | 25.16 | B |
| 90 | Female | 7 | Black | 2/20/2018 | 26,643 | 38.93 | 26.8 | A |
| 92 | Female | 8 | Black | 3/13/2018 | 30,636 | 36.42 | 10.06 | B |
| 94 | Male | 2 | Black | 3/28/2018 | 13,348 | 18.49 | 20.32 | B |
| 95 | Female | 4 | Black | 3/26/2018 | 26,157 | 29.94 | 12.97 | A |
| 96 | Male | 2 | Black | 4/5/2018 | 20,866 | 28.02 | 53.52 | A |
| 97 | Male | 2 | White | 4/23/2018 | 25,638 | 36.52 | 39.14 | A |
| A. | Day 0 | Day 28 | Day 56 | |||||||||
|---|---|---|---|---|---|---|---|---|---|---|---|---|
| ID | A/CA/7/09 H1N1 | A/Switz/9715293/13 H3N2 | B/Phuket/3073/13 | B/Brisbane/60/2008 | A/CA/7/09 H1N1 | A/Switz/9715293/13 H3N2 | B/Phuket/3073/13 | B/Brisbane/60/2008 | A/CA/7/09 H1N1 | A/Switz/9715293/13 H3N2 | B/Phuket/3073/13 | B/Brisbane/60/2008 |
| 1 | <10 | <10 | <10 | <10 | <10 | 320/640 | <10 | <10 | <10 | 160 | <10 | <10 |
| 2 | <10 | 640 | 40 | <10 | <10 | 320 | 160 | <10 | <10 | 320 | 80 | <10 |
| 3 | <10 | <10 | <10 | <10 | <10 | 160 | <10 | <10 | <10 | 1280 | <10 | <10 |
| 4 | 160 | <10 | <10 | <10 | 160 | <10 | <10 | <10 | 320 | <10 | <10 | <10 |
| 5 | 20 | 160 | <10 | <10 | <10 | 320 | <10 | <10 | <10 | 320 | <10 | <10 |
| 6 | <10 | <10 | <10 | <10 | <10 | 1280 | <10 | <10 | <10 | 1280 | <10 | <10 |
| 7 | 40 | 160/80 | <10 | <10 | <10 | <10 | <10 | <10 | <10 | 80 | <10 | <10 |
| 8 | <10 | <10 | <10 | <10 | <10 | 640 | <10 | <10 | <10 | 320 | <10 | <10 |
| 9 | 40 | 320/640 | <10 | <10 | 40 | 320 | <10 | <10 | <10 | 640 | <10 | <10 |
| ID | Day 0 | Day 28 | Day 56 | |||||||||
|---|---|---|---|---|---|---|---|---|---|---|---|---|
| A/CA/7/09 H1N1 | A/Hong Kong/4801/14 H3N2 | B/Phuket/3073/13 | B/Brisbane/60/2008 | A/CA/7/09 H1N1 | A/Hong Kong/4801/14 H3N2 | B/Phuket/3073/13 | B/Brisbane/60/2008 | A/CA/7/09 H1N1 | A/Hong Kong/4801/14 H3N2 | B/Phuket/3073/13 | B/Brisbane/60/2008 | |
| 13 | <10 | 640 | <10 | <10 | 640 | 20480 | 10 | 640 | 640 | 20480 | <10 | 160 |
| 14 | 40 | <10 | <10 | <10 | 320 | 640 | <10 | <10 | 640 | 640 | <10 | <10 |
| 15 | <10 | <10 | <10 | <10 | <10 | <10 | <10 | <10 | 80 | 40 | <10 | <10 |
| 16 | 320/640 | 320 | <10 | <10 | 640 | 5120 | 80 | 80 | 1280 | 2560 | 80 | <10 |
| 17 | 320 | 40 | <10 | <10 | 640 | 640 | 80 | 80 | 1280 | 320 | 40 | 20 |
| 19 | <10 | 320 | <10 | <10 | <10 | 2560/5120 | <10 | 320 | N/S | N/S | N/S | N/S |
| 20 | 40 | 80 | <10 | <10 | 640 | 5120 | 40 | 80 | 640 | 5120 | 40 | 40 |
| 21 | 10 | <10 | <10 | <10 | 160 | 1280 | 40 | 40 | 320 | 1280 | 40 | 40 |
| 22 | 10 | <10 | <10 | <10 | 1280 | 1280/2560 | 80 | 320 | 2560 | 2560 | 160 | 320 |
| 23 | 20 | 80 | <10 | <10 | 320 | 320 | 40 | 320 | 160 | 320 | 40 | 80/160 |
| 24 | <10 | <10 | <10 | <10 | 1280 | 320 | 40 | 320 | 640 | 160 | 10 | 80/160 |
| 25 | 10 | <10 | <10 | <10 | 160 | 160 | 80 | 160 | 320 | 160 | 160 | 160 |
| 26 | <10 | 320 | <10 | <10 | 320 | 10240 | 40 | 20 | 320 | 5120 | <10 | <10 |
| 27 | 320/640 | <10 | <10 | <10 | 640 | 160 | <10 | 20 | N/S | N/S | N/S | N/S |
| 28 | <10 | 160 | <10 | <10 | 640 | 320 | <10 | <10 | 160 | 320 | <10 | <10 |
| 29 | <10 | <10 | <10 | <10 | 1280 | 1280 | <10 | <10 | 640 | 1280 | <10 | <10 |
| 30 | <10 | 2560 | <10 | <10 | <10 | 5120 | 80 | <10 | <10 | 2560 | <10 | <10 |
| 31 | <10 | 650 | <10 | <10 | <10 | 640 | <10 | <10 | <10 | 2560/1280 | <10 | <10 |
| 32 | <10 | <10 | <10 | <10 | 320 | 640 | <10 | <10 | 640 | 640 | <10 | <10 |
| 33 | <10 | <10 | <10 | <10 | 320 | 640/1280 | 20 | 40 | 640 | 640 | <10 | <10 |
| 34 | <10 | <10 | <10 | <10 | <10 | <10 | <10 | <10 | 160 | <10 | <10 | <10 |
| 35 | 160 | 160 | <10 | <10 | 640 | 2560 | 80 | <10 | 1280 | 2560 | <10 | <10 |
| 36 | <10 | 320 | <10 | <10 | <10 | 2560 | <10 | 80 | 160 | 2560/1280 | <10 | <10 |
| 38 | <10 | <10 | <10 | <10 | 640 | 640/1280 | 80 | 80 | 1280 | 1280 | 160 | <10 |
| 39 | 160 | 160 | <10 | <10 | 640 | 2560 | 80 | 160 | 640 | 1280/2560 | 80 | 160 |
| 40 | 40 | 160 | <10 | <10 | 320 | 160 | 160 | 40 | 640 | 160 | 80 | <10 |
| 41 | 320 | <10 | <10 | <10 | 2560 | <10 | <10 | <10 | 2560 | 160 | <10 | <10 |
| 42 | <10 | 160 | <10 | <10 | 2560 | 1280 | 320 | 640 | 2560 | 640/1280 | 320 | 320 |
| 45 | 640 | 2560 | <10 | 160 | 640 | 160/2560 | <10 | 160 | 1280 | 1280/2560 | 80 | 160 |
| 46 | 640 | 1280 | <10 | <10 | 1280 | 2560 | <10 | 320 | 640 | 2560 | <10 | 160 |
| 47 | <10 | 640 | <10 | <10 | <10 | 10240 | <10 | <10 | 80 | 10240 | <10 | <10 |
| 48 | 160 | 320 | <10 | <10 | 1280 | 2560 | 160 | 1280 | 1280 | 5120 | 80 | 640 |
| 49 | 320 | <10 | <10 | <10 | 640 | 640 | 80 | <10 | 320 | 640 | <10 | <10 |
| 50 | 320 | 1280 | <10 | <10 | 1280 | 2560 | 80 | 80/160 | 640 | 1280 | <10 | 80 |
| 51 | 320 | 160 | <10 | <10 | 640 | 2560 | <10 | 80 | 1280 | 2560 | 80 | 80/160 |
| 53 | 80 | <10 | <10 | 80 | 1280 | 160 | 160 | <10 | N/S | N/S | N/S | N/S |
| 54 | 320 | 80 | <10 | <10 | 1280 | 1280 | 160 | 320 | 2560 | 1280 | 80 | 160 |
| 55 | <10 | <10 | <10 | <10 | 320 | 1280 | <10 | <10 | 640 | 2560 | <10 | <10 |
| 57 | <10 | 160 | <10 | <10 | 1280 | 1280/2560 | 320 | 80 | 640 | 1280 | 160 | 40 |
| 58 | <10 | 160 | <10 | <10 | 320 | 320 | <10 | 320/640 | 320 | 640 | 80 | 320 |
| 60 | 320 | 640 | <10 | <10 | 2560 | 5120 | <10 | 2560/5120 | 2560 | 2560 | <10 | 2560 |
| 61 | <10 | 1280 | <10 | <10 | 160 | 1280 | <10 | <10 | 160 | 1280 | <10 | <10 |
| 62 | <10 | 320 | <10 | <10 | 1280 | 320 | <10 | 20 | 640 | 160 | <10 | <10 |
| 64 | <10 | <10 | <10 | <10 | 160 | 80 | <10 | <10 | 160 | 160 | <10 | <10 |
| ID | Day 0 | Day 28 | Day 56 | |||||||||
|---|---|---|---|---|---|---|---|---|---|---|---|---|
| A/Michigan/45/2015 H1N1 | A/Hong Kong/4801/14 H3N2 | B/Phuket/3073/13 | B/Brisbane/60/2008 | A/Michigan/45/2015 H1N1 | A/Hong Kong/4801/14 H3N2 | B/Phuket/3073/13 | B/Brisbane/60/2008 | A/Michigan/45/2015 H1N1 | A/Hong Kong/4801/14 H3N2 | B/Phuket/3073/13 | B/Brisbane/60/2008 | |
| 66 | 640 | 160 | <10 | <10 | 2560 | 160 | <10 | <10 | 5120 | 320 | <10 | <10 |
| 67 | <10 | 320 | <10 | 160 | 2560 | 1280 | 160 | <10 | 2560 | 2560 | <10 | 320/640 |
| 68 | <10 | <10 | <10 | <10 | 40 | 2560 | <10 | 320 | 2560 | 1280 | <10 | 640 |
| 70 | <10 | 80 | <10 | <10 | 1280 | 640 | <10 | <10 | 40 | 640 | <10 | <10 |
| 71 | 160 | 320 | <10 | <10 | 160 | 640 | <10 | 80 | 1280 | 640 | <10 | <10 |
| 72 | <10 | <10 | <10 | <10 | 160 | 10 | <10 | <10 | 320 | <10 | <10 | <10 |
| 73 | <10 | <10 | <10 | <10 | 10 | 10 | <10 | <10 | 80 | 40 | <10 | <10 |
| 74 | <10 | <10 | <10 | <10 | 320 | 80 | <10 | <10 | 640 | 80 | 80 | <10 |
| 75 | <10 | <10 | <10 | <10 | 160 | 80 | <10 | 320 | 320 | 160 | <10 | 320 |
| 78 | <10 | 320 | <10 | <10 | 160 | 5120 | <10 | <10 | 1280 | 5120 | <10 | <10 |
| 79 | 320 | 320 | <10 | <10 | 2560 | 5120 | 80 | <10 | 2560 | 2560 | 80 | <10 |
| 80 | 1280 | 640 | <10 | 160 | 2560 | 1280 | <10 | 160/320 | 640 | 1280 | 80 | 160/320 |
| 81 | 320 | <10 | <10 | <10 | 640 | 320 | <10 | <10 | 1280 | 640 | 80/160 | 80 |
| 83 | 320 | 160 | 10 | 40 | 640 | 10240 | 160 | 320 | 1280 | 2560 | 80/160 | 320 |
| 84 | 1280 | 1280 | 80 | 160 | 5120 | 5120 | 80/160 | 80/160 | 2560 | 1280 | 160 | 320 |
| 85 | 320 | 80 | <10 | <10 | 1280 | 5120 | 40 | 80 | 640 | 640 | <10 | <10 |
| 86 | 1280 | 1280 | <10 | <10 | 5120 | 5120 | <10 | <10 | 10240 | 2560/5120 | <10 | 80 |
| 87 | 160 | 1280 | <10 | <10 | 1280 | 5120 | <10 | <10 | 640/1280 | 2560 | 80 | <10 |
| 88 | 160 | 1280 | 160 | 80 | 640 | 640 | 320 | 160 | 640 | 1280 | 160 | 160 |
| 89 | 5120 | <10 | <10 | <10 | 2560 | 320 | <10 | <10 | 2560/5120 | 160 | <10 | <10 |
| 90 | 80 | <10 | <10 | <10 | 5120 | 320 | <10 | 160 | 5120 | 320 | 160 | 160 |
| 92 | 160 | 640 | <10 | <10 | 5120 | 2560 | <10 | 160 | 5120 | 2560 | 40/80 | 80 |
| 94 | 320 | <10 | <10 | <10 | 640 | 160 | <10 | <10 | N/S | N/S | N/S | N/S |
| 95 | 1280 | 320 | <10 | <10 | 640 | 640 | <10 | <10 | 640 | 320 | 80 | 80 |
| 96 | 320/640 | 320 | <10 | <10 | 5120 | 10240 | <10 | <10 | 2560 | 5120 | <10 | <10 |
| 97 | <10 | <10 | 80 | <10 | 160 | 160 | 80 | <10 | 160 | <10 | <10 | <10 |
References
- Mora, J.R.; Iwata, M.; von Andrian, U.H. Vitamin effects on the immune system: Vitamins A and D take centre stage. Nat. Rev. Immunol. 2008, 8, 685–698. [Google Scholar] [CrossRef] [PubMed]
- Surman, S.L.; Jones, B.G.; Rudraraju, R.; Sealy, R.E.; Hurwitz, J.L. Intranasal administration of retinyl palmitate with a respiratory virus vaccine corrects impaired mucosal IgA response in the vitamin A-deficient host. Clin. Vaccine Immunol. 2014, 21, 598–601. [Google Scholar] [CrossRef] [PubMed]
- Surman, S.L.; Jones, B.G.; Sealy, R.E.; Rudraraju, R.; Hurwitz, J.L. Oral retinyl palmitate or retinoic acid corrects mucosal IgA responses toward an intranasal influenza virus vaccine in vitamin A deficient mice. Vaccine 2014, 32, 2521–2524. [Google Scholar] [CrossRef] [PubMed] [Green Version]
- Villamor, E.; Fawzi, W.W. Effects of vitamin a supplementation on immune responses and correlation with clinical outcomes. Clin. Microbiol. Rev. 2005, 18, 446–464. [Google Scholar] [CrossRef]
- Martineau, A.R.; Jolliffe, D.A.; Hooper, R.L.; Greenberg, L.; Aloia, J.F.; Bergman, P.; Dubnov-Raz, G.; Esposito, S.; Ganmaa, D.; Ginde, A.A.; et al. Vitamin D supplementation to prevent acute respiratory tract infections: Systematic review and meta-analysis of individual participant data. BMJ 2017, 356, i6583. [Google Scholar] [CrossRef]
- Sadarangani, S.P.; Whitaker, J.A.; Poland, G.A. “Let there be light”: The role of vitamin D in the immune response to vaccines. Expert Rev. Vaccines 2015, 14, 1427–1440. [Google Scholar] [CrossRef]
- Semba, R.D.; Scott, A.L.; Natadisastra, G.; Wirasasmita, S.; Mele, L.; Ridwan, E.; West, K.P., Jr.; Sommer, A. Depressed immune response to tetanus in children with vitamin A deficiency. J. Nutr. 1992, 122, 101–107. [Google Scholar] [CrossRef]
- Surman, S.L.; Penkert, R.R.; Jones, B.G.; Sealy, R.E.; Hurwitz, J.L. Vitamin Supplementation at the Time of Immunization with a Cold-Adapted Influenza Virus Vaccine Corrects Poor Mucosal Antibody Responses in Mice Deficient for Vitamins A and D. Clin. Vaccine Immunol. 2016, 23, 219–227. [Google Scholar] [CrossRef] [Green Version]
- Chesney, R.W. Vitamin D and The Magic Mountain: The anti-infectious role of the vitamin. J. Pediatr. 2010, 156, 698–703. [Google Scholar] [CrossRef]
- Zhang, X.; Ding, F.; Li, H.; Zhao, W.; Jing, H.; Yan, Y.; Chen, Y. Low Serum Levels of Vitamins A, D, and E Are Associated with Recurrent Respiratory Tract Infections in Children Living in Northern China: A Case Control Study. PLoS ONE 2016, 11, e0167689. [Google Scholar] [CrossRef]
- Jones, B.G.; Oshansky, C.M.; Bajracharya, R.; Tang, L.; Sun, Y.; Wong, S.S.; Webby, R.; Thomas, P.G.; Hurwitz, J.L. Retinol binding protein and vitamin D associations with serum antibody isotypes, serum influenza virus-specific neutralizing activities and airway cytokine profiles. Clin. Exp. Immunol. 2016, 183, 239–247. [Google Scholar] [CrossRef] [PubMed]
- Rudraraju, R.; Surman, S.L.; Jones, B.G.; Sealy, R.; Woodland, D.L.; Hurwitz, J.L. Reduced frequencies and heightened CD103 expression among virus-induced CD8(+) T cells in the respiratory tract airways of vitamin A-deficient mice. Clin. Vaccine Immunol. 2012, 19, 757–765. [Google Scholar] [CrossRef] [PubMed]
- Hurwitz, J.L.; Jones, B.G.; Penkert, R.R.; Gansebom, S.; Sun, Y.; Tang, L.; Bramley, A.M.; Jain, S.; McCullers, J.A.; Arnold, S.R. Low Retinol-Binding Protein and Vitamin D Levels Are Associated with Severe Outcomes in Children Hospitalized with Lower Respiratory Tract Infection and Respiratory Syncytial Virus or Human Metapneumovirus Detection. J. Pediatr. 2017, 187, 323–327. [Google Scholar] [CrossRef] [PubMed]
- Rahman, M.M.; Mahalanabis, D.; Hossain, S.; Wahed, M.A.; Alvarez, J.O.; Siber, G.R.; Thompson, C.; Santosham, M.; Fuchs, G.J. Simultaneous vitamin A administration at routine immunization contact enhances antibody response to diphtheria vaccine in infants younger than six months. J. Nutr. 1999, 129, 2192–2195. [Google Scholar] [CrossRef]
- Chadha, M.K.; Fakih, M.; Muindi, J.; Tian, L.; Mashtare, T.; Johnson, C.S.; Trump, D. Effect of 25-hydroxyvitamin D status on serological response to influenza vaccine in prostate cancer patients. Prostate 2011, 71, 368–372. [Google Scholar] [CrossRef] [PubMed]
- Wayse, V.; Yousafzai, A.; Mogale, K.; Filteau, S. Association of subclinical vitamin D deficiency with severe acute lower respiratory infection in Indian children under 5 y. Eur. J. Clin. Nutr. 2004, 58, 563–567. [Google Scholar] [CrossRef] [PubMed] [Green Version]
- Ginde, A.A.; Mansbach, J.M.; Camargo, C.A., Jr. Association between serum 25-hydroxyvitamin D level and upper respiratory tract infection in the Third National Health and Nutrition Examination Survey. Arch. Intern. Med. 2009, 169, 384–390. [Google Scholar] [CrossRef]
- Urashima, M.; Segawa, T.; Okazaki, M.; Kurihara, M.; Wada, Y.; Ida, H. Randomized trial of vitamin D supplementation to prevent seasonal influenza A in schoolchildren. Am. J. Clin. Nutr. 2010, 91, 1255–1260. [Google Scholar] [CrossRef] [PubMed] [Green Version]
- Shaw, N.; Elholm, M.; Noy, N. Retinoic acid is a high affinity selective ligand for the peroxisome proliferator-activated receptor beta/delta. J. Biol. Chem. 2003, 278, 41589–41592. [Google Scholar] [CrossRef]
- Evans, R.M.; Mangelsdorf, D.J. Nuclear Receptors, RXR, and the Big Bang. Cell 2014, 157, 255–266. [Google Scholar] [CrossRef] [PubMed] [Green Version]
- Mader, S.; Leroy, P.; Chen, J.Y.; Chambon, P. Multiple parameters control the selectivity of nuclear receptors for their response elements. Selectivity and promiscuity in response element recognition by retinoic acid receptors and retinoid X receptors. J. Biol. Chem. 1993, 268, 591–600. [Google Scholar] [PubMed]
- Liu, Y.Y.; Brent, G.A. Thyroid hormone crosstalk with nuclear receptor signaling in metabolic regulation. Trends Endocrinol. Metab. 2010, 21, 166–173. [Google Scholar] [CrossRef] [PubMed] [Green Version]
- Beildeck, M.E.; Gelmann, E.P.; Byers, S.W. Cross-regulation of signaling pathways: An example of nuclear hormone receptors and the canonical Wnt pathway. Exp. Cell Res. 2010, 316, 1763–1772. [Google Scholar] [CrossRef] [PubMed] [Green Version]
- Williams, G.R.; Franklyn, J.A. Physiology of the steroid-thyroid hormone nuclear receptor superfamily. Baillieres Clin. Endocrinol. Metab. 1994, 8, 241–266. [Google Scholar] [CrossRef]
- Winrow, C.J.; Capone, J.P.; Rachubinski, R.A. Cross-talk between orphan nuclear hormone receptor RZRalpha and peroxisome proliferator-activated receptor alpha in regulation of the peroxisomal hydratase-dehydrogenase gene. J. Biol. Chem. 1998, 273, 31442–31448. [Google Scholar] [CrossRef] [PubMed]
- Meier, C.A. Regulation of gene expression by nuclear hormone receptors. J. Recept. Signal. Transduct. Res. 1997, 17, 319–335. [Google Scholar] [CrossRef] [PubMed]
- Tavera-Mendoza, L.; Wang, T.T.; Lallemant, B.; Zhang, R.; Nagai, Y.; Bourdeau, V.; Ramirez-Calderon, M.; Desbarats, J.; Mader, S.; White, J.H. Convergence of vitamin D and retinoic acid signalling at a common hormone response element. EMBO Rep. 2006, 7, 180–185. [Google Scholar] [CrossRef] [PubMed] [Green Version]
- Hurwitz, J.L.; Penkert, R.R.; Xu, B.; Fan, Y.; Partridge, J.F.; Maul, R.W.; Gearhart, P.J. Hotspots for Vitamin-Steroid-Thyroid Hormone Response Elements Within Switch Regions of Immunoglobulin Heavy Chain Loci Predict a Direct Influence of Vitamins and Hormones on B Cell Class Switch Recombination. Viral Immunol. 2016, 29, 132–136. [Google Scholar] [CrossRef] [PubMed]
- Sealy, R.E.; Jones, B.G.; Surman, S.L.; Penkert, R.R.; Pelletier, S.; Neale, G.; Hurwitz, J.L. Will Attention by Vaccine Developers to the Host’s Nuclear Hormone Levels and Immunocompetence Improve Vaccine Success? Vaccines (Basel) 2019, 7, 26. [Google Scholar] [CrossRef] [PubMed]
- Jones, B.G.; Sealy, R.E.; Penkert, R.R.; Surman, S.L.; Maul, R.W.; Neale, G.; Xu, B.; Gearhart, P.J.; Hurwitz, J.L. Complex sex-biased antibody responses: Estrogen receptors bind estrogen response elements centered within immunoglobulin heavy chain gene enhancers. Int. Immunol. 2019, 31, 141–156. [Google Scholar] [CrossRef]
- Jones, B.G.; Penkert, R.R.; Xu, B.; Fan, Y.; Neale, G.; Gearhart, P.J.; Hurwitz, J.L. Binding of estrogen receptors to switch sites and regulatory elements in the immunoglobulin heavy chain locus of activated B cells suggests a direct influence of estrogen on antibody expression. Mol. Immunol. 2016, 77, 97–102. [Google Scholar] [CrossRef] [PubMed] [Green Version]
- Sommer, A. Vitamin A, infectious disease, and childhood mortality: A 2¢ solution? J. Infect. Dis. 1993, 167, 1003–1007. [Google Scholar] [CrossRef] [PubMed]
- Semba, R.D.; Mohgaddam, N.E.; Munasir, Z.; Akib, A.; Permaesih, D.; Osterhaus, A. Integration of vitamin A supplementation with the expanded program on immunization does not affect seroconversion to oral poliovirus vaccine in infants. J. Nutr. 1999, 129, 2203–2205. [Google Scholar] [CrossRef] [PubMed]
- Zimmerman, R.K.; Lin, C.J.; Raviotta, J.M.; Nowalk, M.P. Do vitamin D levels affect antibody titers produced in response to HPV vaccine? Hum. Vaccines Immunother. 2015, 11, 2345–2349. [Google Scholar] [CrossRef] [PubMed] [Green Version]
- Brown, K.H.; Rajan, M.M.; Chakraborty, J.; Aziz, K.M. Failure of a large dose of vitamin A to enhance the antibody response to tetanus toxoid in children. Am. J. Clin. Nutr. 1980, 33, 212–217. [Google Scholar] [CrossRef] [PubMed] [Green Version]
- Benn, C.S.; Aaby, P.; Bale, C.; Olsen, J.; Michaelsen, K.F.; George, E.; Whittle, H. Randomised trial of effect of vitamin A supplementation on antibody response to measles vaccine in Guinea-Bissau, west Africa. Lancet 1997, 350, 101–105. [Google Scholar] [CrossRef]
- Martines, J.; Arthur, P.; Bahl, R.; Bhan, M.K.; Kirkwood, B.R.; Moulton, L.H.; Panny, M.E.; Ram, M.; Underwood, B. Randomised trial to assess benefits and safety of vitamin A supplementation linked to immunisation in early infancy. WHO/CHD Immunisation-Linked Vitamin A Supplementation Study Group. Lancet 1998, 352, 1257–1263. [Google Scholar]
- Gruber-Bzura, B.M. Vitamin D and Influenza-Prevention or Therapy? Int. J. Mol. Sci. 2018, 19, 2419. [Google Scholar] [CrossRef] [PubMed]
- Li-Ng, M.; Aloia, J.F.; Pollack, S.; Cunha, B.A.; Mikhail, M.; Yeh, J.; Berbari, N. A randomized controlled trial of vitamin D3 supplementation for the prevention of symptomatic upper respiratory tract infections. Epidemiol. Infect. 2009, 137, 1396–1404. [Google Scholar] [CrossRef] [PubMed]
- Grant, W.B.; Boucher, B.J.; Bhattoa, H.P.; Lahore, H. Why vitamin D clinical trials should be based on 25-hydroxyvitamin D concentrations. J. Steroid Biochem. Mol. Biol. 2018, 177, 266–269. [Google Scholar] [CrossRef] [Green Version]
- Principi, N.; Marchisio, P.; Terranova, L.; Zampiero, A.; Baggi, E.; Daleno, C.; Tirelli, S.; Pelucchi, C.; Esposito, S. Impact of vitamin D administration on immunogenicity of trivalent inactivated influenza vaccine in previously unvaccinated children. Hum. Vaccines Immunother. 2013, 9, 969–974. [Google Scholar] [CrossRef] [PubMed] [Green Version]
- Sadarangani, S.P.; Ovsyannikova, I.G.; Goergen, K.; Grill, D.E.; Poland, G.A. Vitamin D, leptin and impact on immune response to seasonal influenza A/H1N1 vaccine in older persons. Hum. Vaccines Immunother. 2016, 12, 691–698. [Google Scholar] [CrossRef] [PubMed]
- Hanekom, W.A.; Yogev, R.; Heald, L.M.; Edwards, K.M.; Hussey, G.D.; Chadwick, E.G. Effect of vitamin A therapy on serologic responses and viral load changes after influenza vaccination in children infected with the human immunodeficiency virus. J. Pediatr. 2000, 136, 550–552. [Google Scholar] [CrossRef]
- Semba, R.D.; Munasir, Z.; Beeler, J.; Akib, A.; Audet, S.; Sommer, A. Reduced seroconversion to measles in infants given vitamin A with measles vaccination. Lancet 1995, 345, 1330–1332. [Google Scholar] [PubMed]
- Lin, C.J.; Martin, J.M.; Cole, K.S.; Zimmerman, R.K.; Susick, M.; Moehling, K.K.; Levine, M.Z.; Spencer, S.; Flannery, B.; Nowalk, M.P. Are children’s vitamin D levels and BMI associated with antibody titers produced in response to 2014-2015 influenza vaccine? Hum. Vaccines Immunother. 2017, 13, 1661–1665. [Google Scholar] [CrossRef] [PubMed]
- Aloia, J.F.; Li-Ng, M. Re: Epidemic influenza and vitamin D. Epidemiol. Infect. 2007, 135, 1095–1096. [Google Scholar] [CrossRef] [PubMed]
- Urashima, M.; Mezawa, H.; Noya, M.; Camargo, C.A., Jr. Effects of vitamin D supplements on influenza A illness during the 2009 H1N1 pandemic: A randomized controlled trial. Food Funct. 2014, 5, 2365–2370. [Google Scholar] [CrossRef] [PubMed]
- Bickel, M.; Lassmann, C.; Wieters, I.; Doerr, H.W.; Herrmann, E.; Wicker, S.; Brodt, H.R.; Stephan, C.; Allwinn, R.; Jung, O. Immune response after a single dose of the 2010/11 trivalent, seasonal influenza vaccine in HIV-1-infected patients and healthy controls. HIV Clin. Trials 2013, 14, 175–181. [Google Scholar] [CrossRef]
- Lee, R.U.; Won, S.H.; Hansen, C.; Crum-Cianflone, N.F. 25-hydroxyvitamin D, influenza vaccine response and healthcare encounters among a young adult population. PLoS ONE 2018, 13, e0192479. [Google Scholar] [CrossRef]
- Sundaram, M.E.; Talbot, H.K.; Zhu, Y.; Griffin, M.R.; Spencer, S.; Shay, D.K.; Coleman, L.A. Vitamin D is not associated with serologic response to influenza vaccine in adults over 50 years old. Vaccine 2013, 31, 2057–2061. [Google Scholar] [CrossRef] [PubMed]
- Cao, X.; Teitelbaum, S.L.; Zhu, H.J.; Zhang, L.; Feng, X.; Ross, F.P. Competition for a unique response element mediates retinoic acid inhibition of vitamin D3-stimulated transcription. J. Biol. Chem. 1996, 271, 20650–20654. [Google Scholar] [CrossRef] [PubMed]
- Makishima, M.; Shudo, K.; Honma, Y. Greater synergism of retinoic acid receptor (RAR) agonists with vitamin D3 than that of retinoid X receptor (RXR) agonists with regard to growth inhibition and differentiation induction in monoblastic leukemia cells. Biochem. Pharmacol. 1999, 57, 521–529. [Google Scholar] [CrossRef]
- Keller, H.; Givel, F.; Perroud, M.; Wahli, W. Signaling cross-talk between peroxisome proliferator-activated receptor/retinoid X receptor and estrogen receptor through estrogen response elements. Mol. Endocrinol. 1995, 9, 794–804. [Google Scholar] [CrossRef] [PubMed]
- Jenab, M.; Bueno-de-Mesquita, H.B.; Ferrari, P.; van Duijnhoven, F.J.; Norat, T.; Pischon, T.; Jansen, E.H.; Slimani, N.; Byrnes, G.; Rinaldi, S.; et al. Association between pre-diagnostic circulating vitamin D concentration and risk of colorectal cancer in European populations:a nested case-control study. BMJ 2010, 340, b5500. [Google Scholar] [CrossRef] [PubMed]
- Marchwicka, A.; Cebrat, M.; Laszkiewicz, A.; Sniezewski, L.; Brown, G.; Marcinkowska, E. Regulation of vitamin D receptor expression by retinoic acid receptor alpha in acute myeloid leukemia cells. J. Steroid Biochem. Mol. Biol. 2016, 159, 121–130. [Google Scholar] [CrossRef] [Green Version]
- Cantorna, M.T.; Snyder, L.; Arora, J. Vitamin A and vitamin D regulate the microbial complexity, barrier function, and the mucosal immune responses to ensure intestinal homeostasis. Crit. Rev. Biochem. Mol. Biol. 2019, 54, 184–192. [Google Scholar] [CrossRef]
- Tenforde, M.W.; Yadav, A.; Dowdy, D.W.; Gupte, N.; Shivakoti, R.; Yang, W.T.; Mwelase, N.; Kanyama, C.; Pillay, S.; Samaneka, W.; et al. Vitamin A and D Deficiencies Associated With Incident Tuberculosis in HIV-Infected Patients Initiating Antiretroviral Therapy in Multinational Case-Cohort Study. J. Acquir. Immune Defic. Syndr. 2017, 75, e71–e79. [Google Scholar] [CrossRef]
- Klassert, T.E.; Brauer, J.; Holzer, M.; Stock, M.; Riege, K.; Zubiria-Barrera, C.; Muller, M.M.; Rummler, S.; Skerka, C.; Marz, M.; et al. Differential Effects of Vitamins A and D on the Transcriptional Landscape of Human Monocytes during Infection. Sci. Rep. 2017, 7, 40599. [Google Scholar] [CrossRef] [Green Version]
- Almekinder, J.; Manda, W.; Soko, D.; Lan, Y.; Hoover, D.R.; Semba, R.D. Evaluation of plasma retinol-binding protein as a surrogate measure for plasma retinol concentrations. Scand. J. Clin. Lab. Investig. 2000, 60, 199–203. [Google Scholar] [CrossRef]
- Morokutti, A.; Redlberger-Fritz, M.; Nakowitsch, S.; Krenn, B.M.; Wressnigg, N.; Jungbauer, A.; Romanova, J.; Muster, T.; Popow-Kraupp, T.; Ferko, B. Validation of the modified hemagglutination inhibition assay (mHAI), a robust and sensitive serological test for analysis of influenza virus-specific immune response. J. Clin. Virol. 2013, 56, 323–330. [Google Scholar] [CrossRef]
- Kanai, M.; Raz, A.; Goodman, D.S. Retinol-binding protein: The transport protein for vitamin A in human plasma. J. Clin. Investig. 1968, 47, 2025–2044. [Google Scholar] [CrossRef] [PubMed]
- Ross, A.C. Vitamin A supplementation and retinoic acid treatment in the regulation of antibody responses in vivo. Vitam. Horm. 2007, 75, 197–222. [Google Scholar]
- Baeten, J.M.; Richardson, B.A.; Bankson, D.D.; Wener, M.H.; Kreiss, J.K.; Lavreys, L.; Mandaliya, K.; Bwayo, J.J.; McClelland, R.S. Use of serum retinol-binding protein for prediction of vitamin A deficiency: Effects of HIV-1 infection, protein malnutrition, and the acute phase response. Am. J. Clin. Nutr. 2004, 79, 218–225. [Google Scholar] [CrossRef] [PubMed]
- Kriesel, J.D.; Spruance, J. Calcitriol (1,25-dihydroxy-vitamin D3) coadministered with influenza vaccine does not enhance humoral immunity in human volunteers. Vaccine 1999, 17, 1883–1888. [Google Scholar] [CrossRef]
- Tripathi, S.; Tecle, T.; Verma, A.; Crouch, E.; White, M.; Hartshorn, K.L. The human cathelicidin LL-37 inhibits influenza A viruses through a mechanism distinct from that of surfactant protein D or defensins. J. Gen. Virol. 2013, 94, 40–49. [Google Scholar] [CrossRef] [PubMed]
- White, J.H. Vitamin D as an inducer of cathelicidin antimicrobial peptide expression: Past, present and future. J. Steroid Biochem. Mol. Biol. 2010, 121, 234–238. [Google Scholar] [CrossRef]
- Chen, S.; Sims, G.P.; Chen, X.X.; Gu, Y.Y.; Chen, S.; Lipsky, P.E. Modulatory effects of 1,25-dihydroxyvitamin D3 on human B cell differentiation. J. Immunol. 2007, 179, 1634–1647. [Google Scholar] [CrossRef] [PubMed]
- Li, Z.N.; Lin, S.C.; Carney, P.J.; Li, J.; Liu, F.; Lu, X.; Liu, M.; Stevens, J.; Levine, M.; Katz, J.M.; et al. IgM, IgG, and IgA antibody responses to influenza A(H1N1)pdm09 hemagglutinin in infected persons during the first wave of the 2009 pandemic in the United States. Clin. Vaccine Immunol. 2014, 21, 1054–1060. [Google Scholar] [CrossRef]
- Muramatsu, M.; Yoshida, R.; Yokoyama, A.; Miyamoto, H.; Kajihara, M.; Maruyama, J.; Nao, N.; Manzoor, R.; Takada, A. Comparison of antiviral activity between IgA and IgG specific to influenza virus hemagglutinin: Increased potential of IgA for heterosubtypic immunity. PLoS ONE 2014, 9, e85582. [Google Scholar] [CrossRef]
- Skountzou, I.; Satyabhama, L.; Stavropoulou, A.; Ashraf, Z.; Esser, E.S.; Vassilieva, E.; Koutsonanos, D.; Compans, R.; Jacob, J. Influenza virus-specific neutralizing IgM antibodies persist for a lifetime. Clin. Vaccine Immunol. 2014, 21, 1481–1489. [Google Scholar] [CrossRef]
- Surman, S.L.; Jones, B.G.; Woodland, D.L.; Hurwitz, J.L. Enhanced CD103 Expression and Reduced Frequencies of Virus-Specific CD8(+) T Cells Among Airway Lymphocytes After Influenza Vaccination of Mice Deficient in Vitamins A + D. Viral Immunol. 2017, 30, 737–743. [Google Scholar] [CrossRef] [PubMed]
- Hayward, A.C.; Fragaszy, E.B.; Bermingham, A.; Wang, L.; Copas, A.; Edmunds, W.J.; Ferguson, N.; Goonetilleke, N.; Harvey, G.; Kovar, J.; et al. Comparative community burden and severity of seasonal and pandemic influenza: Results of the Flu Watch cohort study. Lancet Respir. Med. 2014, 2, 445–454. [Google Scholar] [CrossRef]
- Antonen, J.A.; Pyhala, R.; Hannula, P.M.; Ala-Houhala, I.O.; Santanen, R.; Ikonen, N.; Saha, H.H. Influenza vaccination of dialysis patients: Cross-reactivity of induced haemagglutination-inhibiting antibodies to H3N2 subtype antigenic variants is comparable with the response of naturally infected young healthy adults. Nephrol. Dial. Transplant. 2003, 18, 777–781. [Google Scholar] [CrossRef] [PubMed]
| Characteristics | All Seasons FluMist, Fluzone, or Fluarix | 2015–2016 Season FluMist | 2016–2017 Season Fluzone or Fluarix | 2017–2018 Season Fluzone or Fluarix | ||||
|---|---|---|---|---|---|---|---|---|
| Placebo (n = 40) | Vitamin A&D (n = 39) | Placebo (n = 4) | Vitamin A&D (n = 5) | Placebo (n = 22) | Vitamin A&D (n = 22) | Placebo (n = 14) | Vitamin A&D (n = 12) | |
| Age groups, n (%) | ||||||||
| 2–4 years | 22 (55 %) | 16 (41%) | 3 (75%) | 1 (20%) | 12 (54.5%) | 8 (36%) | 7 (50%) | 7 (58%) |
| 5–8 years | 18 (45 %) | 23 (59%) | 1 (25%) | 4 (80%) | 10 (45.5%) | 14 (64%) | 7 (50%) | 5 (42%) |
| Sex, n (%) | ||||||||
| Female | 23 (57.5%) | 23 (59%) | 3 (75%) | 3 (60%) | 14 (64%) | 14 (64%) | 6 (43%) | 6 (50%) |
| Male | 17 (42.5%) | 16 (41%) | 1 (25%) | 2 (40%) | 8 (36%) | 8 (36%) | 8 (57%) | 6 (50%) |
| Race, n (%) | ||||||||
| White | 11 (27.5%) | 11 (28%) | 0 (0%) | 0 (0%) | 6 (27%) | 7 (32%) | 5 (36%) | 4 (33%) |
| Black | 29 (72.5%) | 28 (72%) | 4 (100%) | 5 (100%) | 16 (73%) | 15 (68%) | 9 (64%) | 8 (67%) |
| RBP, n (%) | ||||||||
| <22,000 ng/mL | 18 (45%) | 19 (49%) | 2 (50%) | 3 (60%) | 10 (45.5%) | 11 (50%) | 6 (43%) | 5 (42%) |
| ≥22,000 ng/mL | 22 (55%) | 20 (51%) | 2 (50%) | 2 (40%) | 12 (54.5%) | 11 (50%) | 8 (57%) | 7 (58%) |
| Vitamin D, n (%) | ||||||||
| <30 ng/mL | 21 (52.5%) | 21 (54%) | 3 (75%) | 5 (100%) | 12 (54.5%) | 10 (45.5%) | 6 (43%) | 6 (50%) |
| ≥30 ng/mL | 19 (47.5%) | 18 (46%) | 1 (25%) | 0 (0%) | 10 (45.5%) | 12 (54.5%) | 8 (57%) | 6 (50%) |
| Retinol, n (%) | ||||||||
| <20 µg/dL | 2 (5%) | 3 (7.7%) | 1 (25%) | 0 (0%) | 1 (4.6%) | 2 (9%) | 0 (0%) | 1 (8.3%) |
| 20–30 µg/dL | 11 (27.5%) | 8 (20.5%) | 3 (75%) | 1 (20%) | 3 (13.6%) | 3 (14%) | 5 (36%) | 4 (33.3%) |
| >30 µg/dL | 27 (67.5%) | 28 (71.8%) | 0 (0%) | 4 (80%) | 18 (81.8%) | 17 (77%) | 9 (64%) | 7 (58.3%) |
| Baseline HAI titer (log2), median (min, max) | ||||||||
| B/Phuket | ---# | --- | 2.32 (2.32, 2.32) | 2.32 (2.32, 5.32) | 2.32 (2.32, 2.32) | 2.32 (2.32, 2.32) | 2.32 (2.32, 7.32) | 2.32 (2.32, 3.32) |
| B/Brisbane | --- | --- | 2.32 (2.32, 2.32) | 2.32 (2.32, 2.32) | 2.32 (2.32, 6.32) | 2.32 (2.32, 7.32) | 2.32 (2.32, 7.32) | 2.32 (2.32, 7.32) |
| H1N1 * | --- | --- | 3.32 (2.32, 5.32) | 2.32 (2.32, 7.32) | 3.32 (2.32, 9.32) | 2.32 (2.32, 9.32) | 7.32 (2.32, 10.32) | 7.82 (2.32, 12.32) |
| H3N2 * | --- | --- | 4.82 (2.32, 8.82) | 2.32 (2.32, 9.32) | 6.82 (2.32, 10.32) | 7.32 (2.32, 11.32) | 8.32 (2.32, 10.32) | 6.82 (2.32, 10.32) |
| B/Phuket/3073/13 | B/Brisbane/60/2008 | H1N1* | H3N2* | |||||
|---|---|---|---|---|---|---|---|---|
| Placebo | A&D | Placebo | A&D | Placebo | A&D | Placebo | A&D | |
| HAI Response(≥4 Fold Change) after the 1st Dose (Day 28 HAI Titer Compared to Day 0) | ||||||||
| 2015–2016 (n = 9) | 0/4 (0%) | 1/5 (20%) | 0/4 (0%) | 0/5 (0%) | 0/4 (0%) | 0/5 (0%) | 2/4 (50%) | 2/5 (40%) |
| 2016–2017 (n = 44) | 13/22 (59%) | 9/22 (41%) | 17/22 (77%) | 10/22 (45%) | 16/22 (73%) | 14/22 (64%) | 16/22 (73%) | 15/22 (68%) |
| 2017–2018 (n = 26) | 1/14 (7%) | 3/12 (25%) | 3/14 (21%) | 4/12 (33%) | 10/14 (71%) | 8/12 (67%) | 9/14 (64%) | 10/12 (83%) |
| 2016–2017 (n = 44) | ||||||||
| Low A and Low D (n = 10) | 0/4 (0%) | 4/6 (67%) | 2/4 (50%) | 3/6 (50%) | 2/4 (50%) | 5/6 (83%) | 2/4 (50%) | 5/6 (83%) |
| High A and Low D (n = 12) | 6/8 (75%) | 3/4 (75%) | 7/8 (88%) | 3/4 (75%) | 5/8 (63%) | 2/4 (50%) | 8/8 (100%) | 3/4 (75%) |
| Low A and High D (n = 11) | 4/6 (67%) | 1/5 (20%) | 5/6 (83%) | 1/5 (20%) | 5/6 (83%) | 1/5 (20%) | 3/6 (50%) | 2/5 (40%) |
| High A and High D (n = 11) | 3/4 (75%) | 1/7 (14%) | 3/4 (75%) | 3/7 (43%) | 4/4 (100%) | 6/7 (86%) | 3/4 (75%) | 5/7 (71%) |
| HAI Response (≥4 Fold Change) after the 2nd Dose (Day 56 HAI Titer Compared to Day 0) | ||||||||
| 2015–2016 (n = 9) | 0/4 (0%) | 0/5 (0%) | 0/4 (0%) | 0/5 (0%) | 0/4 (0%) | 0/5 (0%) | 2/4 (50%) | 2/5 (40%) |
| 2016–2017 (n = 41) | 11/20 (55%) | 6/21 (29%) | 12/20 (60%) | 6/21 (29%) | 19/20 (95%) | 15/21 (71%) | 16/20 (80%) | 15/21 (71%) |
| 2017–2018 (n = 25) | 4/14 (29%) | 5/11 (45%) | 5/14 (36%) | 3/11 (27%) | 12/14 (86%) | 8/11 (73%) | 7/14 (50%) | 8/11 (73%) |
| 2016–2017 (n = 41) | ||||||||
| Low A and Low D (n = 9) | 0/3 (0%) | 1/6 (17%) | 1/3 (33%) | 2/6 (33%) | 2/3 (67%) | 4/6 (67%) | 2/3 (67%) | 5/6 (83%) |
| High A and Low D (n = 11) | 6/7 (86%) | 4/4 (100%) | 6/7 (86%) | 2/4 (50%) | 7/7 (100%) | 2/4 (50%) | 7/7 (100%) | 3/4 (75%) |
| Low A and High D (n = 10) | 3/6 (50%) | 0/4 (0%) | 3/6 (50%) | 0/4 (0%) | 6/6 (100%) | 2/4 (50%) | 4/6 (67%) | 2/4 (50%) |
| High A and High D (n = 11) | 2/4 (50%) | 1/7 (14%) | 2/4 (50%) | 2/7 (29%) | 4/4 (100%) | 7/7 (100%) | 3/4 (75%) | 5/7 (71%) |
© 2019 by the authors. Licensee MDPI, Basel, Switzerland. This article is an open access article distributed under the terms and conditions of the Creative Commons Attribution (CC BY) license (http://creativecommons.org/licenses/by/4.0/).
Share and Cite
Patel, N.; Penkert, R.R.; Jones, B.G.; Sealy, R.E.; Surman, S.L.; Sun, Y.; Tang, L.; DeBeauchamp, J.; Webb, A.; Richardson, J.; et al. Baseline Serum Vitamin A and D Levels Determine Benefit of Oral Vitamin A&D Supplements to Humoral Immune Responses Following Pediatric Influenza Vaccination. Viruses 2019, 11, 907. https://doi.org/10.3390/v11100907
Patel N, Penkert RR, Jones BG, Sealy RE, Surman SL, Sun Y, Tang L, DeBeauchamp J, Webb A, Richardson J, et al. Baseline Serum Vitamin A and D Levels Determine Benefit of Oral Vitamin A&D Supplements to Humoral Immune Responses Following Pediatric Influenza Vaccination. Viruses. 2019; 11(10):907. https://doi.org/10.3390/v11100907
Chicago/Turabian StylePatel, Nehali, Rhiannon R. Penkert, Bart G. Jones, Robert E. Sealy, Sherri L. Surman, Yilun Sun, Li Tang, Jennifer DeBeauchamp, Ashley Webb, Julie Richardson, and et al. 2019. "Baseline Serum Vitamin A and D Levels Determine Benefit of Oral Vitamin A&D Supplements to Humoral Immune Responses Following Pediatric Influenza Vaccination" Viruses 11, no. 10: 907. https://doi.org/10.3390/v11100907