Developing Allometric Equations for Estimating Shrub Biomass in a Boreal Fen
by
 , ,
, ,
Annie He
1,*, 
Gregory J. McDermid
1 ,
,
Mir Mustafizur Rahman
1,
Maria Strack
2,
Saraswati Saraswati
2 and
Bin Xu
3 1
Department of Geography, University of Calgary, 2500 University Dr. NW, Calgary, AB T2N 1N4, Canada
2
Department of Geography and Environmental Management, University of Waterloo, 200 University Ave W, Waterloo, ON N2L 3G1, Canada
3
NAIT Boreal Research Institute; 1R2, 8102 99 Ave Peace River, AB T8S 1R2, Canada
*
Author to whom correspondence should be addressed.
Forests 2018, 9(9), 569; https://doi.org/10.3390/f9090569
Submission received: 18 June 2018
/
Revised: 11 September 2018
/
Accepted: 13 September 2018
/
Published: 15 September 2018
(This article belongs to the Section Forest Inventory, Modeling and Remote Sensing)
Abstract
:Allometric equations for estimating aboveground biomass (AGB) from easily measured plant attributes are unavailable for most species common to mid-continental boreal peatlands, where shrubs comprise a large component of the vegetation community. Our study develops allometric equations for three dominant genera found in boreal fens: Alnus spp. (alder), Salix spp. (willow) and Betula pumila (bog birch). Two different types of local equations were developed: (1) individual equations based on genus/phylogeny, and (2) a general equation that pooled all individuals regardless of genera. The general equation had a R2 = 0.97 (n = 82), and was not significantly different (p > 0.05) than any of the phylogenetic equations. This indicated that a single generalized equation is sufficient in estimating AGB for all three genera occurring in our study area. A closer look at the performance of the general equation revealed that smaller stems were predicted less accurately than larger stems because of the higher variability of leafy biomass found in small individuals. Previously published equations developed in other ecoregions did not perform as well as our local equations.
1. Introduction
We require improved strategies for quantifying vegetation biomass in peatlands [1,2] which contain mostly non-merchantable plant species that tend to be under-represented in the literature. Peatlands—a type of wetland that accumulates organic matter—store approximately one third of the planet’s soil carbon [3] while comprising just 3% of the total land surface [4]. Since plants facilitate carbon storage through photosynthesis [5], vegetation-biomass estimates are necessary for calculating carbon budgets [6,7] and are a key element of carbon-dynamics models [8]. Ground-based measurements of standing biomass are also useful for calibrating and validating remote-sensing models (e.g., [9,10]), and can provide valuable information on wildlife habitat [11], fire behavior [12], and biofuel stock [13].
Direct measurement of vegetation biomass is expensive and time-consuming [14], and allometric equations provide efficient alternatives to destructive sampling [15]. Allometry uses one or more plant dimensions (e.g., tree diameter at breast height) to estimate a separate dimension (e.g., stem volume) that is more difficult to obtain. However, most published allometrics focus on commercially valuable tree species (e.g., [16,17]). This is especially problematic for researchers working in boreal peatlands, where trees comprise a relatively small proportion of vegetation communities [18].
Shrubs are multi-stemmed woody plants that can account for up to 88% of the total aboveground biomass in Canadian continental boreal peatlands, based on the synthesis done in Campbell et al. [19]. However, the literature on peatland-shrub allometry is scant. Connolly and Grigal [20] provide one of the few-known sources of allometric equations for wetland shrubs, but the portability of these—or other models from mixed or upland areas—to boreal peatlands remains unassessed. Here, we define portability as the ability of an allometric equation to perform effectively under conditions that are different from those where it was originally developed. Previous research has shown that species can produce strong effects on allometric relationships [21]. Similarly, allometric equations can vary substantially from one region to another [6,22,23]. Buech and Rugg [24] inspected biomass-allometry relations for five species of shrubs common to northeastern Minnesota, and found that species- and site-specific equations were more effective than generalized equations, with few exceptions. The value of local equations for shrub-biomass estimation has been reported in the western Himalaya [25], Argentina [26], and northeastern California [27]. However, this finding is not universal. For example, Berner et al. [28] found that allometric relationships for dwarf birch (Betula nana L.) varied little across forest and tundra ecosystems in Siberia and Alaska. Other authors [29,30,31] have emphasized the controls of plant size on allometrics, highlighting the importance of remaining within the size domain of the equations. Portability of equations is important in allometric studies because an equation that can be used across multiple regions can greatly reduce the amount of time, labor, and destructive sampling involved with biomass estimation.
The overall objective of the research reported in this paper was to develop effective allometric equations for estimating aboveground shrub biomass at a boreal fen in west-central Alberta, Canada. In doing so, we first assessed the portability of published allometric equations for shrubs [20,28,32] to our study area, and then assessed the need for genus-specific equations, which we refer to as phylogenetic equations in this paper.
2. Materials and Methods
2.1. Study Area
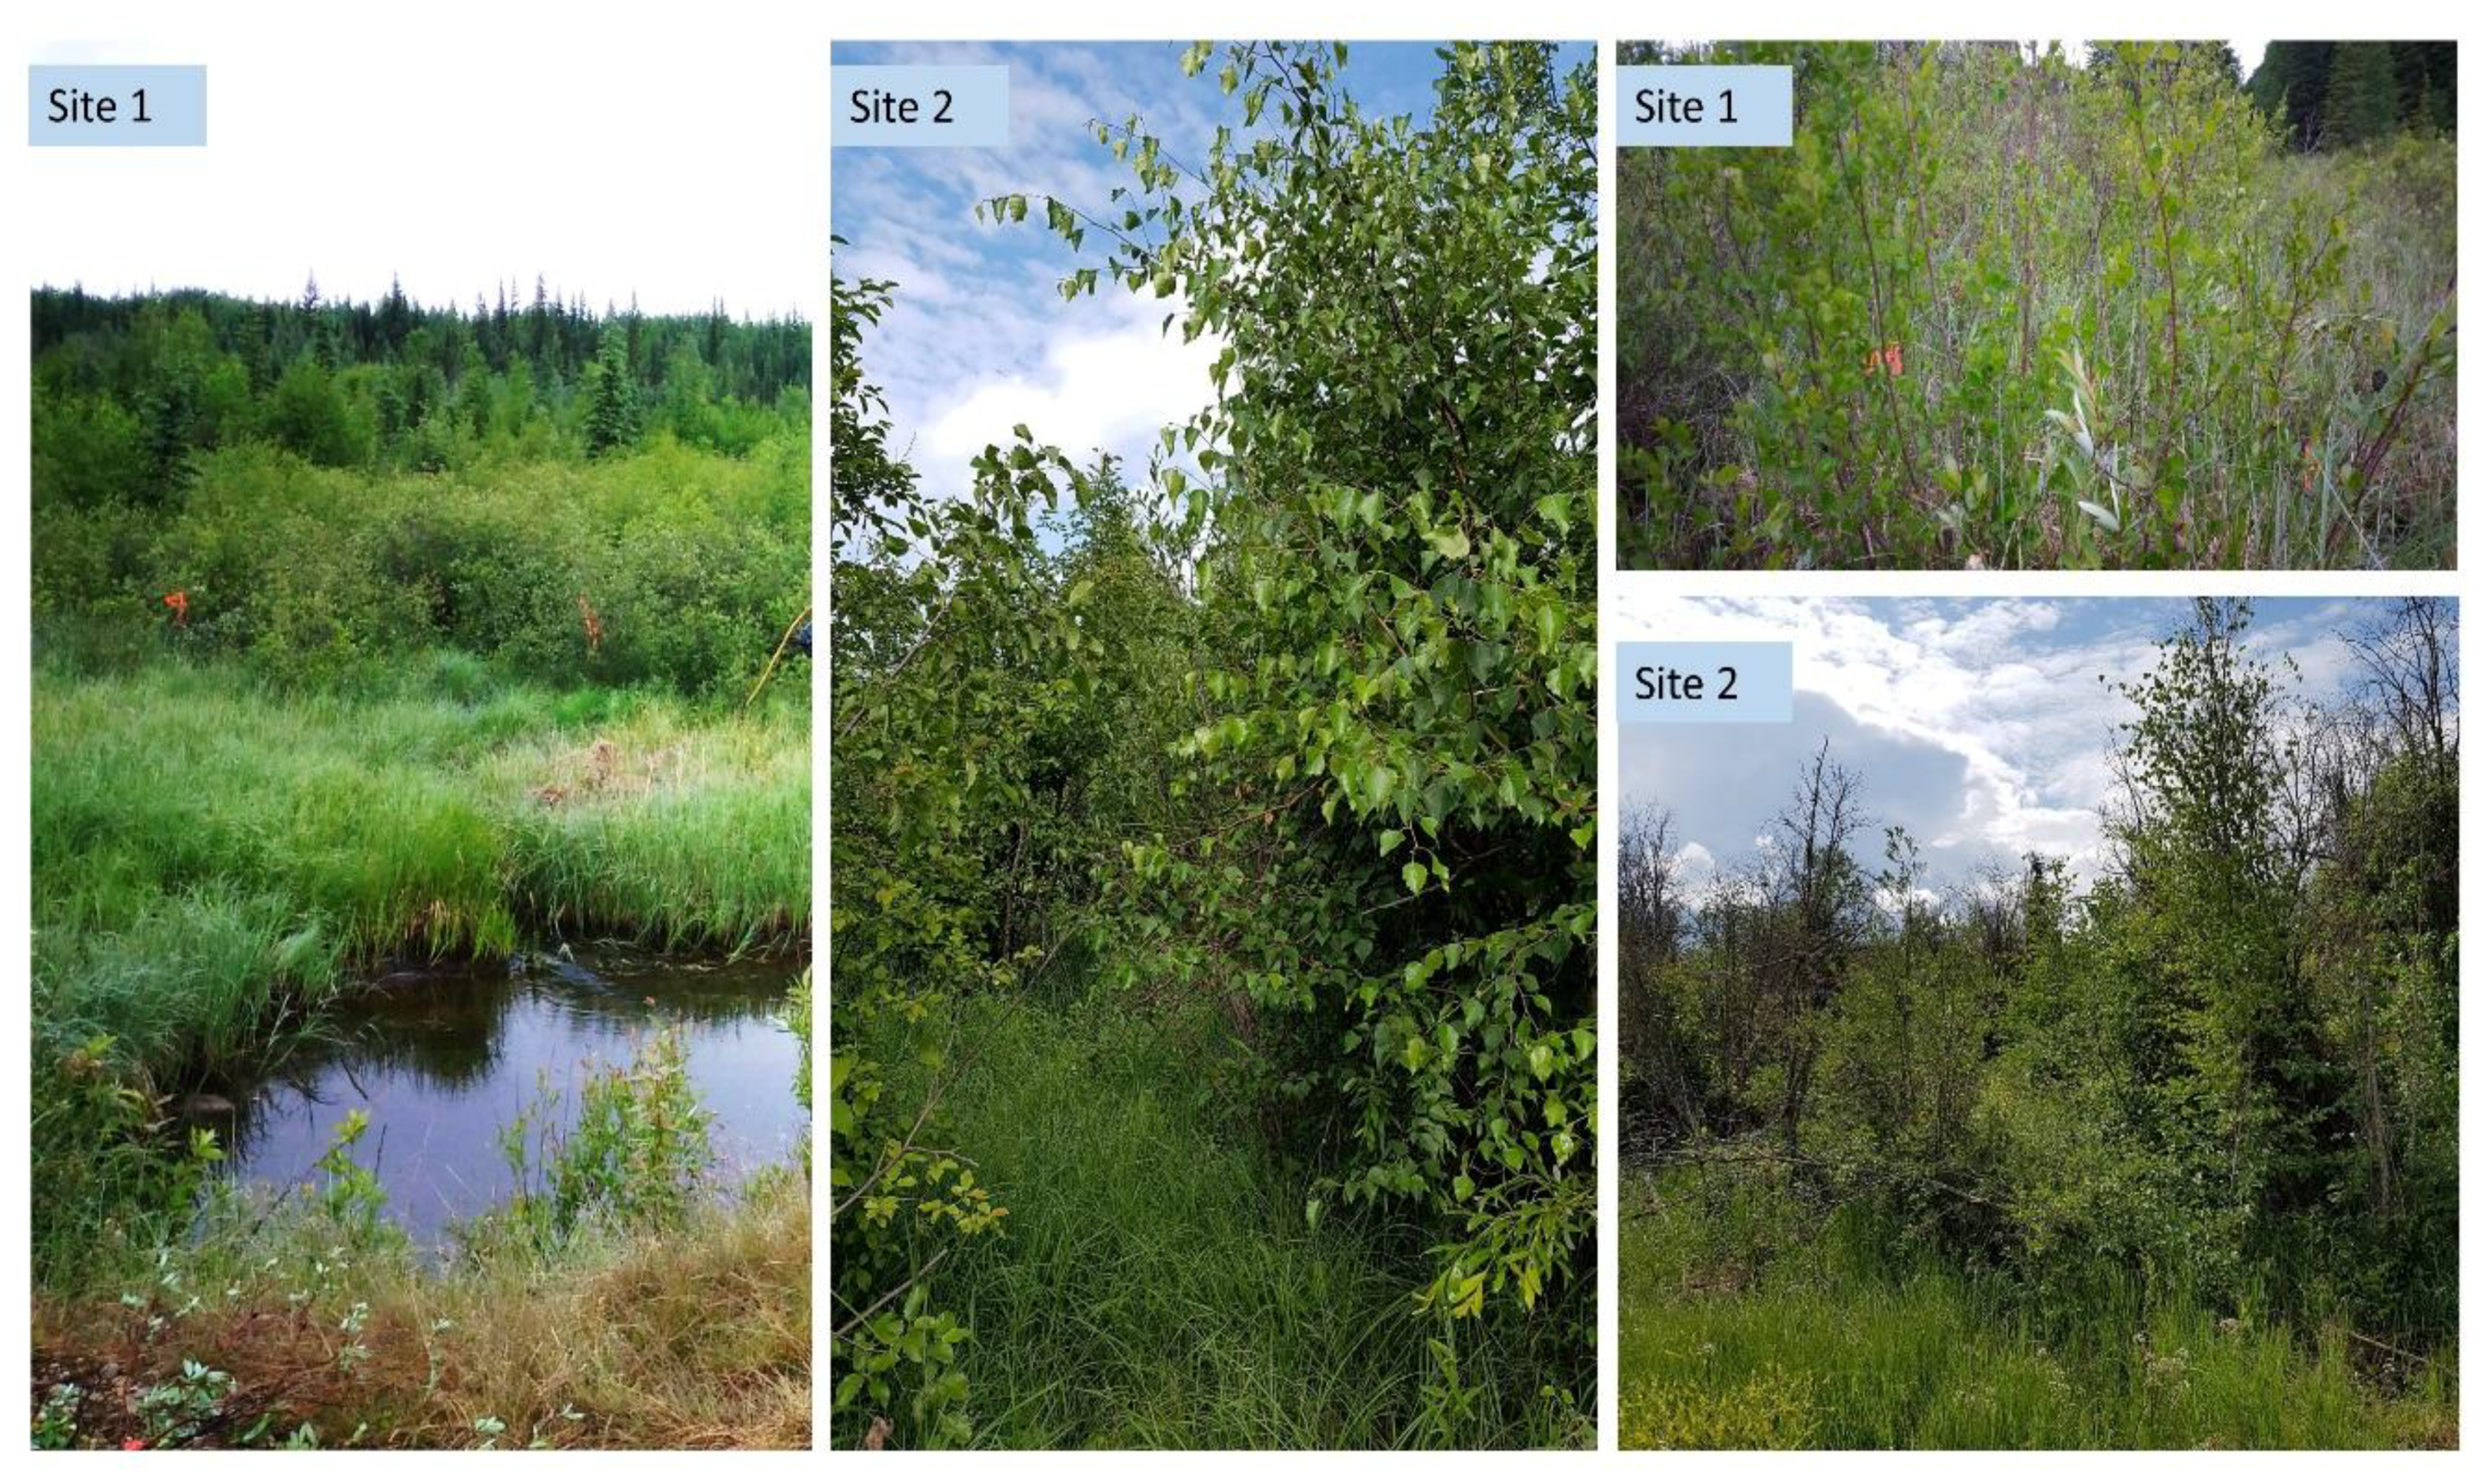
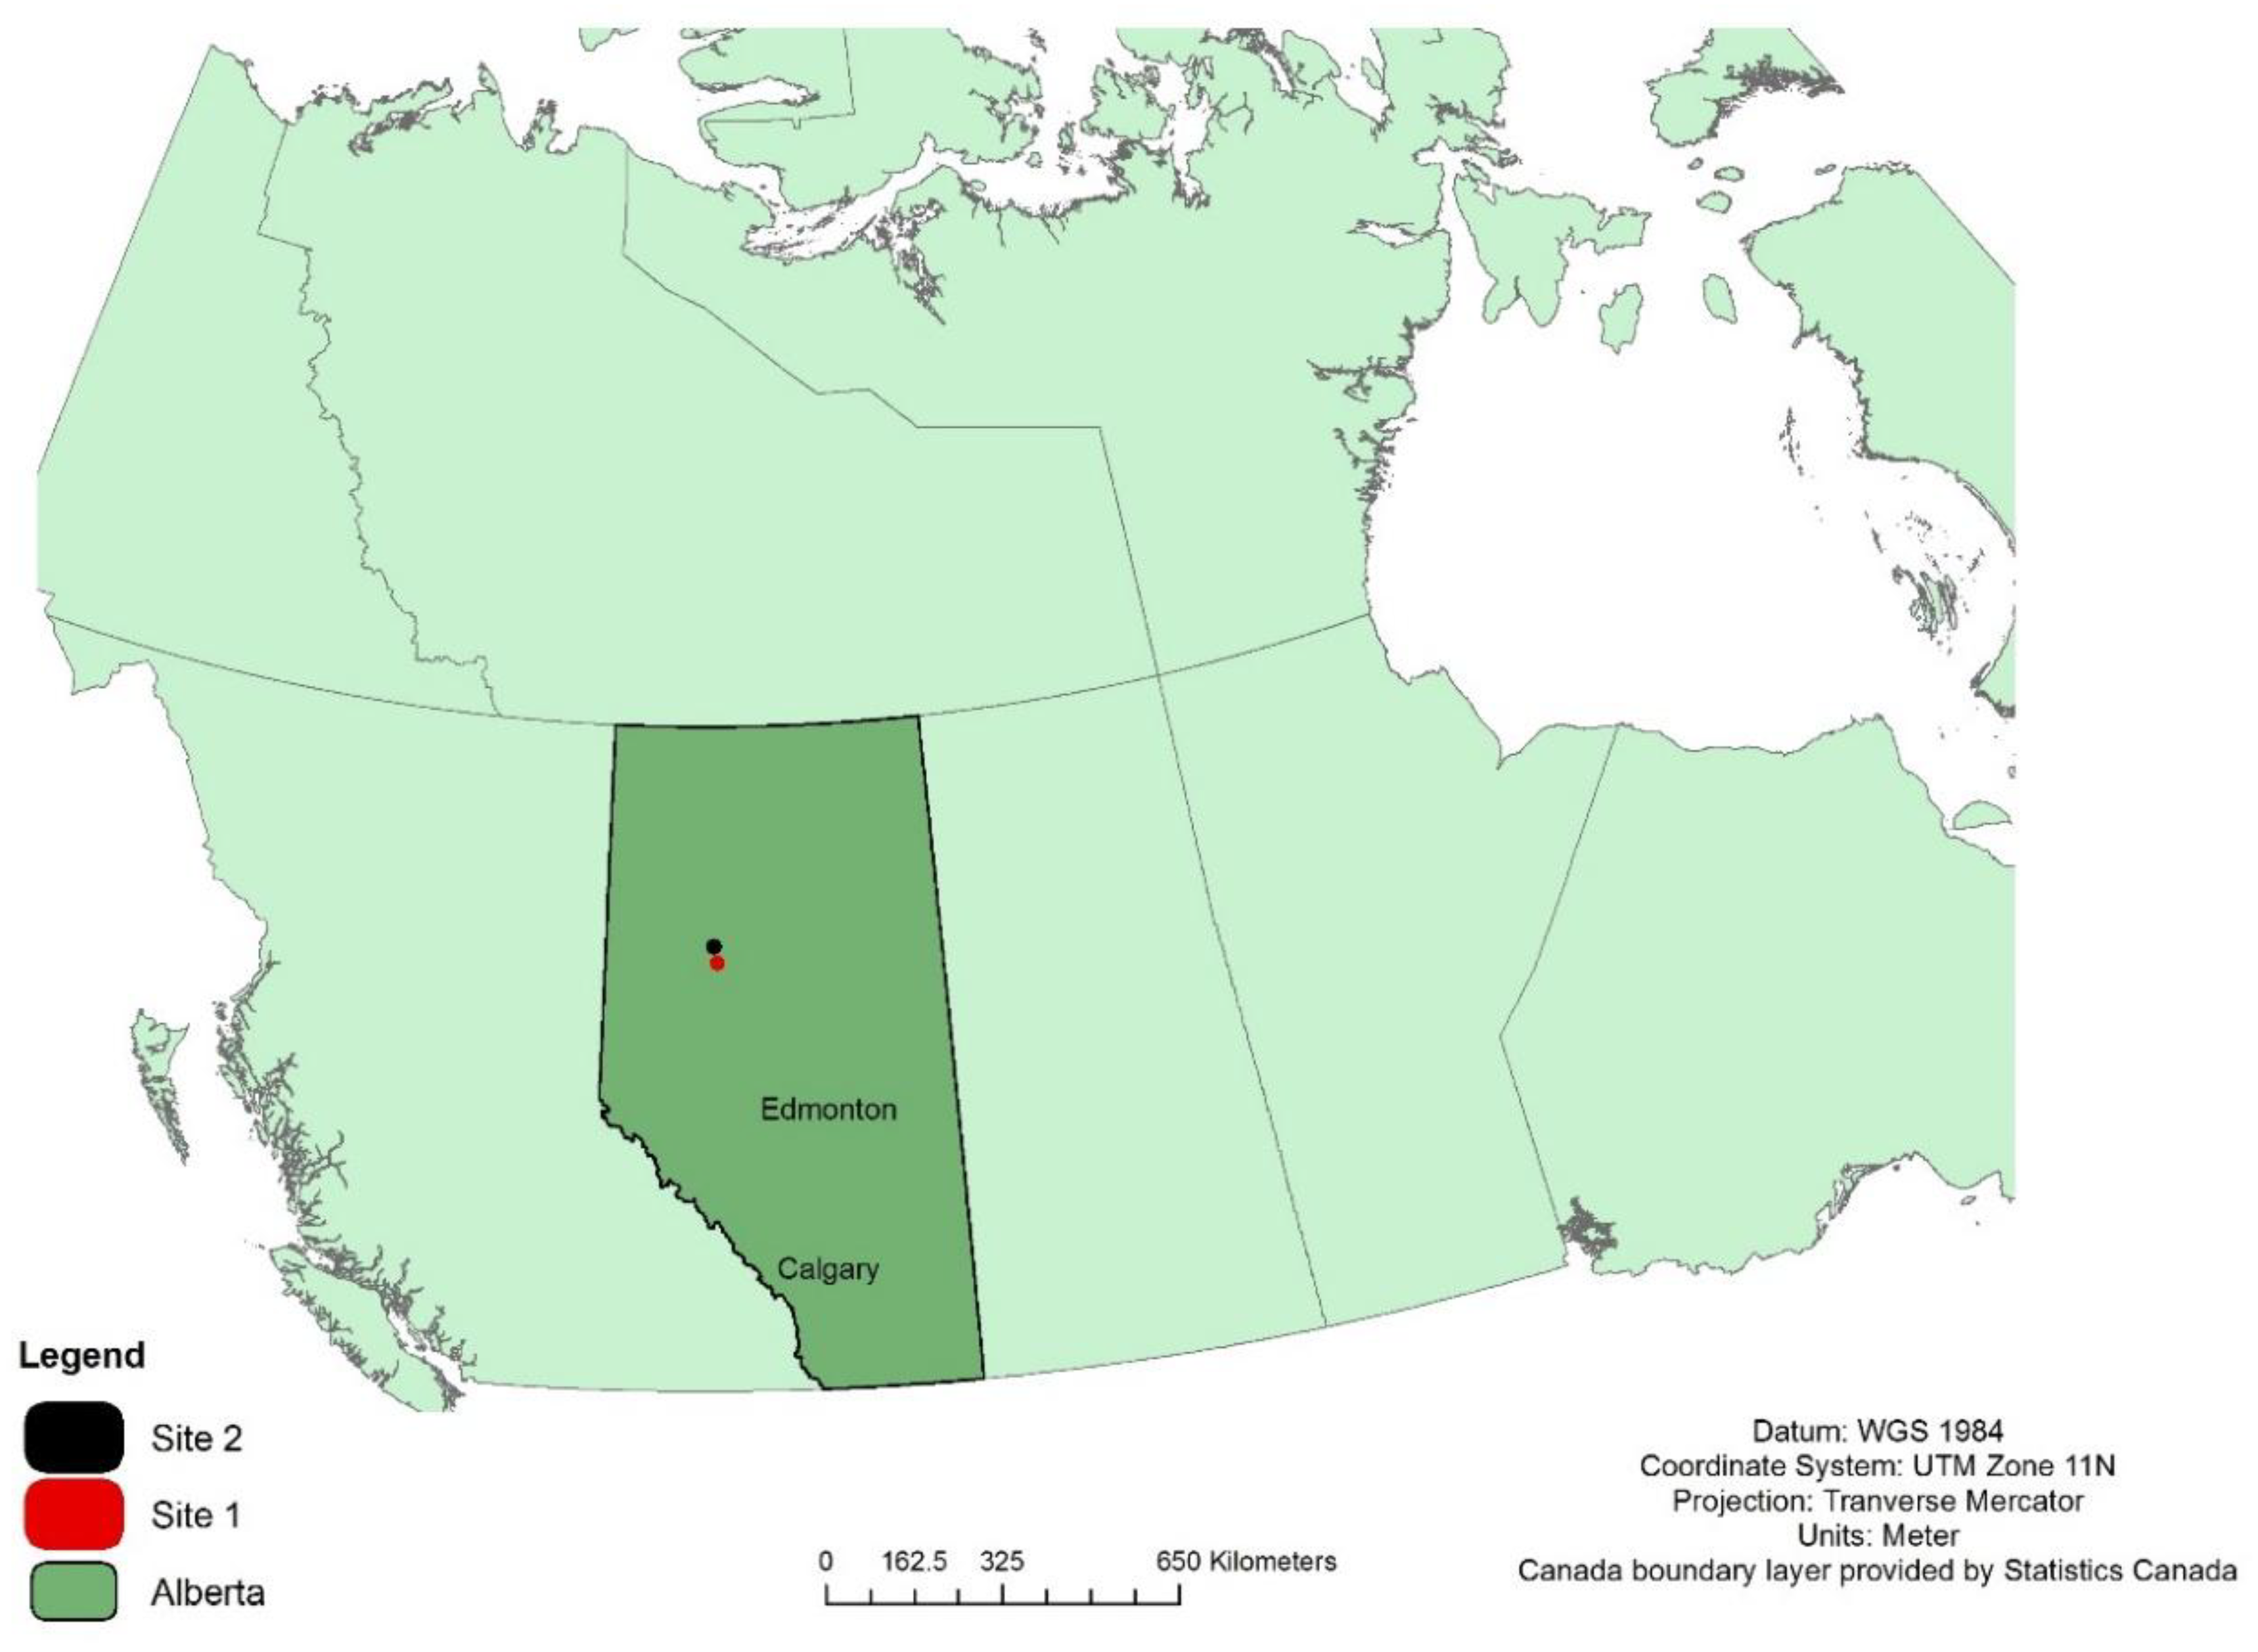
Field work was conducted at two sites near the Canadian town of Peace River, Alberta, in the northern boreal region of the province (Figure 1 and Figure 2). Both sites fall within the Dry Mixedwood natural subregion, where the mean annual temperature is 1 °C and mean annual precipitation is 461 mm [33]. This subregion’s climate is characterized by warmer summers and milder winters compared to the other subregions in the boreal forest region [33]. Site 1 is a shrubby fen composed primarily of alder (Alnus spp.), willow (Salix spp.), and bog birch (Betula pumila L.) ranging in height from 30 cm to 4 m. Site 2 is also a shrubby fen hosting the same primary species as site 1 with the addition of paper birch (Betula papyrifera Marshall). The vegetation on site 2 ranged up to 9 m in height and was added primarily to include samples at the top end of the height range (>2 m).
2.2. Aboveground Biomass Sampling
We first visited the study area on 5 June 2017 to perform a preliminary survey which gathered information on the range of sizes for each shrub genus across Site 1. During this survey, four transects were delineated to run east-west across the site and spaced 25 m apart. Every 10 m along the transect, the height of all shrubs that fell within ~0.5 m radius of the point was recorded. The locations of these plants were recorded on a Garmin Montana 600 handheld GPS and the shrubs were marked with flagging tape. All marked plants were then categorized by their height and genus. A stratified random sampling approach was used to choose the shrubs that would be harvested in a second visit, to ensure that the destructively sampled shrubs would be representative of the size variability within each genus.
Site 2 was added to the study to incorporate larger individuals (>2 m in height) for the development of allometric equations. A field survey for a separate project indicated that the shrubs found on Site 2 were larger than the ones that are found on Site 1. The inclusion of these larger individuals allowed for the developed equations to be applicable to a wider range of heights.
Destructive sampling on Site 1 took place on 15 June 2017; sampling on Site 2 was completed on 21 August 2017. A total of 55 shrubs were harvested. The number of stems for each shrub ranged from 1–30 (Table 1). Three stems from each individual shrub were chosen to be included in the development of allometric equations, resulting in approximately thirty stems per genus from Site 1. Only one stem per shrub was harvested for samples collected from Site 2 (Table 1). Field crews cut stems as close to the ground as possible and stored them at 4 °C for no longer than 48 h prior to processing. Stem length, basal diameter, and stem diameter at 15 cm height were measured in the laboratory. Stem length (to the nearest centimeter) was measured with a standard measuring tape, and basal diameter (to the nearest 0.1 millimeter) was measured using a digital caliper. Samples were then dried at 70 °C until a constant mass was reached. The leaves and stems were separated and weighed with a Denver Instrument SI-6002 scale that measured to the nearest gram. The descriptive statistics for all destructive samples can be found in Table 1.
2.3. Allometrics
2.3.1. Local Equations
We developed local allometric equations for aboveground dry biomass (M) as:
where a and b are the fitted coefficients and D is the basal diameter. IBM SPSS 24.0 (IBM Corporation, Armonk, NY, USA) statistical software was used for the development of all equations. We elected to use non-linear models, which assume normally distributed and additive errors, over log-transformed linear models, which assume log-normally distributed and multiplicative errors, for two reasons. First, the few existing allometric models for wetland shrubs [20,28,32] are also non-linear. Developing similar models provided an easier means of comparing parameters and fulfilling our first objective. The power-function form of the model used here has been employed by many previous researchers (e.g., [28,29,34]). Second, our project goals included developing models of stand biomass, and non-linear models do a better job with larger individuals. We tested both basal diameter and stem length as the measurable parameter but achieved better results with basal diameter, as have others [1,6,16,20,32,35]. We worked here in the frequentist framework. No Bayesian prior probabilities were employed.
Recognizing the lack of independence in our samples from collecting multiple stems from one shrub, we also used a mixed-model approach, with the basal diameter as the fixed effect and the individual shrub as the random effect. We found that the mixed model was not statistically different from the ordinary least squares (OLS) regression model, so we continued with the OLS approach for reasons of parsimony.
Two categories of equations were developed for predicting aboveground biomass: (i) a general equation, and (ii) phylogenetic equations based on genera. The general equation drew from all available shrubs sampled at our study sites, regardless of size or genera. We did, however, randomly reduce the number of contributing Salix samples for the general equation from 49 to 30 in order to avoid overrepresentation of Salix compared to other shrub genera. Phylogenetic equations were developed for each of the three shrub genera present at our study sites: Alnus, Salix, and Betula. The accuracy and goodness-of-fit for each equation were assessed using standard root-mean-square errors (RMSE) and coefficients of determination (R2) metrics. We tested for significant differences amongst equation coefficients using t-tests, where t values were calculated as:
where b1 is the coefficient of equation 1 and b2 is the coefficient of equation 2; SEb1 and SEb2 are the standard error of each equation coefficient, respectively. The null hypothesis is that there is no difference between the coefficients being compared. The purpose of this test is to determine if the rate of change between basal diameter and aboveground biomass is different across the equations. Therefore, the slope coefficient was first tested using this test. If there were no significant differences between the slope coefficients, the test statistic described by Zar [36] was used to compare the a coefficient (or y-intercept).
2.3.2. Published Equations
Published phylogenetic equations that were reported as a power function and that used basal diameter as the measurable parameter were compared against our general equation. Berner et al. [28] and Connolly & Grigal [20] developed phylogenetic equations for the same three genera across arctic sites and wetland sites, respectively. Brand & Smith [32] developed an equation for Salix spp. compiled from three other sources whose study sites were in Minnesota. The R2 and RMSE for each published regression was calculated against the samples from our study. The slope coefficient was also compared against the slope coefficient for the general equation (Equation (2)).
3. Results
3.1. Local Equations
Table 2 summarizes the equation parameters, accuracy, and goodness-of-fit for each of the 5 local equations developed for our study area. All phylogenetic equations had an R2 > 0.9, corroborating that basal diameter is a significant predictor of aboveground biomass. The high R2 value of the general equation (R2 = 0.967, RMSE = 0.293 grams) suggests that it can be used to accurately estimate the biomass of all three phylogenetic groups. There was no significant difference between the coefficients of the general equation with any of the phylogenetic equations (p > 0.05), suggesting that such differentiation is not necessary at our study site.
3.2. Published Equations
Table 3 summarizes the parameters of the published equations found in the literature. The Conolly & Grigal [20] equations (R2 = 0.879–0.956) predicted biomass at our sites better than the Berner et al. equations (R2 = 0.608–0.810). The Salix equation from Brand & Smith [32] also had a high goodness of fit (R2 = 0.947). When compared to our general equation, however, all equations were significantly different, with the exception of the Salix equation published by Conolly & Grigal [20]. There were also significant differences between the published equations and our phylogenetic equations (Table S1). We could not test for differences in the a coefficient because we did not have access to the data used to develop the published equations.
4. Discussion
4.1. The Value of Phylogenetic Equations
Our testing indicated that the relationship between basal diameter and aboveground biomass did not differ significantly across genera, and that there was no significant difference between phylogenetic equations and the general equation developed for our study area. These findings are similar to Sun et al. [31], who found phylogeny to exert little influence on allometric coefficients for shrubs in China. In our study area, the physical differences were most apparent between Alnus and Betula. Alnus individuals, in comparison with the other two genera, had a more tree-like appearance, were generally larger and had a lower number of stems, whereas Betula individuals were much smaller and many-stemmed (Table 1). The growth form of Salix was more variable than the other two genera; some individuals more closely resembled Alnus whereas others resembled Betula. Looking deeper among the phylogenetic equations (Table 4), we found Betula equations to be significantly different from Alnus (p = 0.02) and marginally different from Salix (p = 0.07). Alnus and Salix equations were very similar (p = 0.50). As a follow-up, we combined Alnus and Salix samples to test if the removal of Betula would create a significant change in the general equation. This modified equation was found to be not significantly different from the general equation (Table 2) and was also not significantly different from the Betula equation (p = 0.08). Despite the physical differences in Betula compared to the other two genera, the inclusion of these samples did not significantly change the general equation.
4.2. Equation Portability
A comparison of previously published equations with our local equations showed that we were unable to apply external equations to our study site. The Conolly & Grigal [20] and Brand & Smith [32] equations, with the exception of one, were significantly different from our general equation (Table 3). The Berner et al. [28] equation had a relatively lower R2 and higher RMSE compared to the other two publications (Table 3). The Berner et al. [28] equation was developed across arctic sites which may explain the lower goodness of fit. A common conclusion about equation portability is that it is more accurate when the sample size is larger and includes samples across many different sites [37,38,39]. Our study has a relatively small number of samples and study sites compared to the other three allometric studies. These limitations could reduce the portability of our equation to other regions, however, given the lack of wetland shrub specific allometric equations, equations presented here represent an important step to improved estimation of biomass across boreal peatlands.
4.3. The Variability in Size Classes
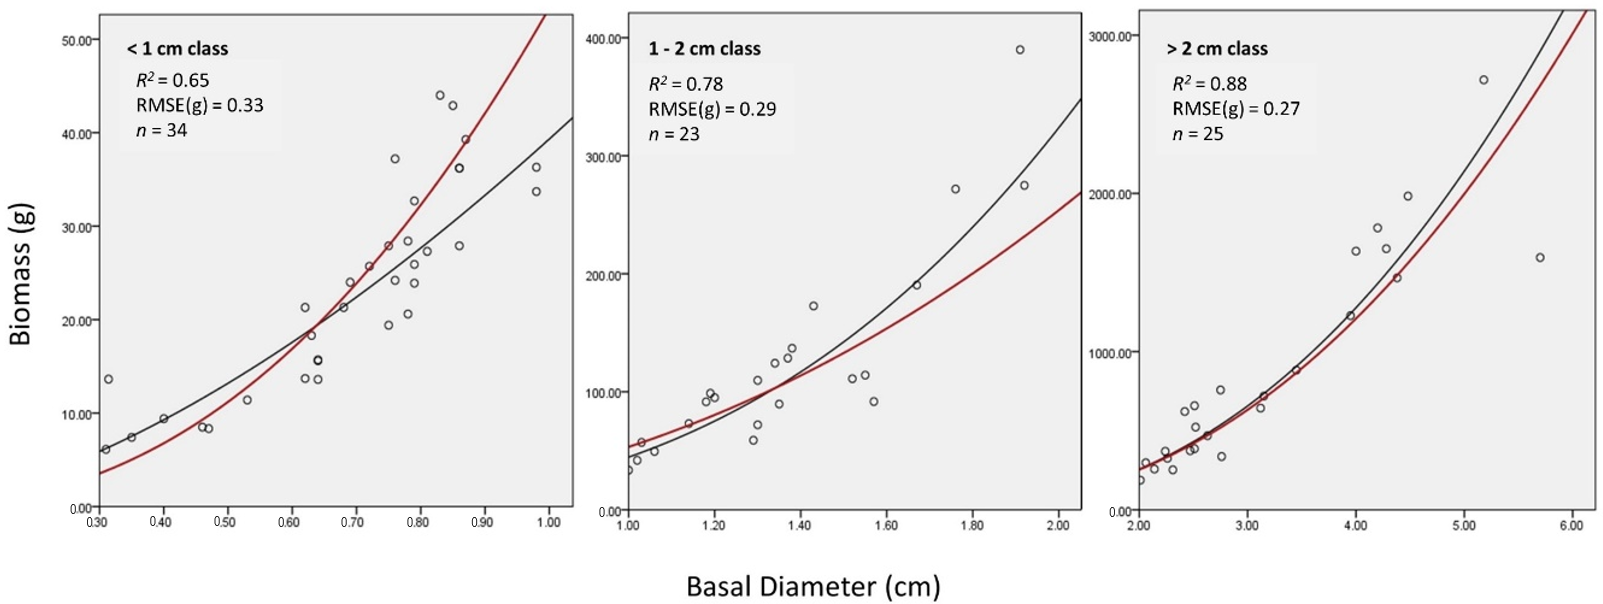
Some allometric studies have found success in the use of size-based equations instead of phylogenetic equations. For example, Paul et al. [6] generalized equations from species to plant functional types and noticed a minimal loss of accuracy. They found that the key differences in allometry are between trees, tall shrubs, and short shrubs which they attributed to the differences in stem geometry, life-span, woody density, and environmental conditions. We examined how size may influence the accuracy of our general equation by calculating the mean absolute percentage error (MAPE) for three categories of basal diameter class: (i) <1 cm, (ii) 1–2 cm, and (iii) >2 cm. The results are found in Table 5. MAPE is highest for the <1 cm class (8.2%) and lowest for the >2 cm class (2.0%). These results suggest that less of the variability found in the smaller shrubs (<1 cm class) is accounted for by the general equation. Figure 3 displays the general equation plotted alongside a regression line fit to each size class. The R2 and RMSE values (Figure 3) report the goodness of fit of the general equation with the points used to develop each size-based regression line. The R2 value was the highest for >2 cm basal diameter class (R2 = 0.88) and lowest for <1 cm basal diameter class (R2 = 0.65). The slope coefficients for each size-based regression line was tested against the slope of the generation equation using Equation (2). We found that there were significant differences between the general equation and those based on shrub size; particularly in the <1 cm (p < 0.01) and 1–2 cm (p = 0.05) basal diameter classes (Table 5). There was no significant difference between the general equation and the >2 cm basal diameter class (p = 0.72).
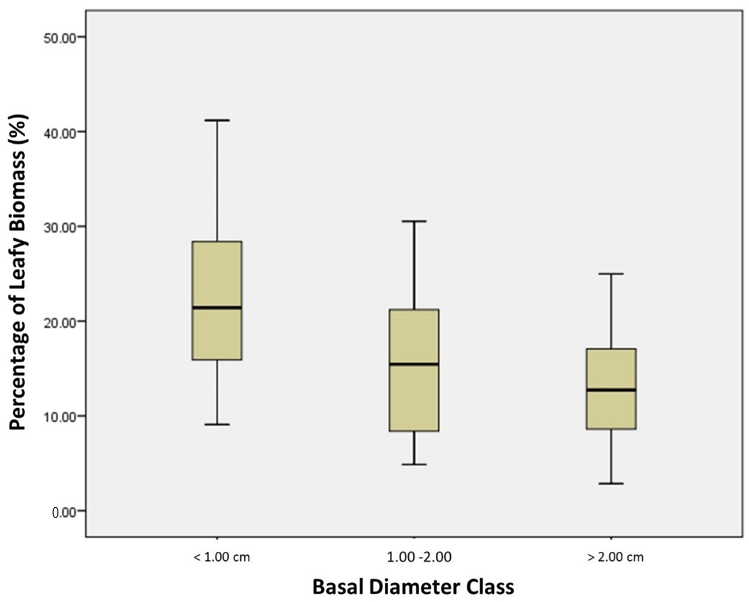
In order to further explore internal patterns in this dataset, we calculated the proportion of leafy biomass (Bl) as:
for each individual. Box plots displaying Bl for each basal-diameter class are shown in Figure 4. We found both a higher mean proportion (22.4% for <1 cm basal diameter) and range (9.1% to 41.2%) of leafy biomass for small basal-diameter individuals than medium (15.9% mean and 4.9% to 30.5% range for 1–2 cm basal diameter) and large (13.2% mean and 2.9% to 25.0% range for >2 cm basal diameter) individuals. Other studies have found a decline in leafy mass and an increase in stem mass as a tree ages [38,40,41]. Forrester et al. [37] also noticed that foliage mass is more variable than stem or aboveground biomass. Based on these studies, we theorize that the increased leafy biomass variability found in the <1 cm basal diameter class may contribute to the poorer fit of the general allometric equation for this class; however, more data is required to confirm this observation.
5. Conclusions
Allometric equations developed for shrubs have been underrepresented in the literature. Our study has developed three phylogenetic equations and one general equation that accurately estimated the aboveground biomass (AGB) in a boreal fen. Important lessons were learned which addressed some of the highly debated topics found in the allometric literature [6,22,23,24,25,26,27,28]. We found that local equations provide more accurate AGB estimates compared to previously published equations developed in other ecoregions (Table 3). We also found that equations based on shrub genus were not significantly different from a pooled equation of all shrub genera (Table 2). Through our analysis, we noticed a higher variability in the proportion of leafy biomass for smaller shrubs (<1 cm basal diameter) compared to larger shrubs (>1 cm basal diameter) (Figure 4). This higher variability may explain why the AGB of smaller shrubs were predicted less accurately. If this is the case, future allometric studies may consider excluding leafy biomass to avoid the increased variability.
Although the portability of our local equations remains unassessed, these boreal-peatland specific equations can be used as a baseline for testing in other peatland sites. These equations will also be useful for future efforts in estimating biomass in boreal peatland regions.
Supplementary Materials
The following are available online at https://www.mdpi.com/1999-4907/9/9/569/s1, Table S1: Comparison of published equations. Z (or t) values represent differences in slope (b) from that of the associated phylogenic equation, and include p-values. Those differences that are significant at the 0.05 threshold are marked as *.
Author Contributions
A.H. assisted with the development of the experimental design, performed the field work, completed the data analysis, and wrote the first draft of the manuscript. G.J.M. and M.M.R. conceived of the study and assisted with the development of the experimental design. M.S. and B.X. assisted with the fieldwork and interpretation of the results. S.S., G.J.M, M.M.R., M.S. and B.X. were involved in the editing process of this manuscript.
Acknowledgments
Research funding was provided by Emissions Reduction Alberta (grant BI40020), Shell Canada Ltd., Canadian Natural Resources, and the Natural Sciences and Engineering Research Council of Canada. Shell Canada provided site access and logistical support. We also thank the Northern Alberta Institute of Technology (NAIT) for the field equipment and logistical support, Melanie Bird from NAIT for the field and administrative support, Bret Collins for assisting with field work and processing the field samples, and Tak Fung with the University of Calgary for his assistance with data analysis.
Conflicts of Interest
The authors declare no conflict of interest. The funding sponsors had no role in the design of the study; in the collection, analyses, or interpretation of data; in the writing of the manuscript; or in the decision to publish the results.
References
- Brown, S. Measuring carbon in forests: Current status and future challenges. Environ. Pollut. 2002, 116, 363–372. [Google Scholar] [CrossRef]
- Nwaishi, F.; Petrone, R.M.; Price, J.S.; Andersen, R. Towards developing a functional-based approach for constructed peatlands evaluation in the Alberta oil sands region, Canada. Wetlands 2015, 35, 211–225. [Google Scholar] [CrossRef]
- Tarnocai, C. The impact of climate change on Canadian peatlands. Can. Water Resour. J. 2009, 34, 453–466. [Google Scholar] [CrossRef]
- Yu, Z.; Loisel, J.; Brosseau, D.P.; Beilman, D.W.; Hunt, S.J. Global peatland dynamics since the Last Glacial Maximum. Geophys. Res. Lett. 2010, 37, 13. [Google Scholar] [CrossRef]
- Le Quere, C.; Andrew, R.M.; Friedlingstein, P.; Sitch, S.; Pongratz, J.; Manning, A.C.; Korsbakken, J.I.; Peters, G.P.; Canadell, J.G.; Jackson, R.B.; et al. Global carbon budget 2017. Earth Syst. Sci. Data 2018, 10, 405–448. [Google Scholar] [CrossRef]
- Paul, K.I.; Roxburgh, S.H.; Chave, J.; England, J.R.; Zerihun, A.; Specht, A.; Lewis, T.; Bennett, L.T.; Baker, T.G.; Adams, M.A.; et al. Testing the generality of above-ground biomass allometry across plant functional types at the continent scale. Glob. Chang. Biol. 2016, 22, 2106–2124. [Google Scholar] [CrossRef] [PubMed]
- Le Toan, T.; Quegan, S.; Davidson, M.W.J.; Balzter, H.; Paillou, P.; Papathanassiou, K.; Plummer, S.; Rocca, F.; Saatchi, S.; Shugart, H.; et al. The biomass mission: Mapping global forest biomass to better understand the terrestrial carbon cycle. Remote Sens. Environ. 2011, 115, 2850–2860. [Google Scholar] [CrossRef]
- Zhang, Y.; Li, C.S.; Trettin, C.C.; Li, H.; Sun, G. An integrated model of soil, hydrology, and vegetation for carbon dynamics in wetland ecosystems. Glob. Biogeochem. Cycles 2002, 16, 1061. [Google Scholar] [CrossRef]
- Lefsky, M.A.; Harding, D.; Cohen, W.B.; Parker, G.; Shugart, H.H. Surface lidar remote sensing of basal area and biomass in deciduous forests of eastern Maryland, U.S.A. Remote Sens. Environ. 1999, 67, 83–98. [Google Scholar] [CrossRef]
- Kankare, V.; Raty, M.; Yu, X.W.; Holopainen, M.; Vastaranta, M.; Kantola, T.; Hyyppa, J.; Hyyppa, H.; Alho, P.; Viitala, R. Single tree biomass modelling using airborne laser scanning. Isprs J. Photogramm. Remote Sens. 2013, 85, 66–73. [Google Scholar] [CrossRef]
- Hyde, P.; Dubayah, R.; Walker, W.; Blair, J.B.; Hofton, M.; Hunsaker, C. Mapping forest structure for wildlife habitat analysis using multi-sensor (LiDAR, SAR/InSAR, ETM+, Quickbird) synergy. Remote Sens. Environ. 2006, 102, 63–73. [Google Scholar] [CrossRef]
- Keeley, J.E. Fire intensity, fire severity and burn severity: A brief review and suggested usage. Int. J. Wildland Fire 2009, 18, 116–126. [Google Scholar] [CrossRef]
- Stasko, T.H.; Conrado, R.J.; Wankerl, A.; Labatut, R.; Tasseff, R.; Mannion, J.T.; Gao, H.O.; Sanborn, S.D.; Knott, G. Mapping woody-biomass supply costs using forest inventory and competing industry data. Biomass Bioenergy 2011, 35, 263–271. [Google Scholar] [CrossRef]
- Verwijst, T.; Telenius, B. Biomass estimation procedures in short rotation forestry. For. Ecol. Manag. 1999, 121, 137–146. [Google Scholar] [CrossRef]
- Seidel, D.; Fleck, S.; Leuschner, C.; Hammett, T. Review of ground-based methods to measure the distribution of biomass in forest canopies. Ann. For. Sci. 2011, 68, 225–244. [Google Scholar] [CrossRef] [Green Version]
- TerMikaelian, M.T.; Korzukhin, M.D. Biomass equations for sixty-five North American tree species. For. Ecol. Manag. 1997, 97, 1–24. [Google Scholar] [CrossRef] [Green Version]
- Zianis, D.; Mencuccini, M. On simplifying allometric analyses of forest biomass. For. Ecol. Manag. 2004, 187, 311–332. [Google Scholar] [CrossRef] [Green Version]
- Whitehouse, H.E.; Bayley, S.E. Vegetation patterns and biodiversity of peatland plant communities surrounding mid-boreal wetland ponds in Alberta, Canada. Can. J. Bot. 2005, 83, 621–637. [Google Scholar] [CrossRef]
- Campbell, C.; Vitt, D.H.; Halsey, L.A.; Campbell, I.D.; Thormann, M.N.; Bayley, S.E. Net Primary Production and Standing Biomass in Northern Continental Wetlands; Information Report-Northern Forestry Centre, Canadian Forest Service: Edmonton, AB, Canada, 2000.
- Connolly, B.J.; Grigal, D.F. Biomass estimation equations for wetland tall shrubs. Minn. For. Res. Notes 1983, 284, 4. [Google Scholar]
- Mosseler, A.; Major, J.E.; Larocque, G.R. Allometric relationships from coppice structure of seven North American willow (salix) species. Biomass Bioenergy 2016, 88, 97–105. [Google Scholar] [CrossRef]
- Muukkonen, P. Generalized allometric volume and biomass equations for some tree species in Europe. Eur. J. For. Res. 2007, 126, 157–166. [Google Scholar] [CrossRef]
- Law, B.E.; Van Tuyl, S.; Cescatti, A.; Baldocchi, D.D. Estimation of leaf area index in open-canopy ponderosa pine forests at different successional stages and management regimes in Oregon. Agric. For. Meteorol. 2001, 108, 1–14. [Google Scholar] [CrossRef]
- Buech, R.R.; Rugg, D.J. Biomass relations of shrub components and their generality. For. Ecol. Manag. 1989, 26, 257–264. [Google Scholar] [CrossRef]
- Mandal, G.; Joshi, S.P. Estimation of above-ground biomass and carbon stock of an invasive woody shrub in the subtropical deciduous forests of Doon Valley, Western Himalaya, India. J. For. Res. 2015, 26, 291–305. [Google Scholar] [CrossRef]
- Rojo, V.; Arzamendia, Y.; Perez, C.; Baldo, J.; Vila, B. Double sampling methods in biomass estimates of andean shrubs and tussocks. Rangel. Ecol. Manag. 2017, 70, 718–722. [Google Scholar] [CrossRef]
- Huff, S.; Ritchie, M.; Temesgen, H. Allometric equations for estimating aboveground biomass for common shrubs in northeastern california. For. Ecol. Manag. 2017, 398, 48–63. [Google Scholar] [CrossRef]
- Berner, L.T.; Alexander, H.D.; Loranty, M.M.; Ganzlin, P.; Mack, M.C.; Davydov, S.P.; Goetz, S.J. Biomass allometry for alder, dwarf birch, and willow in boreal forest and tundra ecosystems of far northeastern Siberia and north-central Alaska. For. Ecol. Manag. 2015, 337, 110–118. [Google Scholar] [CrossRef]
- Paul, K.I.; Roxburgh, S.H.; England, J.R.; Ritson, P.; Hobbs, T.; Brooksbank, K.; Raison, R.J.; Larmour, J.S.; Murphy, S.; Norris, J.; et al. Development and testing of allometric equations for estimating above-ground biomass of mixed-species environmental plantings. For. Ecol. Manag. 2013, 310, 483–494. [Google Scholar] [CrossRef]
- Roxburgh, S.H.; Paul, K.I.; Clifford, D.; England, J.R.; Raison, R.J. Guidelines for constructing allometric models for the prediction of woody biomass: How many individuals to harvest? Ecosphere 2015, 6, 38. [Google Scholar] [CrossRef]
- Sun, H.; Wang, X.P.; Fan, Y.W.; Liu, C.; Wu, P.; Li, Q.Y.; Yin, W.L. Effects of biophysical constraints, climate and phylogeny on forest shrub allometries along an altitudinal gradient in northeast china. Sci. Rep. 2017, 7, 43769. [Google Scholar] [CrossRef] [PubMed]
- Brand, G.J.; Smith, W.B. Evaluating allometric shrub biomass equations fit to generated data. Can. J. Bot. 1985, 63, 64–67. [Google Scholar] [CrossRef]
- Natural Regions Committee. Natural Regions and Subregions of Alberta; Government of Alberta: Edmonton, AB, Canada, 2006.
- Bond-Lamberty, B.; Wang, C.; Gower, S.T. Aboveground and belowground biomass and sapwood area allometric equations for six boreal tree species of northern Manitoba. Can. J. For. Res. Rev. 2002, 32, 1441–1450. [Google Scholar] [CrossRef]
- Roussopoulos, P.J.; Loomis, R.M. Weights and Dimensional Properties of Shrubs and Small Trees of the Great Lakes Conifer Forest; USDA Forest Service: St. Paul, MN, USA, 1979; NC-178.
- Zar, J.H. Biostatistical Analysis, 4th ed.; Prentice Hall: Upper Saddle River, NJ, USA, 1999; pp. 324–359. [Google Scholar]
- Forrester, D.I.; Tachauer, I.H.H.; Annighoefer, P.; Barbeito, I.; Pretzsch, H.; Ruiz-Peinado, R.; Stark, H.; Vacchiano, G.; Zlatanov, T.; Chakraborty, T.; et al. Generalized biomass and leaf area allometric equations for European tree species incorporating stand structure, tree age and climate. For. Ecol. Manag. 2017, 396, 160–175. [Google Scholar] [CrossRef]
- Shaiek, O.; Loustau, D.; Trichet, P.; Meredieu, C.; Bachtobji, B.; Garchi, S.; Aouni, M.H.E. Generalized biomass equations for the main aboveground biomass components of maritime pine across contrasting environments. Ann. For. Sci. 2011, 68, 443. [Google Scholar] [CrossRef]
- Levia, D.F., Jr. A generalized allometric equation to predict foliar dry weight on the basis of trunk diameter for eastern white pine (Pinus strobus L). For. Ecol. Manag. 2008, 255, 1789–1792. [Google Scholar] [CrossRef]
- Porté, A.; Bosc, A.; Champion, I.; Loustau, D. Estimating the foliage area of maritime pine (Pinus pinaster Ait.) branches and crowns with application to modelling the foliage area distribution in the crown. Ann. For. Sci. 2000, 57, 73–86. [Google Scholar] [CrossRef]
- Wutzler, T.; Wirth, C.; Schumacher, J. Generic biomass functions for Common beech (Fagus sylvatica) in Central Europe: Predictions and components of uncertainty. Can. J. For. Res. 2008, 38, 1661–1675. [Google Scholar] [CrossRef]
Figure 1.
Field photos of Site 1 and Site 2. The photos for Site 1 were taken during June 2017; those for Site 2 were taken in April 2016.
Figure 1.
Field photos of Site 1 and Site 2. The photos for Site 1 were taken during June 2017; those for Site 2 were taken in April 2016.
Figure 2.
Map of Canada showing the location of Study Site 1 (56.9° N latitude, 116.8° W longitude) and Study Site 2 (56.4° N latitude, 116.8° W longitude).
Figure 2.
Map of Canada showing the location of Study Site 1 (56.9° N latitude, 116.8° W longitude) and Study Site 2 (56.4° N latitude, 116.8° W longitude).
Figure 3.
All samples separated into three basal diameter classes. The black line is a regression line that was fit for each group of samples. R2 and RMSE are reported based on how well the red line, the general regression line, fits each group of samples.
Figure 3.
All samples separated into three basal diameter classes. The black line is a regression line that was fit for each group of samples. R2 and RMSE are reported based on how well the red line, the general regression line, fits each group of samples.

Figure 4.
Box plots of the percentage of the total biomass that is represented by the leafy biomass for each basal diameter class.
Figure 4.
Box plots of the percentage of the total biomass that is represented by the leafy biomass for each basal diameter class.

Table 1.
Descriptive statistics of shrubs harvested at each of the two study sites.
| Shrubs Harvested | Stems Harvested | Average Height (m) | Average Number of Stems per Shrub | Basal Diameter Range (cm) | Stem Length Range (cm) | Dried Stem Biomass Range (g) | |
|---|---|---|---|---|---|---|---|
| Site 1 | |||||||
| Alnus spp. | 8 | 21 | 3.09 | 8 | 0.64–5.70 | 89–389 | 16–1598 |
| Salix spp. | 16 | 37 | 1.46 | 26 | 0.31–2.76 | 60–209 | 7–386 |
| Betula pumila | 13 | 25 | 1.59 | 18 | 0.31–1.37 | 39–250 | 6–129 |
| Site 2 | |||||||
| Alnus spp. | 6 | 6 | 4.89 | 1 | 3.12–5.18 | 381–545 | 643–2718 |
| Salix spp. | 12 | 12 | 3.45 | 1 | 1.16–2.75 | 242–450 | 78–1635 |
Table 2.
Summary of the allometric equations relating basal diameter to aboveground biomass, including coefficients of determination (R2), mean absolute percentage error (MAPE), root-mean-square errors (RMSE), and cross validated RMSE (CV-RMSE). The reported n represents number of stems. A 10-fold cross validation was repeated 10 times to obtain the CV-RMSE. The sample size (n) is the number of stems used to develop each regression. T-values represent differences in y-intercept (a) and slope (b) from that of the general equation, and include p-values.
| n | a | B | R2 | RMSE (g) | MAPE | CV-RMSE (g) | a Test-t-Value (p) | b Test-t-Value (p) | |
|---|---|---|---|---|---|---|---|---|---|
| Phylogenetic Equations | |||||||||
| Alnus | 27 | 44.06 | 2.395 | 0.983 | 0.209 | 2.9% | 0.194 | 1.83 (0.07) | 1.83 (0.07) |
| Salix | 49 | 55.85 | 2.325 | 0.943 | 0.344 | 6.2% | 0.325 | 0.94 (0.35) | 1.56 (0.12) |
| Betula | 25 | 49.52 | 2.027 | 0.907 | 0.254 | 7.2% | 0.260 | 0.19 (0.85) | 0.77 (0.44) |
| Alnus & Salix | 76 | 52.88 | 2.291 | 0.961 | 0.314 | 5.4% | 0.293 | 0.44 (0.66) | 0.56 (0.57) |
| General Equation | |||||||||
| General | 82 | 53.37 | 2.251 | 0.967 | 0.291 | 5.9% | 0.287 | N/A | N/A |
Table 3.
Summary of the published allometric equations relating basal diameter to aboveground biomass. The reported coefficients of determination (R2) and root-mean-square errors (RMSE) were calculated in relation to the local data in estimating aboveground biomass. D Range is the basal diameter range for stems used for the development of each equation. T values represent differences in slope (b) from that of the general equation, and include p-values. Those differences that are significant at the 0.05 threshold are marked as *.
| D Range (cm) | a | b | R2 | RMSE (g) | b Test-t-Value (p) | |
|---|---|---|---|---|---|---|
| Conolly & Grigal [20] | ||||||
| Alnus rugosa | 0.25–3 | 33.722 | 2.712 | 0.880 | 0.558 | 4.56 (<0.01) * |
| Salix spp. | 0.25–3 | 60.153 | 2.202 | 0.962 | 0.315 | 0.72 (0.48) |
| Betula pumila | 0.25–2.25 | 59.777 | 2.579 | 0.930 | 0.426 | 3.92 (<0.01) * |
| Berner et al. [28] | ||||||
| Alnus spp. pooled | 0.18–9.52 | 19.40 | 2.78 | 0.608 | 1.006 | 3.18 (<0.01) * |
| Salix spp. pooled | 0.01–6.30 | 21.80 | 2.64 | 0.687 | 0.899 | 2.64 (<0.01) * |
| Betula spp. pooled | 0.09–2.53 | 28.97 | 2.88 | 0.810 | 0.701 | 5.28 (<0.01) * |
| Brand & Smith [32] | ||||||
| Salix spp. | 0.25–3.81 | 44.86 | 2.539 | 0.947 | 0.372 | 3.81 (<0.01) * |
Table 4.
Comparison of local phylogenetic equations. T values represent differences in slope (b) from that of the general equation and include p-values. Those differences that are significant at the 0.05 threshold are marked as *.
Table 4.
Comparison of local phylogenetic equations. T values represent differences in slope (b) from that of the general equation and include p-values. Those differences that are significant at the 0.05 threshold are marked as *.
| Alnus | Betula | Salix | Alnus-Salix | |
|---|---|---|---|---|
| Alnus | - | - | - | - |
| Betula | 2.45 (0.02) * | - | - | - |
| Salix | 0.67 (0.50) | 1.86 (0.07) | - | - |
| Alnus-Salix | 1.25 (0.22) | 1.80 (0.08) | 0.34 (0.73) | - |
Table 5.
The mean average percentage error is reported for each group of samples separated by basal diameter size. T-values represent differences in slope (b) from that of the general equation and include p-values. Those differences that are significant at the 0.05 threshold are marked as *.
Table 5.
The mean average percentage error is reported for each group of samples separated by basal diameter size. T-values represent differences in slope (b) from that of the general equation and include p-values. Those differences that are significant at the 0.05 threshold are marked as *.
| <1 cm Class | 1–2 cm Class | >2 cm Class | |
|---|---|---|---|
| MAPE | 8.2% | 5.3% | 2.0% |
| t-value | 4.58 (<0.01) * | 2.00 (0.05) * | 0.36 (0.72) |
© 2018 by the authors. Licensee MDPI, Basel, Switzerland. This article is an open access article distributed under the terms and conditions of the Creative Commons Attribution (CC BY) license (http://creativecommons.org/licenses/by/4.0/).
Share and Cite
MDPI and ACS Style
He, A.; McDermid, G.J.; Rahman, M.M.; Strack, M.; Saraswati, S.; Xu, B. Developing Allometric Equations for Estimating Shrub Biomass in a Boreal Fen. Forests 2018, 9, 569. https://doi.org/10.3390/f9090569
AMA Style
He A, McDermid GJ, Rahman MM, Strack M, Saraswati S, Xu B. Developing Allometric Equations for Estimating Shrub Biomass in a Boreal Fen. Forests. 2018; 9(9):569. https://doi.org/10.3390/f9090569
Chicago/Turabian StyleHe, Annie, Gregory J. McDermid, Mir Mustafizur Rahman, Maria Strack, Saraswati Saraswati, and Bin Xu. 2018. "Developing Allometric Equations for Estimating Shrub Biomass in a Boreal Fen" Forests 9, no. 9: 569. https://doi.org/10.3390/f9090569
Note that from the first issue of 2016, this journal uses article numbers instead of page numbers. See further details here.