Article

Integrating Density into Dispersal and Establishment Limitation Equations in Tropical Forests

by
Marinés De la Peña-Domene
1,2,* and
Cristina Martínez-Garza
1
1
Centro de Investigación en Biodiversidad y Conservación, Universidad Autónoma del Estado de Morelos, Cuernavaca, Morelos 62209, Mexico
2
Coordinación General de Adaptación al Cambio Climático del Instituto Nacional de Ecología y Cambio Climático, Ciudad de México 14210, Mexico
*
Author to whom correspondence should be addressed.
Forests 2018, 9(9), 570; https://doi.org/10.3390/f9090570
Submission received: 12 July 2018 / Revised: 5 September 2018 / Accepted: 5 September 2018 / Published: 15 September 2018

Abstract

:
Plant recruitment in tropical forests reflects the chance that seeds arrive at a site resulting in seedling establishment. To inform tropical forest restoration, we ask how seed and seedling densities differentially affect dispersal and establishment limitation in successional habitats in a tropical agricultural landscape. Methods: In Los Tuxtlas Biosphere Reserve, we calculated indices of dispersal and establishment limitation using data on seed rain and seedling establishment in old-growth forest, secondary forest, and fenced pasture. We present an index that considers variations in dispersal- and establishment-limitation including density-weighted calculations. Results: There were greater dispersal and establishment limitations in pasture than in forests. Substantial differences in both dispersal and establishment limitation occurred among the 33 species for which seed and seedling data were available. Only 5% of all species had mid to low limitation in both dispersal and establishment. In contrast, 60% of all species showed high dispersal and establishment limitation. Plant recruitment in pastures is impeded by low seed arrival, given that 77% of the recorded species showed extremely high dispersal limitation (>90%). Conclusions: The low capacity of most species to arrive, seeds to germinate and seedlings to establish in pastures slow down succession back to forest.

1. Introduction

Implications of dispersal and recruitment limitation have a long history in plant ecology. For decades, the primary focus of dispersal was on consequences of long-distance dispersal for plant biogeography, an emphasis that remains relevant in predicting and evaluating colonization of distant habitats [1,2,3,4]. Advantages occur when seeds are dispersed far away from conspecific adults because density-dependent seed or seedling mortality from pathogens, insects, other enemies or competition are greater near fruiting trees [5,6,7,8,9]. Moreover, there is a general negative effect of density on seed survival and seedling emergence independent of samples close to fruiting trees [10]. It has become clear that mortality may be density-dependent or density-independent at different stages of plant development, from seeds to adults [11]. Higher seed densities can increase seedling recruitment but may also induce density-dependent mechanisms that act on high seedling densities, resulting in population regulation [11]. Density is a key component when evaluating dispersal and establishment limitations because intra- or interspecific competition in these forming communities matters.
Low seed input in tropical agricultural landscapes is one of the most important barriers to succession back to forest [12]. A very low transition probability between seed fall and juvenile recruitment is common [10,13]. While dispersal limitation may be a major factor for most species in rich plant communities [14,15,16], recruitment limitation is likely to occur where optimal microenvironmental sites (microsites) are scarce [17]. This is especially true for pastures with a long history (>35 years) of intensive use. Additionally, establishment limitation is expected to be most pronounced in highly diverse communities because so many species are rare, resulting in lower seed rain for rare compared to abundant species [15,18,19]. Therefore, restoring diversity in sites with a long history of intensive use will be a major challenge in the tropics.
Habitats differ greatly in the number and species composition of seed input, and likewise differ greatly in the factors that favor recruitment of some species over others from the seed rain. The distinction between dispersal limitation and establishment limitation is particularly important in the colonization of areas formerly dedicated to agriculture or grazing pastures, where sparse seed rain and low seedling survival limit natural succession and unassisted forest recovery [20,21,22,23,24,25,26,27] and minimal intervention restoration [28]. Physical and biological differences among habitats shape the species assemblages and limit dispersal and establishment of some species more than others. We are particularly interested in the differences in dispersal and establishment limitation among habitats, a set of constraints that is rarely studied. Here we address this community-level perspective by evaluating dispersal and establishment limitation in primary forest, secondary forest and pasture habitats.
Until recently, there had been no quantitative framework for distinguishing effects of seed-dispersal limitation (hereafter dispersal limitation) from limitation in establishment of seedlings (hereafter establishment limitation); both are components of recruitment limitation. Muller-Landau and colleagues (2002) [29] developed indices for dispersal and establishment limitation, based on the assumption that seed rain into seed traps can be compared with the emergence of seedlings on the forest floor near traps. These authors assumed that one seed of a species in a seed trap was sufficient to record presence of a species in seed rain, based on the notion that no more than one adult tree can occupy a limited area (e.g., 1 m2). Here, we extend this index, which we hereafter refer to as the “presence index”, to accommodate the arrival of multiple seeds of a species in a trap. This new “density-weighted index” assumes that seeds within a species vary in genotype, and that different species vary widely in viability and other factors that influence germination. We test both presence and density indices to quantify dispersal and establishment limitation in three different habitats of a tropical agricultural landscape. Our objective is to test the degree to which seed and seedling density affects dispersal limitation and establishment limitation of woody species in a mosaic of tropical primary forest, secondary forest, and pasture lands. We expected a differential effect of seed or recruit density depending on habitat and species. We predicted higher limitation in pastures compared to primary forest and secondary forest due to the distance to the vegetation patches and the proportion of species with colonizing strategies that arrive into pastures. By identifying dispersal and establishment limitation in permanent agricultural landscapes, we can suggest different levels of restoration intervention by habitat.

2. Materials and Methods

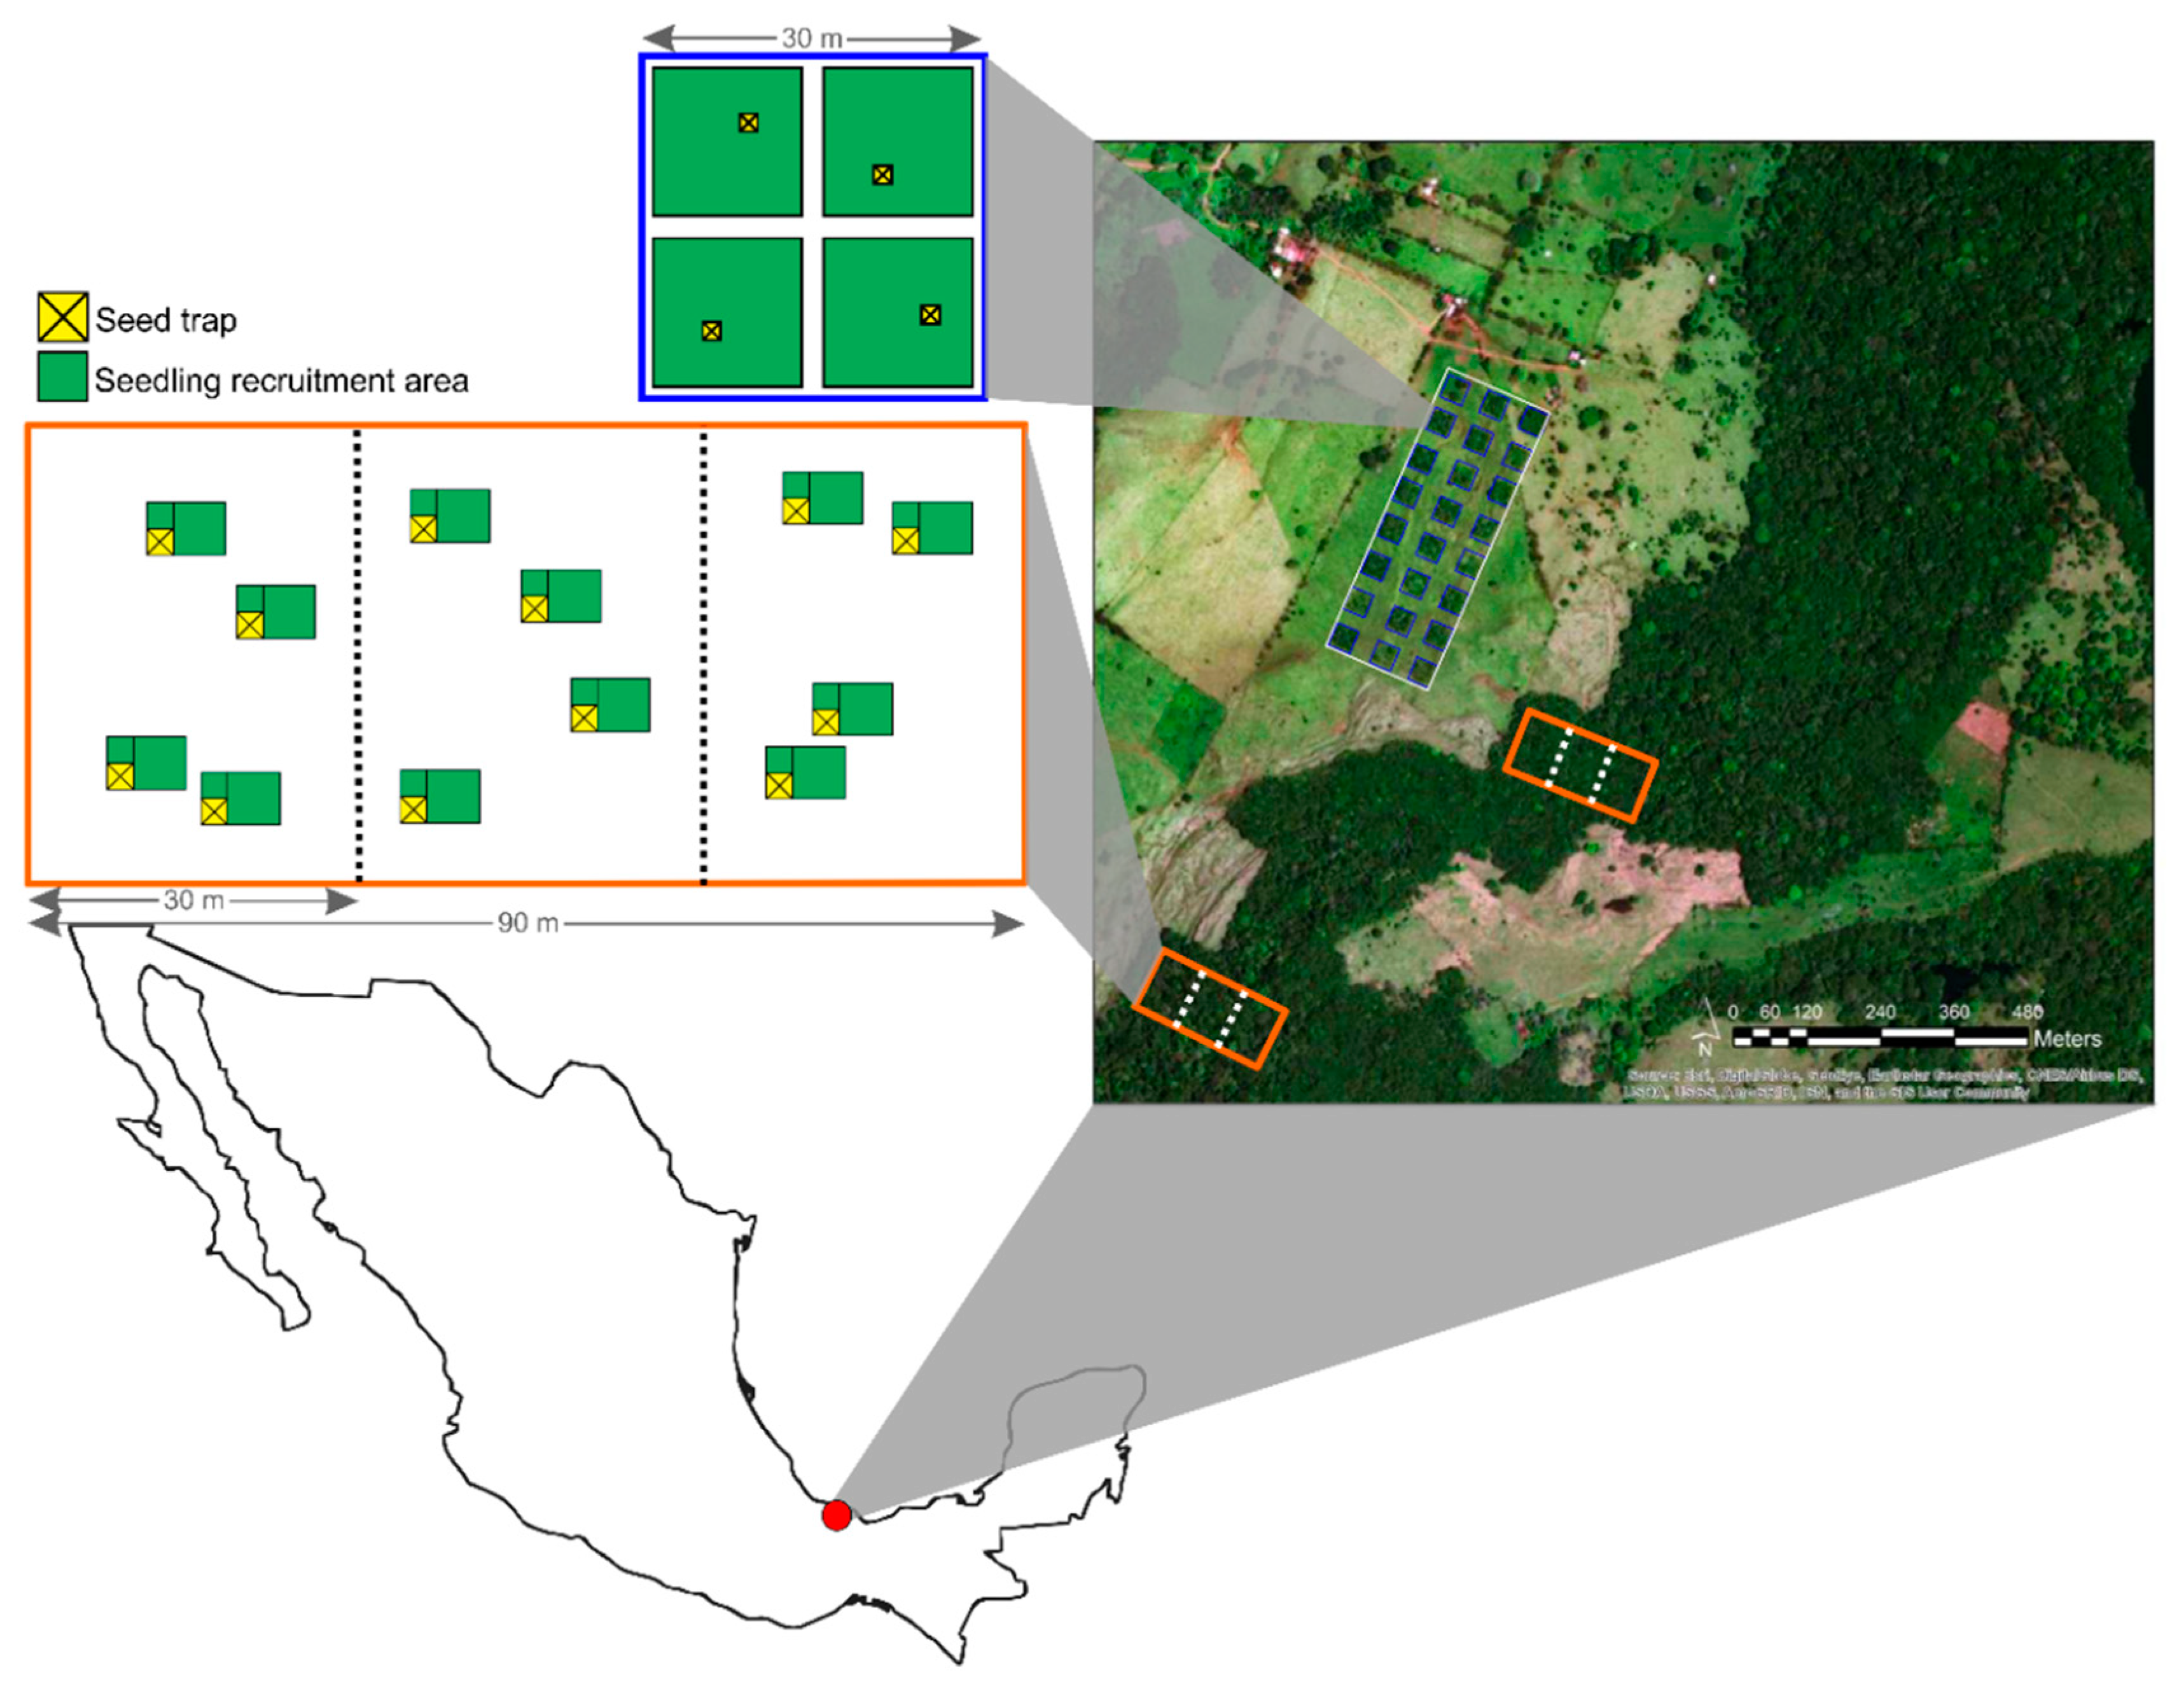
2.1. Study Site and Sampling

The Los Tuxtlas Biosphere Reserve (155,222 ha) is a lowland tropical rain forest in the state of Veracruz, southeast Mexico. In June 2006, twenty-four 30 × 30 m pasture plots separated by 35 m of active pasture were fenced. Further details on management history of the study site are in de la Peña-Domene et al. [30,31].
Seed rain was collected from primary forest, secondary forest and pasture plots. Twenty-four seed traps were placed in two forest habitats: 12 in old growth forest (hereafter primary forest) and 12 in younger growth forest (hereafter secondary forest), at least 200 m from the forest edge (Figure 1). To assess seedlings recruitment, we counted and identified all the seedlings found in the area adjacent to the 12 seed traps for each habitat. As a preliminary test, we employed EstimateS [32], a free software application that computes a variety of diversity statistics, estimators and indices based on biotic sampling data to evaluate species accumulation for seeds and seedlings (Mao Tau, Appendix A). Initial evaluation of seeds and recruits revealed a vast difference in densities of seeds (on average 760 times higher) and recruits (on average 75 times higher) in the two forest types as compared with pasture (Figure A1). This result indicated the need for a much larger sampling area in pasture to detect both seed rain and seedling establishment of species. Accordingly, we increased the number of seed traps in the pasture to 96 (four in each pasture plot) and the seedling establishment area to 144 m2 adjacent to each seed trap. In the pasture plots, four seed traps were located at random (one in each quarter plot) in each of the 24 plots. We recorded all recruits every four months from June 2007 to June 2008 in pasture, primary and secondary forest. Recruit samples were from the 5 m2 “station” (by stations we mean each seed trap with its adjacent seedling sampling area) surrounding each seed trap in forest habitats (i.e., 12 stations in primary forest, 12 stations in secondary forest). Hereafter and to be able to calculate establishment limitation (see equations below), we limit our analysis to species with both seed and seedling samples.

2.2. Calculations and Analysis

Indices

Presence indices for dispersal and establishment limitation were calculated following Muller-Landau et al. [29]. We calculated dispersal (seed) limitation and establishment (seedling) limitation as:
  D i s p e r s a l   ( s e e d )   l i m i t a t i o n = 1 a n  
  E s t a b l i s h m e n t   ( s e e d l i n g )   l i m i t a t i o n = 1 r a m  
For dispersal limitation, a is the number of seed traps receiving seeds of a given species in the study period and n is the total number of seed traps. For establishment limitation, r is the number of stations where both seeds and seedlings of a species occurred (as defined in Norden et al. [13]). As above, a is the total number of seed traps receiving seeds of the species and m is the total area in which seedlings were recorded (included in order to standardize recruitment probability per m2). Both indices range from 0 to 1, where zero represents no limitation and 1 indicates complete limitation for each species in the given habitat.
The density-weighted indices adjust the presence indices to consider not only whether a seed or seedling of a given species has arrived to the sample area, but also the fraction of seeds or seedlings contributed by a given species relative to the total number of seeds or seedlings arriving at a sampling station. The density-weighted dispersal limitation index is:
  D i s p e r s a l   ( s e e d )   l i m i t a t i o n = 1   ( a n ) + ( s i S ) 2  
where a is the number of seed traps which received a seed of the given species, n is the total number of seed traps, si is the number of seeds of species i and S, the total number of seeds across all species and traps. The first part of the index (a/n) is essentially the presence index, and the second part (si/S) considers the relative contribution of the species to the total seeds arriving. By dividing the sum of these two parts, the index gives equal weight to these two aspects of dispersal limitation (similar to some diversity indices). Put another way, this index can distinguish between scenarios when all the seeds (or seedlings) of a species occur at the same station from the scenario where they are more evenly distributed between stations.
Similarly, for establishment limitation, the density-weighted index is:
  E s t a b l i s h m e n t   l i m i t a t i o n = 1 ( r a m ) + ( p i P ) 2  
where r is the number of stations with both seeds and seedlings of species i, a is the number of seed traps receiving seeds of species i, pi is the number of recruits of species i at the station, and P is the total number of recruits across all species. The proportion of seeds/seedlings of species i within the whole sample (si/S and pi/P) are important in determining the resulting community given intra- and interspecific competition, and similar to the density-weighted dispersal limitation index above, are given equal weight as the presence/absence of the species at the station.
Kruskal-Wallis analysis of variance was used to compare (1) among the three habitats using each index type, and (2) between the presence and density indices within each habitat. Additionally, Wald-Wolfowitz runs tests were conducted to identify overall differences between the indices among the different species.

3. Results

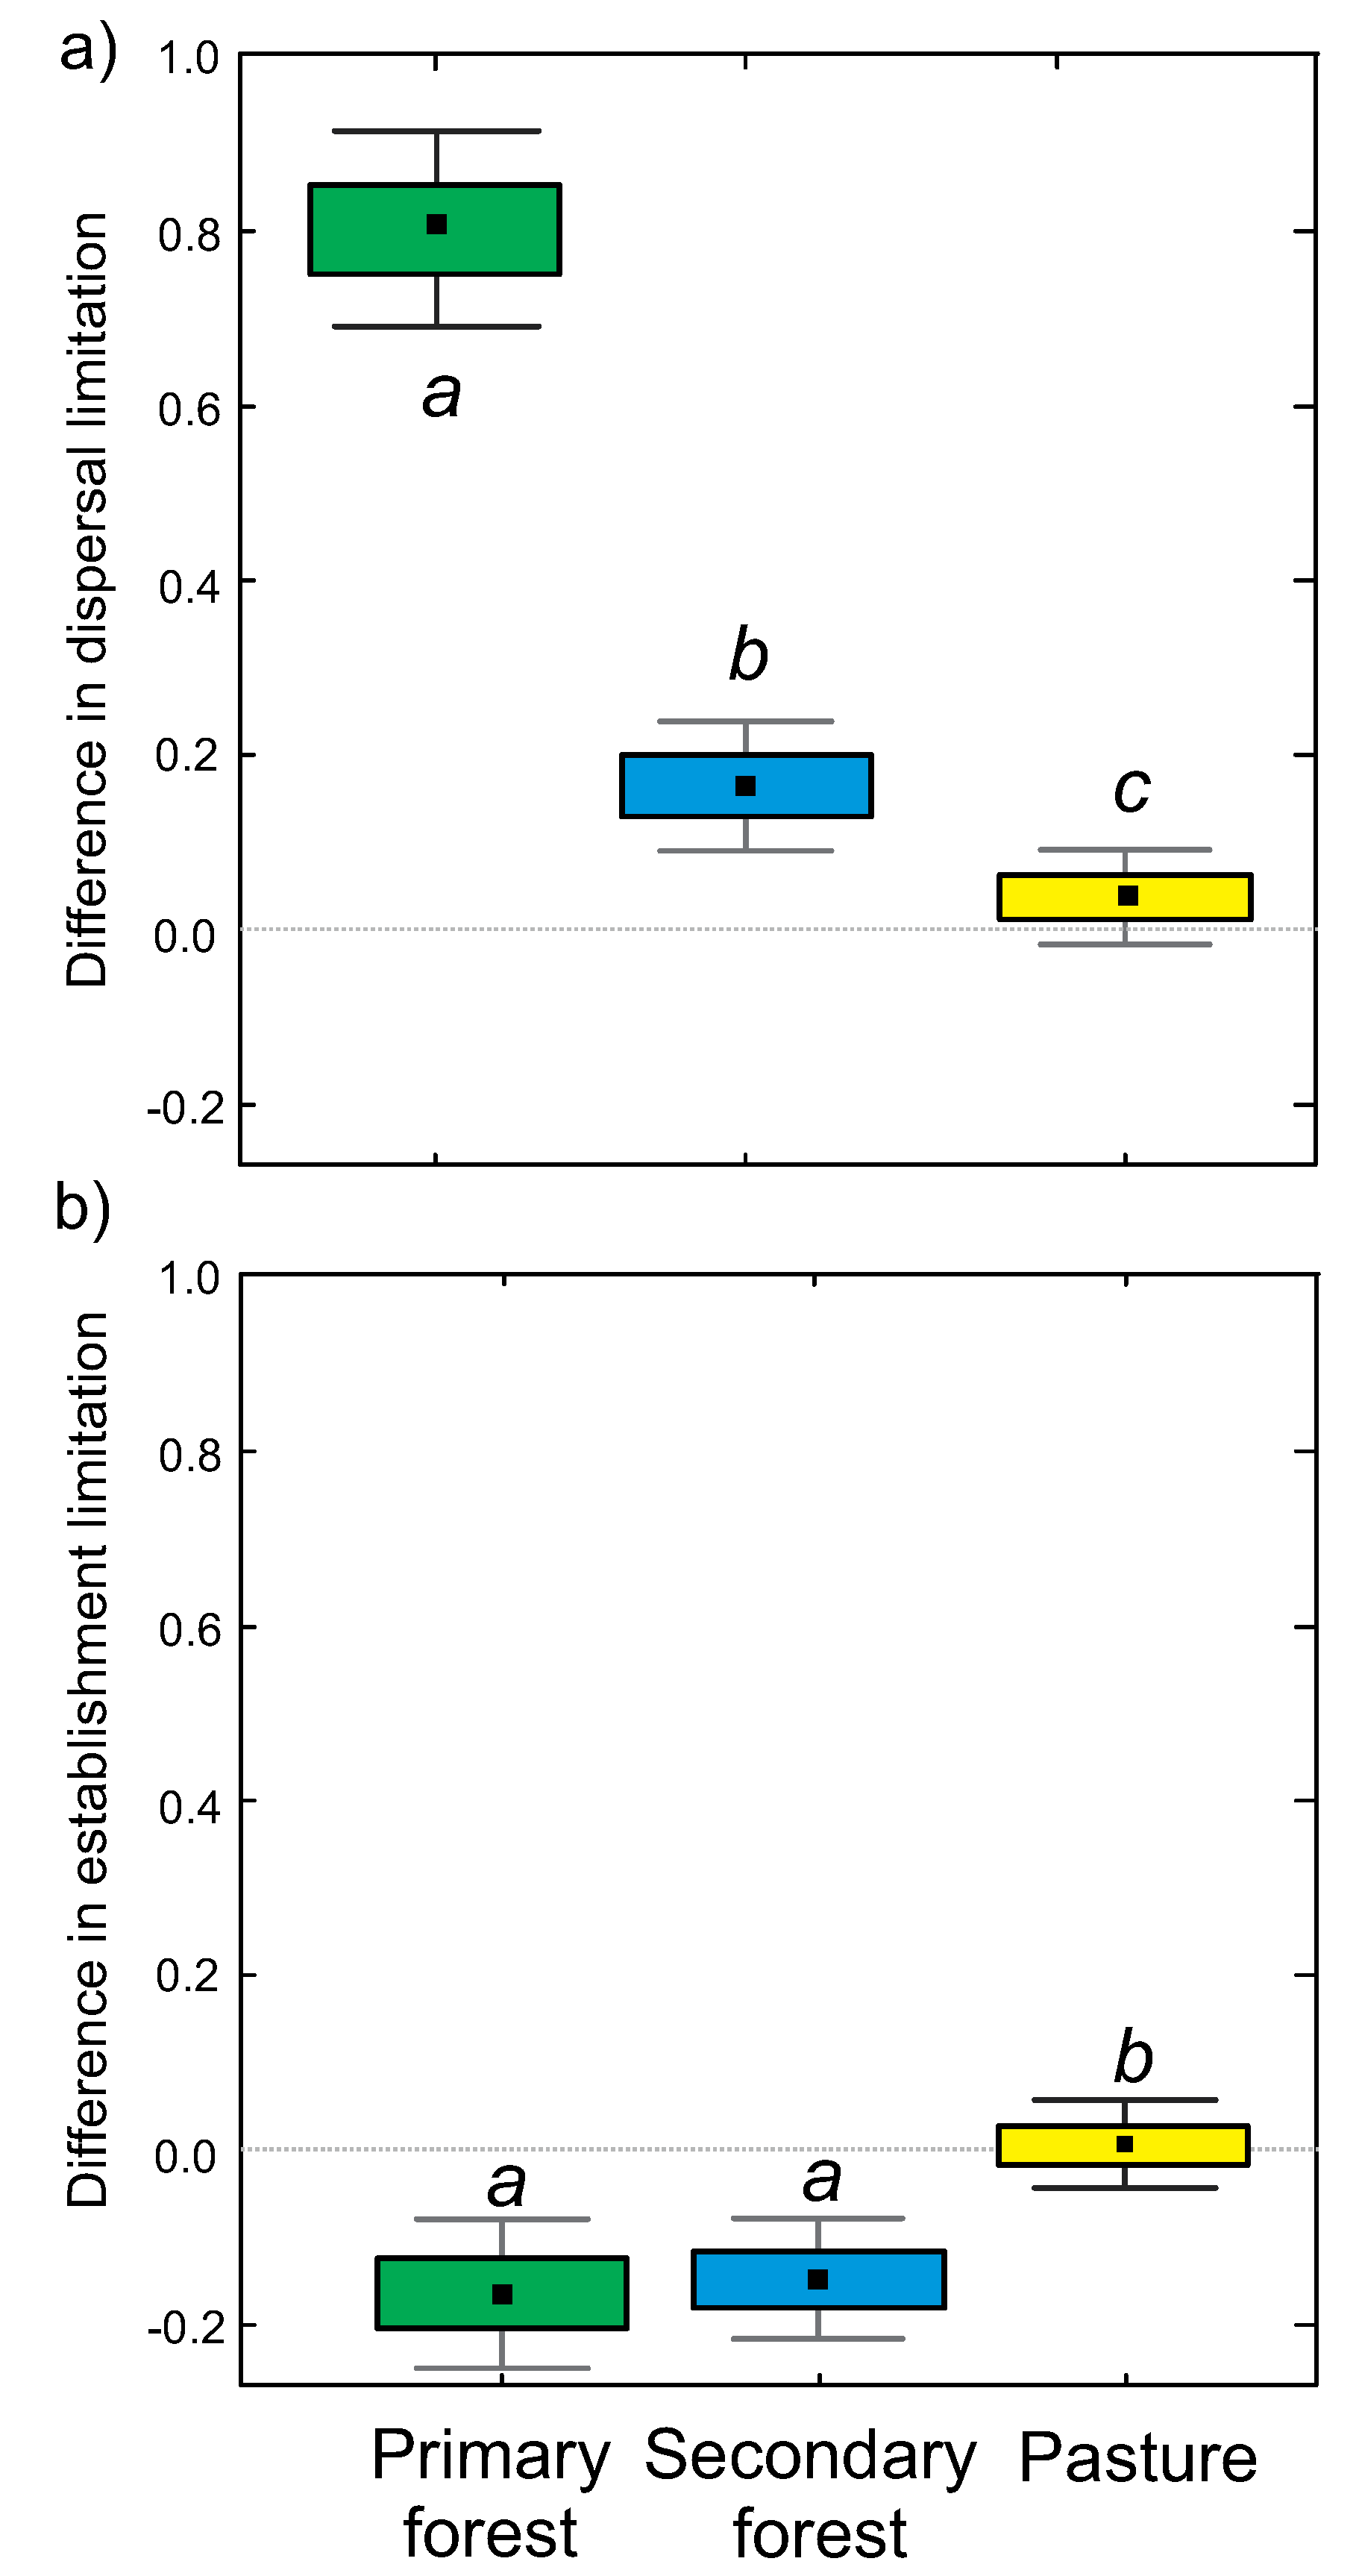
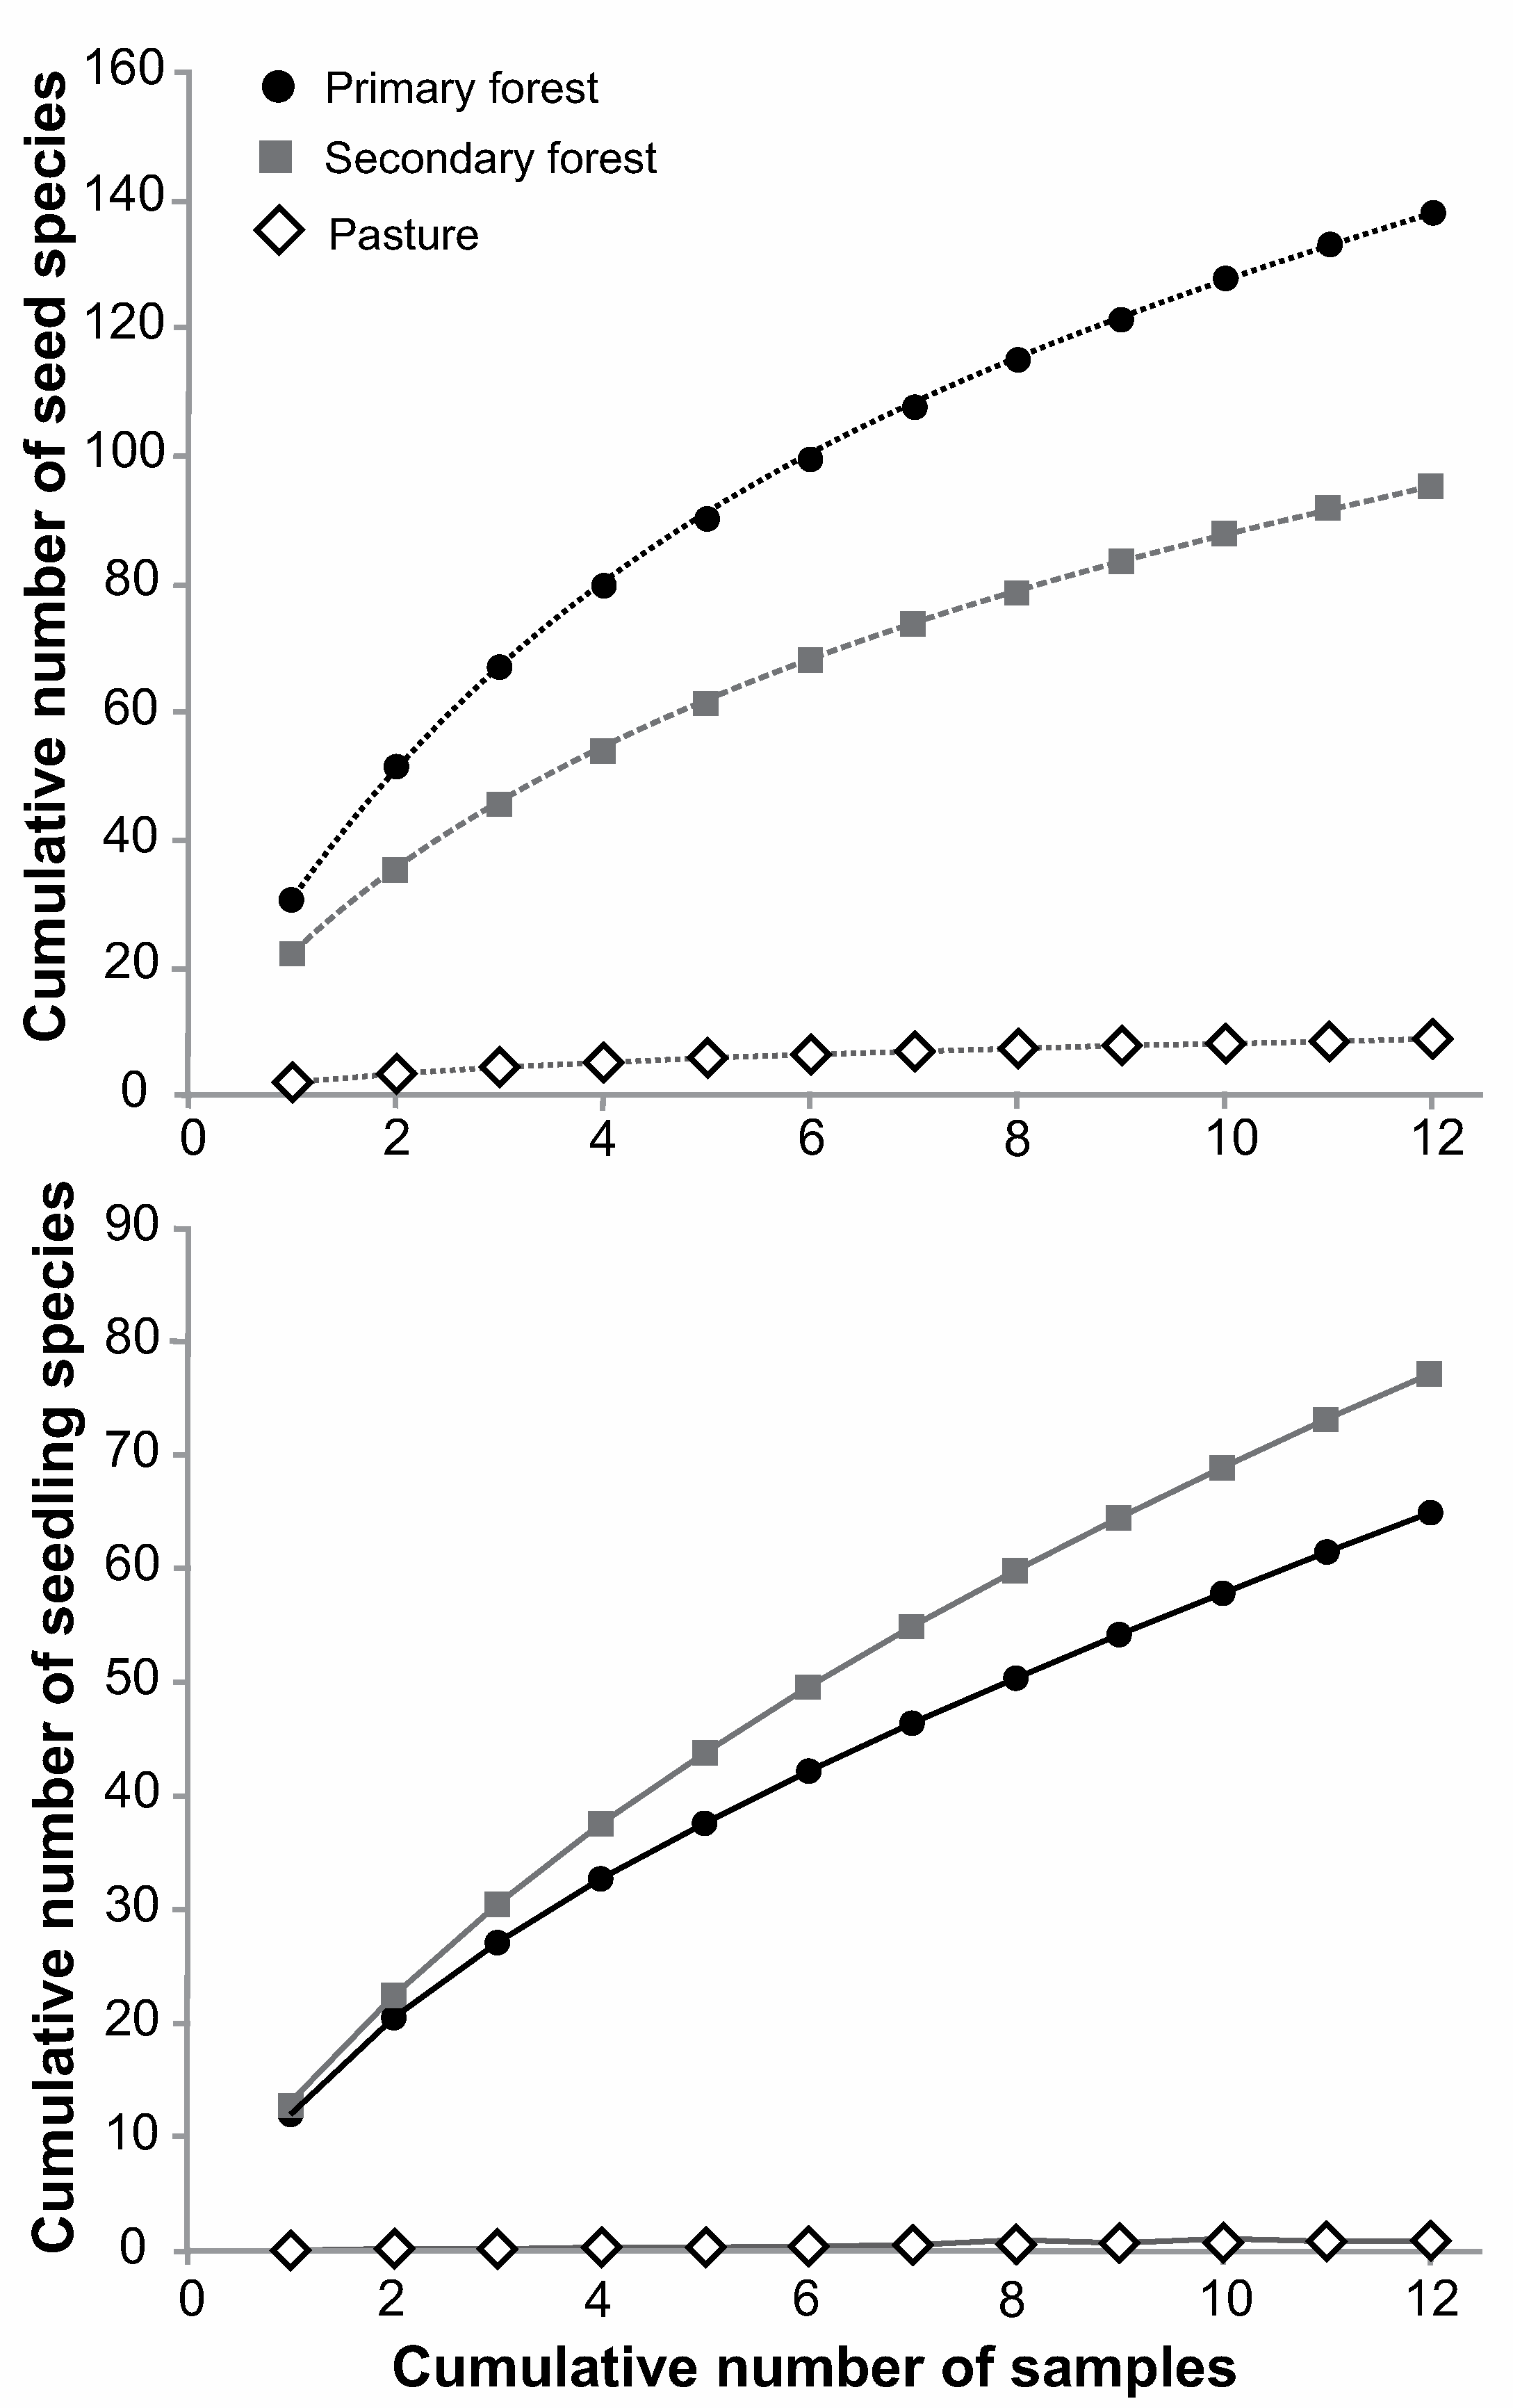
3.1. Overall Dispersal and Establishment Limitation in Different Habitats

Dispersal limitation was higher in pastures than in primary and secondary forests using both the presence index (Figure 2A) and the density-weighted index (Figure 2B). Within each habitat, the presence index calculated higher dispersal limitation than the density-weighted index (H(2,40) = 30.9, p ˂ 0.001, Figure 3). The difference between the two dispersal limitation indices was larger in primary forest than secondary forest (p < 0.01) and pasture (p < 0.001) but was similar between secondary forest and pasture (Figure 3).
Establishment limitation did not differ by habitat using the presence index (Figure 2C), which estimated uniformly high limitation values. However, when the density-weighted index was used, establishment limitation differed by habitat, with higher median limitation in pasture than secondary forest (Figure 2D). The presence index estimated significantly lower establishment limitation than the density-weighted index (H(2,40) = 13.6, p ˂ 0.001; Figure 3). Within each habitat, the difference between the two indices was greater for the primary and secondary forests than for pastures (Figure 3).

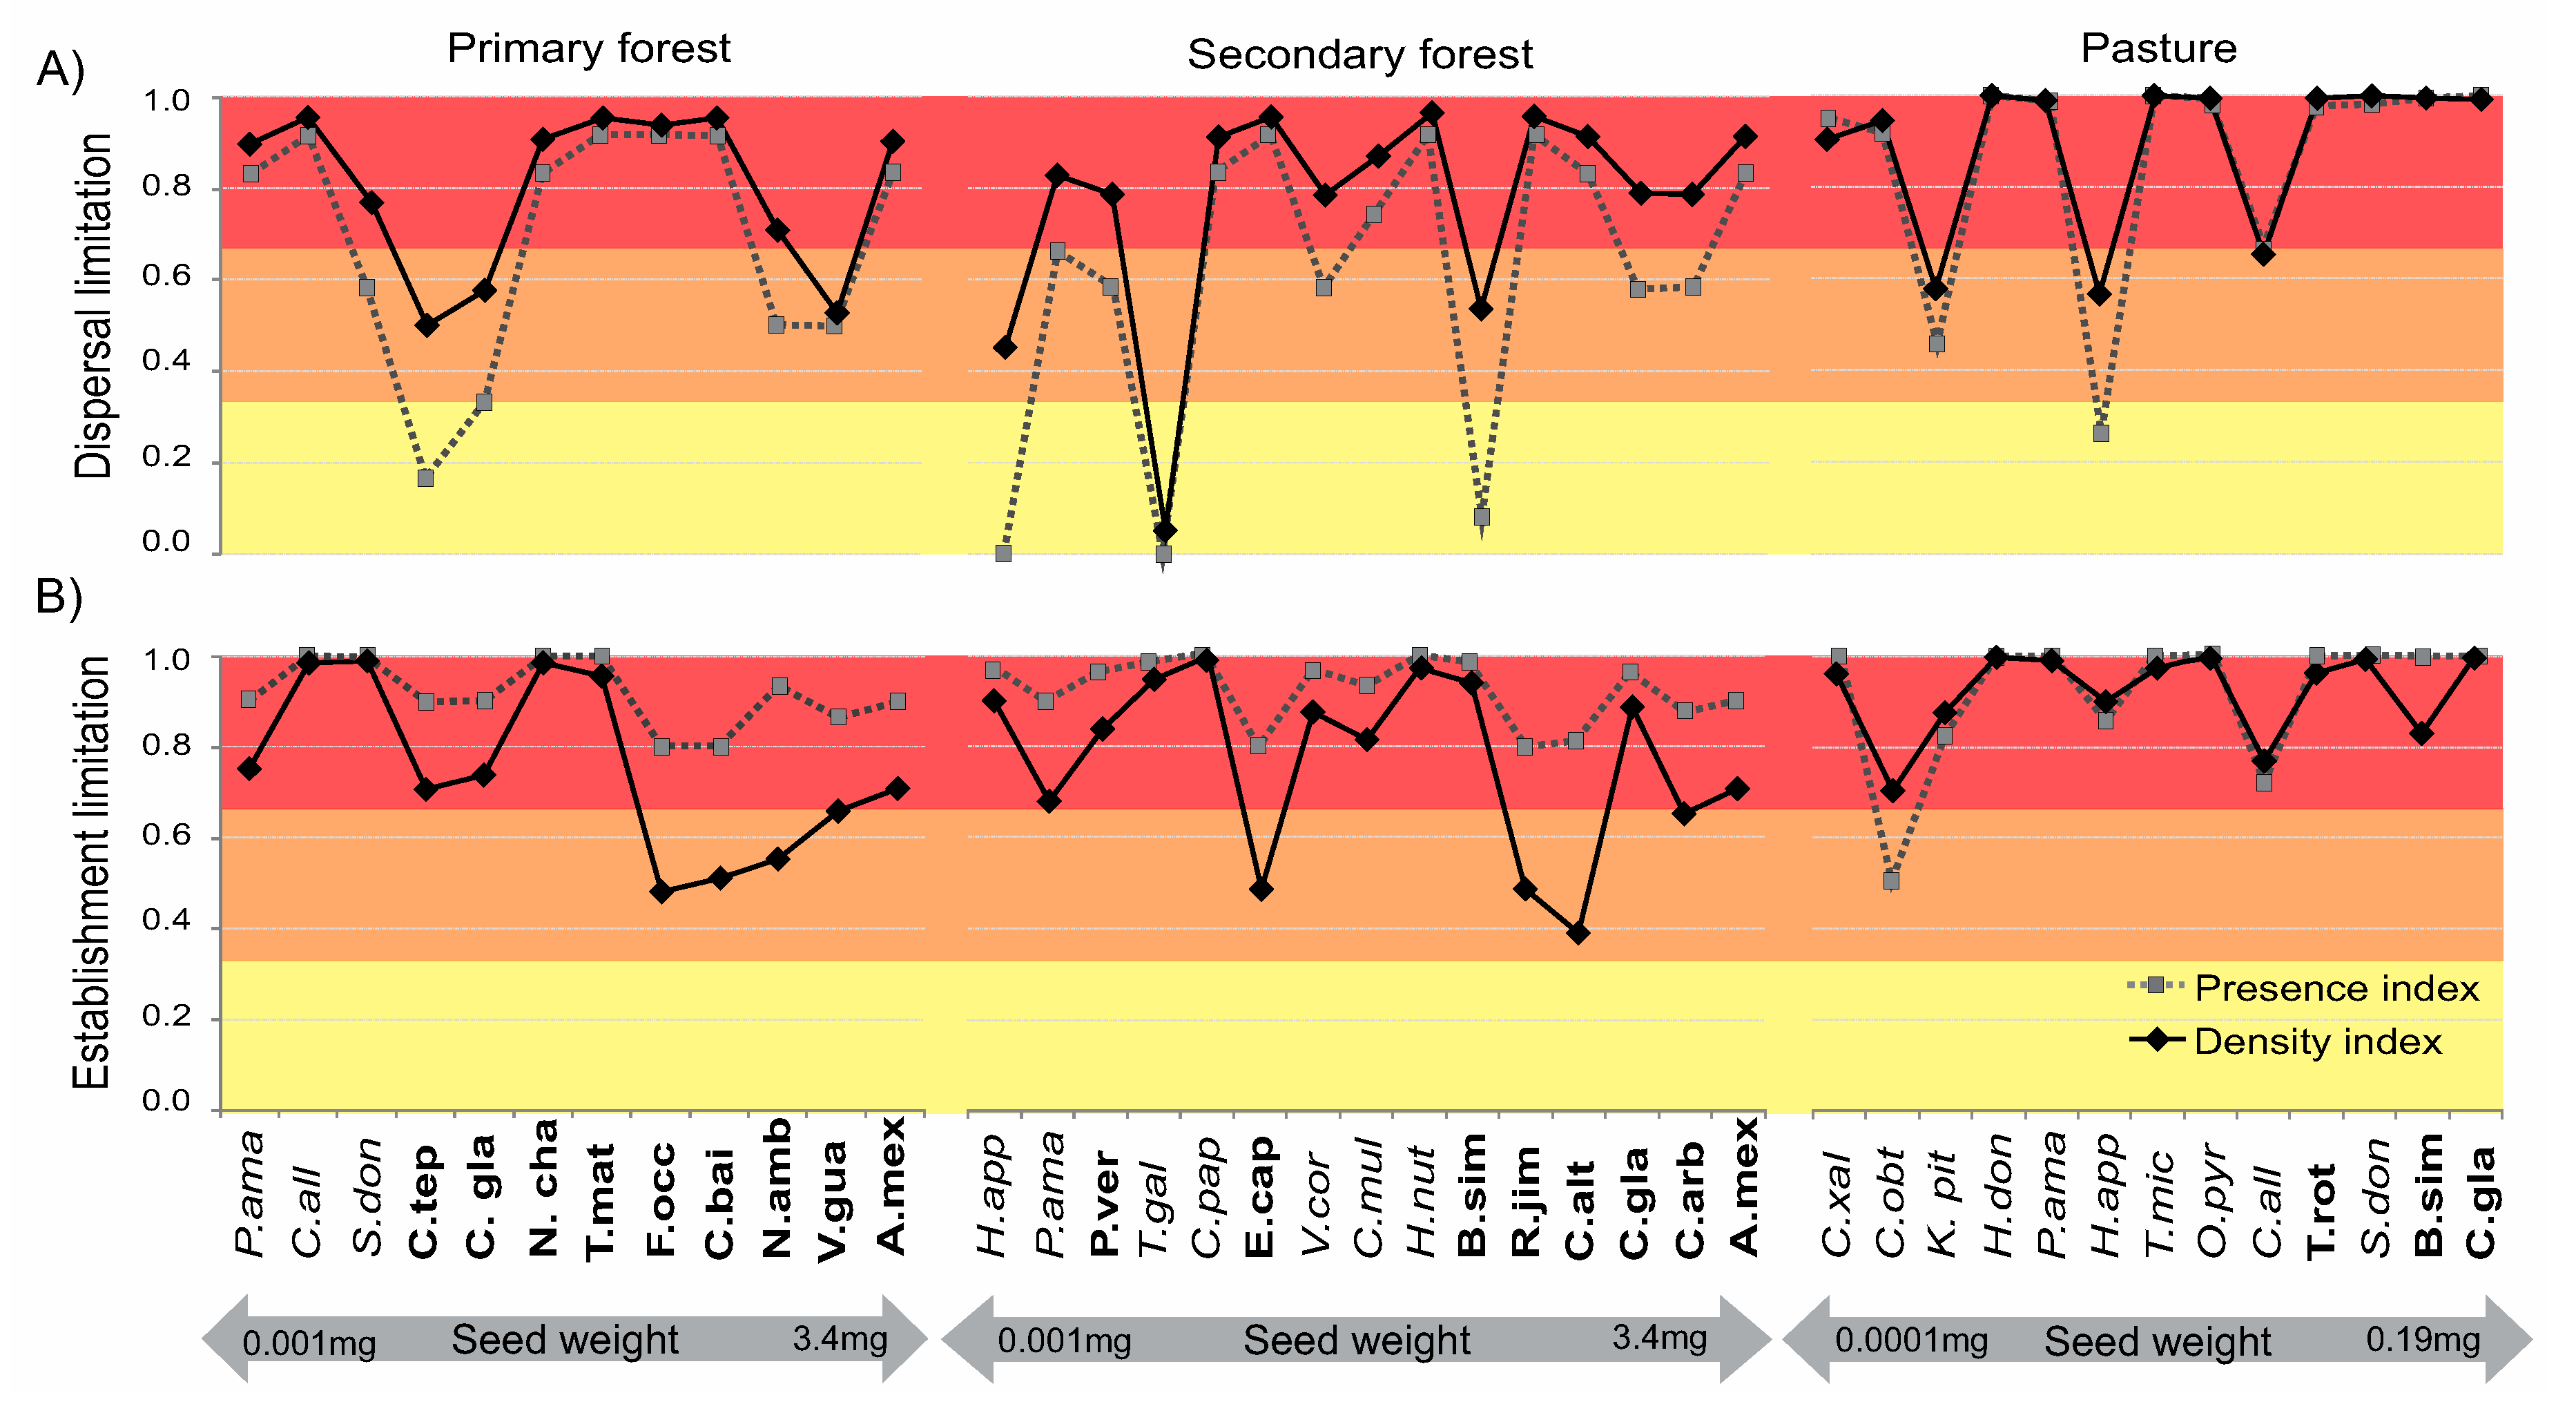
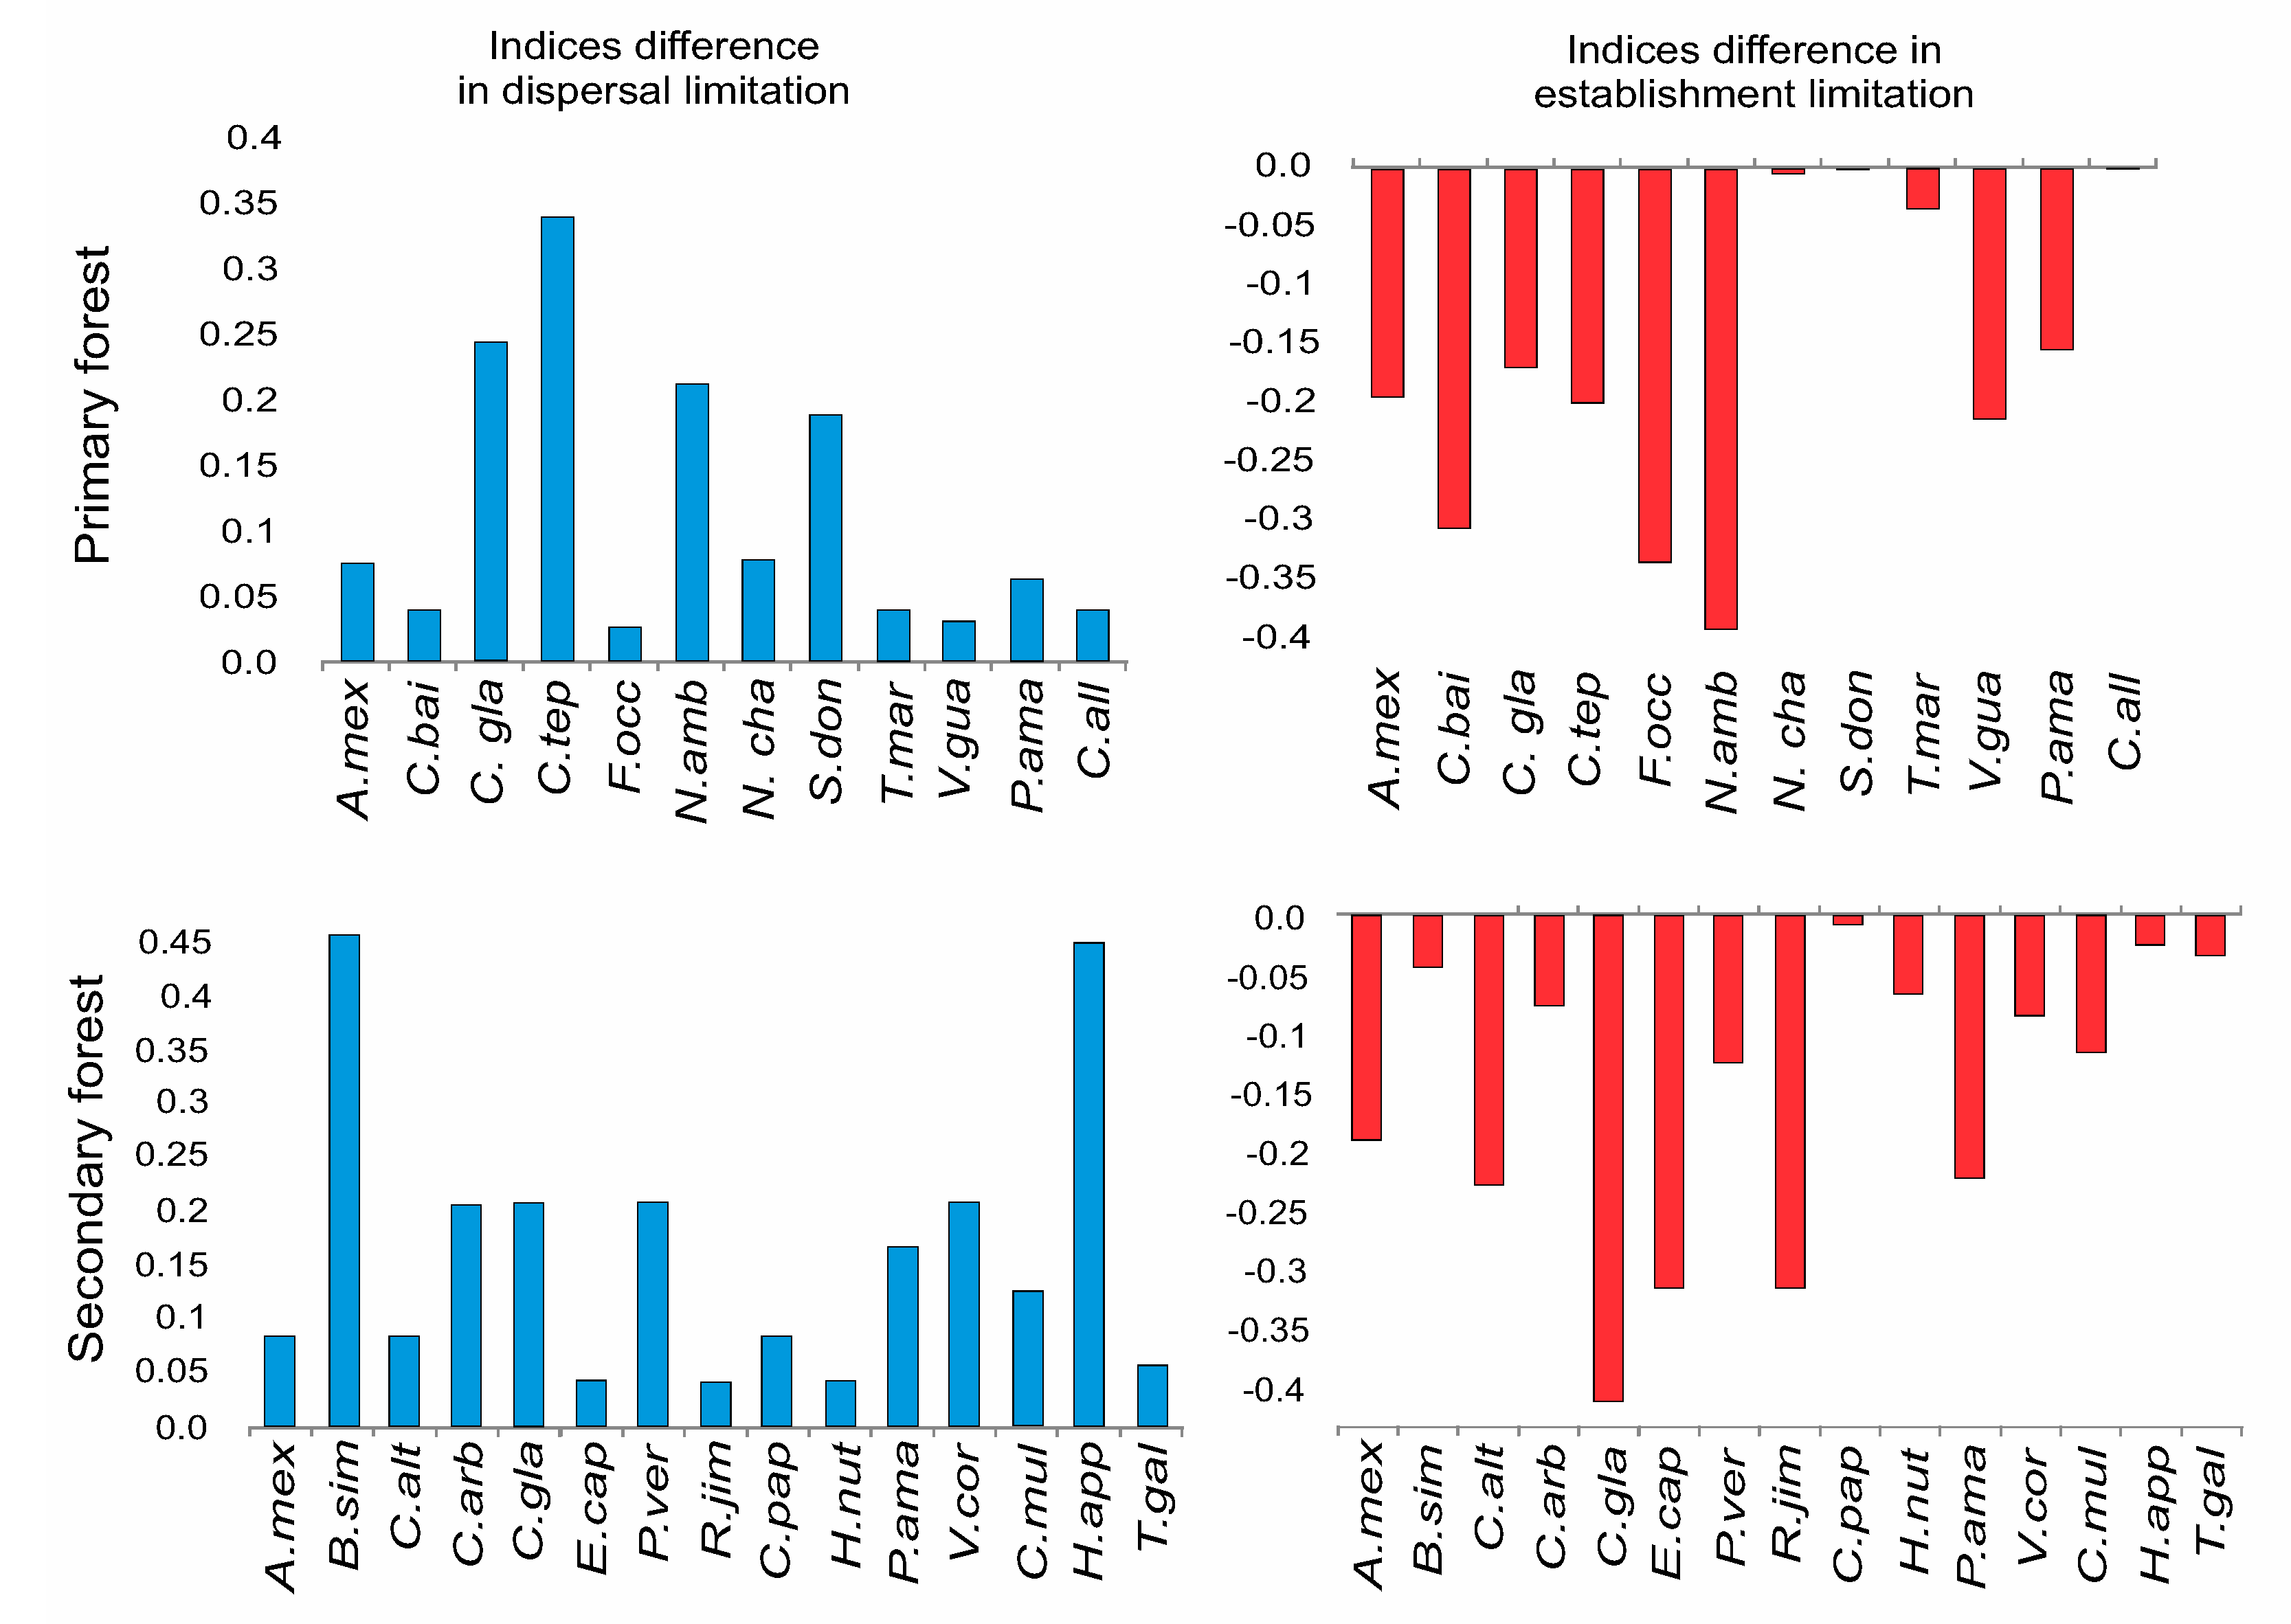
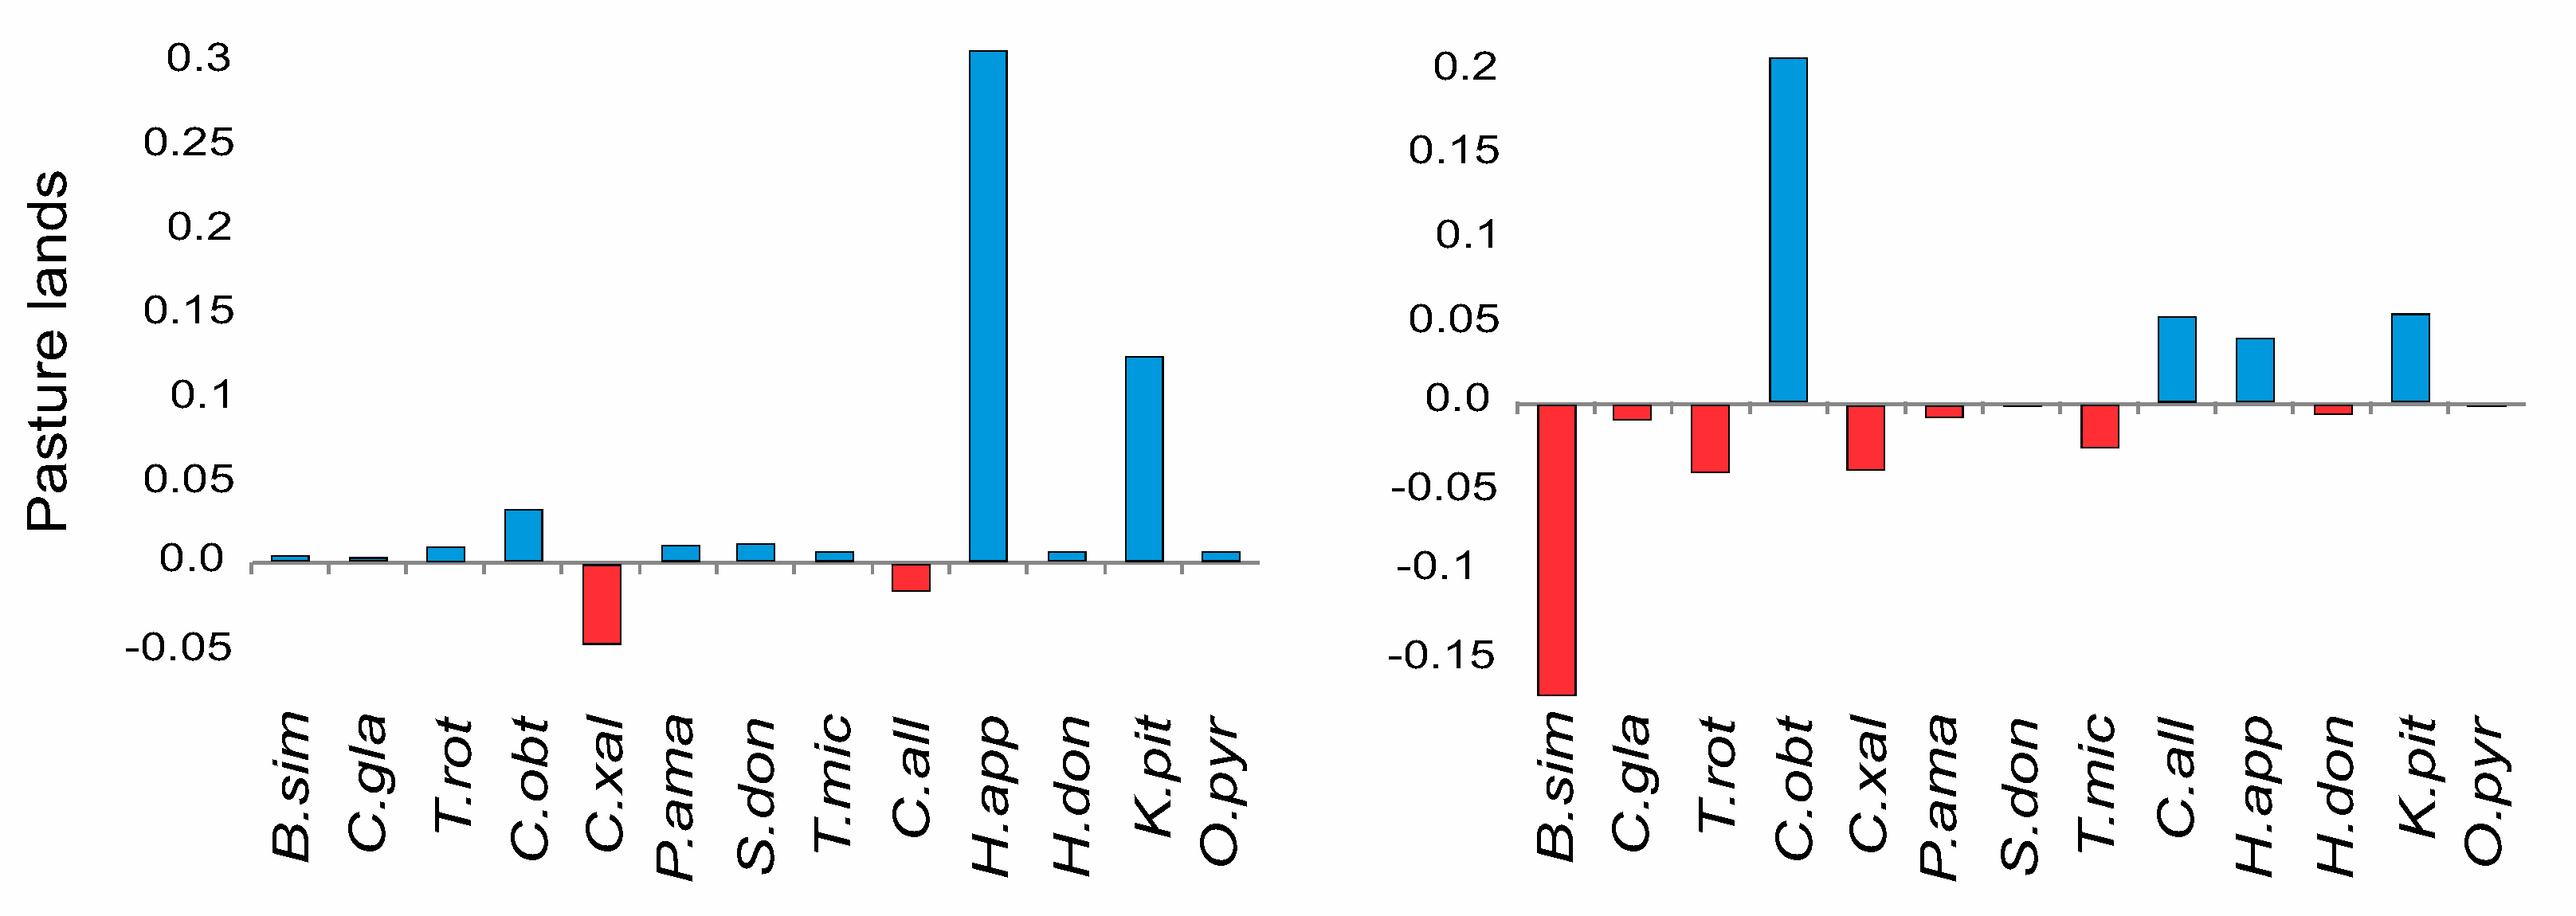
3.2. Species-Specific Dispersal and Establishment Limitation in Three Habitats

The presence and density-weighted indices differed in their estimates of dispersal and establishment limitation, and the direction and degree of these differences varied by species and habitat. A Wald-Wolfowitz runs test showed that in all habitats, species-specific dispersal limitation was significantly lower when using the presence index (mean 71% limitation) than with the density-weighted index (mean 81% limitation; Zadj = 4.16, p = 0.001) (Figure 4). This indicates that dispersed seeds were aggregated within a few seed traps. Overall, differences for dispersal limitation between the two indices were significantly higher in primary forest than secondary forest and in pasture. The density-weighted index estimated more dispersal limitation than the presence index for almost all species regardless of the habitat (Figure 5).
Establishment limitation by species, on the other hand, was higher when calculated by the presence index (91% limitation) than with the density-weighted index (mean 81% limitation). A Wald Wolfowitz runs test showed significant differences between the indices by species across all habitats (Zadj = 3.71, p = 0.001) (Figure 4).
In the secondary forest, the presence and density indices for dispersal limitation differed among species. Dispersal limitation was higher when densities were included (Figure 5). Notably, establishment limitation was > 80% for all species using the presence index but as low as 40% using the density-weighted index (Figure 5). For example, the secondary forest is saturated with seeds (45,386 seeds in 1 m2/year), here 88% from all seeds belong to one wind-dispersed pioneer species (Trichospermum galeottii (Turcz.) Kosterm.; Malvaceae) yet, with complete establishment limitation—no seedlings established in the secondary forest. In the primary forest, limitation varied among species. A striking case was Nectandra ambigens (S.F. Blake) C.K. Allen (Lauraceae), for which the presence index estimated high establishment limitation and the density-weighted index estimated moderate limitation. This is particularly important because N. ambigens represented 89% of the total sample of recruits in primary forest.
In pastures, 10 out of 13 species showed extremely high dispersal limitation. Among the three least-limited species, Cordia alliodora (Ruiz & Pav.) Oken (Boraginaceae) surpassed 60% with both indices. The second, Koanophyllon pittieri (Klatt) R.M. King & H. Robinson (Asteraceae) dispersal limitation was similar using presence and density indices (Figure 4); K. pittieri seeds were present in 54% of the seed traps, ranging from one to 116 seeds per seed trap. The presence index ranked dispersal limitation much lower (~20%) than density-weighted (close to 60%) for the third least-limited species, Heliocarpus appendiculatus Turcz. (Malvaceae) (Figure 4). Even though this common pioneer occurred in 74% of the seed traps, the number of seeds per trap was low overall (mean 3 ± SD 1.3 seeds); the species was therefore well represented in space, but not in numbers in the total seed sample.
Establishment limitation in pasture was comparable for presence and density indices for all species with two exceptions, Cecropia obtusifolia Bertol. (Urticaceae) and Bursera simaruba (L.) Sarg. (Burseraceae). The presence index indicated less limitation than the density-weighted index. C. obtusifolia was found in 15% of the seed traps, ranging from 1 to 19 seeds. Seeds were most often found in sites that also had presence of seedlings. In contrast, B. simaruba recruits were less limited, based on the density-weighted index (Figure 4). Bursera seedlings were found in 33% of all the sites, ranging from 1 to 31 seedlings per site. The paradox for this species is that only seven seeds of B. simaruba fell into the seed traps and none of them were found in sites where recruits were found.

4. Discussion

4.1. Difference Between Indices

Our general question was whether seed and seedling densities influence dispersal and establishment limitation in primary forest, secondary forest, and pasture habitats. Our rationale was that, given differences in genotype and viability among seed and seedling cohorts, chances of success in a given space are greater when there are 10 or 100 genetic “lottery tickets” compared to one ticket (sensu Williams, G.C. [33]). In order to quantify dispersal and establishment limitation in three habitats of a tropical agricultural landscape, we compared the use of the existing presence index and the new density-weighted index we propose here. We found that integrating the number of seeds that are dispersed to a landscape in addition to the presence of seeds of a given species, yielded differences in dispersal and establishment limitation between the indices. Overall, when seed densities were not accounted for, dispersal limitation was lower in the forest habitats than when evaluated by the density-weighted index. This was given by the fact that even if a seed of a given species arrived to a site, many more seeds of other species could have arrived as well and therefore, the genetic lottery begins. A clear example is shown in the secondary forest where the seed pool was so large, that the probabilities of one seed to become a seedling are very small. The seed pool is much larger than one individual seed. On the other hand, when seedling density was not accounted for, establishment limitation was overestimated compared to the density-weighted index. Here, the seedling pool is generally small, and so the chances of being the single seedling that lives to be a reproductive adult in that square meter are greater (e.g., N. ambigens described in the results section). In excluded pastures, however, dispersal and establishment limitations depended on the identity of species. Establishment limitation, in particular, was shown to be higher in pastures than in the forest habitats when assessed through the density-weighted index.

4.2. Differences between Habitats

Dispersal limitation incorporates quantity of seed rain and dispersion in space. When density of seeds and seedlings is considered in evaluating limitations to successful dispersal and establishment (i.e., in our density-weighted index), our results show that limitation patterns were distinctively different between the habitats. In primary forest, dispersal limitation has been suggested as the major factor contributing to the maintenance of plant diversity at the community, landscape, region and ecosystem scales [14,15,34]. On the other hand, in pastures with no presence of reproductive trees, dispersal limitation shapes the initial composition, even if subsequent establishment limitation is high. Almost all species exhibited dispersal limitation in pastures. Only seeds of pioneer tree species dispersed by wind occurred in pastures with any regularity, and of those, only three pioneer species were even moderately successful in recruiting (Cordia alliodora, Heliocarpus appendiculatus and Koanophyllon pittieri). For example, H. appendiculatus (Tiliaceae), a species that was present in most seed traps, although with low number of seeds, has been recorded to have highly variable seed germination ranging from over than 60% or as low as 10%, depending on the conditions of the site where the seed falls (mean 35 ± SD 15%) [35,36]. Under this scenario, the future composition of abandoned pastures will lead to a “pioneer desert” (sensu Martínez-Garza et al. [21]) and therefore, restoration plantings of non-pioneer species are suggested to increase tree richness. All in all, establishment limitation is indistinguishable among the three habitats using the presence index, yet the density-weighted index shows that secondary forest has substantially less limitation than pastures, which is consistent with a successional habitat experiencing high colonization rates. Succession in pastures is impeded by both limited seed arrival and by adverse conditions for seeds to germinate and seedlings to establish and survive.

4.3. Differences within Species

Species often differ in the life stage that limits population growth. In the present study, species with lower dispersal limitation are not necessarily the ones with lower establishment limitation. This is consistent with studies in the Congo Basin, in which species with low dispersal limitation show high establishment limitation in primary forests, suggesting a trade-off between dispersal and establishment capacity. Extremely high seed densities are offset by density-dependent mortality of seedlings [11,37]. Different results are found in Nouragues, French Guinea, where dispersal and establishment limitation were evaluated using the presence index for 14 tree species [13]. Establishment limitation for dominant species allowed poor competitors to occupy sites [13,15]. In the present study, seeds of late-successional species that arrive into pastures are from a different subset of species than those arriving in the forest [23]. Extreme limitations in seed arrival and seedling establishment are barriers that restoration efforts will have to face in order to accelerate succession back to forest, but evaluating the degree of limitation of each species to the given conditions of the habitat is likely to give guidance for more successful management strategies.

5. Conclusions

The overall conclusion is that presence indices well describe dispersal and establishment limitations in well-established primary forests, yet in transitional environments, seed and seedling densities become more important as the environmental conditions and dynamics are different. One important aspect is that seed to seedling transition in the primary forest is higher than in early successional habitats [31], and therefore, densities of seed and seedling may change the dynamics in some habitats more than others. It is especially important to consider the effect of seed and seedling densities in the context of ecological restoration efforts, because identifying dispersal and establishment limitation of certain species within a habitat will better inform on management practices. Moreover, existing models evaluating dispersal limitation do not adequately address factors such as the densities in which seeds arrive, dispersal strategies, seed size, seed quality or abundance of seeds of other species. A further question is how these plant attributes affect dispersal and establishment limitations in different habitats. Accordingly, how can we use a specific species’ attributes to predict the performance of a species in a given habitat? Some insights are developed in de la Peña-Domene et al., of this special issue [38].

Author Contributions

Conceptualization, M.P.D. and C.M.G.; Methodology, M.P.D.; Validation, C.M.G.; Formal Analysis, M.P.D.; Investigation, M.P.D. and C.M.G.; Resources, C.M.G.; Writing-Original Draft Preparation, M.P.D.; Writing-Review & Editing, C.M.G.; Supervision, C.M.G.; Project Administration, C.M.G.; Funding Acquisition, C.M.G.

Funding

The authors gratefully acknowledge financial and logistical support from the University of Illinois, Universidad Autónoma del Estado de Morelos, Universidad Nacional Autónoma de México, The Mexican Science and Technology Council (CONACyT) and the National Science Foundation of the United States (DEB 0516259) and the National Geographic Society (9302-13).

Acknowledgments

We are grateful to Rosamond Coates for institutional support and Eladio Velasco for expert field assistance. In addition, we wish to thank the many students from ecology classes at Universidad Autónoma del Estado de Morelos, coordinated by Yuliana Urincho-Pantaleón, who helped process seed samples. We are also grateful to Henry F. Howe, Emiliano Cruz León, Miquel Gonzalez-Meler, Lynna Kiere, Cesar Lozano Huerta, José Antonio Sierra Huelsz, Emily Minor, Nigel Pitman, Rita Jiménez Rolland and Corine Vriesendorp for discussions and constructive comments on the manuscript.

Conflicts of Interest

The authors declare no conflict of interest.

Appendix A

Figure A1. Species accumulation (Mao Tau) of seed and recruit samples over one year. Each sample is a species count in 1 m2 seed trap (for seeds) and five adjacent 1 m2 (for seedlings), with 12 samples of each per habitat per census. Black circles represent the primary forest (seed species at the top and seedling species at the bottom). For the purpose of metrics (Table A1), the sample area for pasture is increased as indicated in the methods section.
Forests 09 00570 g0a1
Table A1. Dispersal and establishment limitation values for 33 tropical species in different habitats in Veracruz, Mexico. Calculations of limitation were obtained using the Muller Landau index and a density-weighted index.
SpeciesDispersal LimitationEstablishment Limitation
Presence IndexDensity Weighted IndexPresence IndexDensity Weighted Index
PRIMARY FOREST
Astrocaryum mexicanum Liebm. ex Mart.0.070.830.900.71
Chamaedorea tepejilote Liebm.0.340.170.900.70
Cordia alliodora (Ruiz & Pav.) Oken 0.040.921.001.00
Cupania glabra Sw.0.240.330.900.73
Cymbopetalum baillonii R.E. Fr.0.040.920.800.49
Faramea occidentalis (L.) A. Rich. 0.030.920.800.47
Nectandra ambigens (S.F. Blake) C.K. Allen 0.210.500.930.54
Piper amalago L.0.060.830.900.75
Notopleura chapensis (Steyerm.) C.M. Taylor 0.080.831.001.00
Stemmadenia donnell-smithii (Rose) Woodson 0.190.581.001.00
Trichilia martiana C. DC.0.040.921.000.97
Virola guatemalensis (Hemsl.) Warb.0.030.500.870.65
SECONDARY FOREST
Astrocaryum mexicanum Liebm. ex Mart.0.830.920.900.71
Bursera simaruba (L.) Sarg.0.080.540.980.94
Carica papaya L.0.830.921.000.99
Chamaedorea alternans H. Wendl.0.830.920.800.39
Cnidoscolus multilobus (Pax) I.M. Johnst.0.750.870.930.82
Cojoba arborea (L.) Britton & Rose0.580.790.880.65
Cupania glabra Sw.0.580.790.960.88
Eugenia capuli (Schltdl. & Cham.) Hook. & Arn.0.920.960.800.48
Hampea nutricia Fryxell0.920.961.000.98
Heliocarpus appendiculatus Turcz.0.000.450.970.90
Piper amalago L.0.670.830.900.68
Psychotria veracruzensis Lorence & Dwyer0.580.790.960.84
Rollinia jimenezii Saff.0.920.960.800.48
Trichospermum galeottii (Turcz.) Kosterm.0.000.060.980.95
Vachellia cornigera (L.) Seigler & Ebinger0.580.790.960.88
PASTURE
Bursera simaruba (L.) Sarg.0.990.991.000.83
Cecropia obtusifolia Bertol. 0.920.950.500.70
Conostegia xalapensis (Bonpl.) D. Don ex DC. 0.950.901.000.96
Cordia alliodora (Ruiz & Pav.) Oken 0.670.650.720.77
Cupania glabra Sw. 0.990.991.001.00
Heliocarpus appendiculatus Turcz. 0.260.560.860.90
Heliocarpus donnellsmithii Rose 0.990.991.000.99
Koanophyllon pittieri (Klatt) R.M. King & H. Robinson 0.460.580.830.88
Ochroma pyramidale (Cav. ex Lam.) Urb. 0.990.991.001.00
Piper amalago L. 0.980.991.000.99
Stemmadenia donnell-smithii (Rose) Woodson 0.980.991.001.00
Tetrorchidium rotundatum Standl. 0.980.991.000.96
Trema micrantha (L.) Blume 0.990.991.000.98

References

  1. Clark, J.S. Why trees migrate so fast: Confronting theory with dispersal biology and the paleorecord. Am. Nat. 1998, 152, 204–224. [Google Scholar] [CrossRef] [PubMed]
  2. Hubbell, S.P. The Unified Neutral Theory of Biodiversity and Biogeography; Princeton University Press: Princeton, NJ, USA, 2001; p. 375. [Google Scholar]
  3. MacArthur, R.H.; Wilson, E.O. The Theory of Island Biogeography; Princeton University Press: Princeton, NJ, USA, 2001; Volume 1. [Google Scholar]
  4. Ridley, H.N. The Dispersal of Plants throughout the World; L. Reeve & Company, Limited: Ashford, UK, 1930. [Google Scholar]
  5. Janzen, D.H. Herbivores and the number of tree species in tropical forests. Am. Nat. 1970, 104, 501–527. [Google Scholar] [CrossRef]
  6. Connell, J.H. On the Role of Natural Enemies in Preventing Competitive Exclusion in Some Marine Animals and in Rain Forest Trees. In Dynamics of Populations; Center for Agricultural Publishing and Documentation: Wageningen, The Netherlands, 1971. [Google Scholar]
  7. Howe, H.F.; Smallwood, J. Ecology of seed dispersal. Ann. Rev. Ecol. Syst. 1982, 13, 201–228. [Google Scholar] [CrossRef]
  8. Comita, L.S.; Muller-Landau, H.C.; Aguilar, S.; Hubbell, S.P. Asymmetric density dependence shapes species abundances in a tropical tree community. Science 2010, 329, 330–332. [Google Scholar] [CrossRef] [PubMed]
  9. Clark, J.S.; Silman, M.; Kern, R.; Macklin, E.; HilleRisLambers, J. Seed dispersal near and far: Patterns across temperate and tropical forests. Ecology 1999, 80, 1475–1494. [Google Scholar] [CrossRef]
  10. Harms, K.E.; Wright, S.J.; Calderon, O.; Hernandez, A.; Herre, E.A. Pervasive density-dependent recruitment enhances seedling diversity in a tropical forest. Nature 2000, 404, 493–495. [Google Scholar] [CrossRef] [PubMed]
  11. Clark, C.J.; Poulsen, J.R.; Levey, D.J. Roles of seed and establishment limitation in determining patterns of afrotropical tree recruitment. PLoS ONE 2013, 8, e63330. [Google Scholar] [CrossRef] [PubMed]
  12. Slocum, M.G. How tree species differ as recruitment foci in a tropical pasture. Ecology 2001, 82, 2547–2559. [Google Scholar] [CrossRef]
  13. Norden, N.; Chave, J.; Belbenoit, P.; Caubere, A.; Chatelet, P.; Forget, P.M.; Riera, B.; Viers, J.; Thebaud, C. Interspecific variation in seedling responses to seed limitation and habitat conditions for 14 neotropical woody species. J. Ecol. 2009, 97, 186–197. [Google Scholar] [CrossRef]
  14. Tilman, D. Competition and biodiversity in spatially structured habitats. Ecology 1994, 75, 2–16. [Google Scholar] [CrossRef]
  15. Hurtt, G.C.; Pacala, S.W. The consequences of recruitment limitation—Reconciling chance, history and competitive differences between plants. J. Theor. Biol. 1995, 176, 1–12. [Google Scholar] [CrossRef]
  16. Platt, W.J.; Weis, I.M. Resource partitioning and competition within a guild of fugitive prairie plants. Am. Nat. 1977, 111, 479–513. [Google Scholar] [CrossRef]
  17. Nathan, R.; Muller-Landau, H.C. Spatial patterns of seed dispersal, their determinants and consequences for recruitment. Trends Ecol. Evol. 2000, 15, 278–285. [Google Scholar] [CrossRef] [Green Version]
  18. Ter Steege, H.; Pitman, N.C.A.; Sabatier, D.; Baraloto, C.; Salomão, R.P.; Guevara, J.E.; Phillips, O.L.; Castilho, C.V.; Magnusson, W.E.; Molino, J.-F.; et al. Hyperdominance in the Amazonian tree flora. Science 2013, 342. [Google Scholar] [CrossRef] [PubMed]
  19. Terborgh, J.; Alvarez-Loayza, P.; Dexter, K.; Cornejo, F.; Carrasco, C. Decomposing dispersal limitation: Limits on fecundity or seed distribution? J. Ecol. 2011, 99, 935–944. [Google Scholar] [CrossRef]
  20. Martínez-Garza, C.; González-Montagut, R. Seed rain from forest fragments into tropical pastures in Los Tuxtlas, Mexico. Plant Ecol. 1999, 145, 255–265. [Google Scholar] [CrossRef]
  21. Martínez-Garza, C.; Howe, H.F. Restoring tropical diversity: Beating the time tax on species loss. J. Appl. Ecol. 2003, 40, 423–429. [Google Scholar] [CrossRef]
  22. Martínez-Garza, C.; Flores-Palacios, A.; De La Peña-Domene, M.; Howe, H.F. Seed rain in a tropical agricultural landscape. J. Trop. Ecol. 2009, 25, 541–550. [Google Scholar] [CrossRef]
  23. Howe, H.F.; Urincho-Pantaleon, Y.; de la Peña-Domene, M.; Martinez-Garza, C. Early seed fall and seedling emergence: Precursors to tropical restoration. Oecologia 2010, 164, 731–740. [Google Scholar] [CrossRef] [PubMed]
  24. Ingle, N.R. Seed dispersal by wind, birds, and bats between Philippine montane rainforest and successional vegetation. Oecologia 2003, 134, 251–261. [Google Scholar] [CrossRef] [PubMed]
  25. Chazdon, R.L.; Letcher, S.G.; van Breugel, M.; Martinez-Ramos, M.; Bongers, F.; Finegan, B. Rates of change in tree communities of secondary neotropical forests following major disturbances. Philos. Trans. R. Soc. B-Biol. Sci. 2007, 362, 273–289. [Google Scholar] [CrossRef] [PubMed]
  26. Boucher, D.H.; Vandermeer, J.H.; de la Cerda, I.G.; Mallona, M.A.; Perfecto, I.; Zamora, N. Post-agriculture versus post-hurricane succession in southeastern Nicaraguan rain forest. Plant Ecol. 2001, 156, 131–137. [Google Scholar] [CrossRef]
  27. Chazdon, R.L.; Guariguata, M.R. Natural regeneration as a tool for large-scale forest restoration in the tropics: Prospects and challenges. Biotropica 2016, 48, 716–730. [Google Scholar] [CrossRef]
  28. Martínez-Garza, C.; Osorio-Beristain, M.; Alcalá-Martínez, R.; Valenzuela-Galván, D.; Mariano, N.; Ceccon, E. Ocho años de restauración experimental en las selvas estacionales de México. Experiencias Mexicanas en la Restauración de los Ecosistemas 2016, 1, 385–405. [Google Scholar]
  29. Muller-Landau, H.C.; Wright, S.J.; Calderón, O.; Hubbell, S.P.; Foster, R.B. Assessing recruitment limitation: Concepts, methods and case-studies from a tropical forest. In Seed Dispersal and Frugivory; Levey, D.J., Silva, W.R., Galetti, M., Eds.; CAB International: Wallingford, UK, 2002; pp. 35–53. [Google Scholar]
  30. De La Peña-Domene, M.; Martínez-Garza, C.; Howe, H.F. Early recruitment dynamics in tropical restoration. Ecol. Appl. 2013, 23, 1124–1134. [Google Scholar] [CrossRef] [PubMed]
  31. De la Peña-Domene, M.; Howe, H.F.; Cruz-León, E.; Jiménez-Rolland, R.; Lozano-Huerta, C.; Martínez-Garza, C. Seed to seedling transitions in successional habitats across a tropical landscape. Oikos 2017, 126, 410–419. [Google Scholar] [CrossRef]
  32. Colwell, R.K. Estimates: Statistical Estimation of Species Richness and Shared Species from Samples. Version 8.0 User’s Guide and Application. 2006. Available online: http://viceroy.eeb.uconn.edu/estimates (accessed on 16 July 2012).
  33. Williams, G.C. Sex and Evolution; Princeton University Press: Princeton, NJ, USA, 1975. [Google Scholar]
  34. Hubbell, S.P.; Foster, R.B.; O’Brien, S.T.; Harms, K.E.; Condit, R.; Wechsler, B.; Wright, S.J.; de Lao, S.L. Light-gap disturbances, recruitment limitation, and tree diversity in a neotropical forest. Science 1999, 283, 554–557. [Google Scholar] [CrossRef] [PubMed]
  35. Holl, K.D. Factors limiting tropical rain forest regeneration in abandoned pasture: Seed rain, seed germination, microclimate, and soil. Biotropica 1999, 31, 229–242. [Google Scholar] [CrossRef]
  36. Vázquez-Yanes, C.; Orozco-Segovia, A. Effects of litter from a tropical rainforest on tree seed germination and establishment under controlled conditions. Tree Physiol. 1992, 11, 391–400. [Google Scholar] [CrossRef] [PubMed]
  37. Muller-Landau, H.C. The tolerance–fecundity trade-off and the maintenance of diversity in seed size. Proc. Natl. Acad. Sci. USA 2010, 107, 4242–4247. [Google Scholar] [CrossRef] [PubMed]
  38. De La Peña-Domene, M.; Martínez-Garza, C.; Ayestarán-Hernández, L.M.; Howe, H.F. Plant attributes that drive dispersal and establishment limitation in tropical agricultural landscapes. Forests 2018. submitted. [Google Scholar]
Figure 1. Study site and experimental design used to collect seed and seedling data in Los Tuxtlas, Mexico. The aerial photo shows the distribution of the primary forest, the secondary forest and the pasture sites. The two schemes in the top left show the sampling design with 1 m2 seed traps and the area where seedling recruitment was measured.
Forests 09 00570 g001
Figure 2. Comparison of presence and density indices for primary forest, secondary forest, and fenced pasture at Los Tuxtlas, southern Mexico. Presence and density-weighted indices are shown for dispersal limitation (A and B, respectively), and for establishment limitation (C and D, respectively). Squares show medians, boxes are quartiles and bars indicate highest and lowest values. Green boxes show the primary forest, blue boxes, the secondary forest and yellow boxes, the pasture. Different letters indicate significance based on multiple comparison z-tests within each frame. See text for relevant comparisons between frames.
Forests 09 00570 g002
Figure 3. Differences between the presence and the density-weighted index in estimating dispersal (a) (H(2,40) = 30.9, p ˂ 0.001), and establishment limitation (b) (H(2,40) = 13.6, p ˂ 0.001) by habitat. Squares are means, boxes are standard deviations and lines indicate 95% confidence intervals. Green boxes show the primary forest, blue boxes, the secondary forest and yellow boxes, the pasture. Different letters indicate significance based on Kruskal-Wallis tests within each frame. See text for relevant comparisons between frames.
Forests 09 00570 g003
Figure 4. Graphic representation of the differences between the presence and the density-weighted index. The connecting line is only to show how a general tendency is followed for both indexes. Wald-Wolfowitz Runs test indicated highly significant differences for both (A) dispersal and (B) establishment limitation between indices. Limitation from 0% to 33% was classified as low (yellow), from 34% to 66% as intermediate (orange) and 67% to 100% as high (red). Acronyms refer to the first letter of the genus and the three first letters of the species (full species names are included in Table A1). Pioneer species are marked in bold while and non-pioneer species are marked with italics.
Forests 09 00570 g004
Figure 5. Differences between the presence and the density-weighted index in three different habitats. Positive values (blue) indicate that the density-weighted index showed higher limitation than the presence index. Negative values (red) indicate that less limitation was estimated by the density-weighted index. Acronyms refer to the first letter of the genus and the three first letters of the species (full species names are included in Table A1).
Forests 09 00570 g005aForests 09 00570 g005b

