Article

Effects of Disturbance on Tree Community Dynamics in Whitebark Pine (Pinus albicaulis Engelm.) Ecosystems

Department of Ecosystem and Conservation Sciences, University of Montana, Missoula, MT 59812, USA
*
Author to whom correspondence should be addressed.
Forests 2018, 9(9), 566; https://doi.org/10.3390/f9090566
Submission received: 13 June 2018 / Revised: 10 September 2018 / Accepted: 11 September 2018 / Published: 13 September 2018
(This article belongs to the Special Issue Ecology and Restoration of Whitebark Pine)

Abstract

:
Whitebark pine (Pinus albicaulis Engelm.), an ecologically important tree species in high-elevation ecosystems of western North America, is threatened by white pine blister rust (Cronartium ribicola Fischer) and increased pressure from mountain pine beetle (Dendroctonus ponderosae Hopkins) due to climate warming. In addition, there is concern that fire suppression may be leading to successional replacement of whitebark by late-seral trees. Despite widespread knowledge that the tree is in decline, there is limited understanding of its successional dynamics, particularly in forests disturbed by white pine blister rust and mountain pine beetle. Our objective was to examine how disturbances have affected forest composition, structure, and seedling regeneration over a 22-year period (1990–2012) at 19 sites in the Cascade Mountains of Washington State (USA). Over that time, 13 sites (68%) were infected by white pine blister rust, 11 (58%) were disturbed by mountain pine beetle, and 5 (26%) experienced wildfire. Tree community composition changed significantly during the study period, primarily due to significant mortality of mature (≥20-cm diameter at breast height) whitebark pine. Despite loss of mature whitebark trees, we found little evidence of successional replacement by other tree species. Whitebark seedling density was unrelated to basal area of mature whitebark pine, but positively correlated with the presence of herb and shrub cover. Our results demonstrate the value of long-term repeated measurements for elucidating successional dynamics.

1. Introduction

Whitebark pine (Pinus albicaulis Engelm.), an ecologically important tree species [1] in high-elevation ecosystems of the western United States and Canada [2,3], is declining due to widespread outbreaks of a native insect, mountain pine beetle (Dendroctonus ponderosae Hopkins) [4], and an invasive fungal pathogen that causes white pine blister rust (Cronartium ribicola Fischer) [2]. There is concern that changes in disturbance regimes are contributing to successional replacement of whitebark pine by killing whitebark pine trees and facilitating recruitment of shade-tolerant species such as subalpine fir (Abies lasiocarpa (Hooker) Nuttall) and Engelmann spruce (Picea engelmannii Parry ex Engelm.). Increases in these shade-tolerant species may reduce the availability of canopy openings, which are thought to increase the likelihood of whitebark seedling recruitment [5,6,7,8,9]. Despite evidence that mountain pine beetle and white pine blister rust could contribute to successional replacement of whitebark pine by more shade-tolerant conifers in some areas [10,11,12,13], the occurrence, rate, and extent of this replacement across the tree’s range is unknown. Moreover, there is little understanding of how interacting disturbances such as bark beetles and blister rust may differentially affect sub-mesic whitebark plant associations, where whitebark is typically co-dominant, versus xeric whitebark associations, where whitebark is often the dominant or only tree species (but see [14]). Even with a high degree of interest in whitebark pine conservation and restoration, long-term data on tree community dynamics in relation to disturbance are lacking.
Whitebark pine ecosystem responses to attack by mountain pine beetles are shaped by interactions that have occurred over millennia [15]. Recently, mountain pine beetle activity has intensified in high-elevation ecosystems due to temperature increases that have reduced climatic controls on beetle populations [4,16,17,18,19]. Since mountain pine beetle preferentially attack larger diameter trees [19,20,21,22], there are concerns that increased mortality of mature trees following beetle outbreaks could shift overstory dominance in whitebark pine stands to other tree species and reduce regeneration potential due to loss of cone-producing trees [11].
Unlike the mountain pine beetle, non-native blister rust kills trees of all sizes [2,23,24]. Blister rust is also thought to indirectly affect whitebark pine population dynamics by reducing cone production, both through mortality of cone-bearing trees and by killing cone-bearing branches of live trees [25,26]. It is unclear, however, whether rust-induced mortality of cone-bearing branches or trees is affecting seedling recruitment and survival in whitebark pine stands and whether rust alone or in combination with mountain pine beetles is affecting successional dynamics of these stands.
Increasing mortality from rust and beetles has raised concerns about the ability of whitebark pine to produce enough seed to adequately regenerate in disturbed areas. While positive correlations between basal area of live, cone-bearing whitebark pine and regeneration at the stand level have been observed [27], mature tree basal area may not be predictive of within-stand rates of regeneration because Clark’s nutcrackers (Nucifraga columbiana Wilson), the primary seed dispersers for whitebark pine [5,28], disperse seed over long distances [29]. Furthermore, mortality of overstory whitebark pine trees could serve as a trigger for whitebark pine population renewal by freeing resources for seedling establishment and by releasing established seedlings ([30,31,32]; but see Keane et al. [33]). For instance, Larson and Kipfmueller [31] found a positive relationship between the density of whitebark pine seedlings and saplings and mountain pine beetle-caused canopy tree mortality across study sites in Montana, Idaho and Oregon, and Meyer et al. [32] observed a positive relationship between density of young (<3 years old) whitebark pine seedlings and the severity of previous mountain pine beetle attack in whitebark stands of the southern Sierra Nevada (California). It is possible that at local scales, the negative effects of whitebark pine mortality agents on cone production may be less important than their positive effects on the growing environment for seedlings. Long-term data on the response of whitebark pine populations to mountain pine beetle and blister rust are generally lacking, however, and it is unclear how these disturbances affect seedling density.
Another aspect of whitebark pine regeneration dynamics requiring further study concerns suitable microsites for seedling establishment. Whitebark pine was originally categorized as “very-intolerant” of shade [34]. This description was then echoed in whitebark pine planting guidelines [5,35], which recommend the removal of vegetation from planting sites to provide openings for seedlings and to reduce competition from other vegetation (but see Perkins [36]). However, more recently researchers have characterized whitebark pine as only moderately shade tolerant [2] and capable of surviving and regenerating in closed canopy forests [37]. Furthermore, the facilitative effects of rocks, stumps, and logs that provide a physical barrier against harsh conditions, including insolation and snow damage, have been documented [25,35,38,39]. The effects of neighboring vegetation and overstory tree cover on whitebark pine regeneration, however, are less clear and appear to vary across the species’ range and by stand type (e.g., sub-mesic vs. xeric whitebark stands) [13,36,37,40,41,42,43,44]. Studies from high-elevation stands in the Rocky Mountains of Canada and USA found higher whitebark pine seedling germination and early survival near and beneath other vegetation (e.g., herbs, shrubs, and tree canopies) that block exposure to direct sunlight compared to more exposed microsites [27,40,41,42], supporting the important role of facilitation in harsh environments (Callaway [45]). However, many of these studies were conducted near treeline, and the relationship between rates of regeneration and neighboring vegetation and tree canopy throughout the elevational range of whitebark pine are still not fully understood. For example, Gelderman et al. [42] observed that whitebark pine seedling occurrence in the Alberta Rocky Mountains (Canada) was positively correlated with prostrate shrub cover, but negatively correlated with overstory tree cover and seedling cover of other conifer species. In their study of whitebark regeneration in burn sites across Montana, Leirfallom et al. found that the probability of whitebark seedling presence increased with increasing vegetation cover up to 30%, after which probability decreased; only 54% of seedlings observed were found within 0.5 m of a rock, log, stump or snag [27]. Examination of the relative importance to seedlings of microsites created by neighboring vegetation compared to those created by rocks, stumps or logs in a wider set of stand types is important for both increasing ecological understanding and informing outplanting efforts.
Successful conservation and management of whitebark pine requires an understanding of patterns of succession and regeneration in the face of novel disturbance regimes [46]. To date, empirical studies of successional dynamics in whitebark pine ecosystems have largely been limited to tree ring approaches [46,47]. Additionally, theoretical studies using computer models have been used to predict trends [10,37,48]. Few studies have directly assessed changes in field plots over time (but see [13,14,19,27]). We were able to take advantage of permanent plots in whitebark pine stands in the eastern Cascade Mountains of Washington State (USA), an area where whitebark pine is understudied, to assess successional changes in tree species abundance and response to disturbance over a 22-year period. Our specific research questions were:
(1)
How frequently were whitebark pine stands disturbed by mountain pine beetle, white pine blister rust, and wildfire?
(2)
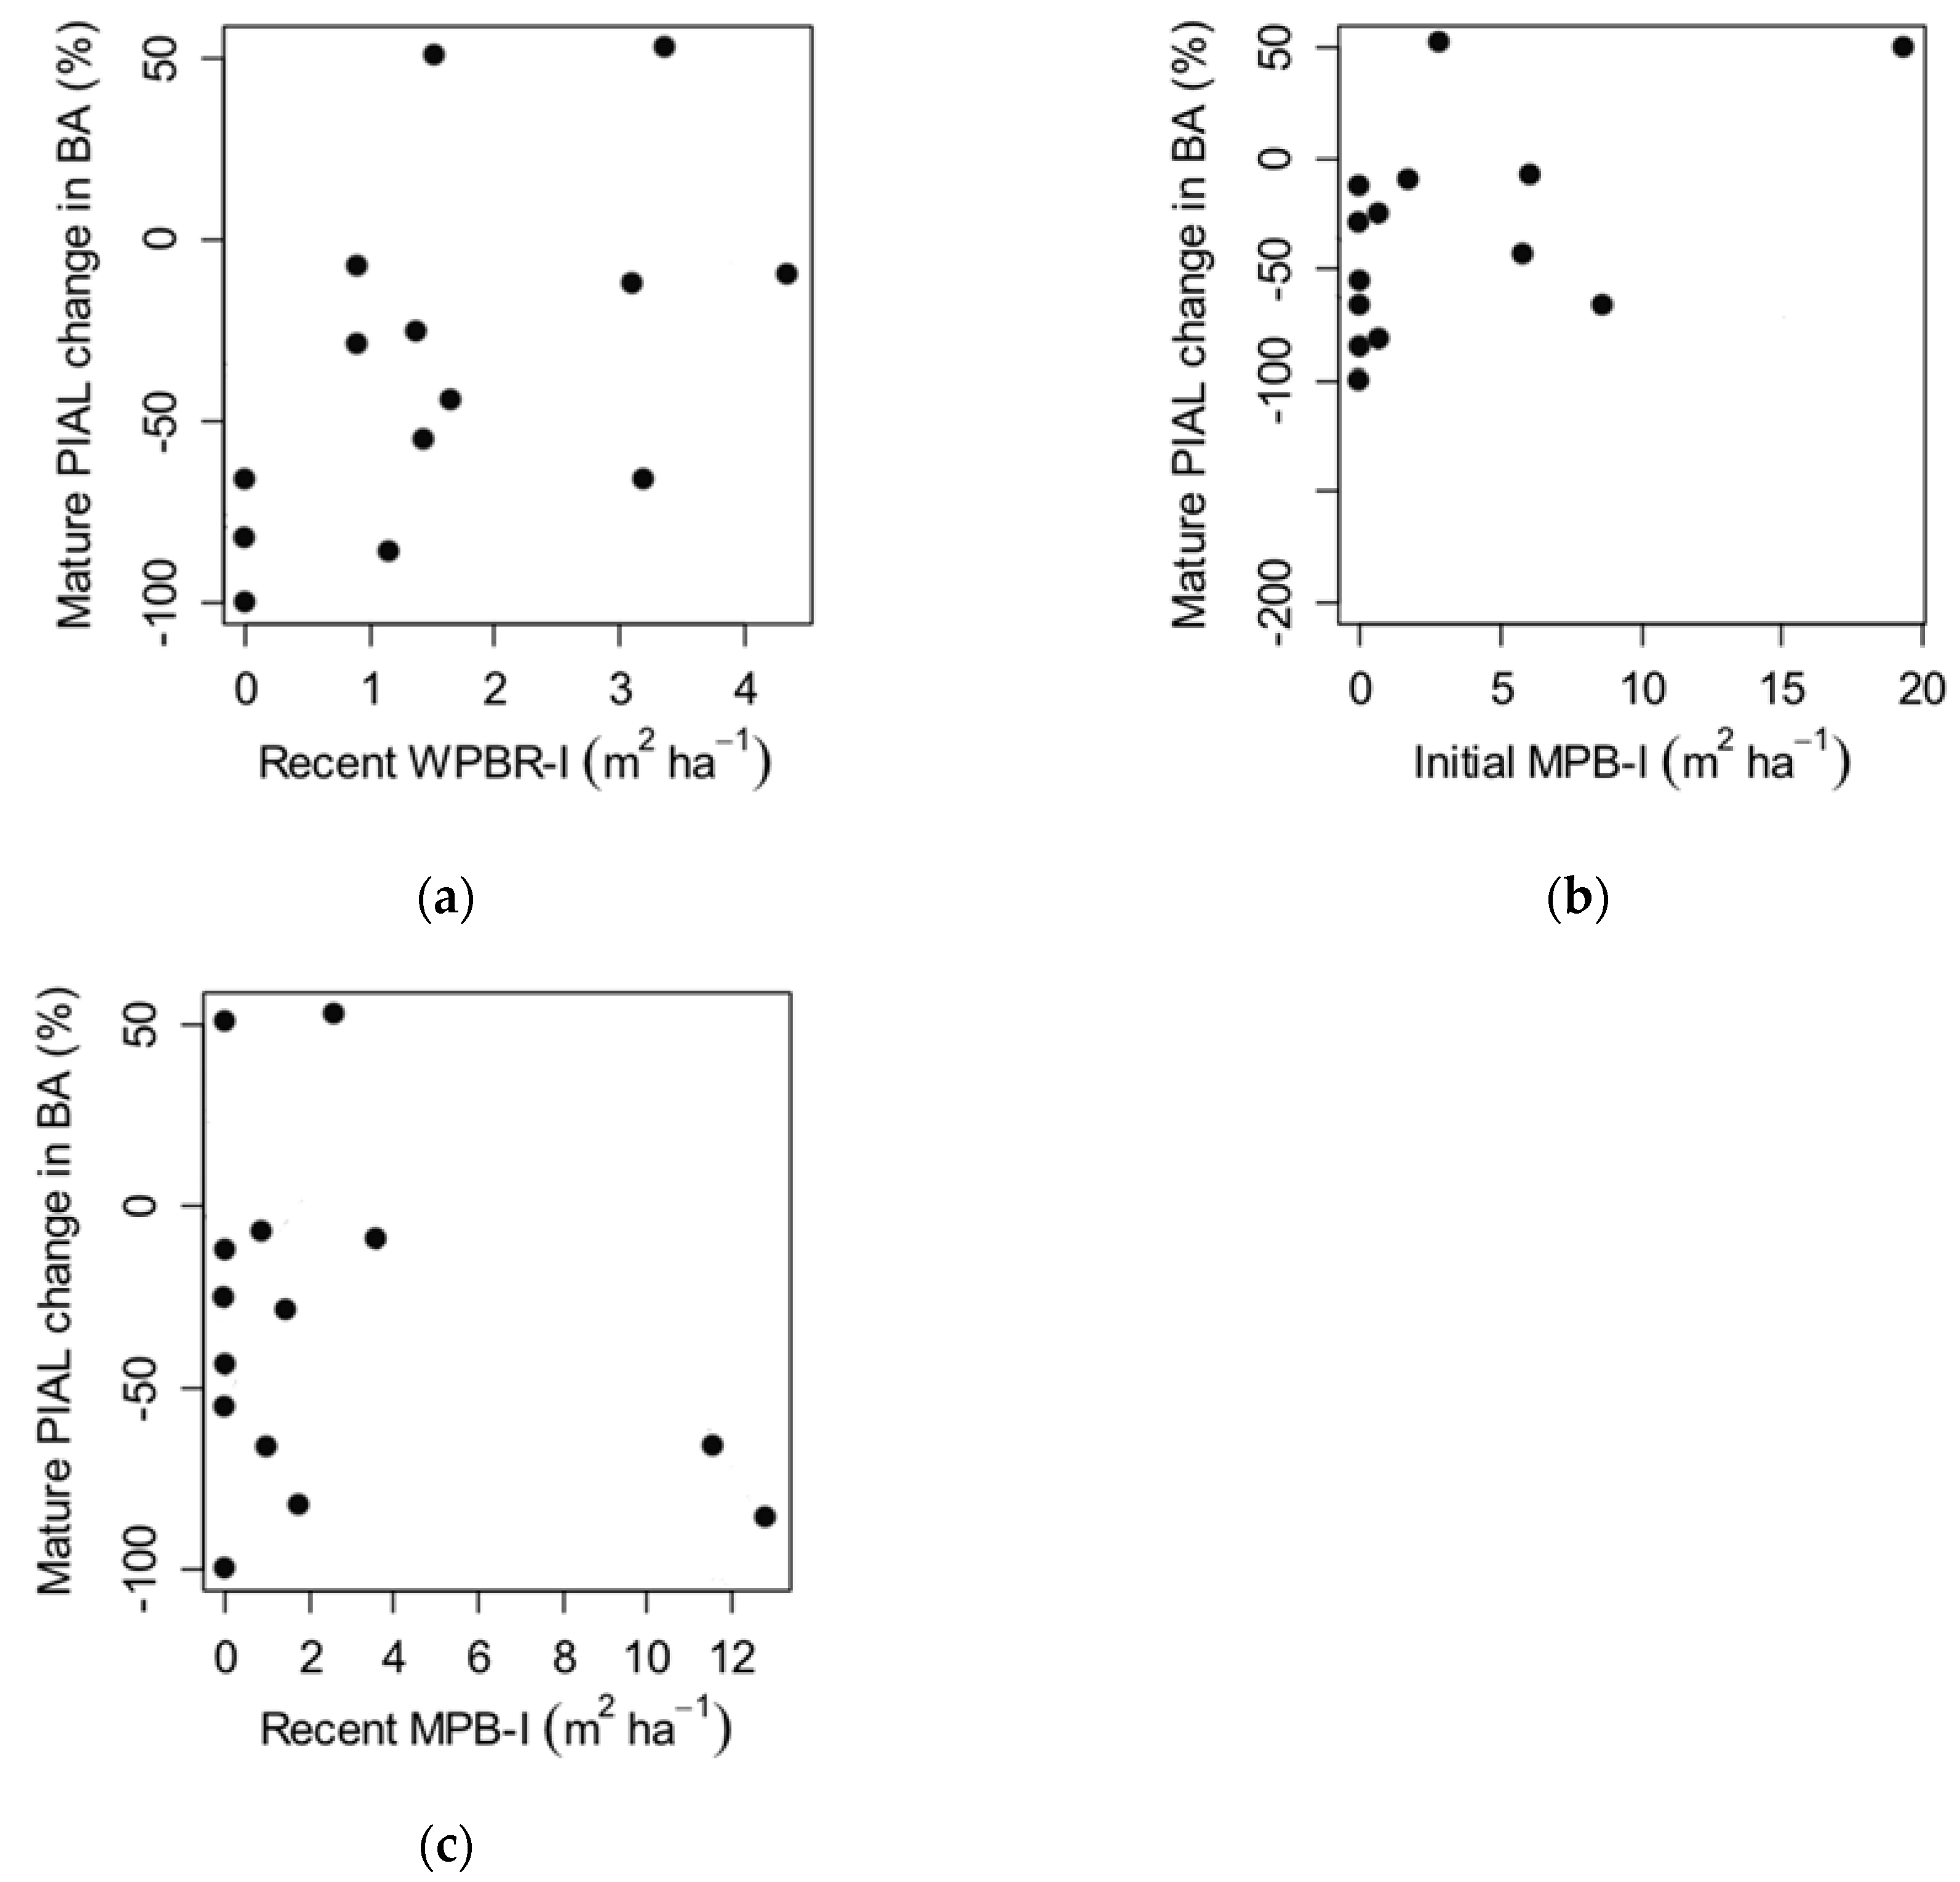
Have there been changes in overall tree community composition or basal area of individual common tree species (whitebark pine, subalpine fir and Engelmann spruce) by size class? If so, are changes related to mountain pine beetle or white pine blister rust incidence?
(3)
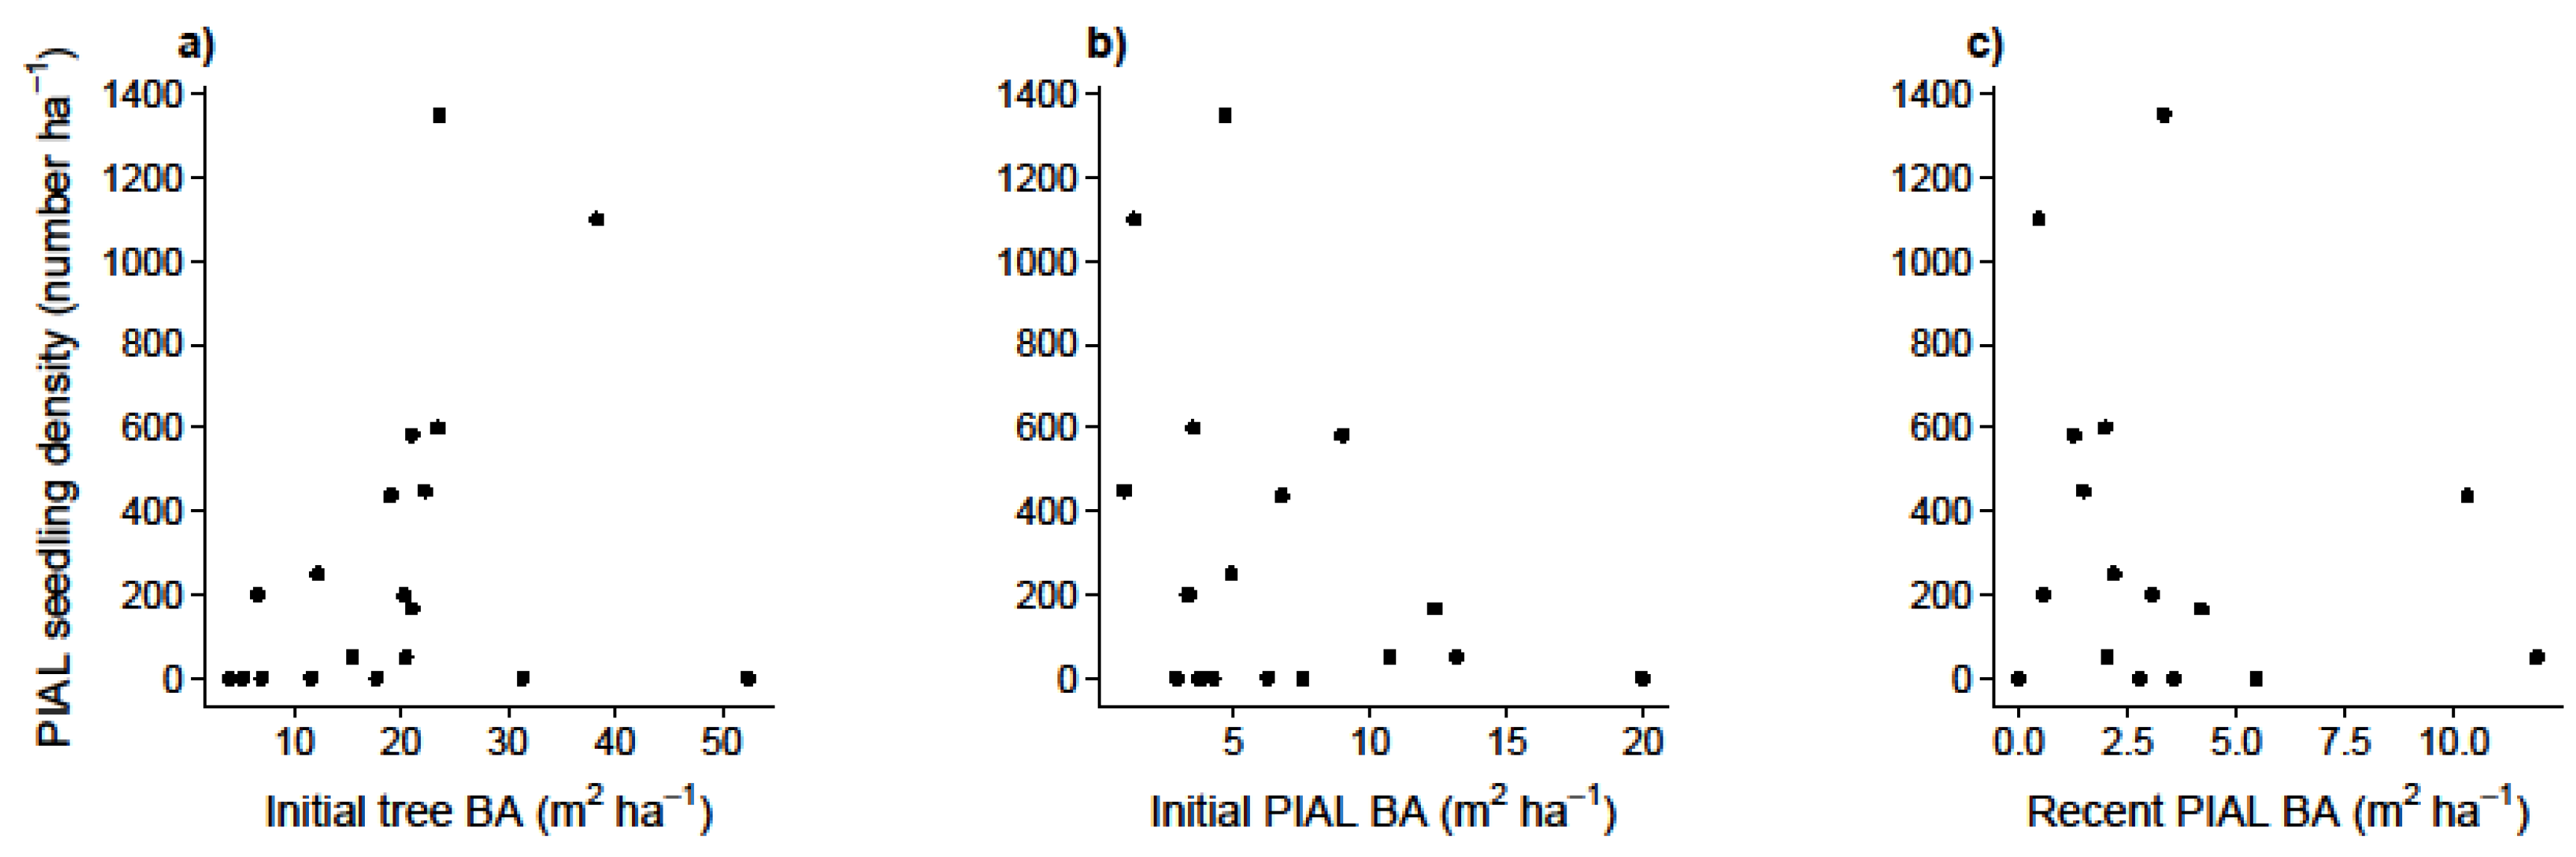
Is whitebark pine regeneration (a) related to mountain pine beetle mortality, white pine blister rust incidence, total tree basal area or basal area of mature whitebark pine, or (b) higher than expected in microsites with specific characteristics (near rocks, stumps, logs, herbs or shrubs, or beneath tree canopies)?

2. Materials and Methods
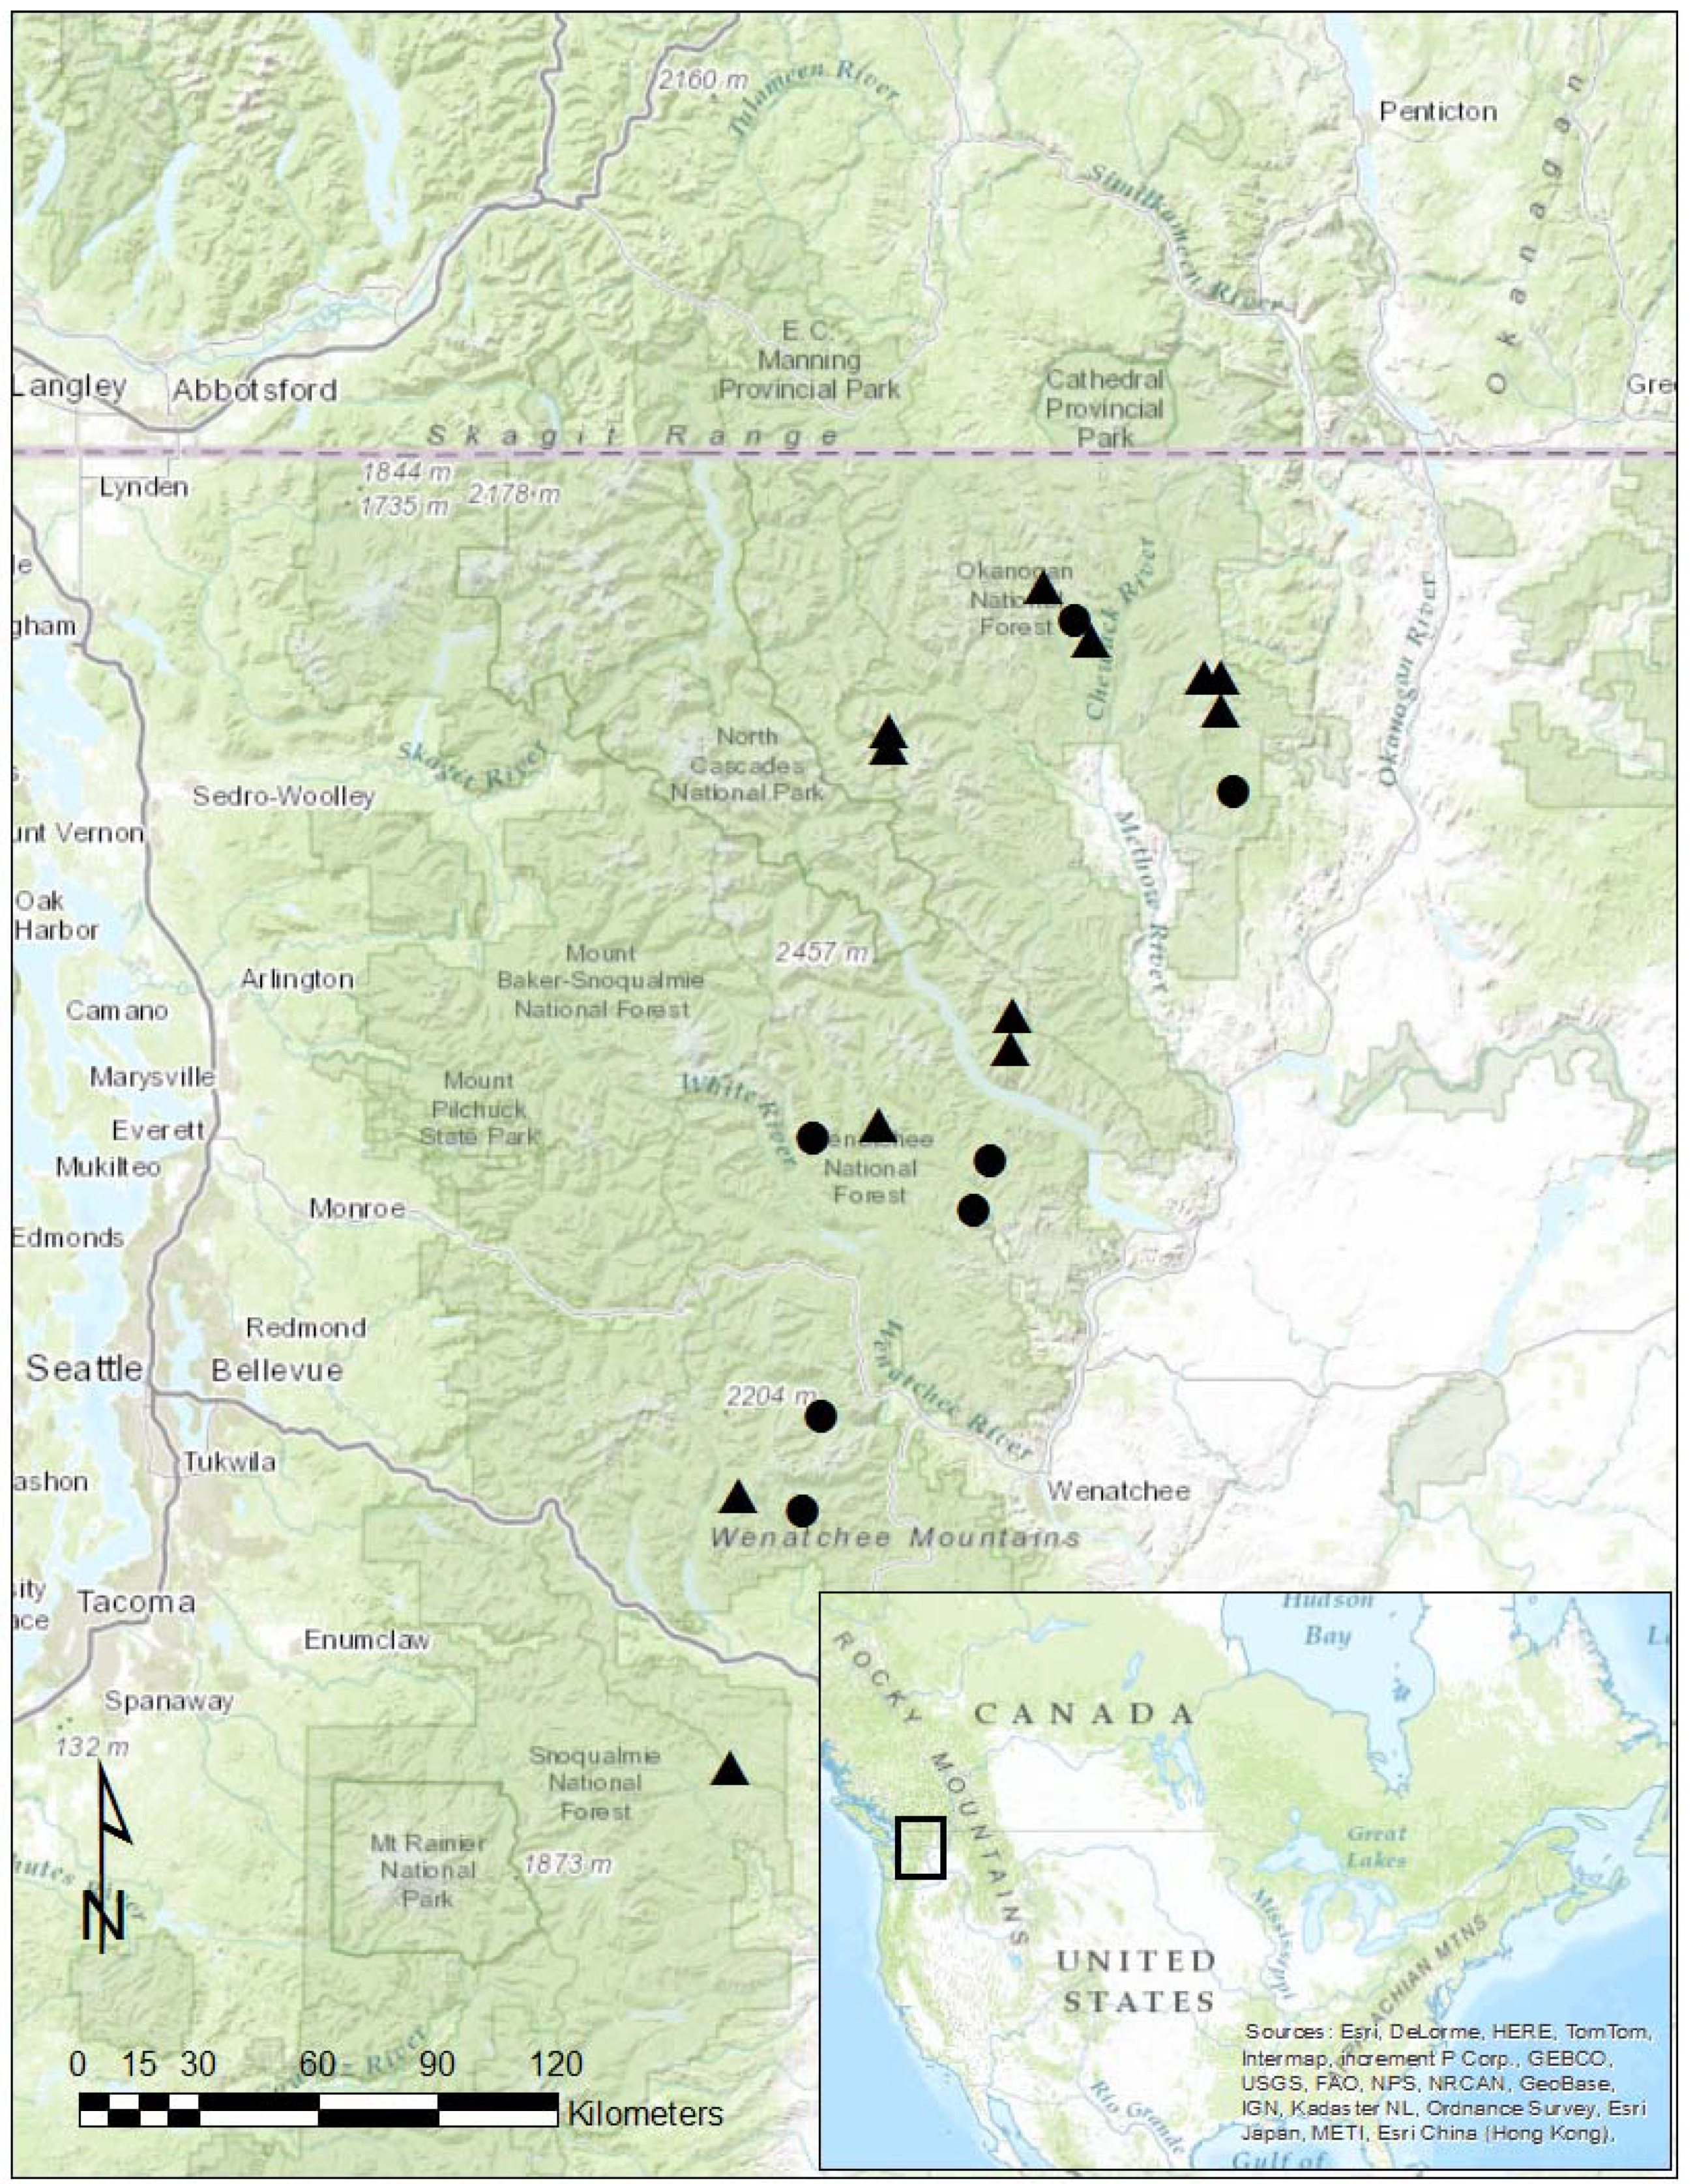
2.1. Site Selection

This study was conducted on Current Vegetation Survey (CVS) research plots (hereafter “macroplots”) established by the US Forest Service (hereafter “USFS”) on the Okanogan-Wenatchee National Forest (hereafter “Forest”) in Washington State in the early 1990s for the purpose of characterizing vegetation and assisting with landscape-level planning and monitoring. All CVS macroplots were established from a random point within the Forest and placed systematically across the landscape on a 2.74-km grid. Following the second measurement of these macroplots in the 2000s, the CVS program was subsumed by the USFS Forest Inventory and Analysis program.
All CVS macroplots used for this study were located outside of designated wilderness areas to reduce travel time and impacts on wilderness areas, and to maximize the number of plots sampled over one field season. Although we did not include plots located in wilderness areas, our study sites were broadly representative of the range of ecological conditions found in whitebark pine communities throughout the region and located at similar elevations as those within wilderness. Study sites were located along the eastern crest of the Cascade Mountain Range in Washington State on a ca. 200-km north-south transect between 47°01′06″ N and 48°48′09″ N. CVS plots chosen for this study were sampled once between 1991 and 1998 (hereafter, “Cycle I”) and again between 2001 and 2007 (hereafter, “Cycle II”) by USFS personnel. In 2012 (hereafter, “Cycle III”), we re-measured all CVS macroplots located on the Forest where: (1) whitebark pine was the dominant or a co-dominant tree species at the time of plot establishment, (2) the site was sampled during both previous sample cycles, and (3) the site was located outside of designated wilderness areas. A total of 19 plots on the Forest met these criteria, including 7 sub-mesic stands in which subalpine fir was the dominant or co-dominant tree species and 12 xeric stands in which whitebark pine was the dominant species (Table 1; Figure 1).

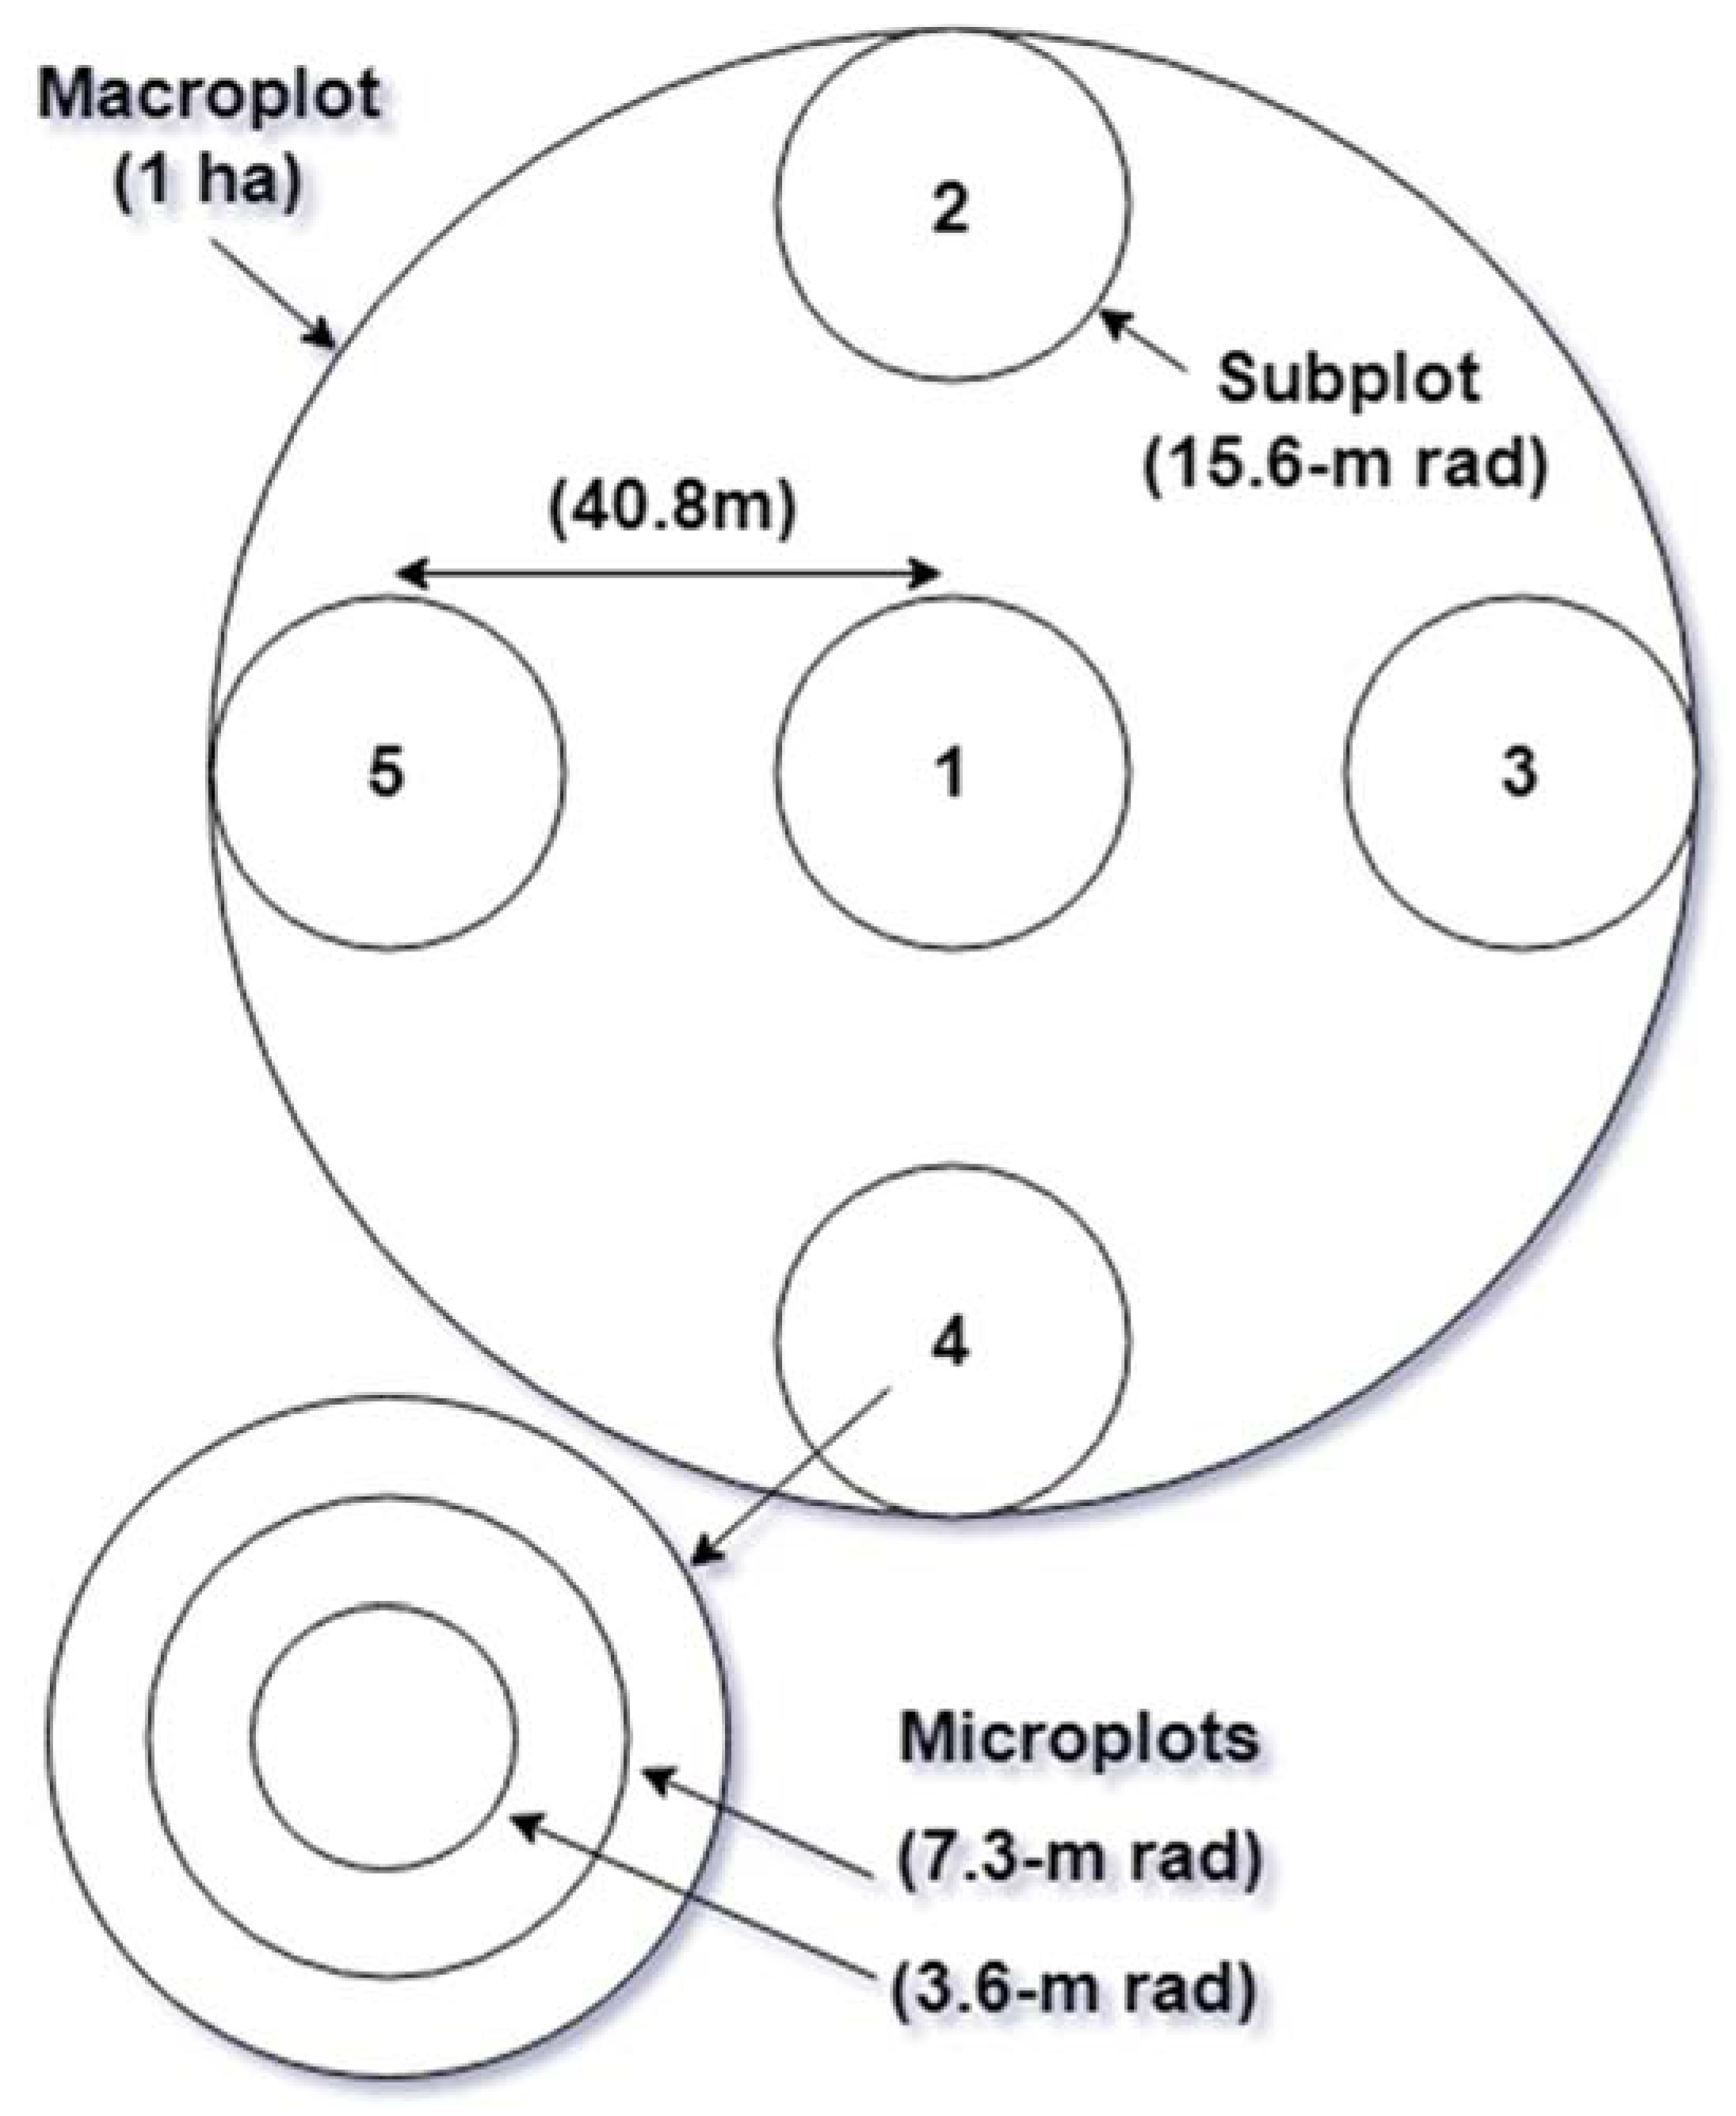
2.2. Original Current Vegetation Survey Sampling Design

Each CVS macroplot consisted of a 1-ha circular plot with five nested subplots: one at the center of the macroplot and the other four at cardinal directions and centered 15.6 m inside of the 1-ha macroplot boundary (Figure 2). Each of the five subplots shared a center with two smaller (7.3-m radius and 3.6-m radius) concentric microplots.
During Cycles I and II, all live and dead trees ≥20-cm diameter at breast height (1.37 m above ground; hereafter “DBH”) in each subplot and poles (trees ≥7.62-cm DBH, but <20-cm DBH) in each 7.3-m radius microplot were individually measured and tagged with unique identification numbers, and live saplings (<7.62-cm DBH, but ≥2.54-cm DBH) were individually measured and tagged in each 3.6-m radius microplot. Live seedlings <2.54-cm DBH but ≥15 cm tall were group-tallied by species within the 3.6-m radius microplots but were not tagged. Species, DBH, and status (live or dead, trees ≥7.62-cm DBH) were recorded for all individually tagged trees [50]. Data on tree damage, including physical damage, damage from insects, and damage from pathogens, were also collected for all tagged trees. For each tree, up to three types of damage were recorded. Because of the three-damage-agent limitation, however, the actual number of trees damaged by specific agents is unknown. For this reason, we were not able to include CVS tree damage data in our analysis.

2.3. 2012 Field Sampling

In 2012 (Cycle III), we re-measured all trees ≥2.54-cm DBH and seedlings <2.54-cm DBH but ≥15 cm tall using the same protocols and size-class definitions used in the original CVS sampling [50] (Cycles I and II). Additional data on whitebark pine trees, seedlings, and microsites were also collected during Cycle III, as described below.

2.3.1. Mature Trees and Poles

At each macroplot, we measured mature trees (trees ≥20-cm DBH) within each of the subplots and poles (trees ≥7.62-cm DBH, but <20-cm DBH) in each 7.3-m radius microplot. For each mature tree and pole, we recorded tag number, species, DBH, and status (live or dead). In addition, we inspected each mature whitebark pine tree (live or dead) for incidence of mountain pine beetle attack, and each live mature or pole-sized tree for incidence and severity of white pine blister rust, following the procedures below.
Beetle attack—Evidence of beetle attack was recorded based on observations of all areas of the tree bole visible with the un-aided eye from ground level based on presence of: (i) “J”-shaped galleries beneath the bark of dead trees, (ii) boring dust in bark crevices particularly around root collar of tree, (iii) pitch tubes (mixtures of tree resin and beetle-produced boring dust), (iv) small emergence holes (≈2 mm diameter), and (v) beetles actively chewing into bark [51]. Bark was removed from dead trees with a hatchet to look for presence of “J”-shaped galleries if no other evidence was found.
For each mature whitebark pine tree with evidence of attack by mountain pine beetle, we assessed whether the attack occurred prior to or since Cycle I by referring to Cycle I data to determine if the tree was dead at that time; if so, that tree was considered attacked by mountain pine beetles prior to macroplot establishment. Trees that were alive at Cycle I, but were dead with evidence of beetle attack at subsequent sample cycles, were considered to have been attacked after macroplot establishment. There was no evidence of recent beetle-attack on live whitebark pine trees at any macroplot during Cycle III.
Blister rust—To assess blister rust incidence and severity, we inspected all live mature or pole-size whitebark pine trees for presence of: (i) active cankers with white aecial blisters or orange aeciospores present on branches or bole; (ii) branch flagging; (iii) rodent chewing at a suspected canker site; (iv) roughened, dead bark; (v) branch tissue with thin, smooth, or swollen sections; and (vi) oozing sap [52]. Live whitebark pine trees with active cankers or with at least two of the other symptoms were considered to be infected and were further classified by the following severity categories: “1” = branch infection >60 cm from tree bole; “2” = branch infection located between 15 and 60 cm from bole; “3” = bole infection, or branch infection ≤15 cm from the tree bole [50]. Only one blister rust severity code, representing the worst case of infection, was assigned to each tree. Examination for blister rust was done from the ground on all sides of the tree; we used binoculars to search for symptoms if areas of the bole were not clearly visible with the naked eye. We did not attempt to assess blister rust incidence on dead whitebark pine because blister rust infection tends to affect the bark and outer tissues of branches and boles, leaving little evidence shortly after the death of a tree.

2.3.2. Saplings

Saplings (trees ≥2.54-cm DBH, but <7.62-cm DBH) were measured in each of the five 3.6-m radius microplots (Figure 2). For each sapling, we recorded the tag number (if previously measured), species, DBH, and status (alive or dead). In addition, we inspected each live whitebark pine sapling for incidence and severity of white pine blister rust.

2.3.3. Seedlings

Living seedlings ≥15-cm tall (measured as the length of the main stem) but <2.54-cm DBH were tallied by species in each of the five 3.6-m radius microplots (Figure 2). In addition, for individual whitebark pine seedlings only, we also collected data including: status (live or dead), height class (“class 1”, small seedlings, <15-cm tall but at least one-yr. old without cotyledons; and “class 2”, large seedlings, ≥15-cm tall but ≤30-cm tall), and incidence and severity of white pine blister rust (using the protocols for rust incidence and severity described above). For each live class 1 whitebark seedling, we also recorded whether the seedling was beneath the drip-line of an overstory tree (≥20-cm DBH) [53], the species of the overstory tree, and whether the overstory tree was live, dead, and if dead whether beetle-killed. We determined the approximate horizontal extent of the overhead drip line by visual estimation and used pin flags to mark drip-line boundaries. We then observed the flags from multiple angles to verify that the extent of the drip line as marked was reasonably accurate. In addition, for each live class 1 whitebark seedling, we recorded whether the seedling was growing within a shaded microsite (within 15 cm of a rock, stump, or log ≥15 cm in height or within 15 cm of herbs or shrubs ≥15-cm tall).

2.3.4. Microsites

To determine the proportion of each 3.6-m radius microplot containing potential seedling habitat (i.e., target microsite characteristics), we visually estimated the total area within each plot that contained the microsite characteristics of interest. To do this, we divided the microplot into four quadrants, each covering a quarter wedge of the area. In each quadrant, we visually estimated the area (m2) that was: (1) within 15 cm of a rock, stump, or log; (2) within 15 cm of live herbs or shrubs that were at least 15 cm tall, (3) beneath the drip-line of live trees, and (4) beneath the drip-line of dead trees. For the latter, we recorded whether the dead tree was a whitebark pine and whether the tree was likely killed by mountain pine beetle. The area recorded as covered by a specific microsite characteristic only included areas where it would be possible for a seedling to germinate; thus, the area of any solid surface such as a rock, stump, log, or the basal area (BA) of plant or tree stems was not included in the area characterized as having the given microsite characteristic. Estimates were made separately for each target microsite characteristic, as areas within the microplot could contain more than one target characteristic (e.g., when areas within 15 cm of vegetation were covered by overstory tree canopy). We summed the estimated area (m2) covered by each microsite characteristic across the four quadrants to get the total area covered by each characteristic for each microplot. We then calculated the total proportion of each of the five microplots per plot covered by each target microsite characteristic by dividing the recorded area by the area of the microplot. Since a given area within a microplot could have multiple target characteristics, the sum of the total proportional area covered by all target microsite characteristics could be greater than 1. Analyses were done separately for each of the four target microsite characteristics and did not assume that characteristics were independent.

2.3.5. Wildfire

At each plot, we recorded recent (occurring since Cycle I) wildfire incidence and severity inside the 1-ha macroplot using the following codes: “0” = no signs of recent wildfire; “1” = ≤50% mortality in overstory (previously tagged) trees over the entire macroplot; or “2” = >50% mortality in overstory trees over the entire macroplot.

2.4. Statistical Analysis

For analysis, all tagged (i.e., re-measured) trees were placed in one of three size-classes: mature (≥20-cm DBH), poles (≥7.62-cm DBH, but <20-cm DBH), and saplings (≥2.54-cm DBH, but <7.62-cm DBH). All seedlings ≥15-cm tall were used in our assessment of successional dynamics (Question 2), while only small whitebark seedlings (<15-cm tall but with no cotyledons) were used to assess factors that control regeneration (Question 3).

2.4.1. Disturbance Frequency and Successional Dynamics (Questions 1 and 2)

We calculated the percentage of sites that were disturbed by beetles, blister rust, and wildfire over the 22-year sampling. To test for changes in tree community composition over time, for each tree species and size class (mature trees, poles, and saplings) on each macroplot (n = 19) we calculated mean (n = 5) BA for each species and size class combination at each of three sample cycles. Basal-area data were not collected for any seedlings (trees <2.54-cm DBH), so they were not included in this analysis. We conducted a principal components analysis (PCA) [54] to assess temporal trends in overall tree community composition. For this analysis, we constructed our main matrix using relativized BA for each size class of each species (i.e., % of total BA attributed to each size class of each species). We then used Multiple Response Permutation Procedures (MRPP) [55,56], a multivariate approach for assessing differences among groups, to test for between-stand-type (xeric vs. sub-mesic) and between-sampling-period (1990s to 2012) differences in overall tree community composition. To test for relationships between changes in tree community composition over time (between Cycles I and III) and disturbance metrics (incidence of mountain pine beetle attack, and incidence and severity of white pine blister rust) at Cycle III, we first calculated percent dissimilarity between Cycles I and III (hereafter “PD”) for each site (n = 19), again based on relativized BA (m2 ha−1) for all species and all size classes, using the Bray-Curtis dissimilarity metric (Equation (1)) [57].
b i i ´ = j = 1 J | n i j n i ´ j | n i + + n i ´ +
where dissimilarity is calculated between samples (rows) i and i’, relativized BAs for each size class of each species are denoted nij and sample (row) totals are ni+. We then used multiple linear regressions to determine if percent dissimilarity was related to these disturbance metrics. For this analysis, percent dissimilarity was log transformed to meet assumptions of normality.
To determine if there were among-sample-cycle differences in tree BA for the most common species (whitebark pine, subalpine fir, and Engelmann spruce) by size-class (mature trees, poles, and saplings) and in density of seedlings, at each macroplot (n = 19) (Q3), we used non-parametric Friedman tests for repeated measures [58], with separate tests for each common species and size-class (and using raw BA values). In addition to running tests for all macroplots combined, we also conducted separate tests for sub-mesic (n = 7) and xeric (n = 12) macroplots (i.e., 36 tests). When significant differences were found, we used Wilcoxon rank-sum tests with Bonferroni correction [59] to test for pairwise differences between sample cycles. For tree species and size classes that were found to change significantly over time, we used Kendall’s tau rank-order correlations [60] to assess relationships between percent change (calculated as value in Cycle III minus value in Cycle I, divided by value in Cycle I, and multiplied by 100) in tree BA or density for that species and size class and the following measures of disturbance and whitebark pine abundance: BA (m2 ha−1) of live whitebark pine trees with current blister rust incidence (“Recent WPBR-I”); current blister rust severity on live whitebark pine trees (“Recent WPBR-S”); BA (m2 ha−1) of all mature whitebark pine killed prior to Cycle I with evidence of mountain pine beetle attack (“Initial MPB-I”); BA (m2 ha−1) of all mature whitebark pine killed since Cycle I with evidence of mountain pine beetle attack (“Recent MPB-I”); and BA (m2 ha−1) of all live whitebark pine (mature, sapling and pole) trees at Cycle I (“Initial PIAL”) and at Cycle III (“Recent PIAL”).

2.4.2. Factors Influencing Whitebark Pine Regeneration (Q3)

We used Kendall’s tau rank-order correlations to assess relationships between whitebark seedling density (“PIAL Seedling Density,” seedling size classes “1” and “2” pooled) and recent and initial mountain pine beetle incidence, blister rust incidence and severity (n = 19) and density of mature whitebark pine trees at the time of plot establishment (“Initial Mature PIAL BA”) and at Cycle III (“Recent Mature PIAL BA”) (n = 19). We also tested for relationships between whitebark seedling density and initial total BA of live trees (m2 ha−1 of all live trees ≥2.54-cm DBH) (“Initial Tree BA”).
To test whether seedlings were more abundant than expected in areas with a particular microsite characteristic, for each macroplot that had small whitebark seedlings (“PIAL Small Seedlings”, seedling size-class “1”) (n = 12), we calculated: (1) mean (n = 5) proportion of microplot area covered by each microsite characteristic (Log, Stump, Rock, “Herb/Shrub”, “Live tree canopy” [beneath the drip-line of live trees ≥20-cm DBH], “PIAL-MPB canopy” [beneath the drip-line of beetle-killed whitebark pine trees ≥20-cm DBH]), and (2) mean (n = 5) proportion of total small whitebark pine seedlings that were growing within areas that had a given target microsite characteristic. We used paired t-tests [61] to determine if there were differences between the mean proportion of plots covered by a particular microsite characteristic and the mean proportion of seedlings growing within areas with that microsite characteristic, with separate tests for each microsite characteristic.
MRPP analysis was completed using PC-ORD version 5.10 [62]. All other analyses were completed using the vegan package in R software version 2.14 [63].

3. Results

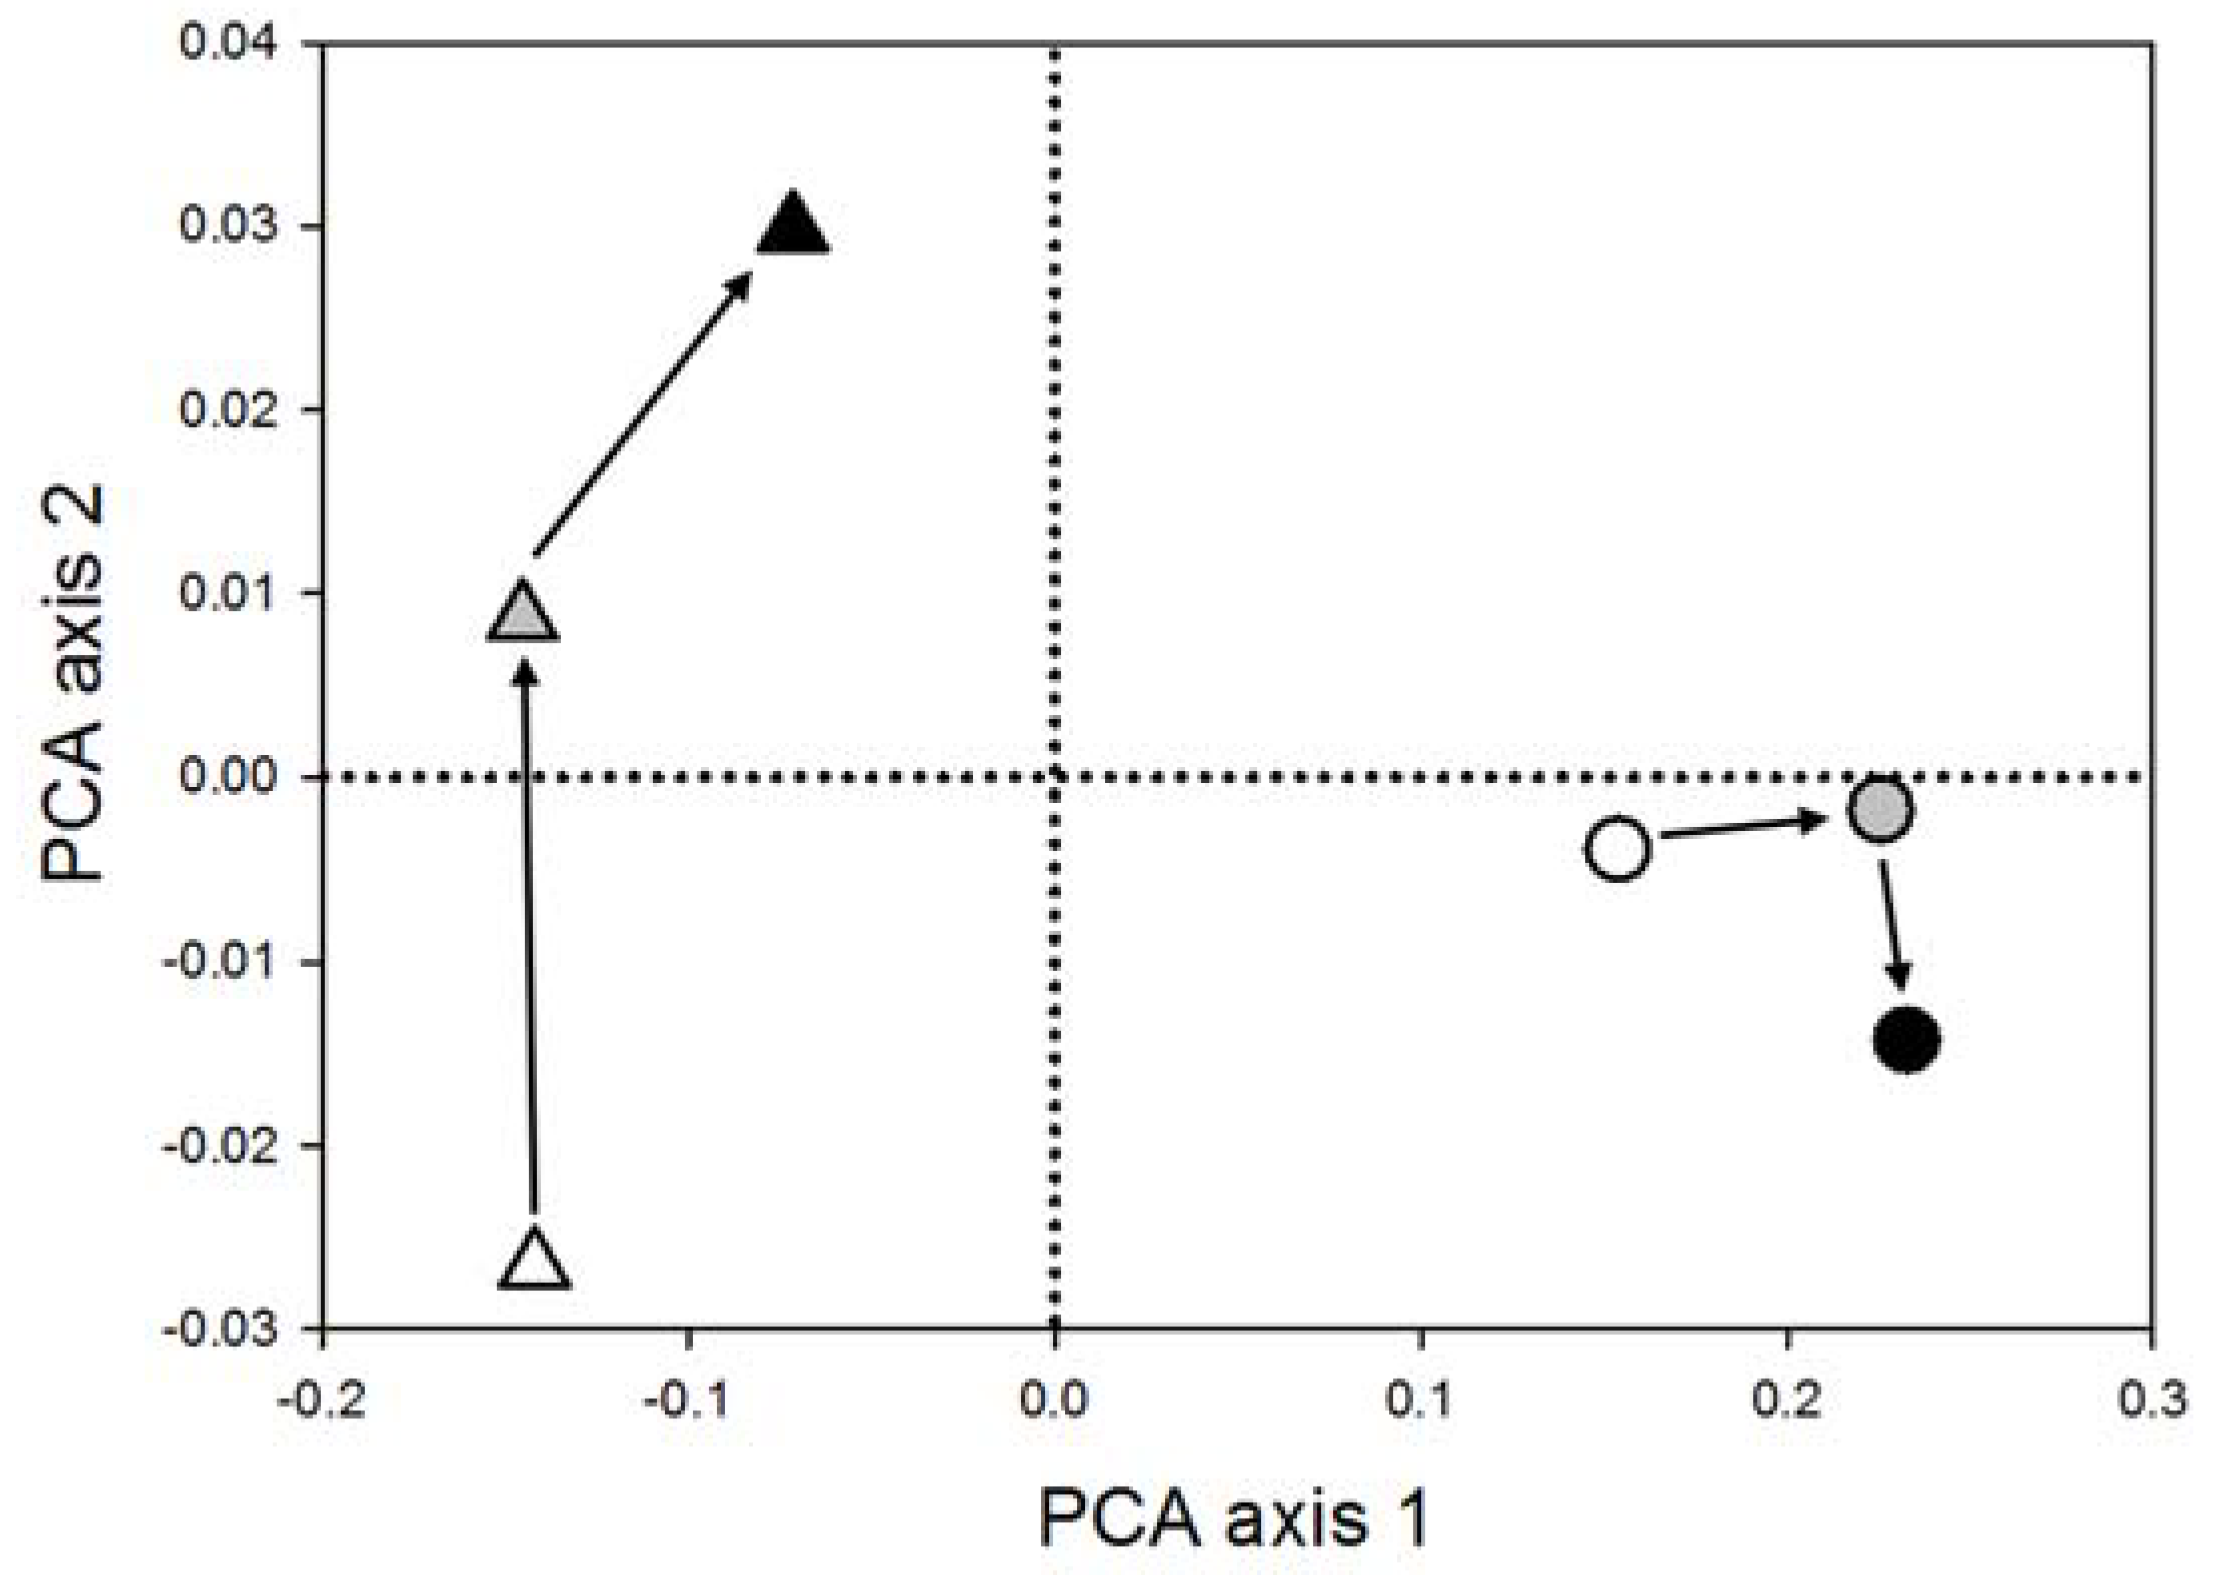
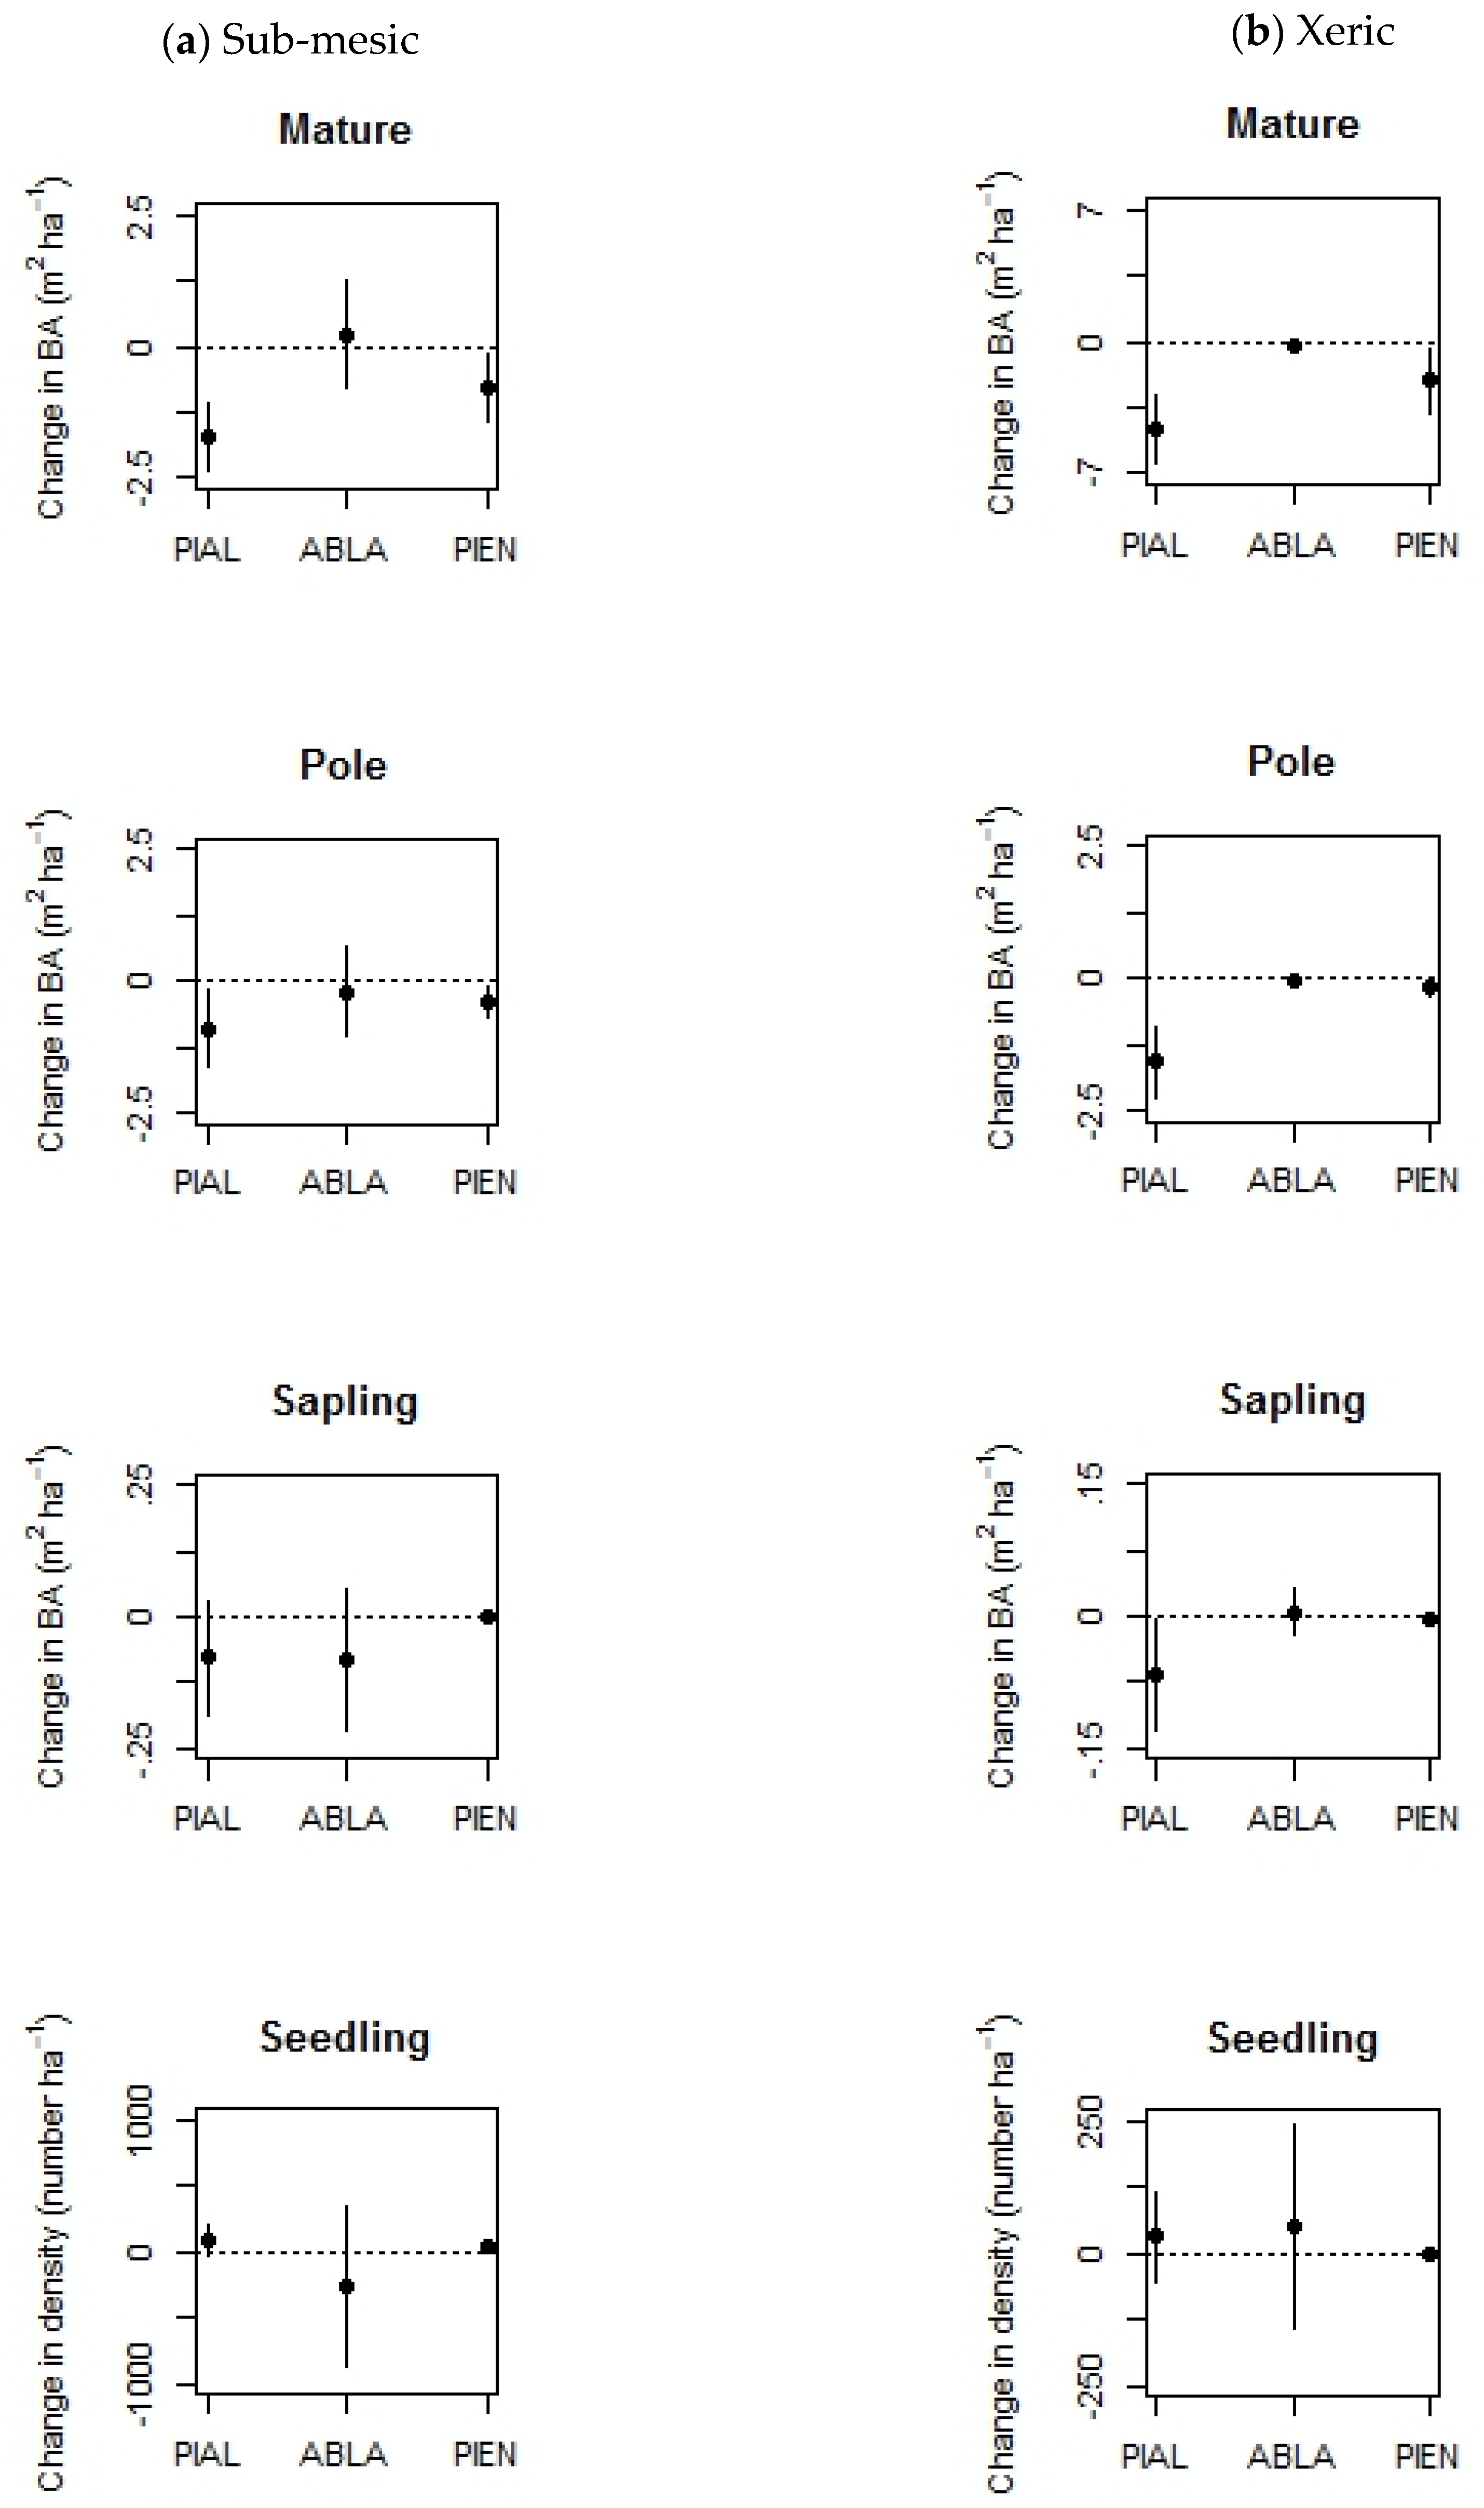
3.1. Disturbance Frequency and Successional Dynamics (Q1 and 2)

Between Cycles I and III, 11 of 19 macroplots were disturbed by mountain pine beetle (58%) (2 sub-mesic and 9 xeric), 13 were infected by white pine blister rust (68%) (6 sub-mesic and 7 xeric), and 5 of 19 macroplots (26%) experienced wildfire (1 sub-mesic and 4 xeric). Only one macroplot showed no evidence of disturbance by any of these disturbance agents. However, this macroplot was disturbed by an avalanche.
Overall tree community composition varied significantly between the xeric and sub-mesic stands (MRPP: A = 0.18, p < 0.0001; Figure 3) and over the three sample cycles (MRPP: A = 0.34, p = 0.001; Figure 3). The first and second principal components explained 66% and 12% of the overall variance in tree community composition, respectively (eigenvalues of 0.132 and 0.024, respectively). Variation in axis scores was primarily driven by abundance of mature whitebark pine and mature subalpine fir: PCA axis 1 was significantly negatively correlated with relative BA of mature whitebark pine (τ = −0.566 and p < 0.001), and PCA axis 2 was significantly negatively correlated with relative BA of mature subalpine fir (τ = −0.309 and p = 0.001).
Change in overall tree community composition (expressed as percent dissimilarity, “Tree Community PD”) between Cycles I and III was significantly related to incidence of white pine blister rust and incidence of mountain pine beetle attack (adjusted R2 = 0.57). Stands that had high total BA of live whitebark pine infected by white pine blister rust at Cycle III experienced less change in tree composition over the 22-year study period than did stands with low blister rust infection incidence at Cycle III (“Recent WPBR-I”; β = −0.560 and p = 0.015; Figure 4a). Similarly, stands with higher total BA of beetle-killed whitebark pine from combined beetle mortality occurring pre and post-plot establishment (Initial + Recent MPB-I) had lower PD over the 22-year period than did stands with lower total BA of beetle-killed whitebark (“Total MPB-I”, β = −0.517 and p = 0.031; Figure 4b). In contrast, stands with higher mortality from beetles during the 22-year study period had higher PD (“Recent MPB-I”, β = 0.844 and p = 0.003; Figure 4c).
During the 22-year study period over all 19 macroplots, the only species and size class to show significant differences in BA was mature whitebark pine, which on average lost about 55% of BA between Cycles I and III on all macroplots (χ2 = 9.15, p = 0.010; Table 2). Differences in mature whitebark BA over time were also significant when xeric communities were analyzed separately (χ2 = 6.50, p = 0.039), but not for sub-mesic stands when analyzed on their own. In addition, mature whitebark pine BA only differed significantly between Cycles I and III (sub-mesic and xeric pooled: p = 0.002, R = 0.421; xeric: p = 0.040, R = 0.529), not between Cycles I and II or II and III (Figure 5). We did not detect significant differences among sample cycles in BA of pole or sapling size classes of whitebark pine, in density of large whitebark pine seedlings, or in any size class of subalpine fir or Engelmann spruce (p-values ranged from 0.066 to 0.911) (Figure 5).
Fire was an important factor in the reduction of mature whitebark pine, especially at high-elevation macroplots; of the five sites that experienced wildfire, four were in xeric communities. The five stands that burned showed the highest reductions in whitebark, with an average decline of 78%. When burned macroplots were removed from the analysis, the BA of whitebark pine did not vary significantly among sample cycles.
Percent change in mature whitebark pine BA between Cycles I and III (xeric and sub-mesic stands pooled) was significantly correlated to current BA of white pine blister rust-infected whitebark pine trees at Cycle III (“Recent WPBR-I”; τ = 0.416 and p = 0.047; Figure 6a), BA of whitebark pine killed by mountain pine beetle prior to Cycle I (“Initial MPB-I”; τ = 0.433, p = 0.045; Figure 6b), and BA of whitebark pine killed by mountain pine beetle over the 22-year study period (“Recent MPB-I”; τ = −0.144 and p = 0.531; Figure 6c). The significance of the relationship between percent change in mature whitebark pine BA and recent mountain pine beetle attack appears primarily to be driven by three macroplots that each lost >8 m2 ha−1 of mature whitebark pine to beetles over the study period. Beetle-caused whitebark pine mortality between Cycles I and III at other macroplots ranged between 0 and 4 m2 ha−1. Six of the 14 non-burned macroplots had no whitebark pine mortality from beetles between Cycles I and III.
We did not detect a significant correlation between percent change in mature whitebark pine BA and either total BA of whitebark pine killed by beetles before and after macroplots were established (“Total MBP-I”; τ = 0.022 and p = 0.956) or BA of mature whitebark pine living at the time of plot establishment (“Initial PIAL”; τ = −0.033 and p = 0.912).

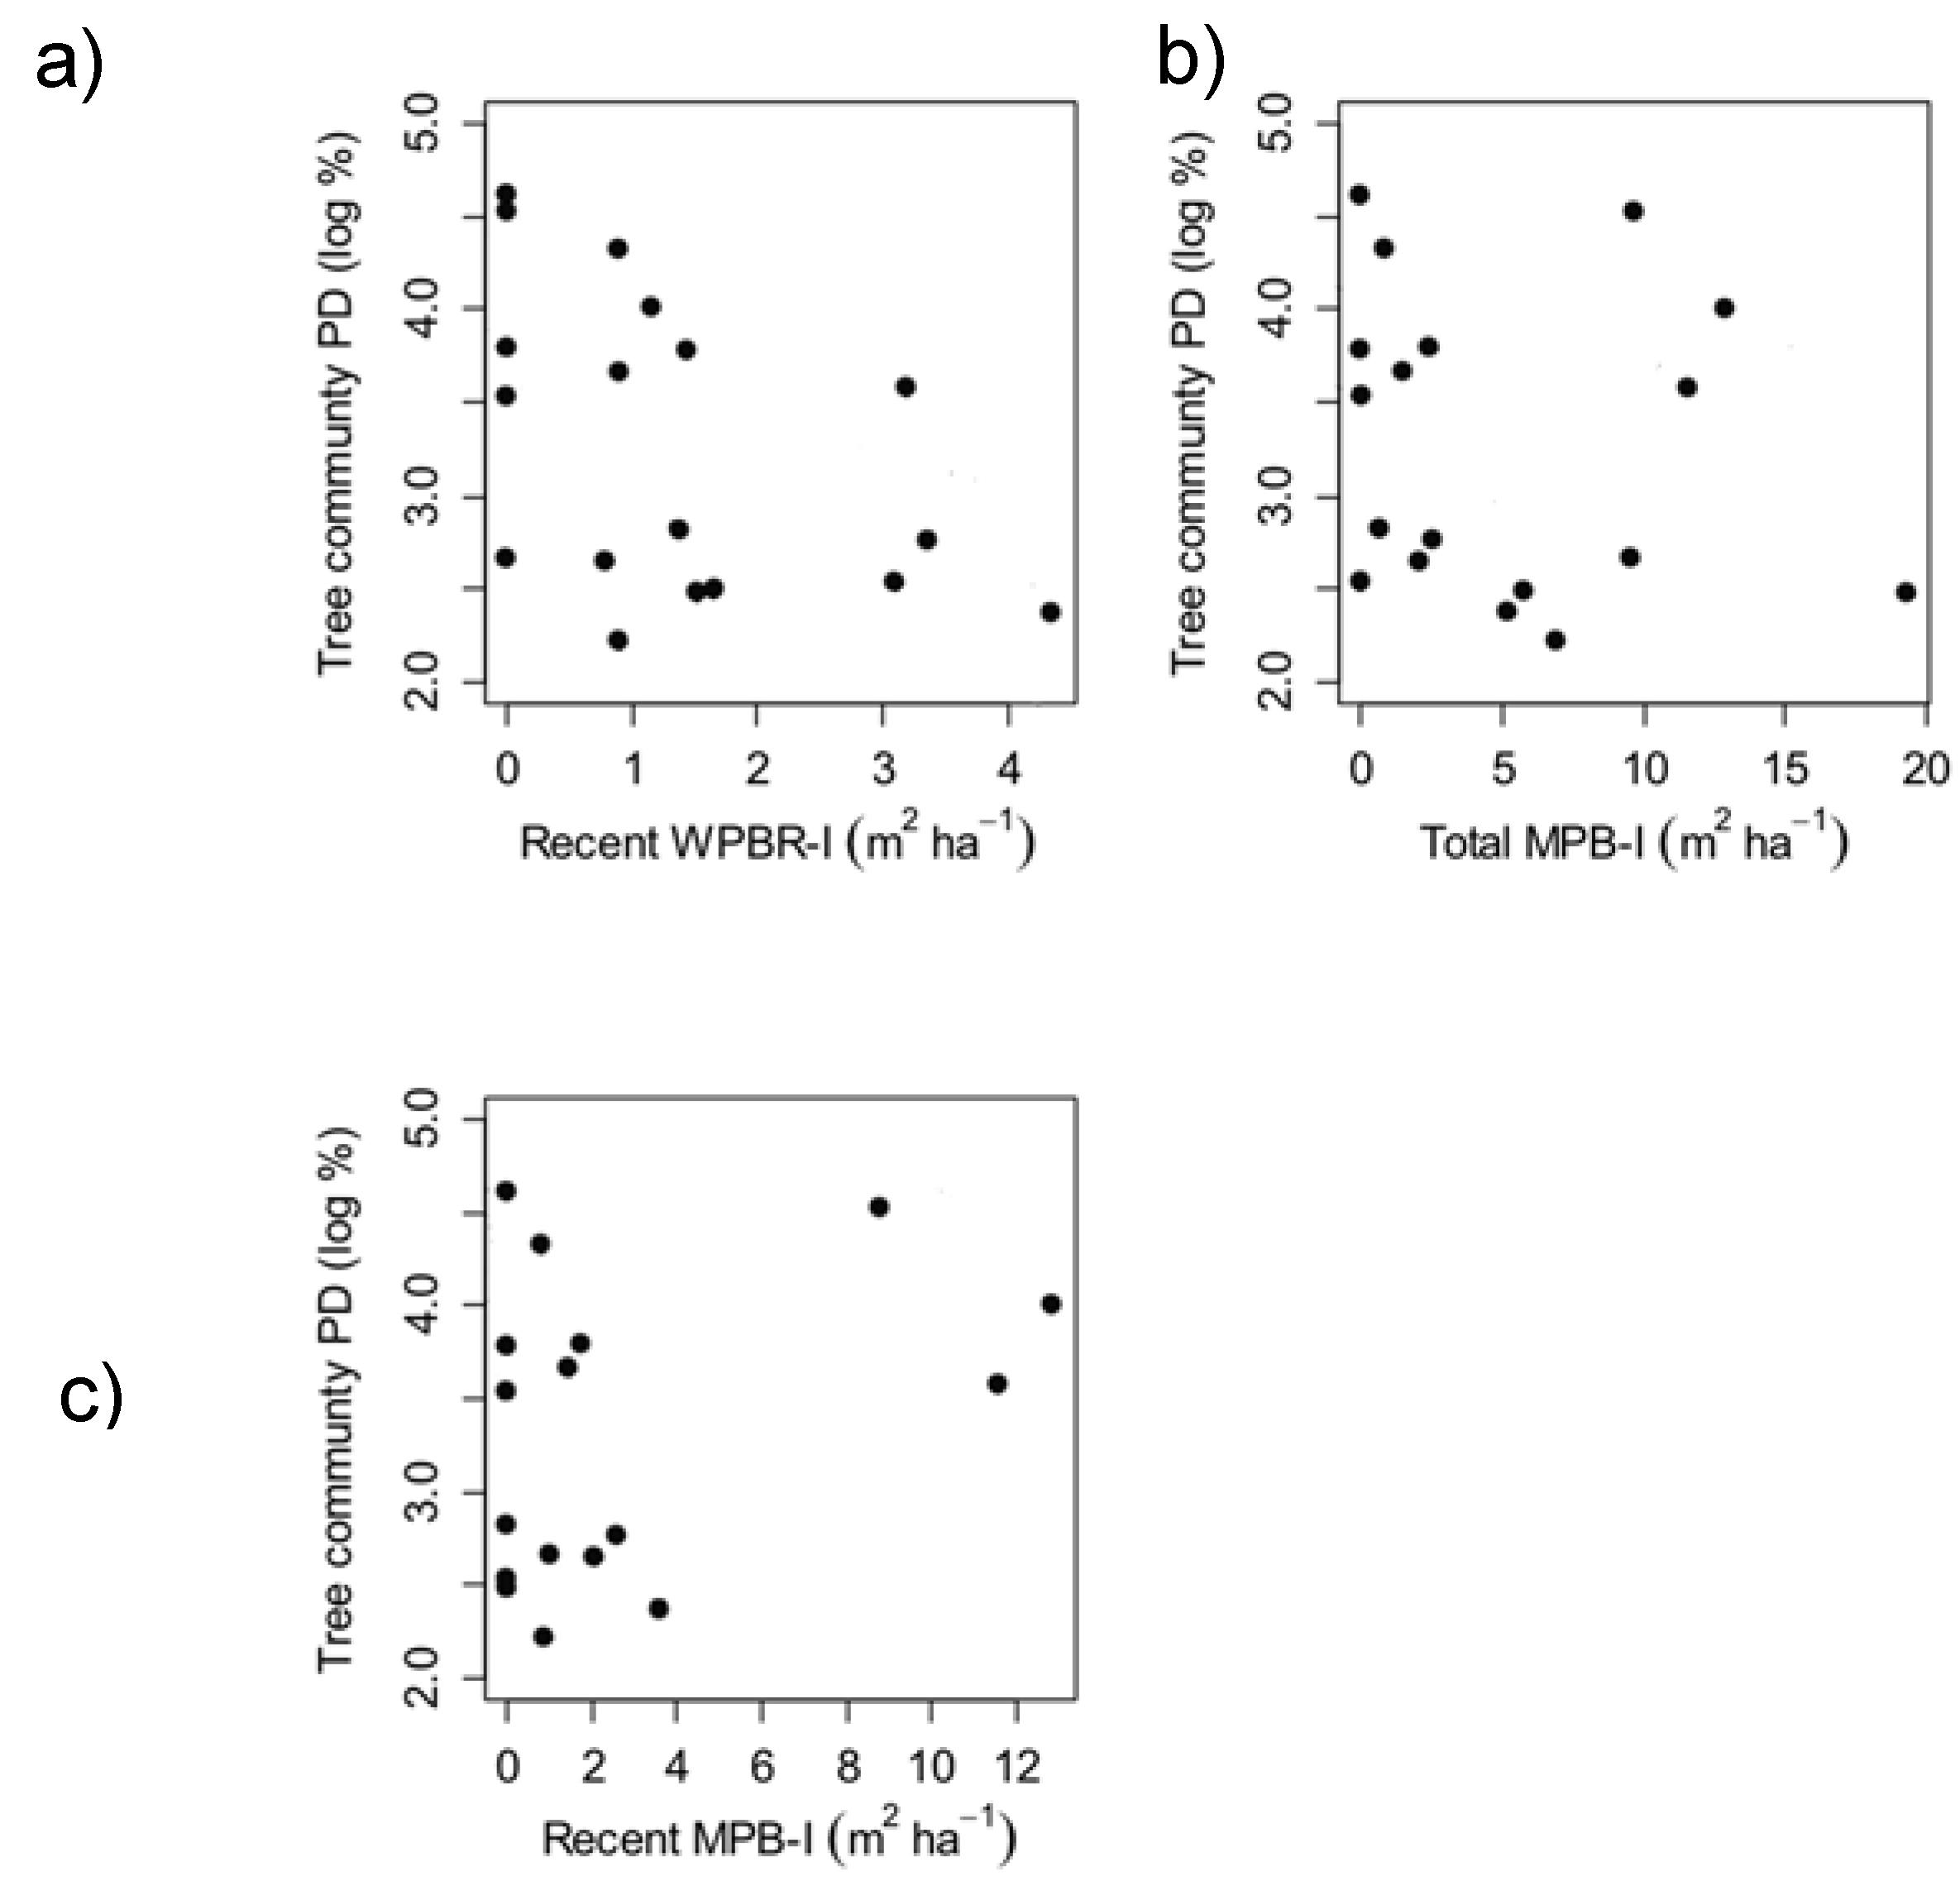
3.2. Factors Influencing Whitebark Pine Regeneration (Q3)

Whitebark pine seedling density (small and large) was significantly positively related to initial tree BA (“Initial tree BA”; τ = 0.390, p = 0.028) (Figure 7a). We did not detect a significant relationship between seedling density and initial mature whitebark pine BA (“Initial PIAL BA”; τ = −0.176, p = 0.331) (Figure 7b) or BA of mature whitebark pine at Cycle III (“Recent PIAL BA”; τ = 0.077, p = 0.690) (Figure 7c). There also was not a significant relationship between whitebark seedling density and either initial BA of beetle-killed whitebark pine (τ = 0.344, p = 0.072) or current BA of blister rust infected whitebark pine trees (τ = 0.185, p = 0.322).
Small whitebark pine seedling density was significantly higher than would be expected (based on the proportion of microplot area covered by each microsite characteristic) in microsites with herb and shrub cover (t = 2.31 and p = 0.033) (Table 3). Differences were not significant for the other five microsites characteristics tested, although we did observe that the proportion of seedlings growing within rock, log, and live tree canopy microsites was greater than the proportion of plots covered by those microsites, as well (Table 3).

4. Discussion

Our study is one of only a handful that address tree species composition and regeneration in whitebark pine stands based on repeated field measurements (but see [13,14,19,27]). While one-time observations provide important insight into current stand conditions, measurements over time are necessary to assess successional dynamics. We found that over a 22-year re-measurement period, the abundance of whitebark pine declined due to the effects of multiple disturbances by mountain pine beetle, blister rust, and recent fire, but did not find evidence of successional replacement by late-seral species. The highly variable effects of disturbance at our sites over only 22 years in a relatively discrete geographic range highlight the need for repeated measurements of stand conditions to increase understanding and to aid conservation and management of whitebark pine in the coming decades. To more fully understand successional dynamics, however, data are needed over even longer time periods.

4.1. Disturbance Frequency and Successional Dynamics

We found that 95% of whitebark stands were disturbed by fire, beetles, or blister rust over the 22-year study period, with the majority (84%) affected by either beetles or rust. These findings are consistent with other studies showing increased mortality in whitebark pine due to disturbance by mountain pine beetles and white pine blister rust [3,6,13,47]. Wildfire effects were also a significant driver of change at our sites, with nearly a quarter of the sites affected during just three fire seasons (2001, 2003, and 2006). Although past fire suppression has been raised as a concern in whitebark stands, our stands are located in areas with relatively long historical fire-return intervals [64] and, therefore, fire suppression may not have greatly affected fire regimes; however, recent hot and dry fire seasons and uncharacteristically intense and widespread fires [65] may pose a substantial threat to whitebark ecosystems.
During the study period, changes in overall tree composition were primarily driven by mortality of mature whitebark pine trees at xeric sites; however, wildfire had a large effect on the overall trends observed. When macroplots that burned in recent wildfires were removed from the analysis, there was no significant change in BA of mature whitebark pine. Because the effects of beetles were confounded with the effects of wildfire, it was not possible to discriminate between the two.
White pine blister rust also had a significant effect on tree community composition and BA of mature whitebark pine. Interestingly, macroplots with higher blister rust incidence during the most recent sampling period exhibited less change in overall community composition and less mortality of mature whitebark pine over the study period. One possible explanation for this is that the macroplots with low current blister rust incidence may have sustained high rates of blister rust infection in the past, leading to loss of mature whitebark pine prior to Cycle III and, therefore, had fewer potential host trees. Thus, current blister rust incidence could have been low at these macroplots because of genetic resistance of remaining whitebark in those stands. On the other hand, the macroplots with high incidence of blister rust at Cycle III may have been exposed to the fungus relatively recently, or infected whitebark may have not yet died. We did not, however, have accurate blister rust data from previous sample cycles and, therefore, could not attribute mortality of mature whitebark that occurred prior to Cycle III to this disease, since evidence of blister rust diminishes rapidly following tree death due to loss of bark and small branches.
While not possible for blister rust, we were able to attribute mortality from mountain pine beetle on trees killed in previous sample cycles. Across all macroplots, the majority of dead whitebark pine showed evidence of beetle attack, a trend also reported in recent studies in Montana, Idaho, Oregon, and Wyoming [12,66]. Change in overall tree community composition and change in BA of mature whitebark pine was related to disturbance by mountain pine beetle that occurred during the 22-year study period. This suggests that, as in the Greater Yellowstone Ecosystem [17], increased mountain pine beetle activity in the early-mid 2000s played a large role in losses of whitebark pine in the Cascade Mountains; however, as noted above, the effects of beetle attack on whitebark stands was confounded by the occurrence of fire at our sites. Furthermore, it may be that interactions between rust and mountain pine beetles had a synergistic effect on recent whitebark pine mortality at sites in this study [67]. Yet the potential role that rust infection may have played in increasing the susceptibility of whitebark pine to mountain pine beetle cannot be confirmed, due to lack of data on rust incidence in the original measurements from the 1990s and 2000s. The difficulty of interpreting the combined effects of beetles, rust, and wildfire on whitebark pine population and community change indicates the need for long-term measurements of stand dynamics on a larger number of sites.
To date, concerns about successional replacement of whitebark pine in sub-mesic communities have focused primarily on the effects of changing disturbance regimes on whitebark pine. However, changes in disturbance regimes and other factors are causing widespread mortality in many tree species [68,69,70]. Despite declines in whitebark pine, we did not find evidence of successional replacement by subalpine fir in sub-mesic communities where whitebark pine occurs in mixed-conifer stands, suggesting that this may not be a ubiquitous threat [13,31,71]. Neither subalpine fir nor Engelmann spruce showed significant changes in basal area, perhaps because stand development at these sites is too slow for detectable shifts in species abundance over a 22-year study period (but see Clason et al.’s [13] results from British Columbia). On average, subalpine fir did have higher total BA than whitebark pine for all size-classes at each of the three sample cycles, but change in the BA of whitebark pine and subalpine fir was insignificant over the 22-year study period when all 19 sites were included in the analysis. While statistically insignificant, the observed decline in whitebark pine basal area relative to that of subalpine fir could indicate a meaningful shift in ecological processes that will play out over longer time periods than could be captured over 22 years. Alternatively, even though whitebark occurred at lower BA than subalpine fir in this study and elsewhere (e.g., [12]), this pattern may not necessarily suggest accelerated successional replacement. Rather, it may indicate that whitebark can persist in stands dominated by subalpine fir or other species over long periods [37]. This persistence could be partially maintained by climate-change-mediated disturbance-induced mortality in other tree species [68,72] that would prevent the complete replacement of whitebark pine by competing species by reducing competition and maintaining the ecological niche of whitebark pine. In addition, since whitebark pine seedlings and saplings at high-elevation sites are more tolerant of harsh conditions, such as high wind, low growing season temperatures, and intense solar radiation, than are seedlings of subalpine fir [2,40,41], we expect whitebark to continue to dominate the xeric stands in the study area. However, we also expect the density of whitebark pine to decline overtime, given that we detected mortality agents in nearly all stands.
Forest succession is sometimes viewed as a deterministic process of gradual replacement of shade-intolerant species by shade-tolerant species with changing light environment [73,74]. This idea may be driving the concern that accelerated successional replacement of whitebark pine is occurring in stands where much of the overstory whitebark has died. Succession, however, can also be driven by stochastic mechanisms such as interactions of stand conditions with type, severity, and timing of disturbance [75]. For instance, selective mortality of mature whitebark pine after mountain pine beetle attack could promote whitebark pine regeneration in gaps left by dead trees [37,76] if another seed source is within the range of Clark’s nutcrackers that visit the stand. But if all size-classes of whitebark are decimated over a large area, the stand may convert to dominance by subalpine fir. In addition, changing climate will likely have unexpected effects on succession in sub-mesic whitebark pine ecosystems. In western North America, wide-scale mortality of subalpine fir and Engelmann spruce has been linked to recent warm temperatures and drought, a trend that is likely to continue under the effects of climate change [68,70]. Although we did not observe significant mortality in fir or spruce in our study stands, this phenomenon may limit successional replacement of whitebark pine by shade-tolerant firs in some areas. Thus, changing community dynamics in high-elevation ecosystems may add to the complexity of successional processes and result in unexpected ecological outcomes [77] that are likely to be highly variable across the range of whitebark pine. Our results illustrate the need to better understand long-term successional dynamics at multiple spatial and temporal scales.

4.2. Factors Influencing Whitebark Pine Regeneration

We did not find significant relationships between whitebark pine seedling density and either current BA of mature whitebark pine or BA of mature whitebark pine at the time of plot establishment. The lack of a relationship between seedling density and stand-level BA of whitebark pine in this study suggests that within-stand cone availability can be decoupled from stand-level regeneration as a result of its obligate mutualism with the Clark’s nutcracker [5]. Previous research on Clark’s nutcracker behavior supports this. For example, recent findings from a study in the eastern Cascade Mountains show that, even in years of low cone production, a single nutcracker can cache approximately 4800 whitebark pine seeds below-ground at sites that could potentially support whitebark pine, but only 3% of those seeds are cached within stands where they were originally harvested by nutcrackers. In addition, nutcrackers may carry seed up to 30 km from harvest location to cache site [29]; thus, stand-level cone production may be less important than seed availability at landscape or even regional scales [78]. In this study, the variable that showed the strongest correlation to seedling density was initial stand BA (BA of all tree species combined) at plot establishment, suggesting that regeneration may be as contingent on overall site productivity as it is on local cone production or dispersal activity.
Whitebark pine germination and survival is driven not only by seed availability and nutcracker behavior, but also by factors that influence seedling survival such as temperature, shade, and moisture availability [79,80]. In this study, whitebark seedlings showed preferential establishment in microsites near or beneath herbs and shrubs. Neighboring plants may facilitate whitebark pine establishment through above-ground mechanisms, such as by providing protection from sun, wind and frost [43,81,82]. Maher et al. [40] and Maher and Germino [41] found that whitebark seedlings growing near or beneath other vegetation or overstory trees that blocked exposure to the sky had higher photosynthetic rates and efficiency, as well as higher survival, likely due to amelioration of water stress and partial protection from the bright sunlight and nighttime frost that occurs in high-elevation forests. Cache-site selection is also important for seedling establishment. Although open sites are often considered necessary for caching by Clark’s nutcrackers [80], there is evidence that Clark’s nutcrackers may preferentially cache seed away from canopy openings and beneath vegetation or beneath overstory trees, perhaps to avoid predation or to lessen the likelihood that caches will be inaccessible beneath winter and spring snowpack [5,29]. It is unclear whether our observation of higher-than-expected numbers of seedlings in areas with neighboring vegetation was due to increased seedling survival from facilitation, or from increased nutcracker caching near herbs and shrubs. Both scenarios, however, are supported in the literature [5,29,41,45].
We hypothesized that there would be a positive relationship between whitebark pine seedling density and recent tree mortality due to increased light and nutrients, as was noted in Larson [30]. Although it is widely accepted that protection from the elements is important for whitebark seedlings, the potential for these protective benefits to come from growing in microsites near recently-dead trees has not been extensively studied (but see Leirfallom et al. [27]). Despite the expectation of a positive relationship, we did not find a seedling preference for microsites beneath dead trees. It may be that resource pulses following tree mortality affect seedling growth and recruitment into larger size-classes rather than improving survival. From our study, however, it appears that the benefits provided to seedlings by neighboring plants may outweigh the disadvantages of sharing resources with other organisms.

5. Conclusions

Range-wide, whitebark pine is facing novel conditions due to white pine blister rust, increased bark beetle presence, altered fire regimes, and climate change. These disturbance agents and their interacting effects will reduce the predictability of forest succession, especially given that, with climate change, patterns of disturbance from insects and disease on all tree species are likely to change [69] and wildfires are likely to grow larger and more intense [65]. Moreover, the wide variation in ecological conditions across the range of whitebark pine adds to the unpredictability of ecosystem responses to change and disturbance.
The high ecological diversity encountered across research sites in this study highlights the importance of developing management strategies that take into account range-wide and regional variability of whitebark pine ecosystems. When prioritizing sites for whitebark pine restoration, managers must consider the continuum of ecological conditions and relationships that affect stand development, including patterns of tree regeneration and mortality, as well as disease and insect activity at local to regional scales, and among all tree species. Furthermore, there is a growing body of evidence suggesting that the survivability of whitebark seedlings does not depend on recently burned sites, large canopy openings, or microsites free from competition by other tree or plant species. Thus, when implementing out-planting and restoration treatments, managers may want to consider experimenting with a variety of site preparation techniques and planting microsites, and to monitor outcomes over time to improve whitebark pine management over the long term [83].
High variability in stand conditions also suggests the need for large sample sizes in order to detect trends in species composition over time. Due to the relatively short field season common in high-elevation whitebark pine ecosystems and the amount of time required to access sites, it can prove logistically difficult to include a large number of sites in whitebark pine studies that require all sites to be measured in one field season. Thus, the relatively small sample size in this study limits our ability to generalize conclusions, even throughout the Cascade region. There may be additional, yet unexplored re-measurement opportunities that would allow for further investigation of the role of disturbance on range-wide succession; resampling these areas and plots should be a high priority for those interested in successional dynamics in whitebark pine.
Information on regeneration of whitebark pine seedlings is a high priority for restoration and conservation, especially given increasing investment in out-planting rust-resistant seedlings [80]. Until we know more about regeneration dynamics across the range of conditions faced by whitebark pine, it will be difficult to make accurate predictions of regeneration potential based on a single variable such as within-stand capacity for cone production. Furthermore, given highly variable survival rates associated with out-planting seedlings [35], additional research is needed on the most suitable conditions for seedling survival and the mechanisms behind survival of naturally regenerated seedlings. Our findings suggest that protected areas may be important for seedling establishment, and that forest openings may not provide the only ideal sites for outplanting whitebark seedlings. To date, much of the research on whitebark seedling relationships with microsites (including our study) has focused on regeneration density. Although this knowledge is of critical importance, there is a need for more information concerning appropriate conditions for seedling germination, long-term survival, and growth, to assist with selecting the most appropriate sites for whitebark pine restoration.

Author Contributions

J.T.A. and C.R.N. conceived and designed the study; J.T.A. and M.P.K. collected the data; J.T.A. and C.R.N. analyzed the data; J.T.A., C.R.N. and M.P.K. wrote the paper.

Funding

This research was supported by the US Forest Service Forest Health and Protection Program (Cooperative agreement # 11-DG-11010000-020).

Acknowledgments

We thank Dave Affleck, Robert Keane, Andrew Larson, and Anna Sala for assistance with study design and analysis; Rod Clausnitzer, Betsy Peterson, Therese Ohlson, Pete Ohlson, and the personnel of the Okanogan-Wenatchee National Forest for assistance with selection of study sites, acquisition of macroplot information and previously collected data, and field logistics; Abigail Marshall, Edie Dooley, Colin Maher, and Kevin Moore for assistance with data collection; and Colin Maher and three anonymous reviewers with helpful feedback on previous versions of the manuscript.

Conflicts of Interest

The authors declare no conflict of interest.

References

  1. Paine, R.T. A note on trophic complexity and community stability. Am. Nat. 1969, 103, 91–93. [Google Scholar] [CrossRef]
  2. Arno, S.F.; Hoff, R.J. Pinus albicaulis Englm. Whitebark Pine. In Silvics of North America. Vol. 1. Conifers; Burns, R.M., Honkala, B.H., Eds.; United States Department of Agriculture: Washington, DC, USA, 1990; pp. 530–554. [Google Scholar]
  3. Keane, R.E.; Tomback, D.F.; Aubry, C.A.; Bower, A.D.; Campbell, E.M.; Cripps, C.L.; Jenkins, M.B.; Mahalovich, M.F.; Manning, M.; McKinney, S.T.; et al. A Range-Wide Restoration Strategy for Whitebark Pine (Pinus albicaulis); US Department of Agriculture, Forest Service, Rocky Mountain Research Station: Fort Collins, CO, USA, 2012.
  4. Logan, J.A.; Powell, J.A. Ghost forests, global warming, and the mountain pine beetle (Coleoptera: Scolytidae). Am. Entomol. 2001, 47, 160–173. [Google Scholar] [CrossRef]
  5. Tomback, D.F. Dispersal of whitebark pine seeds by Clark’s nutcracker—A mutualism hypothesis. J. Anim. Ecol. 1982, 51, 451–467. [Google Scholar] [CrossRef]
  6. Schwandt, J.W. Whitebark Pine in Peril: A Case for Restoration; Gen. Tech. Rep. R1-06-28; USDA Forest Service: Missoula, MT, USA, 2006.
  7. Keane, R.E.; Parsons, R.A. Restoring whitebark pine forests of the northern Rocky Mountains, USA. Ecol. Rest. 2010, 28, 56–70. [Google Scholar] [CrossRef]
  8. Maloney, P.E. The multivariate underpinnings of recruitment for three Pinus species in montane forests of the Sierra Nevada, USA. Plant Ecol. 2014, 215, 261–274. [Google Scholar] [CrossRef]
  9. Perkins, J.L. Fire enhances whitebark pine seedling establishment, survival, and growth. Fire Ecol. 2015, 11. [Google Scholar] [CrossRef]
  10. Keane, R.E. Can the fire-dependent whitebark pine be saved? Fire Mgmt. Today 2001, 61, 17–20. [Google Scholar]
  11. McKinney, S.T.; Fiedler, C.E.; Tomback, D.F. Invasive pathogen threatens bird-pine mutualism: Implications for sustaining a high-elevation ecosystem. Ecol. Appl. 2009, 19, 597–607. [Google Scholar] [CrossRef]
  12. Kegley, S.; Schwandt, J.W.; Gibson, K.; Perkins, D. Health of Whitebark Pine Forests after Mountain Pine Beetle Outbreaks; FHP Report 11-03; USDA Forest Service, Northern Region Forest Health Protection: Fort Collins, CO, USA, 2010.
  13. Clason, A.J.; Macdonald, S.E.; Haeussler, S. Forest response to cumulative disturbance and stress: Two decades of change in whitebark pine ecosystems of west-central British Columbia. Ecoscience 2014, 21, 174–185. [Google Scholar] [CrossRef]
  14. Goeking, S.A.; Izlar, D.K. Pinus albicaulis Engelm. (whitebark pine) in mixed-species stands throughout its US Range: Broad-scale indicators of extent and recent decline. Forests 2018, 9, 131. [Google Scholar] [CrossRef]
  15. Brunelle, A.; Rehfeldt, G.E.; Bentz, B.; Munson, A.S. Holocene records of Dendroctonus bark beetles in high elevation pine forests of Idaho and Montana, USA. For. Ecol. Manag. 2008, 255, 836–846. [Google Scholar] [CrossRef]
  16. Negron, J.F.; Bentz, B.J.; Fettig, C.J.; Gillette, N.; Hansen, E.M.; Hayes, J.L.; Kelsey, R.G.; Lundquist, J.E.; Lynch, A.M.; Progar, R.A.; et al. US Forest Service bark beetle research in the western United States: Looking toward the future. J. For. 2008, 106, 325–331. [Google Scholar]
  17. Logan, J.A.; McFarlane, W.W.; Willcox, L. Whitebark pine vulnerability to climate-driven mountain pine beetle disturbance in the Greater Yellowstone Ecosystem. Ecol. Appl. 2010, 20, 895–902. [Google Scholar] [CrossRef] [PubMed] [Green Version]
  18. Jamieson, M.A.; Trowbridge, A.M.; Raffa, K.F.; Lindroth, R.L. Consequences of climate warming and altered precipitation patterns for plant-insect and multitrophic interactions. Plant Physiol. 2012, 160, 1719–1727. [Google Scholar] [CrossRef] [PubMed]
  19. Shanahan, E.; Irvine, K.M.; Thoma, D.; Wilmoth, S.; Ray, A.; Legg, K.; Shovic, H. Whitebark pine mortality related to white pine blister rust, mountain pine beetle outbreak, and water availability. Ecosphere 2016, 7, e01610. [Google Scholar] [CrossRef]
  20. Amman, G.D. Mountain pine beetle brood production in relation to thickness of lodgepole pine phloem. J. Econ. Entomol. 1972, 65, 138–140. [Google Scholar] [CrossRef]
  21. Bartos, D.L.; Gibson, K.E. Insects of whitebark pine with emphasis on mountain pine beetle. In Proceedings of the Symposium on Whitebark Pine Ecosystems: Ecology and Management of a High-Mountain Resource, Bozeman, MT, USA, 29−30 March 1989; Schmidt, W.C., McDonald, K.J., Eds.; U.S. Department of Agriculture, Forest Service, Intermountain Research Station: Ogden, UT, USA, 1990; pp. 171–178. [Google Scholar]
  22. Perkins, D.L.; Roberts, D.W. Predictive models of whitebark pine mortality from mountain pine beetle. For. Ecol. Manag. 2003, 174, 495–510. [Google Scholar] [CrossRef]
  23. Keane, R.E.; Arno, S.F. Rapid decline of whitebark pine in western Montana: Evidence from 20-year re-measurements. West. J. Appl. For. 1993, 8, 44–47. [Google Scholar]
  24. Tomback, D.F.; Resler, L.M. Invasive pathogens at alpine treeline: Consequences for treeline dynamics. Phys. Geogr. 2007, 28, 397–418. [Google Scholar] [CrossRef]
  25. Tomback, D.F.; Sund, S.K.; Hoffmann, L.A. Post-fire regeneration of Pinus albicaulis: Height-age relationships, age structure, and microsite characteristics. Can. J. For. Res. 1993, 23, 113–119. [Google Scholar] [CrossRef]
  26. Tomback, D.F.; Achuff, P. Blister rust and western forest biodiversity: Ecology, values and outlook for white pines. For. Pathol. 2010, 40, 186–225. [Google Scholar] [CrossRef]
  27. Leirfallom, S.B.; Keane, R.E.; Tomback, D.F.; Dobrowski, S.Z. The effects of seed source health on whitebark pine (Pinus albicaulis) regeneration density after fire. Can. J. For. Res. 2015, 45, 1597–1606. [Google Scholar] [CrossRef]
  28. Hutchins, H.E.; Lanner, R.M. The central role of Clark’s nutcracker in the dispersal and establishment of whitebark pine. Oecologia 1982, 55, 192–201. [Google Scholar] [CrossRef] [PubMed]
  29. Lorenz, T.J.; Sullivan, K.A.; Bakian, A.V.; Aubry, C.A. Cache-site selection in Clark’s nutcracker. Auk 2011, 128, 237–247. [Google Scholar] [CrossRef]
  30. Larson, E.R. Status and Dynamics of Whitebark Pine (Pinus albicaulis Engelm.) Forests in Southwest Montana, Central Idaho, and Oregon, USA. Ph.D. Thesis, University of Minnesota, Minneapolis, MN, USA, 2009. [Google Scholar]
  31. Larson, E.R.; Kipfmueller, K.F. Patterns in whitebark pine regeneration and their relationships to biophysical site characteristics in southwest Montana, central Idaho, and Oregon, USA. Can. J. For. Res. 2010, 40, 476–487. [Google Scholar] [CrossRef]
  32. Meyer, M.D.; Bulaon, B.; MacKenzie, M.; Safford, H.D. Mortality, structure, and regeneration in whitebark pine stands impacted by mountain pine beetle in southern Sierra Nevada. Can. J. For. Res. 2016, 46, 572–581. [Google Scholar] [CrossRef]
  33. Keane, R.E.; Gray, K.L.; Dickinson, L.J. Whitebark Pine Diameter Growth Response to Removal of Competition; Research Note RMRS-RN-32; US Department of Agriculture, Forest Service, Rocky Mountain Research Station: Fort Collins, CO, USA, 2007.
  34. Baker, F.S. Principles of Silviculture; McGraw-Hill Book Co., Inc.: New York, NY, USA, 1950. [Google Scholar]
  35. McCaughey, W.W.; Scott, G.L.; Izlar, K.L. Whitebark pine planting guidelines. West. J. Appl. For. 2009, 24, 163–166. [Google Scholar]
  36. Perkins, J.L. Pinus albicaulis Seedling Regeneration after Fire. Ph.D. Thesis, University of Montana, Missoula, MU, USA, 2004. [Google Scholar]
  37. Campbell, E.M.; Antos, J.A. Postfire succession in Pinus albicaulisAbies lasiocarpa forests of southern British Columbia. Can. J. Bot. 2003, 81, 383–397. [Google Scholar] [CrossRef]
  38. Izlar, D.K. Assessment of Whitebark Pine Seedling Survival for Rocky Mountain Planting. Ph.D. Thesis, University of Montana, Missoula, MT, USA, 2007. [Google Scholar]
  39. Lonergan, E.R.; Cripps, C.L.; Smith, C.M. Influence of site conditions, shelter objects, and ectomycorrhizal inoculation on the early survival of whitebark pine seedlings planted in Waterton Lakes National Park. For. Sci. 2014, 60, 603–612. [Google Scholar] [CrossRef]
  40. Maher, E.L.; Germino, M.J.; Hasselquist, N.J. Interactive effects of tree and herb cover on survivorship, physiology, and microclimate of conifer seedlings at the alpine tree-line ecotone. Can. J. For. Res. 2005, 35, 567–574. [Google Scholar] [CrossRef]
  41. Maher, E.L.; Germino, M.J. Microsite differentiation among conifer species during seedling establishment at alpine treeline. Ecoscience 2006, 13, 334–341. [Google Scholar] [CrossRef] [Green Version]
  42. Gelderman, M.S.; Macdonald, S.E.; Gould, A.J. Regeneration niche of whitebark pine in the Canadian Rocky Mountains: The basis to restoring an endangered species. Arct. Antarct. Alp. Res. 2016, 48, 279–292. [Google Scholar] [CrossRef]
  43. Pyatt, J.C.; Tomback, D.F.; Blakeslee, S.C.; Wunder, M.B.; Resler, L.M.; Boggs, L.A.; Bevency, H.D. The importance of conifers for facilitation at treeline: Comparing biophysical characteristics of leeward microsites in whitebark pine communities. Arct. Antarct. Alp. Res. 2016, 48, 427–444. [Google Scholar] [CrossRef]
  44. Pansing, E.R.; Tomback, D.F.; Wunder, M.B.; French, J.P.; Wagner, A.C. Microsite and elevation zone effects on seed pilferage, germination, and seedling survival during early whitebark pine recruitment. Ecol. Evol. 2017, 7, 9027–9040. [Google Scholar] [CrossRef] [PubMed] [Green Version]
  45. Callaway, R.M. Competition and facilitation on elevational gradients in subalpine forests of the northern Rocky Mountains, USA. Oikos 1998, 82, 561–573. [Google Scholar] [CrossRef]
  46. Kipfmueller, K.F.; Kupfer, J.A. Complexity of successional pathways in subalpine forests of the Selway-Bitterroot Wilderness Area. Ann. Assoc. Am. Geogr. 2005, 95, 495–510. [Google Scholar] [CrossRef]
  47. Wong, C.M.; Daniels, L.D. Novel forest decline triggered by multiple interactions among climate, an introduced pathogen and bark beetles. Glob. Chang. Biol. 2017, 23, 1926–1941. [Google Scholar] [CrossRef] [PubMed]
  48. Loehman, R.A.; Keane, R.E.; Holsinger, L.M.; Wu, Z. Interactions of landscape disturbances and climate change dictate ecological pattern and process: Spatial modeling of wildfire, insect, and disease dynamics under future climates. Landsc. Ecol. 2017, 32, 1447–1459. [Google Scholar] [CrossRef]
  49. Lillybridge, T.R.; Kovalchik, B.L.; Williams, C.K.; Smith, B.G. Field Guide for Forested Plant Associations of the Wenatchee National Forest; Gen. Tech. Rep. PNW-GTR-359; U.S. Department of Agriculture, Forest Service: Portland, OR, USA, 1995.
  50. Johnson, M.D. Field Procedures for the Current Vegetation Survey; Natural Resource Inventory, US Department of Agriculture, Forest Service, Pacific Northwest Research Station: Portland, OR, USA, 2003.
  51. Safranyik, L.; Shrimpton, D.M.; Whitney, H.S. Management of Lodgepole Pine to Reduce Losses from the Mountain Pine Beetle; Tech. Rep.; Forestry Service, Environment Canada: Laurentian Hills, ON, Canada, 1974.
  52. Hoff, R.J. How to Recognize Blister Rust Infection on Whitebark Pine; No. INT-406; US Department of Agriculture, Forest Service, Intermountain Research Station: Ogden, UT, USA, 1992.
  53. Cole, W.E.; Amman, G.D. Mountain Pine Beetle Infestations in Relation to Lodgepole Pine Diameters; US Dept. of Agriculture, Forest Service, Intermountain Forest & Range Experiment Station: Ogden, UT, USA, 1969.
  54. Joliffe, I.T. Principal Component Analysis; Springer: New York, NY, USA, 2002. [Google Scholar]
  55. Biondini, M.E.; Mielke, P.W.; Berry, K.J. Data-dependent permutation techniques for the analysis of ecological data. Vegetatio 1988, 75, 161–168. [Google Scholar]
  56. Mielke, P.W. The application of multivariate permutation methods based on distance functions in the earth sciences. Earth Sci. Rev. 1991, 31, 55–71. [Google Scholar] [CrossRef]
  57. Faith, D.P.; Minchin, P.R.; Belbin, L. Compositional dissimilarity as a robust measure of ecological distance. Vegetatio 1987, 69, 57–68. [Google Scholar] [CrossRef]
  58. Demsar, J. Statistical comparisons of classifiers over multiple data sets. J. Mach. Learn. Res. 2006, 7, 1–30. [Google Scholar]
  59. Wilcoxon, F. Individual comparisons by ranking methods. Biometr. Bull. 1945, 1, 80–83. [Google Scholar] [CrossRef]
  60. Kendall, M. A new measure of rank correlation. Biometrika 1938, 30, 81–89. [Google Scholar] [CrossRef]
  61. Ott, L.R.; Longnecker, M. An Introduction to Statistical Methods and Data Analysis; Brooks/Cole: Pacific Grove, CA, USA, 2010. [Google Scholar]
  62. PC-ORD. Multivariate Analysis of Ecological Data, version 5 for windows edition; MjM Software Design: Gleneden Beach, OR, USA, 2005. [Google Scholar]
  63. R Core Team. R: A Language and Environment for Statistical Computing; R Foundation for Statistical Computing: Vienna, Austria, 2017; Available online: http://www.R-project.org/ (accessed on 13 June 2018).
  64. Larson, E.R.; van De Gevel, S.L.; Grissino-Mayer, H.D. Variability in Fire Regimes of High-Elevation Whitebark Pine Communities, Western Montana, USA. Ecoscience 2009, 16, 282–298. [Google Scholar] [CrossRef]
  65. Westerling, A.L.; Hidalgo, H.G.; Cayan, D.R.; Swetnam, T.W. Warming and earlier spring increase western U.S. forest wildfire activity. Science 2006, 313, 940–943. [Google Scholar] [CrossRef] [PubMed]
  66. Larson, E.R. Influences of the biophysical environment on blister rust and mountain pine beetle, and their interactions, in whitebark pine forests. J. Biogeogr. 2011, 38, 453–470. [Google Scholar] [CrossRef]
  67. Six, D.; Adams, J. White pine blister rust severity and selection of individual whitebark pine by the mountain pine beetle (Coleoptera: Curculionidae, Scolytinae). J. Entomol. Sci. 2006, 42, 345–353. [Google Scholar] [CrossRef]
  68. Van Mantgem, P.J.; Stephenson, N.L.; Byrne, J.C.; Daniels, L.D.; Franklin, J.F.; Fule, P.Z.; Harmon, M.E.; Larson, A.J.; Smith, J.M.; Taylor, A.H.; et al. Widespread increase of tree mortality rates in the western United States. Science 2009, 323, 521–524. [Google Scholar] [CrossRef] [PubMed]
  69. Breshears, D.D.; Cobb, N.S.; Rich, P.M.; Kevin, P.P.; Allen, C.D.; Balice, R.G.; Romme, W.H.; Kastens, J.H.; Floyd, L.; Belnap, J.; et al. Regional vegetation die-off in response to global-change-type drought. Proc. Nat. Acad. Sci. USA 2005, 102, 15144–15148. [Google Scholar] [CrossRef] [PubMed] [Green Version]
  70. Bigler, C.; Gavin, D.G.; Gunning, C.; Veblen, T.T. Drought induces lagged tree mortality in a subalpine forest in the Rocky Mountains. Oikos 2007, 116, 1983–1994. [Google Scholar] [CrossRef]
  71. Larson, E.R.; Kipfmueller, K.F. Ecological disaster or the limits of observation? Reconciling modern declines with the long-term dynamics of whitebark pine communities. Geogr. Compass 2012, 40, 476–487. [Google Scholar] [CrossRef]
  72. Frelich, L.E.; Reich, P.B. Neighborhood effects, disturbance, and succession in forests of the western Great Lakes Region. Ecoscience 1995, 2, 148–158. [Google Scholar] [CrossRef]
  73. Bergeron, Y. Species and stand dynamics in the mixed woods of Quebec’s southern boreal forest. Ecology 2000, 81, 1500–1516. [Google Scholar] [CrossRef]
  74. Arevalo, J.R.; DeCoster, J.K.; McAlister, S.D.; Palmer, M.W. Changes in two Minnesota forests during 14 years following catastrophic windthrow. J. Veg. Sci. 2000, 11, 833–840. [Google Scholar] [CrossRef]
  75. Harcombe, P.A.; Bill, C.J.; Fulton, M.; Glitzenstein, J.S.; Marks, P.L.; Elsik, I.S. Stand dynamics over 18 years in a southern mixed hardwood forest, Texas, USA. J. Ecol. 2002, 90, 947–957. [Google Scholar] [CrossRef] [Green Version]
  76. Meyers, R.K.; van Lear, D.H. Hurricane-fire interactions in coastal forests of the south: A review and hypothesis. For. Ecol. Manag. 1998, 103, 265–276. [Google Scholar] [CrossRef]
  77. Paine, R.T.; Tegner, M.J.; Johnson, E.A. Compounded perturbations yield ecological surprises. Ecosystems 1998, 1, 535–545. [Google Scholar] [CrossRef]
  78. Barringer, L.E.; Tomback, D.F.; Wunder, M.B.; McKinney, S.T. 2012. Whitebark pine stand condition, tree abundance, and cone production as predictors of visitation by Clark’s nutcracker. PLoS ONE 2012, 7, e37663. [Google Scholar] [CrossRef] [PubMed]
  79. McCaughey, W.W.; Weaver, T. Biotic and Microsite Factors Affecting Whitebark Pine Establishment. In Proceedings of the Symposium on Whitebark Pine Ecosystems: Ecology and Management of a High-Mountain Resource, Bozeman, MT, USA, 29–30 March 1989; Schmidt, W.C., McDonald, K.J., Eds.; U.S. Department of Agriculture, Forest Service, Intermountain Research Station: Ogden, UT, USA, 1990; pp. 140–150. [Google Scholar]
  80. Tomback, D.F.; Anderies, A.J.; Carsey, K.S.; Powell, M.L.; Mellman-Brown, S. Delayed seed germination in whitebark pine and regeneration patterns following the Yellowstone fires. Ecology 2001, 82, 2587–2600. [Google Scholar] [CrossRef]
  81. Hadley, J.L.; Smith, W.K. Wind effects on needles of timberline conifers: Seasonal influence on mortality. Ecology 1986, 67, 12–19. [Google Scholar] [CrossRef]
  82. Germino, M.J.; Smith, W.K. Sky exposure, crown architecture, and low-temperature photoinhibition in conifer seedlings at alpine treeline. Plant Cell Environ. 1999, 22, 407–415. [Google Scholar] [CrossRef] [Green Version]
  83. Maher, C.T.; Nelson, C.R.; Larson, A.J.; Sala, A. Ecological effects and effectiveness of silvicultural restoration treatments in whitebark pine. For. Ecol. Manag. 2018, 429, 534–548. [Google Scholar] [CrossRef]
Figure 1. Location of the 19 study macroplots along the eastern crest of the Cascade Range, Washington, USA. Triangles = macroplots located in xeric whitebark pine (Pinus albicaulis Engelm.) stands; circles = macroplots located in sub-mesic whitebark pine stands. Map inset shows extent of enlarged area.
Forests 09 00566 g001
Figure 2. Design of Continuous Vegetation Survey (CVS) sample units. Each 1-ha macroplot contained five 15.6-m radius subplots. Each of the five subplots contained two smaller (7.3-m radius and 3.6-m radius) concentric microplots. Subplot 1 was located in the center of the macroplot. The centroids for subplots 2–5 were located 40.8 m at cardinal directions from the center of the macroplot. We used the 15.6-m radius subplots to measure mature trees (≥20-cm DBH), the 7.3-m radius microplots to measure poles (≥7.62-cm DBH, but <20-cm DBH) and the 3.6-m radius microplots to measure saplings (<7.62-cm DBH, but ≥2.54-cm DBH) and seedlings (≥15-cm tall, but <2.54-cm DBH, measured as the length of the main stem).
Forests 09 00566 g002
Figure 3. Ordination (PCA) of tree community composition based on relativized BA (m2 ha−1) of each size class (mature, pole, sapling, large seedling) of common tree species at each sample cycle. Data are mean axis scores for each stand type (xeric = triangles and sub-mesic = circles) at each sampling period (1990s = open shading, 2000s = grey shading and 2012 = black shading). Arrows represent change in community composition over time.
Forests 09 00566 g003
Figure 4. Relationship between percent dissimilarity (PD) over time (Cycle I to III) of overstory tree composition and mean BA of (a) whitebark pine (Pinus albicaulis Engelm.) with evidence of blister rust (Cronartium ribicola Fischer) infection at Cycle III (“Recent WPBR-I”), (b) standing dead whitebark pine killed by mountain pine beetle (Dendroctonus ponderosae Hopkins) before and during the 22-year study period (“Total MPB-I”), and (c) whitebark pine killed by mountain pine beetle between Cycles I and III (“Recent MPB-I”).
Forests 09 00566 g004
Figure 5. Mean change (±1 SE) in BA of mature (≥20-cm DBH), pole (<20-cm DBH but ≥7.62-cm DBH), and sapling (<7.62-cm DBH but ≥2.54-cm DBH) trees and mean change (±1 SE) in density of seedlings (≥15-cm tall but <2.54-cm DBH) between Sample Cycles I and III for the three most common species (PIAL = whitebark pine [Pinus albicaulis Engelm.]), ABLA = subalpine fir [Abies lasiocarpa (Hooker) Nuttall], and PIEN = Engelmann spruce [Picea engelmannii Parry ex Engelm.]). Panel a = sub-mesic stands (n = 7); Panel b = xeric stands (n = 12).
Forests 09 00566 g005
Figure 6. Relationships between percent change in absolute BA of mature whitebark pine (Pinus albicaulis Engelm.) between Cycles I and III (“Mature PIAL change in BA”) and mean BA of (a) recent whitebark pine infected by blister rust (Cronartium ribicola Fischer) at Cycle III (“Recent WPBR-I”), (b) initial beetle-killed whitebark pine at Cycle I (“Initial MPB-I”), and (c) whitebark pine killed by beetles since plot establishment (“Recent MPB-I”).
Forests 09 00566 g006
Figure 7. Relationships between mean density of whitebark pine (PIAL; Pinus albicaulis Engelm.) seedlings <30-cm tall (PIAL seedling size-classes “1” and “2” pooled) and (a) total mean BA of all trees ≥7.62-cm DBH (“Initial Tree BA”) at macroplot establishment in the 1990s, (b) initial BA of mature whitebark pine ≥20-cm DBH (“Initial PIAL BA”), and (c) recent mean BA of mature whitebark pine (“Recent PIAL BA”).
Forests 09 00566 g007
Table 1. Location and stand characteristics for each of the 19 macroplots, including elevation (“Elev.”), northing and easting, mean BA of all trees ≥7.62-cm DBH at Cycle I (“Initial Basal area”), initial mean BA of all live whitebark pine (Pinus albicaulis Engelm) trees ≥7.62-cm DBH at Cycle I (“Initial PIAL Basal area”), the initial mean BA of standing dead whitebark pine trees killed by mountain pine beetle (Dendroctonus ponderosae Hopkins) at Cycle I (“Initial PIAL MPB Basal area”), initial mean BA of all live subalpine fir (Abies lasiocarpa (Hooker) Nuttall) trees ≥7.62-cm DBH at Cycle I (“Initial ABLA Basal area”), fire activity during the study period (year of fire or blank if no fire activity since Cycle I), and plant associations [49]. Macroplots are numbered from south to north. Macroplot locations are approximate and are projected in North American Datum 1983. Macroplots # 11, 14, 15, and 16 are located in UTM zone 11; all other macroplots are in UTM zone 10. “Xeric” study sites are located in Pinus albicaulis (“PIAL”) plant associations; “sub-mesic” study sites are located in other plant association types.
Macro-PlotElev. (m)Northing, Easting (m)Initial Basal Area (m2 ha−1)Initial PIAL Basal Area (m2 ha−1)Initial PIAL MPB Basal Area (m2 ha−1)Initial ABLA Basal Area (m2 ha−1)Recent Fire History (Year. of Wildfire If Present)Plant Association (s)
117985,209,096,
650,589
7.027.020.000.00PIAL/CARU
217075,252,903,
661,536
11.634.240.004.20PSME/AGSP
317375,255,604,
650,579
4.004.000.660.00PIAL/JUCO6
418295,269,249,
664,247
23.443.635.776.32ABLA2/RHAL/LUHI
518595,304,797,
688,821
20.335.436.007.11TSME/RHAL-VAME, ABLA2/RHAL/LUHI
619815,313,060,
691,632
22.232.4519.3411.74ABLA2/VASC/LUHI, ABLA2/RHAL/LUHI
717375,315,809,
661,506
12.216.810.003.61ABLA2/VAME
819515,318,556,
672,456
19.027.462.8210.80PIAL/VASC/LUHI
921035,332,217,
694,367
15.4514.691.620.76PIAL/FEVI
1020735,337,692,
694,369
5.245.240.000.002001PIAL/FEVI
1119205,375,519,
286,651
31.408.590.0010.652006ABLA2/VASC
1217985,381,529,
672,472
6.594.600.651.26PIAL/JUCO6
1318295,384,225,
672,345
21.0314.300.004.56PIAL/CARU
1420735,389,192,
285,021
20.4216.530.000.002006PIAL/VASC/LUHI
1520735,394,648,
285,457
52.3926.710.852.872003PIAL/VASC/LUHI
1622565,394,851,
282,732
17.769.650.000.002006PIAL/VASC/LUHI, PIAL/CARU
1717685,400,583,
705,281
23.588.230.000.00PIAL/CARU
1817075,403,326,
702,607
38.312.518.6124.19ABLA2/VAME
1921345,408,845,
697,110
21.0514.580.006.11PIAL/VASC/LUHI
Species codes are: ABLA2—Abies lasiocarpa; AGSP (now PSSP)—Pseudoroegneria spicata; CARU—Calamagrostis rubescens; FEVI—Festuca viridula; JUCO6—Juniperus communis; LUHI—Luzula hitchcockii; PIAL—Pinus albicaulis; PSME—Pseudotsuga menziesii; RHAL—Rhododendron albiflorum; TSME—Tsuga mertensiana; VAME—Vaccinium membranaceum; VASC—Vaccinium scoparium.
Table 2. Mean basal area (m2 ha−1) of the three most common tree species (PIAL = Pinus albicaulis Engelm., ABLA = Abies lasiocarpa (Hooker) Nuttall, and PIEN = Picea engelmannii Parry ex Engelm.) by size class and sample cycle for all sites (n = 19).
Sample CycleMaturePIAL PoleSaplingMatureABLA PoleSaplingMaturePIEN PoleSapling
19906.452.140.182.891.860.212.460.330.02
20004.741.550.182.831.870.231.280.160.01
20122.870.810.122.861.750.180.840.070.01
Table 3. Mean proportion of microplots covered by each target microsite characteristic, mean proportion of all whitebark pine (Pinus albicaulis Engelm.) seedlings (<15-cm; seedling size-class “1”) growing in areas with a target microsite characteristic, and p-values for paired t-tests of differences between proportion of microplots covered by and proportion of seedlings growing in areas covered by a target microsite characteristic (significant values in bold font). “PIAL-MPB Canopy” refers to the area beneath the canopy drip-line of beetle-killed whitebark pine.
Microsite Characteristic Proportion of Microplot Area with Microsite CharacteristicProportion of PIAL Seedlings in Areas with Microsite Characteristicp-Value
Herb/Shrub0.3920.5630.033
Rock0.0310.2210.062
Log0.0410.2070.074
Stump0.0010.0000.163
Live Tree Canopy0.2720.3270.465
PIAL-MPB Canopy0.0990.0850.700

