Article

Fine Root Dynamics in Three Forest Types with Different Origins in a Subalpine Region of the Eastern Qinghai-Tibetan Plateau

1
Key Laboratory on Forest Ecology and Environmental Sciences of State Forestry Administration, Institute of Forest Ecology, Environment and Protection, Chinese Academy of Forestry, Beijing 100091, China
2
Co-Innovation Center for Sustainable Forestry in Southern China, Nanjing Forestry University, Nanjing 210037, China
3
Tree and Timber Institute, National Research Council of Italy, Via Madonna del Piano 10, 50019 Sesto Fiorentino (FI), Italy
4
Aba Prefecture Institute of Forestry Science and Technology, Wenchuan 623000, China
*
Author to whom correspondence should be addressed.
Forests 2018, 9(9), 517; https://doi.org/10.3390/f9090517
Submission received: 22 June 2018 / Revised: 23 August 2018 / Accepted: 25 August 2018 / Published: 27 August 2018
(This article belongs to the Special Issue Forest Fine Roots in Changing Climate)

Abstract

:
Fine roots play a crucial role in plant survival potential and biogeochemical cycles of forest ecosystems. Subalpine areas of the Eastern Qinghai-Tibetan Plateau have experienced different forest re-establishment methods after clear-cutting primary forest. However, little is known about fine root dynamics of these forests originating from artificial, natural and their combined processes. Here, we determined fine root traits (biomass, production and turnover rate) of three subalpine forest types, i.e., Picea asperata Mast. plantation forest (artificial planting, PF), natural secondary forest (natural without assisted regeneration, NF) and P. asperata broadleaved mixed forest (natural regeneration after artificial planting, MF) composed of planted P. asperata and naturally regenerated native broadleaved species. At the soil depth of 0–30 cm, fine root biomass was the highest in PF and fine root production was the highest in NF, and both were the lowest in MF. Fine root dynamics of the three forest types tended to decrease with soil depth, with larger variations in PF. Fine root biomass and production were the highest in PF in 0–10 cm soil layer but were not significantly different among forest types in the lower soil layers. There were positive correlations between these parameters and aboveground biomass across forest types in soil layer of 0–10 cm, but not in the lower soil layers. Fine root turnover rate was generally higher in mixed forests than in monocultures at all soil depths. In conclusion, the natural regeneration procedure after clear-cutting in the subalpine region of western Sichuan seems to be superior from the perspective of fine root dynamics.

1. Introduction

The root systems of trees are essential for forest ecosystem functioning, attributed to their pivotal roles in plant-soil nutrient and organic matter exchange, as well as maintaining plant growth, soil fertility [1] and tree stability [2]. Fine roots (diameter ≤ 2 mm) are the most active segments of root system for acquiring water and nutrients [3], and responding rapidly to variations in the rooting environment [4,5,6,7]. They play a crucial role in plant survival potential and seedlings establishment after outplanting [8], and are regarded as a good indicator of adaptation strategies to climate change [9,10,11]. Although fine roots only comprise a small proportion of total root biomass, their production accounts to 33%–67% of annual net primary production in forest ecosystems [12], and they make a considerable contribution to annual carbon (C) fluxes due to their short lifespan and high decomposability [13,14,15]. Hence, fine root dynamics, such as fine root production and turnover, are key processes that drive biogeochemical nutrient cycling and stand productivity [16,17]. Consequently, the fine root related indices are used to analyze terrestrial ecosystem C sequestration. For instance, fine root turnover rates have been employed in a series of biogeochemical models [18,19]. Therefore, the accurate estimation of fine root production and turnover is essential to understanding belowground processes and improving the prediction accuracy of C budget models [20]. However, the underlying mechanisms controlling fine root dynamics remain limited [16,21].
Forest management (e.g., deforestation and reforestation, etc.) exerts a continuous influence on a wide range of ecosystem characteristics such as fine root dynamics and nutrient cycling [22,23,24], and thus impacts ecosystem sustainability [1]. Deforestation reduces both the quantity of aboveground biomass and belowground biomass [22,25], while forest restoration gradually increases the quantity of biomass through promoting stand development. Different forest restoration approaches, especially natural and artificial restoration, respectively, result in mixed forests and monocultures, forming diverse forest types with different species and structure, which then affect soil environment as well as fine root production and turnover [26,27,28].
Belowground interaction among co-occurring species is vital for community structure and functioning [29]. The coexisting species tend to proliferate more roots into substrate, which likely lead to a higher fine root production or biomass in mixed forests than in monocultures [30]. Previous studies have shown that mixed forests have higher fine root productivity than monocultures [31,32], due to the complementarity effect (facilitation or niche differentiation) and the selection effect [30,31]. The complementarity effect predicts that tree species may differ in root vertical distribution patterns, root system architectures, root growth phenology and resource–absorption efficiencies [33,34], which results in a more complete exploitation of the soil volume and belowground resources in mixed forests [26,31]. Facilitation means that one species can benefit another species by improving its growing conditions [35], reducing pathogenic pressures [36] and sharing mycorrhizae [37]. However, published results about fine root production and biomass between mixed forests and monocultures [32,38] are still inconclusive.
Generally, higher production of fine roots may lead to greater scarcity of nutrients and soil volume, and increase root competition, which eventually increase fine root turnover rate [39]. The finding that mixed forests have a higher fine root turnover rate than monocultures has been reported [34,40,41]. However, it is undeniable that some species may increase root persistence in root competition for limiting soil resources to better adapt to the environment and survive [42].
Moreover, fine root dynamics is possibly associated with aboveground stand properties such as basal area, tree density and canopy cover [25,43]. However, correlations are mostly analyzed at the individual tree level [44,45]. Some studies have suggested that an increase in the quantity of fine root biomass may improve the quantity of aboveground biomass, reflecting a coupling between absorption and productivity [46,47], while the relationships between fine root dynamics and stand aboveground biomass are inconsistent at the stand level, and are likely dependent on species and sites [17].
The Eastern Qinghai-Tibetan Plateau plays an important role in climate change and ecological security [48]. Subalpine forests in the Eastern Qinghai-Tibetan Plateau, Western Sichuan are largely distributed in the valleys in the upper reaches of the Yangtze River and constitute an ecological barrier [49]. The primary forests in the region were largely cut down, and subsequently restored by artificial planting, natural regeneration and combination of these [50]. As a result, multi-forest types differing in species composition and structure have been formed by different re-establishment methods [51]. Forest types with different stand origins have been revealed to alter soil microbial activity [52]. However, the influence of stand origin on fine root dynamics remains poorly understood [1].
In this study, we aimed to evaluate the fine root dynamics in three forest types originating from different restoration pathways and fine out how stand origins (natural, artificial/planted and mixed) influence fine root dynamics. We measured the quantity of fine root biomass and necromass of 0–30 cm and aboveground biomass, and estimated the fine root production and turnover rate in two types of mixed forest originating either from natural regeneration (NF, natural forest) or combination of artificial planting and natural regeneration (MF, mixed forest), and in monoculture Picea asperata plantation (PF, planted forest) in the Eastern Qinghai-Tibetan Plateau. We tested the following hypotheses: (1) fine root dynamics (biomass, production and turnover) are higher and more even in vertical distribution in mixed forests originating from natural regeneration and the combination of artificial planting and natural regeneration than in monoculture forest originating from artificial planting; and (2) there is a positive relationship between aboveground biomass and fine root dynamics.

2. Materials and Methods

2.1. Study Site

The study was conducted at Bipenggou Nature Reserve (102°53′–102°57′ E, 31°14′–31°19′ N) in Lixian, west of Sichuan Province, China, which is a transitional area between the Qinghai-Tibet Plateau and the Sichuan Basin. It has an altitude ranging from 2458 to 4691 m above sea level. This area has a typical Qinghai-Tibet Plateau climate with cool and humid summers and cold winters [50]. The mean annual temperature is 2.7 °C with a maximum monthly mean temperature of 23 °C in July and a minimum monthly mean temperature of −18 °C in January. The annual precipitation is about 850 mm. The forest soils in the experimental fields are classified as Cambisols and Regosols according to FAO (Food and Agriculture Organization of the United Nations) Soil Taxonomy [53]. The growing season is generally from May to October, and the freeze–thaw season generally starts in early December, followed by snow cover in the winter [54].
The primary subalpine forests predominantly contained firs (Abies faxoniana Rehd. et Wils) which were harvested from the 1940s until 1998 when the Natural Forest Protection Program started in the region [49,50]. The deforested lands were subsequently planted with spruce (Picea asperata Mast.) saplings after site preparation [49]. Spruce plantations had been established in some places of the harvested areas with sparse understory vegetation, and eventually formed monoculture forest (P. asperata plantation forest, PF) [55]. Nevertheless, some of the sites failed to form monoculture spruce forests owing to the lack of human disturbance and were invaded by other species, such as Betula albo-sinensis Burk., Cerasus duclouxii (Koehne) Yu et Li, Sorbus koehneana Schneid. The cover proportions of each species were about 34%, 15% and 5%, respectively. Eventually, the forests developed into mixed forests with natural regeneration of broadleaved species and planted spruce (P. asperata broadleaved mixed forest, MF). Meanwhile, natural restoration was also carried out in areas without cultivation. Thus, natural secondary forests (NF), P. asperata plantation forests (PF), and mixed forests with natural broadleaved species and spruce plantations (P. asperata broadleaved mixed forests, MF) now present on the harvested sites in the subalpine area. The main understory species were Carex tristachya Thunb, Cystopteris montana (Lam.) Bernh ex Desv, Polygonum viviparum Linn and Trisetum sibiricum Rupr, etc. The coverage of herbs was about 60% in P. asperata broadleaved mixed forest and natural secondary forest, and 25% in P. asperata plantation forest.

2.2. Sampling Design

Three types of forest were sampled to reflect the different origins of the main forest types in the region: P. asperata broadleaved mixed forest (MF), natural secondary forest (NF) and P. asperata plantation forest (PF) which formed by natural restoration after planting P. asperata, natural regeneration and artificial planting, respectively. The stands of similar ages were selected based on harvest time and species that were most prevalent in each forest type. Three replicates from each forest type, with plot sizes of 20 m × 20 m, in discontinuous stands, were selected to ensure an accurate representation of each type was collected. As sites of planting spruce were discontinuous and were partitioned by non-disturbed sites (i.e., natural secondary forest) after harvesting, plots of P. asperata broadleaved mixed forest and natural secondary forest were in a tandem arrangement, while the selected research sites of P. asperata plantation forest were separated by natural secondary forest. All the plots were on the southeast slope. Each plot was randomly set in the forest and was far from the edge of the forests. Plots were hundreds of meters to several kilometers apart. The topographic characteristics of each stand plot were shown in Table 1.

2.3. Sequential Soil Coring

Within each plot, collections were conducted at monthly intervals during the growing season of 2015 (May to November, specifically, 24 May, 25 June, 25 July, 25 August, 26 September, 25 October and 22 November) without winter season for a total of seven sampling occasions. During the winter months, soil was frozen and covered with snow, and fine root production was considered to be negligible [26,56]. To ensure the correct sampling depth of the fine root biomass, we performed a sampling trial along the soil depth and we observed that most fine root biomass (ca. 90%–94%) was distributed in the uppermost 30 cm of soil in the three forests and there was no difference in the maximum depth of the fine roots among the three forests. On each sampling occasion, five soil cores with a stainless-steel corer (diameter of 8 cm) were randomly taken from the forest floor surface down to 30 cm in each plot, and then divided into three soil depths: 0–10 cm, 10–20 cm and 20–30 cm. In total, we collected 315 cores (seven months × three forest types × three plots × five cores), providing 945 samples (three depths per core) for measuring fine root biomass, fine root necromass and to investigate how they varied among seasons, depths and forest types.
Samples were placed in plastic bags, and then transported to the laboratory. All of the samples were stored at (4 °C) and processed within one month. The samples were put in 0.25-mm meshed bags and washed with tap water. After washing, the samples were put on 0.25-mm sieves, and then swung the sieves in the water to separate the roots from stones, sand and plant detritus [47,57]. All fine roots of trees, excluding the understory vegetation, were manually picked up with tweezers and calipers [26]. Fine roots were separated into live (biomass) and dead (necromass) categories by visual inspection. Live roots were intact, firm, resilient and bright in color, while dead roots were brittle and with dark cortexes that had separated from periderm or had been lost [58,59]. All samples were separately oven-dried to a constant mass at 70 °C and weighed.

2.4. Stand Characteristics and Aboveground Biomass

For the stand characteristics survey, another three plots (20 m × 20 m) for each forest type were set up at about 5 m from each of the plots where fine roots were collected, six plots of each forest type were for the stand survey. The DBH (diameter at breast height, 1.3 m) and the species name of all living trees with a DBH ≥ 2 cm were recorded in August 2015. The aboveground biomass of all living trees was estimated by the allometric equations which were taken DBH2H (or DBH) as independent variable and were built based on the data from Gongga Mountain with a similar climate, landform, and trees composition to our study area [49]. Meanwhile, tree species diversity (Shannon–Wiener index) was calculated according to Liu et al. [27] based on the average of relative density and relative basal area. The stand characteristics of each forest type are given in Table 1.

2.5. Soil Characteristics

Three random soil profiles were dug in plots which were collected fine root samples to collect soil samples between 0–10 cm, 10–20 cm and 20–30 cm. Bulk density samples were collected by stainless-steel cylinders (50.46 mm in diameter and 50 mm in height). The cylinders were vertically inserted nearly in the middle of each soil depth after removing the upper soil. Three soil samples from each layer of each forest plot were collected near the profiles by soil auger and mixed, and then transported to the laboratory. Soil samples were air-dried and passed through a 2-mm sieve prior to chemical analyses. Soil organic C and total N contents (hereafter referred to as soil C and N contents, respectively) were determined using the K2Cr2O7–H2SO4 wet oxidation method and the Kjeldahl acid-digestion method [60]. In addition, soil samples of 0–10 cm were collected at five places from each plot and mixed into one sample in each month besides in June when soil samples of different soil depths (0–30 cm) were collected. The mixed samples were passed through a 2-mm sieve and transported to the laboratory in a cool box containing ice packs. The soil samples were kept at 4 °C in a refrigerator to determine ammonium and nitrate contents by a flow injection analyzer after extracting with 2M KCl solution.

2.6. Data Analysis

Fine root biomass and necromass (g m−2) were calculated for the dry weights in each core. The values of five cores at a particular sampling date at each site were first averaged, with the average values of three plots representing the monthly mean value of each forest type. Fine root production was estimated from changes in live and dead fine root biomass quantities between two sampling intervals [61], based on the decision matrix method by Fairley and Alexander [62]—see Table 2. Total fine root production (hereafter referred to fine root production) was calculated as the sum of monthly fine root production based on live and dead fine roots from June to November. Fine root turnover was defined as total fine root production divided by the mean fine root biomass [63]. The mean fine root biomass was calculated as the average of the live root biomass across all sampling dates. The profile data for production and turnover rate are the sum and average of all soil depths, respectively. We first obtained the sum values of production in the profile (0–30 cm) in each plot, and then averaged the three plots within each forest type to represent the profile production of each forest type. The turnover rate was calculated as the average values of the profile (0–30 cm) in each plot, and then averaged the three plots within each forest type to represent the profile turnover rate of each forest type.
The homogeneity of all variables was tested with Levene’s test. The means were compared by using a one-way analysis of variance (ANOVA) and Tukey’s Honestly Significant Difference test. In the statistical analysis, forest type and sampling time, forest type and soil depth were regarded as the two experimental variables and a two-way ANOVA was used to detect their influences on fine root dynamics [64]. Pearson correlation analysis was performed to examine the relationship between fine root dynamics and soil N availability in the 0–10 cm soil depth across forest types since we only have the vertical (0–30 cm) values of inorganic N in June, which showed a decreasing trend with the increase of soil depth. Meanwhile, linear relationships were performed to examine the relationships between fine roots (biomass, production and turnover rate) and aboveground biomass [27]. All statistical analyses were performed using SPSS software (SPSS, Chicago, IL, USA) with significance being defined as p ≤ 0.05.

3. Results

3.1. Comparison of Fine Roots among Forest Types

Fine root traits (biomass, necromass, production and turnover rate) at the soil depth of 0–30 cm were significantly (p < 0.05) different among forest types (Figure 1). Fine root biomass was the highest in P. asperata plantation forest and necromass was highest in natural secondary forest. Both of them were the lowest in P. asperata broadleaved mixed forest (Figure 1a,b). P. asperata plantation forest had the highest fine root biomass: necromass ratio among the three forest types (Figure 1c). Fine root production in natural secondary forest and P. asperata plantation forest was significantly greater than that in P. asperata broadleaved mixed forest (Figure 1d). Fine root turnover rate in natural secondary forest and P. asperata broadleaved mixed forest was greater than that in P. asperata plantation forest (Figure 1e).

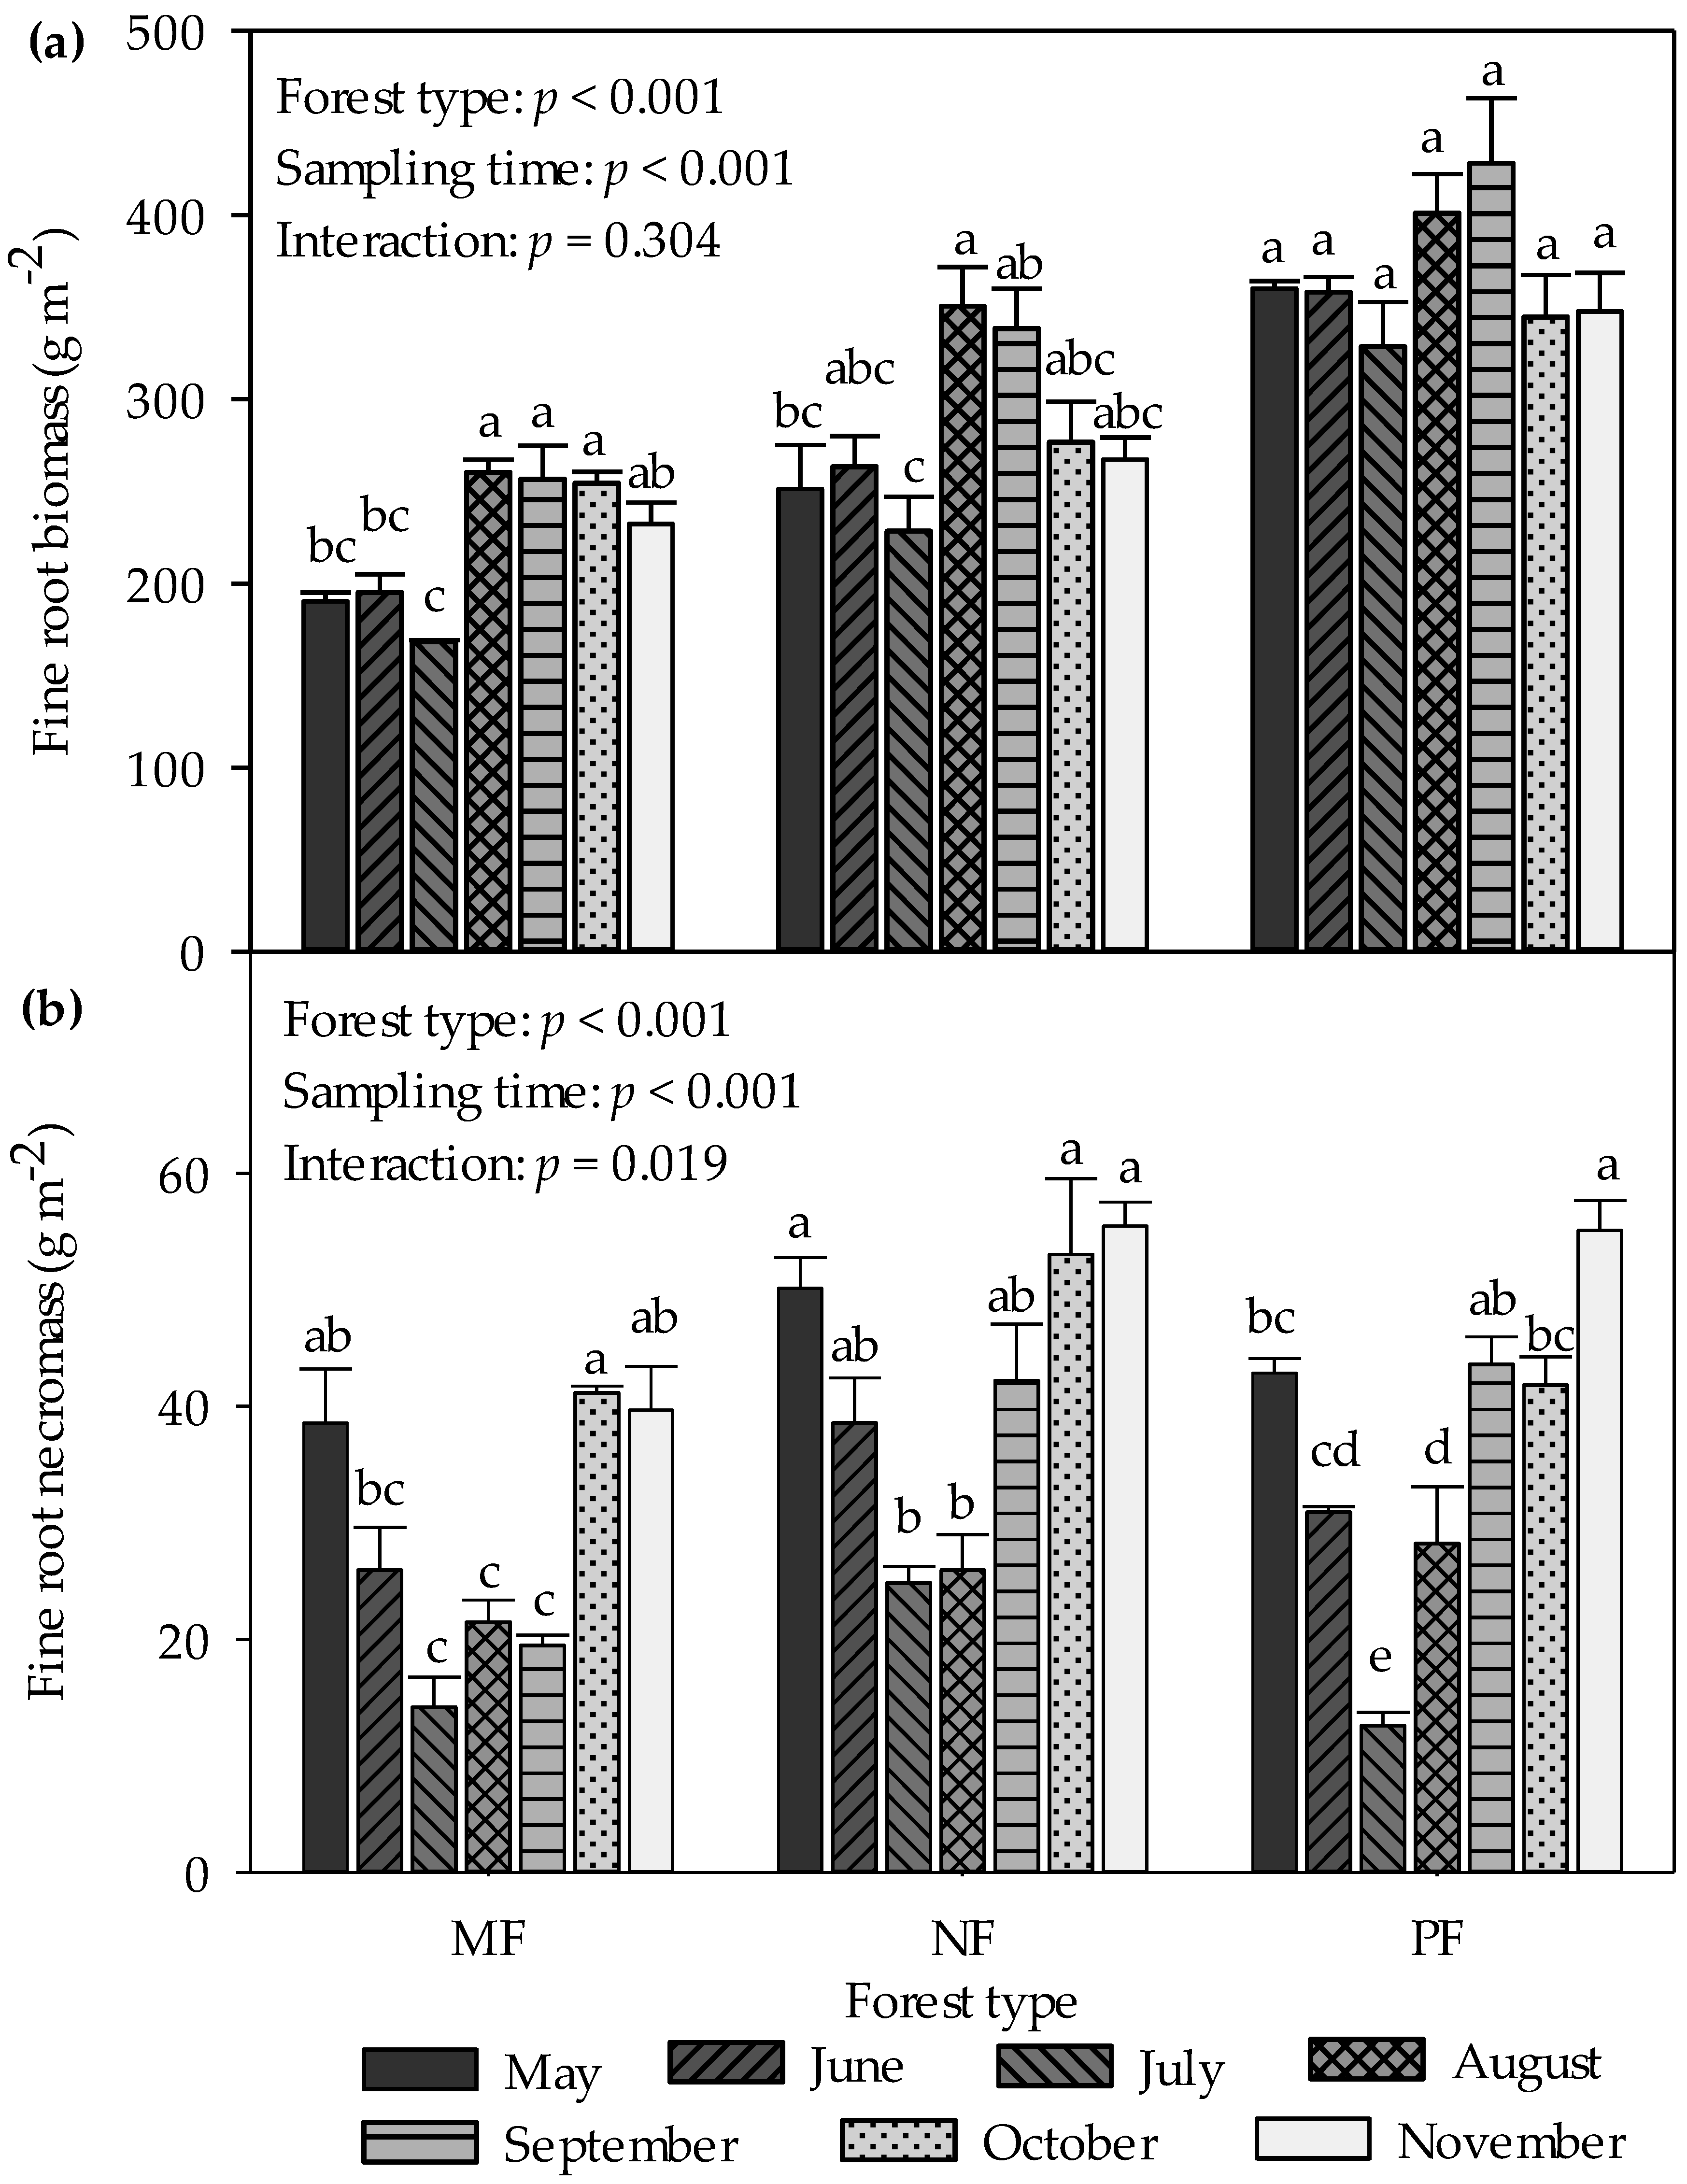
3.2. Seasonal Dynamics of Fine Root Biomass and Necromass

The monthly fine root biomass and necromass in the uppermost 30 cm of soil had distinct intra-annual fluctuation from May to November (Figure 2). The monthly variation in fine root biomass and necromass generally had a bimodal pattern. The peaks generally showed in the early and middle stages of the growing season for fine root biomass (Figure 2a), while in the early and late stages of the growing season for fine root necromass (Figure 2b). Although the increment in the early growing season was not significant in the fine root biomass, it was significant in the fine root necromass. Forest type and sampling time significantly affected fine root biomass and necromass, while their interaction had no considerable effect on fine root biomass and only a significant effect on fine root necromass (Figure 2).

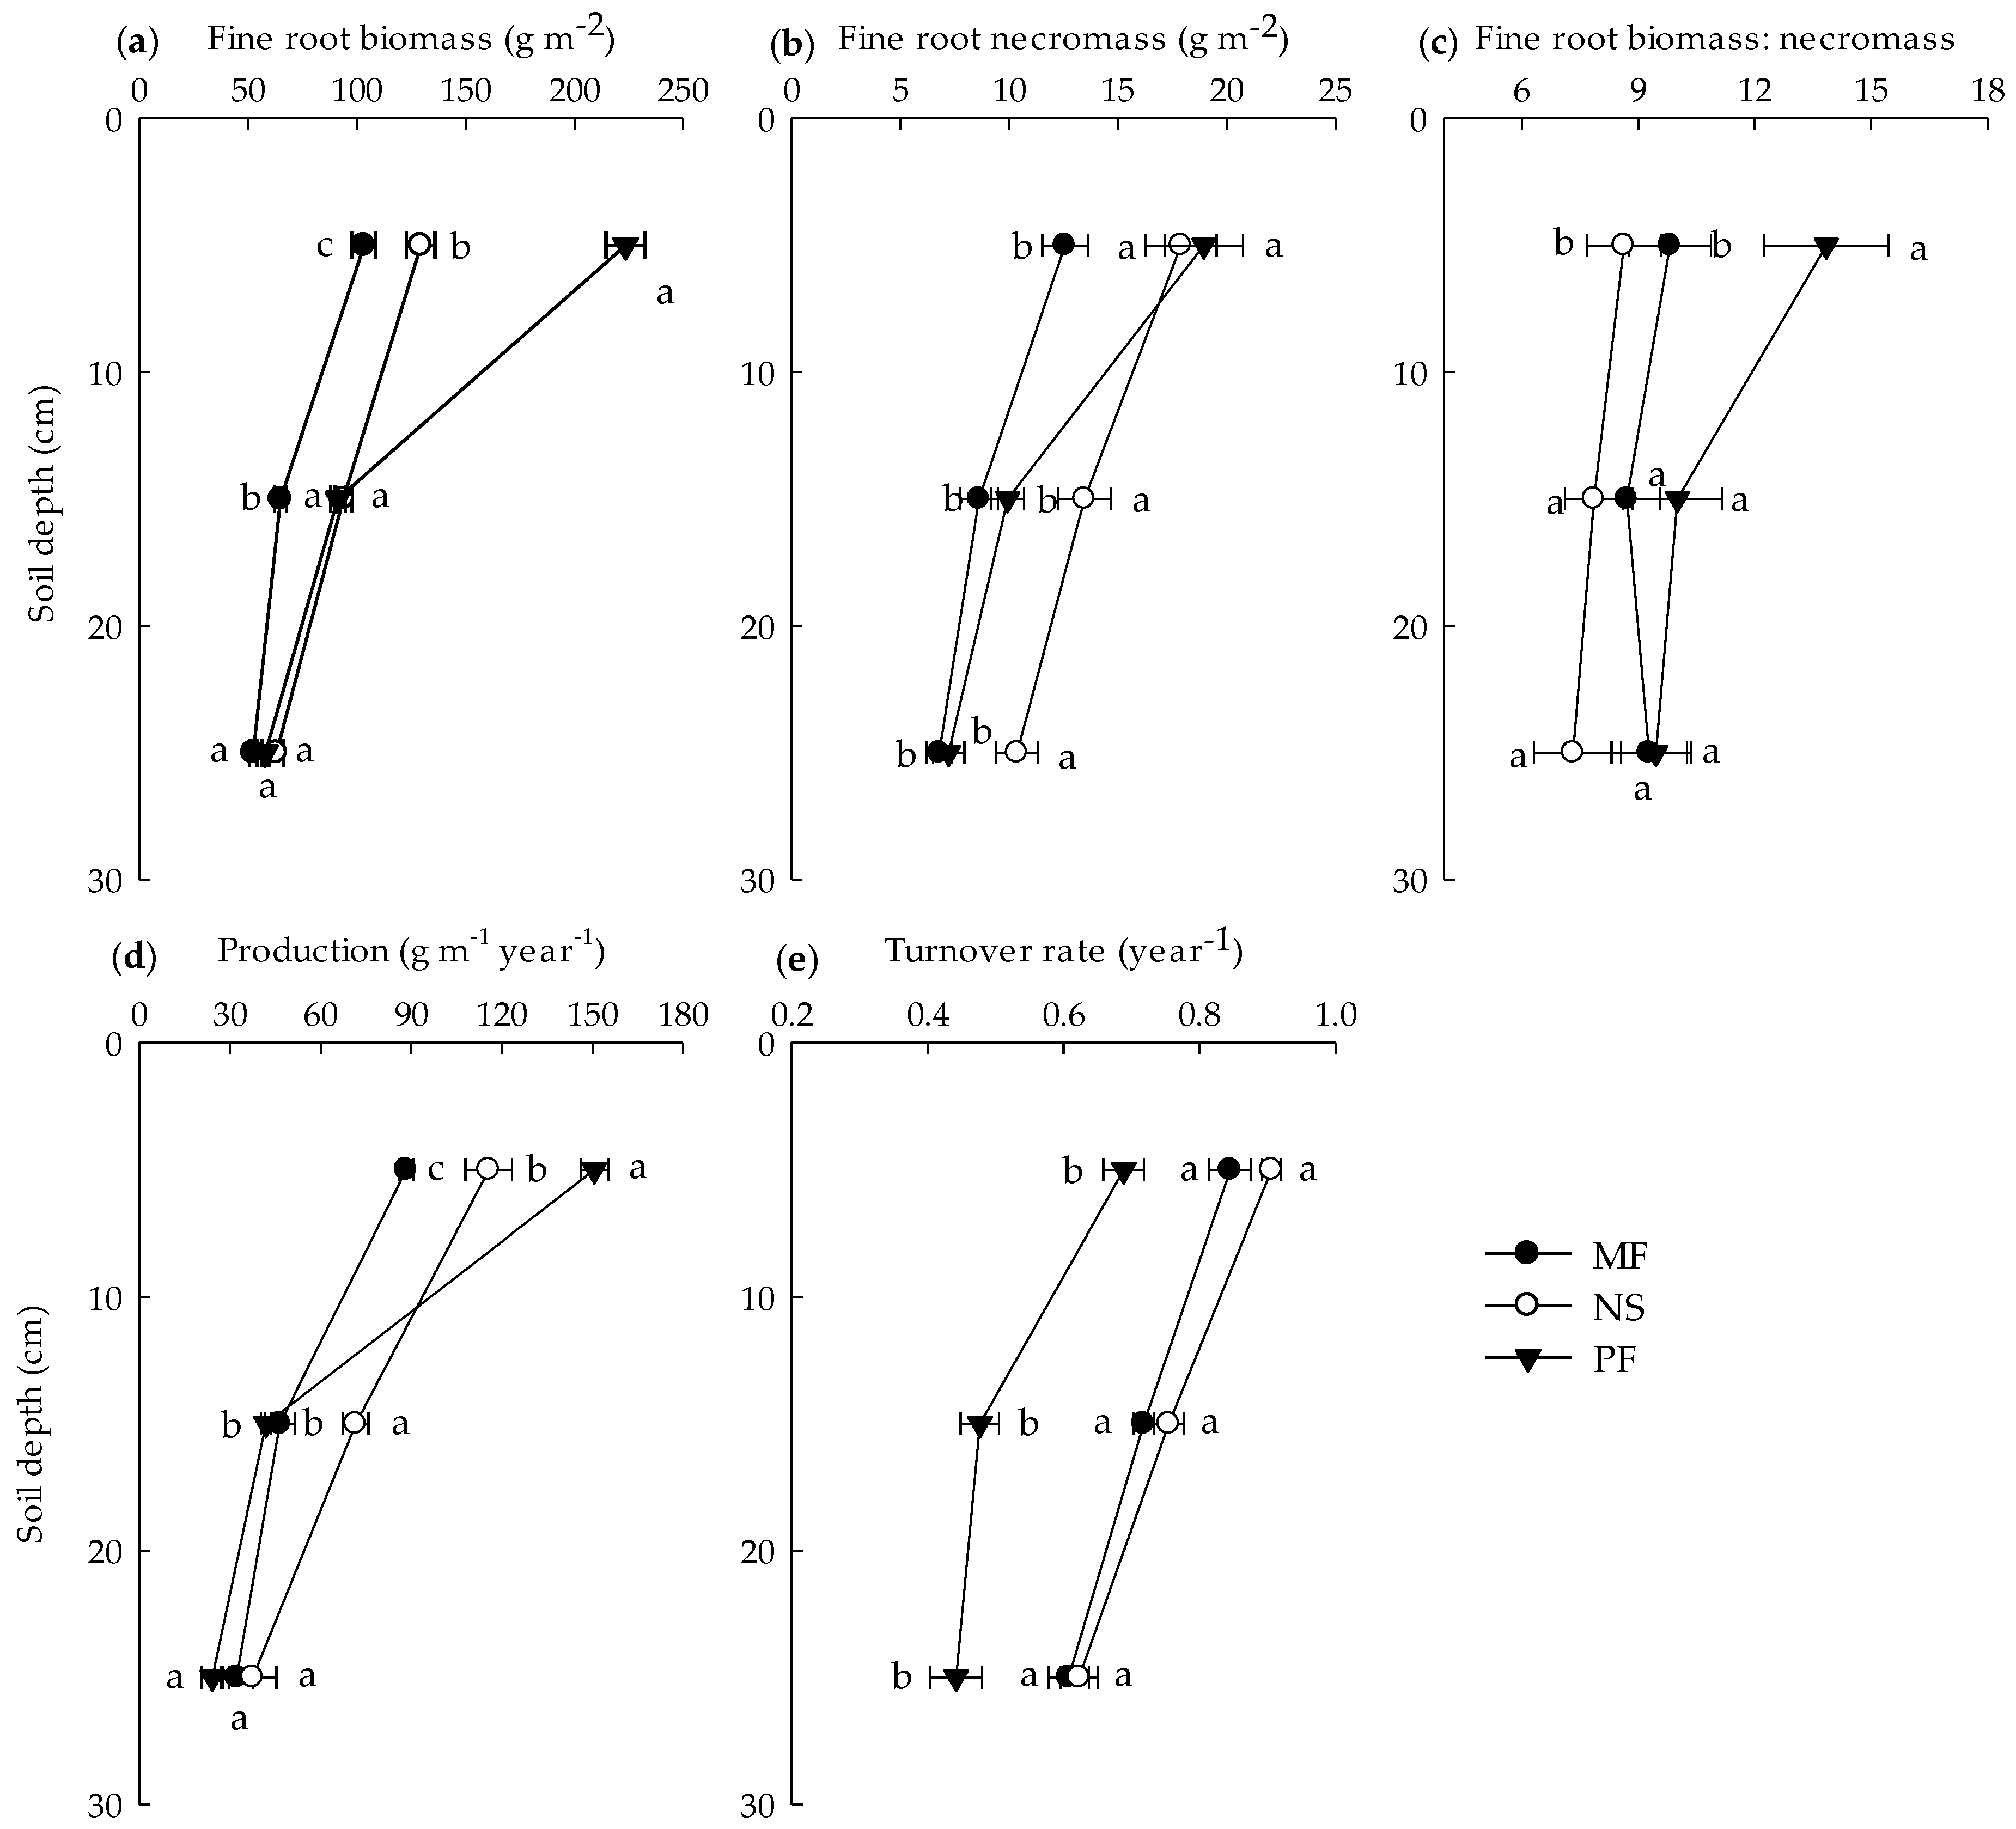
3.3. Vertical Distribution of Fine Roots

The mean of fine root traits (biomass, necromass and their ratio, production and turnover) generally decreased with soil depth (Figure 3). Fine root biomass in the three soil depths ranged from 54.90 to 219.35 g m−2, 52.79 to 104.91 g m−2, and 59.84 to 127.57 g m−2 in P. asperata plantation forest, P. asperata broadleaved mixed forest and natural secondary forest, respectively. Correspondingly, fine root necromass ranged from 7.21 to 18.90 g m−2, 7.21 to 12.56 g m−2, and 10.25 to 17.23 g m−2 in the three types of forest, respectively. The differences of fine root production between 0–10 cm and 20–30 cm soil depths in P. asperata plantation forest, P. asperata broadleaved mixed forest and natural secondary forest were 56.16, 78.13, and 126.44 g m−2, while fine root turnover rate of 0–10 cm were 1.39, 1.45, and 1.56 times that of 20–30 cm, respectively. Fine root biomass: necromass ratio changed smoothly in the two mixed forests compared to P. asperata plantation forest. The differences of fine root biomass, production and the ratio of fine root biomass to necromass among forest types were mainly in the top 0–10 cm of soil with highest in P. asperata plantation forest, while they were not significant at the soil depth of 20–30 cm. Difference of fine root turnover rate between the two mixed forests was not significant, but they were significantly higher than in P. asperata plantation forest in each soil depth.
Both soil depth and forest type had significant effects on fine root traits while their interaction had no significant effect on fine root turnover rate (Table 3).

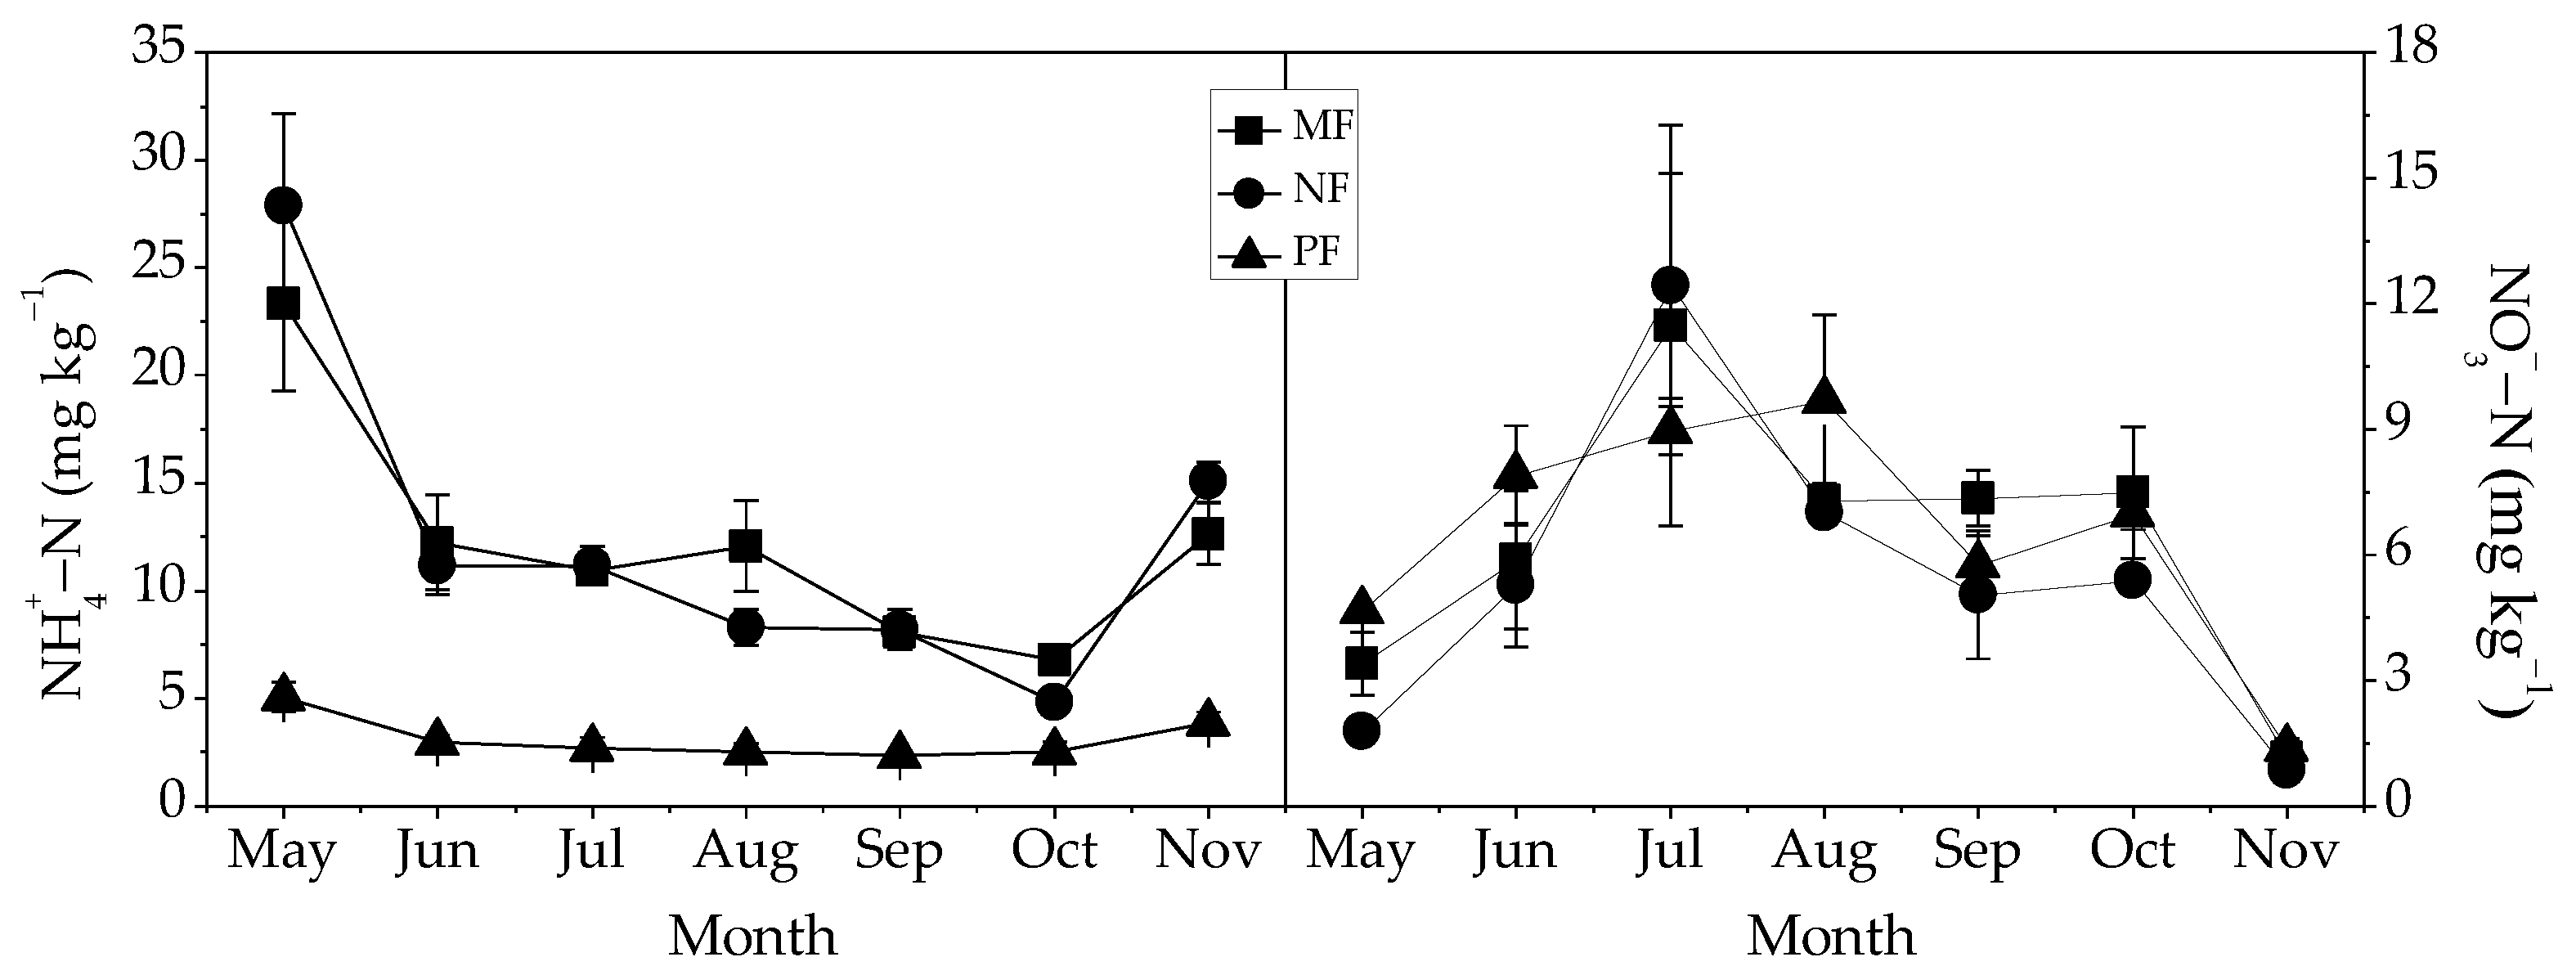
3.4. Relationships between Fine Root Dynamics and Soil N Availability

Soil ammonium sharply decreased from May to June, especially in natural secondary forest and P. asperata mixed broadleaved forest, but was slightly increased from October to November (Figure 4). Compared with natural secondary forest and P. asperata mixed broadleaved forest, P. asperata plantation forest had a lower values and smaller fluctuations of soil ammonium during the period. However, soil nitrate increased initially, and then decreased during the period, with peaks in July in natural secondary forest and P. asperata mixed broadleaved forest and peaked in August in P. asperata plantation forest (Figure 4). Across forest types, fine root dynamics were closely associated with inorganic N, mainly with ammonium. Fine root biomass and production were negatively related to inorganic N and ammonium, whereas fine root turnover rate was positively related to inorganic N and ammonium (Table 4).

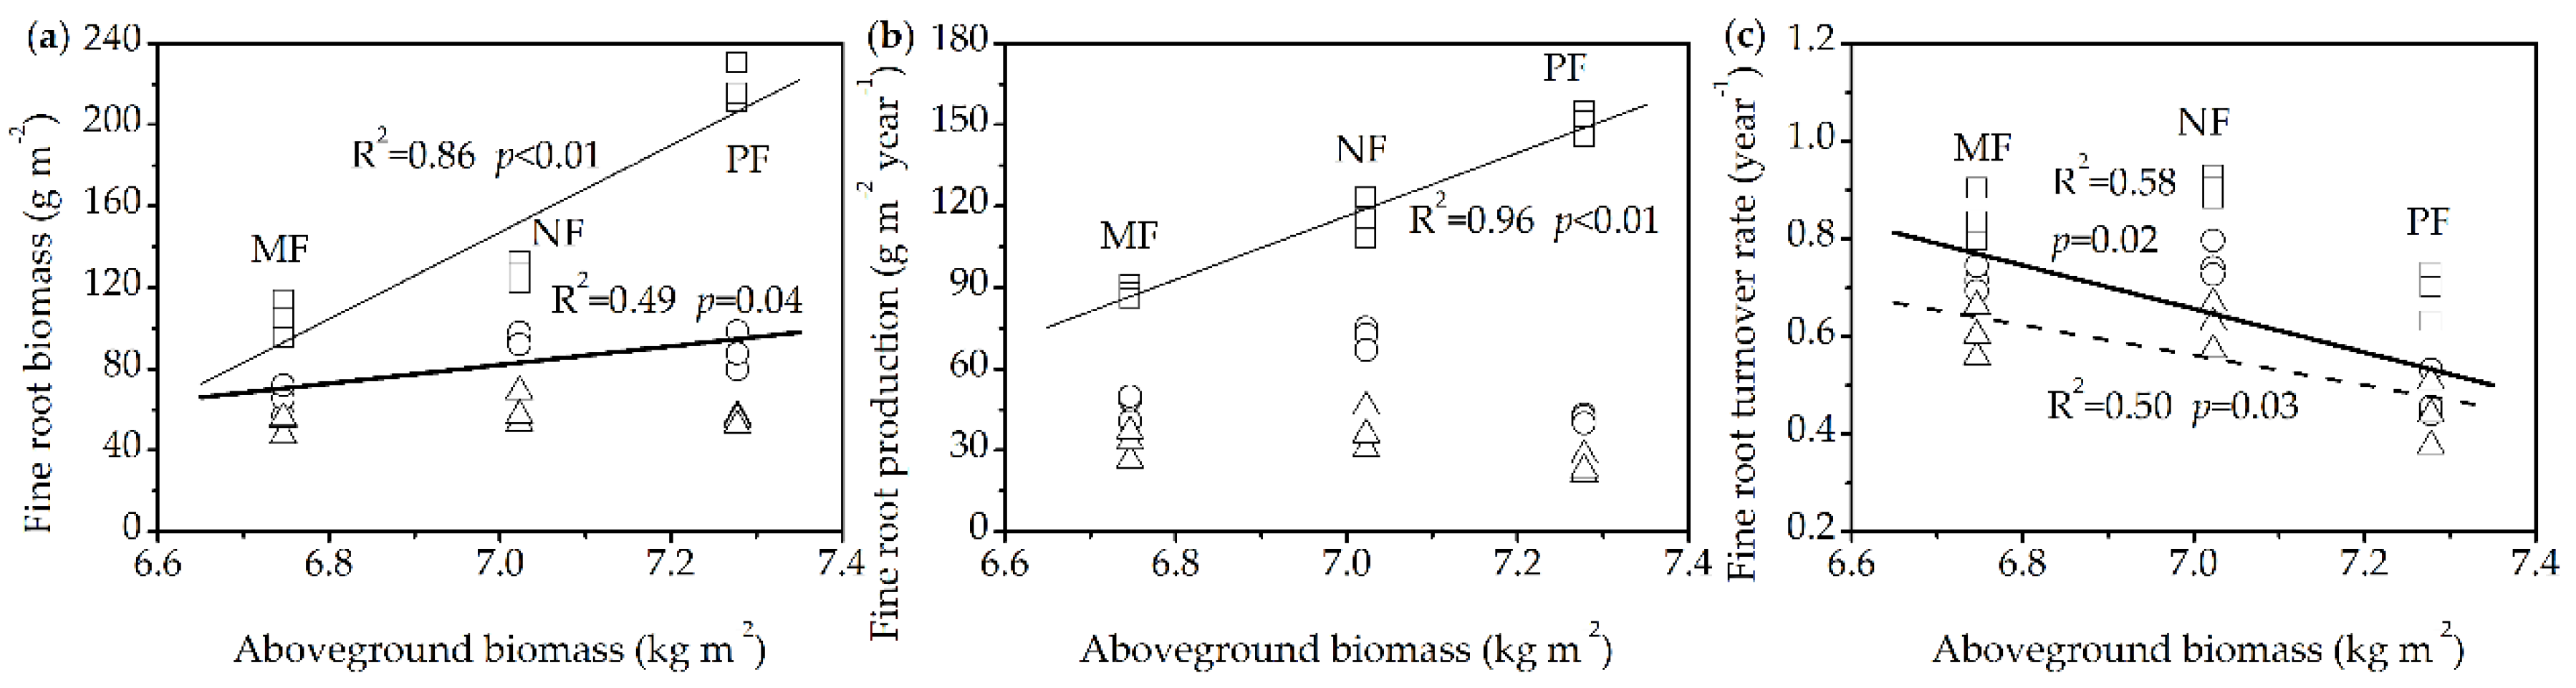
3.5. Relationships between Fine Root Dynamics and Aboveground Biomass

Fine root biomass and production were significantly and positively correlated with aboveground biomass (R2 = 0.86, p < 0.01; R2 = 0.96, p < 0.01, respectively) in the 0–10 cm soil layer. In the 10–20 cm soil layer, only fine root biomass (R2 = 0.49, p = 0.04) was significantly and positively correlated with aboveground biomass. The relationships between aboveground biomass and fine root biomass (R2 = 0.17, p = 0.66), and production (R2 = 0.19, p = 0.24) were not significant in the 20–30 cm soil layer. Fine root turnover rate was significantly and negatively related to aboveground biomass, except in the 0–10 cm soil layer (Figure 5). Aboveground biomass was also positively related to fine root biomass and production (R2 = 0.97, p < 0.01; R2 = 0.57, p = 0.02, respectively), and was negatively related to turnover rate (R2 = 0.54, p = 0.03) at the profile level across forest types.
Fine root turnover rate was negatively associated with annual fine root production in the soil depth of 0–10 cm (Figure 6a), but was positively related to fine root production in the soil depths of 10–20 cm and 20–30 cm (Figure 6b) across all forest types.

4. Discussion

Our data showed that fine root dynamics differed significantly among the three forest types (Figure 1). In the 0–30 cm soil depth, fine root biomass of the three forest types ranged from 222.52 g m−2 to 362.89 g m−2, which fell within the fine root biomass ranges of China’s forests with the same soil depth [65]. The values of fine root production and turnover rate of the three forest types were lower than the average level of China’s forests [65]. It might be caused by lower temperature [13] and stand characteristics [26,66,67]. Importantly, we found that there were no positive effects of mixed forests on fine root biomass and production, while there was effect on fine root turnover at soil depth of 0–30 cm. This did not support our original hypothesis that fine root biomass and production were higher in mixed forests than in monocultures but only supported the hypothesis that mixed forests had higher fine root turnover rates.
In spite of previous studies that estimated that mixed forests have higher production rates compared to monoculture forests [29,68], our result showed that P. asperata plantation had a higher fine root biomass within the entire profile. It agreed more with the study that demonstrated fine root biomass was lower in mixed forests than in the corresponding monoculture forests [38]. However, total fine root production was the highest in the natural secondary forest and the lowest in the P. asperata broadleaved mixed forest (Figure 1d). Meinen et al. [69] did not find positive effects of species diversity on stand fine root biomass and concluded that this was a consequence of missing spatial segregation of the roots of different tree species in mature forests. Domisch et al. [70] also considered that missing spatial niche differentiation could be a plausible explanation for the lack of higher fine root biomass and production in mixed forests compared to monocultures. Similar to other studies [20,27], fine root biomass, necromass, production, and turnover rate in our study had vertical variations (Figure 3). The vertical distribution pattern of fine roots is affected by a series of endogenous and exogenous factors [71]. Local site conditions are probably mainly responsible for the vertical patterns [72]. The decreases in fine root biomass, necromass and production along the soil depth are probably attributed to the presence of suitable growth environments in the upper soil layer (e.g., higher nutrient contents, water and heat resources, as well as lower soil bulk density, etc. [56,73]). Adverse environments in the lower soil layer may make fine root increase lifespan to reduce the consumption [74]. The ratio of fine root biomass to necromass, to a degree, reflects fine root vitality [64,73]. The ratios were higher in current study than those compared to study of Persson and Stadenberg [75], but similar to the study of Liu et al. [27]. In agreement with previous studies [64,73], the ratio of fine root biomass to necromass slightly decreased with soil depth, possibly owing to a faster decomposition rate in upper soil layer [76].
The variation in fine root biomass and production among forest types mainly occurred in the 0–10 cm soil layer with the highest values in P. asperata plantation forest; however, there was no significant difference in these parameters in the soil layer of 20–30 cm (Figure 3a,d). This indicated that P. asperata plantation forest had the largest vertical variation in fine root biomass and production than the two mixed forests. This also meant that mixed forests had a more even vertical fine root distribution. One possible reason could be the niche segregation caused by tree species composition [47]. A mixture of species with different distribution, architecture and foraging behavior traits improve resource utilization and production in the vertical profile of soil [26,30,77], which might allow better use of deep soil resources in mixed forests [26].
Our results indicated that aboveground biomass was an important factor affecting fine root dynamics with a positive effect on fine root biomass and production, and a negative effect on turnover rate at the soil depth of 0–30 cm across forest types. However, distinct responses of fine roots dynamics to aboveground biomass were observed depended on soil depth (Figure 5). Fine root biomass and production were positively associated with aboveground biomass in the top 10 cm of soil. It demonstrated the positive relationship between the quantity of aboveground biomass and belowground biomass and production [78], as well as between production and absorption [46]. There were no significant relationships between fine root biomass or production and aboveground biomass in the lower soil depths. It suggested that aboveground biomass had a weak effect on fine root biomass and production in the lower soil depths. Our result indicated that higher aboveground biomass rather than tree species diversity might cause the relative higher fine root biomass and production in our study.
In contrast, fine root turnover rate was greater in the two mixed forests compared to the monoculture forest (Figure 1e and Figure 3e). We found that the fine root turnover rate was more associated with fine root production in the 10–20 cm and 20–30 cm soil depths (Figure 6). This finding agreed with McCormack et al. [67] and showed that fine root production might be a better indicator of fine root turnover than fine root biomass [41]. One possible reason for the positive effect of fine root production on turnover rate is that greater competition for resources causes more intense interspecific belowground competition [34] and thus decreases the fine root lifespan [39]. However, fine root biomass had negative effects on fine root turnover in the 0–10 cm soil depth (Figure 6), which was mainly attributed to higher fine root biomass and production, but also a lower turnover in P. asperata plantation forest (Figure 3a,f). It was likely that the higher biomass and the lower soil N availability (mainly ammonium) in P. asperata plantation forest may limit the relative production due to resource scarcity, as we found that soil ammonium had a positive effect on turnover rate across all forest types (Table 4). Thus, the growth strategy by increasing the length of lifespan could be available to absorb soil resources [41]. Additionally, fine root lifespans of trees range from 95 to 336 days across different species [79]. Generally, evergreen tree species have a longer lifespan than deciduous [74] and stands dominated by conifers have a lower turnover rate relative to stands dominated by broadleaved trees [13]. In contrast to mixed forests with a proportion of deciduous broadleaved tree species, plantation forests were comprised of evergreen coniferous tree species, which may be another reason for a lower turnover in the plantation in this study.
Moreover, we found that the three forests investigated in the current study had two peaks for fine root biomass occurring in the early and middle growing season (Figure 2a). In all stands, only the second peak was significant. Generally, the seasonal pattern in fine root biomass is mainly controlled by endogenous characteristics and then exogenous factors such as climatic and soil conditions [22]. Therefore, the seasonal patterns in fine root biomass are complex, and the seasons that the statistically significant peaks occurred in are inconsistent [80]. There was detected an insignificant peak in the early growing season, which might result from the increase of soil temperature and water content [80], and high mineral nutrients and water uptake for leaf-out and foliage production [71]. However, the result that the statistically significant peak occurred in middle to late summer was similar to previous studies, which could reflect seasonal dynamics of soil water and nutrient availability, and an ontogenetic response to local conditions [6,7,71]. There were relatively high temperature and moisture levels in the middle of the growing season, and thus high contents of soil N mineralization [81] and availability [67]. Our data showed contrasting seasonal responses for soil ammonium and nitrate, while the trend for soil nitrate was more consistent with that of fine root biomass during the growing season, the significant peak in fine root biomass lagged behind that of soil nitrate (Figure 2 and Figure 4). The higher soil nitrate in the middle season may benefit for the fine root production as a significant preference of the major tree species in this region for soil nitrate [82]. However, ammonium is also an important inorganic N form for plants and affects nitrate availability by regulating nitrification rate, thus the lower soil ammonium in the middle season might be not conducive to the fine root production [83]. A trough in necromass occurred in the middle of the growing season (Figure 2b), which was in agreement with Konôpka et al. [58], was attributed to a lower rate of mortality. As the activity of the aboveground parts decreased due to it being too cold and some parts of the roots died in synchronization [58,71], thus causing a gradually rising trend in the quantity of fine root necromass during the end of the growing season [84]. Moreover, the high level of necromass in the early growing season was possibly due to root senescence, as well as a low decomposition rate during the winter due to a low temperature [76,85].
Undeniably, there were some limitations in our study. The values based on the growing season slightly deviated from the actual annual production and turnover as a result of the fluctuation in fine roots in the winter [84,86]. Moreover, as we did not sample the understory, our data did not cover the fine root dynamics at the level of the whole forest ecosystem [75]. In addition, the selected method also affected the results [61]. The decision matrix formula, based on the sequential coring technique, is widely used for fine root production and turnover considering both biomass and necromass [57,61,63]. However, it assumed that no fine roots complete the process from birth to death and no additional biomass peaks and troughs emerge during a sampling interval [87]. Considering these factors, there might be a certain deviation in our results [88]. Nonetheless, the results showed that fine root biomass and production of tree species were more affected by aboveground biomass across forest types, and mixed forests had a higher fine root turnover relative to mono-species forest, which strengthened the effects of stand origin on fine root dynamics after clear-cutting. In general, fine roots are important sources of soil carbon [63], faster fine root turnover may be more conducive to soil carbon accumulation. Considering mixed forests, especially that natural secondary forest had a higher fine root biomass, production, and turnover rate, it may be more conducive to soil carbon accumulation in the current stage.

5. Conclusions

This study showed that mixed forests had a higher fine root turnover rate, but not fine root biomass and production, than monocultures. The three forest types had the same vertical trends of fine root dynamics, with higher vertical variation in fine root biomass and production in the monoculture forests. The trends of fine root biomass and production among the three forest types were different in the three soil layers, with the largest biomass and production in the upper soil and the lowest production in the lower soil layers occurring in monocultures. The fine root turnover rate was greater in mixed forests than in monocultures and was likely affected by fine root production, soil N availability and tree species composition. Our results provide an important context to understand the effects of stand origin on fine root dynamics.

Author Contributions

S.L. performed the experiments, analyzed the data, and wrote and revised the manuscript. D.L. performed the experiments and analyzed the data. H.Y. analyzed the data. Z.S. conceived and designed the experiments, supervised the study and revised the paper. Q.L., L.Z., and Y.K. contributed to the experimental tools and conducted the field experiments. All authors contributed critically to the manuscript and gave final approval for publication.

Funding

This study was financially supported by the Fundamental Research Funds of CAF (CAFYBB2014MA004, CAFYBB2018ZA003) and the National Key Research and Development Program (2016YFC0502104-02).

Acknowledgments

The authors would like to thank all related persons for their help in data collection. We are grateful to anonymous reviewers for their constructive comments in improving this paper.

Conflicts of Interest

The authors declare no conflict of interest.

References

  1. Pransiska, Y.; Triadiati, T.; Tjitrosoedirjo, S.; Hertel, D.; Kotowska, M.M. Forest conversion impacts on the fine and coarse root system, and soil organic matter in tropical lowlands of Sumatera (Indonesia). For. Ecol. Manag. 2016, 379, 288–298. [Google Scholar] [CrossRef]
  2. Lindström, A.; Rune, G. Root deformation in plantations of container-grown Scots pine trees: Effects on root growth, tree stability and stem straightness. Plant Soil 1999, 217, 29–37. [Google Scholar] [CrossRef]
  3. Lukac, M.; Godbold, D.L. Fine root biomass and turnover in southern taiga estimated by root inclusion nets. Plant Soil 2010, 331, 505–513. [Google Scholar] [CrossRef]
  4. Hendrick, R.L.; Pregitzer, K.S. The Demography of Fine Roots in a Northern Hardwood Forest. Ecology 1992, 73, 1094–1104. [Google Scholar] [CrossRef]
  5. Barlow, P. Plant roots: Autopoietic and cognitive constructions. Plant Root 2010, 4, 40–52. [Google Scholar] [CrossRef]
  6. Montagnoli, A.; Terzaghi, M.; Di Iorio, A.; Scippa, G.S.; Chiatante, D. Fine-root morphological and growth traits in a Turkey-oak stand in relation to seasonal changes in soil moisture in the Southern Apennines, Italy. Ecol. Res. 2012, 27, 1015–1025. [Google Scholar] [CrossRef] [Green Version]
  7. Montagnoli, A.; Di Iorio, A.; Terzaghi, M.; Trupiano, D.; Scippa, G.S.; Chiatante, D. Influence of soil temperature and water content on fine-root seasonal growth of European beech natural forest in Southern Alps, Italy. Eur. J. For. Res. 2014, 133, 957–968. [Google Scholar] [CrossRef] [Green Version]
  8. Montagnoli, A.; Dumroese, R.K.; Terzaghi, M.; Pinto, J.R.; Fulgaro, N.; Scippa, G.S.; Chiatante, D. Tree seedling response to LED spectra: Implications for forest restoration. Plant Biosyst. 2018, 152, 515–523. [Google Scholar] [CrossRef]
  9. Eissenstat, D.M.; Wells, C.E.; Yanai, R.D.; Whitbeck, J.L.; Norby, R.; Fitter, A.; Jackson, R. Building roots in a changing environment: Implications for root longevity. New Phytol. 2000, 147, 33–42. [Google Scholar] [CrossRef]
  10. Montagnoli, A.; Terzaghi, M.; Baesso, B.; Santamaria, R.; Scippa, G.S.; Chiatante, D. Drought and fire stress influence seedling competition in oak forests: Fine-root dynamics as indicator of adaptation strategies to climate change. Reforesta 2016, 22, 86–105. [Google Scholar] [CrossRef]
  11. Brunner, I.; Herzog, C.; Dawes, M.A.; Arend, M.; Sperisen, C. How tree roots respond to drought. Front. Plant Sci. 2015, 6, 547. [Google Scholar] [CrossRef] [PubMed]
  12. McCormack, M.L.; Dickie, I.A.; Eissenstat, D.M.; Fahey, T.J.; Fernandez, C.W.; Guo, D.; Helmisaari, H.-S.; Hobbie, E.A.; Iversen, C.M.; Jackson, R.B.; et al. Redefining fine roots improves understanding of below-ground contributions to terrestrial biosphere processes. New Phytol. 2015, 207, 505–518. [Google Scholar] [CrossRef] [PubMed] [Green Version]
  13. Yuan, Z.Y.; Chen, H.Y.H. Fine root biomass, production, turnover rates, and nutrient contents in boreal forest ecosystems in relation to species, climate, fertility, and stand age: Literature review and meta-analyses. Crit. Rev. Plant Sci. 2010, 29, 204–221. [Google Scholar] [CrossRef]
  14. Brédoire, F.; Nikitich, P.; Barsukov, P.A.; Derrien, D.; Litvinov, A.; Rieckh, H.; Rusalimova, O.; Zeller, B.; Bakker, M.R. Distributions of fine root length and mass with soil depth in natural ecosystems of southwestern Siberia. Plant Soil 2016, 400, 315–335. [Google Scholar] [CrossRef]
  15. Matamala, R.; Gonzàlez-Meler, M.A.; Jastrow, J.D.; Norby, R.J.; Schlesinger, W.H. Impacts of fine root turnover on forest NPP and soil C sequestration potential. Science 2003, 302, 1385–1387. [Google Scholar] [CrossRef] [PubMed]
  16. Yuan, Z.Y.; Chen, H.Y.H. Effects of disturbance on fine root dynamics in the boreal forests of Northern Ontario, Canada. Ecosystems 2013, 16, 467–477. [Google Scholar] [CrossRef]
  17. Jamro, G.M.; Chang, S.X.; Naeth, M.A.; Duan, M.; House, J. Fine root dynamics in lodgepole pine and white spruce stands along productivity gradients in reclaimed oil sands sites. Ecol. Evol. 2015, 5, 4655–4670. [Google Scholar] [CrossRef] [PubMed] [Green Version]
  18. Hickler, T.; Prentice, I.C.; Smith, B.; Sykes, M.T.; Zaehle, S. Implementing plant hydraulic architecture within the LPJ Dynamic Global Vegetation Model. Glob. Ecol. Biogeogr. 2006, 15, 567–577. [Google Scholar] [CrossRef]
  19. Cienciala, E.; Tatarinov, F.A. Application of BIOME-BGC model to managed forests: 2. Comparison with long-term observations of stand production for major tree species. For. Ecol. Manag. 2006, 237, 252–266. [Google Scholar] [CrossRef]
  20. Børja, I.; De Wit, H.A.; Steffenrem, A.; Majdi, H. Stand age and fine root biomass, distribution and morphology in a Norway spruce chronosequence in southeast Norway. Tree Physiol. 2008, 28, 773–784. [Google Scholar] [CrossRef] [PubMed] [Green Version]
  21. Sun, T.; Dong, L.; Mao, Z.; Li, Y. Fine root dynamics of trees and understorey vegetation in a chronosequence of Betula platyphylla stands. For. Ecol. Manag. 2015, 346, 1–9. [Google Scholar] [CrossRef]
  22. Montagnoli, A.; Terzaghi, M.; Di Iorio, A.; Scippa, G.S.; Chiatante, D. Fine-root seasonal pattern, production and turnover rate of European beech (Fagus sylvatica L.) stands in Italy Prealps: Possible implications of coppice conversion to high forest. Plant Biosyst. 2012, 146, 1012–1022. [Google Scholar] [CrossRef] [Green Version]
  23. Terzaghi, M.; Montagnoli, A.; Di Iorio, A.; Scippa, G.S.; Chiatante, D. Fine-root carbon and nitrogen concentration of European beech (Fagus sylvatica L.) in Italy Prealps: Possible implications of coppice conversion to high forest. Front. Plant Sci. 2013, 4, 192. [Google Scholar] [CrossRef] [PubMed] [Green Version]
  24. Hertel, D.; Harteveld, M.A.; Leuschner, C. Conversion of a tropical forest into agroforest alters the fine root-related carbon flux to the soil. Soil Biol. Biochem. 2009, 41, 481–490. [Google Scholar] [CrossRef]
  25. Ma, C.; Zhang, W.; Wu, M.; Xue, Y.; Ma, L.; Zhou, J. Effect of aboveground intervention on fine root mass, production, and turnover rate in a Chinese cork oak (Quercus variabilis Blume) forest. Plant Soil 2013, 368, 201–214. [Google Scholar] [CrossRef]
  26. Ma, Z.; Chen, H.Y.H. Effects of species diversity on fine root productivity increase with stand development and associated mechanisms in a boreal forest. J. Ecol. 2017, 105, 237–245. [Google Scholar] [CrossRef]
  27. Liu, C.; Xiang, W.; Lei, P.; Deng, X.; Tian, D.; Fang, X.; Peng, C. Standing fine root mass and production in four Chinese subtropical forests along a succession and species diversity gradient. Plant Soil 2014, 376, 445–459. [Google Scholar] [CrossRef]
  28. Russell, E.A.; Kivlin, N.S.; Hawkes, V.C. Tropical tree species effects on soil pH and biotic factors and the consequences for macroaggregate dynamics. Forests 2018, 9, 184. [Google Scholar] [CrossRef]
  29. Shu, W.; Shen, X.; Lei, P.; Xiang, W.; Ouyang, S.; Yan, W. Temporal changes of fine root overyielding and foraging strategies in planted monoculture and mixed forests. BMC Ecol. 2018, 18, 9. [Google Scholar] [CrossRef] [PubMed]
  30. Xiang, W.; Fan, G.; Lei, P.; Zeng, Y.; Tong, J.; Fang, X.; Deng, X.; Peng, C. Fine root interactions in subtropical mixed forests in China depend on tree species composition. Plant Soil 2015, 395, 335–349. [Google Scholar] [CrossRef]
  31. Brassard, B.W.; Chen, H.Y.H.; Bergeron, Y.; Paré, D. Differences in fine root productivity between mixed- and single-species stands. Funct. Ecol. 2011, 25, 238–246. [Google Scholar] [CrossRef]
  32. Brassard, B.W.; Chen, H.Y.H.; Cavard, X.; Laganière, J.; Reich, P.B.; Bergeron, Y.; Paré, D.; Yuan, Z. Tree species diversity increases fine root productivity through increased soil volume filling. J. Ecol. 2013, 101, 210–219. [Google Scholar] [CrossRef]
  33. Liu, B.; Li, H.; Zhu, B.; Koide, R.T.; Eissenstat, D.M.; Guo, D. Complementarity in nutrient foraging strategies of absorptive fine roots and arbuscular mycorrhizal fungi across 14 coexisting subtropical tree species. New Phytol. 2015, 208, 125–136. [Google Scholar] [CrossRef] [PubMed] [Green Version]
  34. Jacob, A.; Hertel, D.; Leuschner, C. Diversity and species identity effects on fine root productivity and turnover in a species-rich temperate broad-leaved forest. Funct. Plant Biol. 2014, 41, 678–689. [Google Scholar] [CrossRef]
  35. Hooper, D.U.; Chapin, F.S.; Ewel, J.J.; Hector, A.; Inchausti, P.; Lavorel, S.; Lawton, J.H.; Lodge, D.M.; Loreau, M.; Naeem, S.; et al. Effects of biodiversity on ecosystem functioning: A consensus of current knowledge. Ecol. Monogr. 2005, 75, 3–35. [Google Scholar] [CrossRef] [Green Version]
  36. De Kroon, H.; Hendriks, M.; van Ruijven, J.; Ravenek, J.; Padilla, F.M.; Jongejans, E.; Visser, E.J.W.; Mommer, L. Root responses to nutrients and soil biota: Drivers of species coexistence and ecosystem productivity. J. Ecol. 2012, 100, 6–15. [Google Scholar] [CrossRef]
  37. Richards, A.E.; Forrester, D.I.; Bauhus, J.; Schererlorenzen, M. The influence of mixed tree plantations on the nutrition of individual species: A review. Tree Physiol. 2010, 30, 1192–1208. [Google Scholar] [CrossRef] [PubMed]
  38. Bolte, A.; Villanueva, I. Interspecific competition impacts on the morphology and distribution of fine roots in European beech (Fagus sylvatica L.) and Norway spruce (Picea abies (L.) Karst.). Eur. J. For. Res. 2006, 125, 15–26. [Google Scholar] [CrossRef]
  39. Beyer, F.; Hertel, D.; Jung, K.; Fender, A.-C.; Leuschner, C. Competition effects on fine root survival of Fagus sylvatica and Fraxinus excelsior. For. Ecol. Manag. 2013, 302, 14–22. [Google Scholar] [CrossRef]
  40. Lei, P.; Scherer-Lorenzen, M.; Bauhus, J. The effect of tree species diversity on fine-root production in a young temperate forest. Oecologia 2012, 169, 1105–1115. [Google Scholar] [CrossRef] [PubMed]
  41. Ma, Z.; Chen, H.Y.H. Positive species mixture effects on fine root turnover and mortality in natural boreal forests. Soil Biol. Biochem. 2018, 121, 130–137. [Google Scholar] [CrossRef]
  42. Zadworny, M.; McCormack, M.L.; Żytkowiak, R.; Karolewski, P.; Mucha, J.; Oleksyn, J. Patterns of structural and defense investments in fine roots of Scots pine (Pinus sylvestris L.) across a strong temperature and latitudinal gradient in Europe. Glob. Chang. Biol. 2017, 23, 1218–1231. [Google Scholar] [CrossRef] [PubMed]
  43. Di Iorio, A.; Montagnoli, A.; Terzaghi, M.; Scippa, G.S.; Chiatante, D. Effect of tree density on root distribution in Fagus sylvatica stands: A semi-automatic digitising device approach to trench wall method. Trees 2013, 27, 1503–1513. [Google Scholar] [CrossRef] [Green Version]
  44. Chen, W.; Zhang, Q.; Cihlar, J.; Bauhus, J.; Price, D.T. Estimating fine-root biomass and production of boreal and cool temperate forests using aboveground measurements: A new approach. Plant Soil 2004, 265, 31–46. [Google Scholar] [CrossRef]
  45. Finér, L.; Ohashi, M.; Noguchi, K.; Hirano, Y. Fine root production and turnover in forest ecosystems in relation to stand and environmental characteristics. For. Ecol. Manag. 2011, 262, 2008–2023. [Google Scholar] [CrossRef]
  46. Meng, S.; Jia, Q.; Zhou, G.; Zhou, H.; Liu, Q.; Yu, J. Fine root biomass and its relationship with aboveground traits of Larix gmelinii trees in Northeastern China. Forests 2018, 9, 35. [Google Scholar] [CrossRef]
  47. Sun, Z.; Liu, X.; Schmid, B.; Bruelheide, H.; Bu, W.; Ma, K. Positive effects of tree species richness on fine-root production in a subtropical forest in SE-China. J. Plant Ecol. 2017, 10, 146–157. [Google Scholar] [CrossRef]
  48. Zhang, Y.; Cai, X.; Lv, J. Size and dynamics of soil organic carbon stock in cropland of the Eastern Qinghai-Tibetan Plateau. Agric. Ecosyst. Environ. 2016, 222, 125–132. [Google Scholar] [CrossRef]
  49. Zhang, Y.; Gu, F.; Liu, S.; Liu, Y.; Li, C. Variations of carbon stock with forest types in subalpine region of southwestern China. For. Ecol. Manag. 2013, 300, 88–95. [Google Scholar] [CrossRef]
  50. Chen, B.; Liu, S.; Ge, J.; Chu, J. Annual and seasonal variations of Q10 soil respiration in the sub-alpine forests of the Eastern Qinghai-Tibet Plateau, China. Soil Biol. Biochem. 2010, 42, 1735–1742. [Google Scholar] [CrossRef]
  51. Meng, Z. A study on community structure and species diversity of subalpine forests in western Sichuan. J. Sichuan Agric. Univ. 2007, 25, 441–446. (In Chinese) [Google Scholar]
  52. Fang, X.; Yu, D.; Zhou, W.; Zhou, L.; Dai, L. The effects of forest type on soil microbial activity in Changbai Mountain, Northeast China. Ann. For. Sci. 2016, 73, 473–482. [Google Scholar] [CrossRef] [Green Version]
  53. Iuss Working Group Wrb. World Reference Base for Soil Resources 2014, Update 2015 International Soil Classification System for Naming Soils and Creating Legends for Soil Maps; World Soil Resources Reports No. 106; FAO: Rome, Italy, 2015. [Google Scholar]
  54. Xu, Z.; Zhu, J.; Wu, F.; Liu, Y.; Tan, B.; Yang, W. Effects of litter quality and climate change along an elevational gradient on litter decomposition of subalpine forests, Eastern Tibetan Plateau, China. J. For. Res. 2016, 27, 505–511. [Google Scholar] [CrossRef]
  55. Pang, X.; Ning, W.; Qing, L.; Bao, W. The relation among soil microorganism, enzyme activity and soil nutrients under subalpine coniferous forest in Western Sichuan. Acta Ecol. Sin. 2009, 29, 286–292. [Google Scholar] [CrossRef]
  56. Huang, G.; Zhao, X.Y.; Su, Y.G.; Zhao, H.L.; Zhang, T.H. Vertical distribution, biomass, production and turnover of fine roots along a topographical gradient in a sandy shrubland. Plant Soil 2008, 308, 201–212. [Google Scholar] [CrossRef]
  57. Xiong, Y.; Liu, X.; Guan, W.; Liao, B.; Chen, Y.; Li, M.; Zhong, C. Fine root functional group based estimates of fine root production and turnover rate in natural mangrove forests. Plant Soil 2017, 413, 83–95. [Google Scholar] [CrossRef]
  58. Konôpka, B.; Noguchi, K.; Sakata, T.; Takahashi, M.; Konôpková, Z. Fine root dynamics in a Japanese cedar (Cryptomeria japonica) plantation throughout the growing season. For. Ecol. Manag. 2006, 225, 278–286. [Google Scholar] [CrossRef]
  59. Vogt, K.A.; Persson, H. Measuring growth and development of roots. In Techniques and Approaches in Forest Tree Ecophysiology; Lassoie, J.P., HIckler, T.M., Eds.; CRC Press: Boca Raton, FL, USA, 1991. [Google Scholar]
  60. Sparks, D.L.; Page, A.L.; Helmke, P.A.; Loeppert, R.H.; Soltanpour, P.N.; Tabatabai, M.A.; Johnston, C.T.; Sumner, M.E. Methods of Soil Analysis; ASA, CSSA and SSSA: Madison, WI, USA, 1996; pp. 961–1010. [Google Scholar]
  61. Brunner, I.; Bakker, M.R.; Björk, R.G.; Hirano, Y.; Lukac, M.; Aranda, X.; Børja, I.; Eldhuset, T.D.; Helmisaari, H.S.; Jourdan, C.; et al. Fine-root turnover rates of European forests revisited: An analysis of data from sequential coring and ingrowth cores. Plant Soil 2013, 362, 357–372. [Google Scholar] [CrossRef] [Green Version]
  62. Fairley, R.I.; Alexander, I.J. Methods of calculating fine root production in forests. In Ecological Interactions in Soil: Plants, Microbes and Animals; Fitter, A.H., Atkinson, D., Read, D., Eds.; Blackwell Scientific Publications: Oxford, UK, 1985; pp. 37–42. [Google Scholar]
  63. Wang, C.; Han, S.; Zhou, Y.; Zhang, J.; Zheng, X.; Dai, G.; Li, M.-H. Fine root growth and contribution to soil carbon in a mixed mature Pinus koraiensis forest. Plant Soil 2016, 400, 275–284. [Google Scholar] [CrossRef]
  64. Zhou, Y.; Su, J.; Janssens, I.A.; Zhou, G.; Xiao, C. Fine root and litterfall dynamics of three Korean pine (Pinus koraiensis) forests along an altitudinal gradient. Plant Soil 2014, 374, 19–32. [Google Scholar] [CrossRef]
  65. Wang, S.; Wang, Z.; Gu, J. Variation patterns of fine root biomass, production and turnover in Chinese forests. J. For. Res. 2017, 28, 1185–1194. [Google Scholar] [CrossRef]
  66. Peichl, M.; Arain, M.A. Above- and belowground ecosystem biomass and carbon pools in an age-sequence of temperate pine plantation forests. Agric. For. Meteorol. 2006, 140, 51–63. [Google Scholar] [CrossRef]
  67. McCormack, M.L.; Adams, T.S.; Smithwick, E.A.H.; Eissenstat, D.M. Variability in root production, phenology, and turnover rate among 12 temperate tree species. Ecology 2014, 95, 2224–2235. [Google Scholar] [CrossRef] [PubMed]
  68. Liu, C.; Xiang, W.H.; Tian, D.L.; Fang, X.; Peng, C.H. Overyielding of fine root biomass as increasing plant species richness in subtropical forests in central southern China. Chin. J. Plant Ecol. 2011, 35, 539–550, (In Chinese with English Abstract). [Google Scholar] [CrossRef]
  69. Meinen, C.; Hertel, D.; Leuschner, C. Biomass and morphology of fine roots in temperate broad-leaved forests differing in tree species diversity: Is there evidence of below-ground overyielding? Oecologia 2009, 161, 99–111. [Google Scholar] [CrossRef] [PubMed]
  70. Domisch, T.; Finér, L.; Dawud, S.M.; Vesterdal, L.; Raulund-Rasmussen, K. Does species richness affect fine root biomass and production in young forest plantations? Oecologia 2015, 177, 581–594. [Google Scholar] [CrossRef] [PubMed]
  71. Brassard, B.W.; Chen, H.Y.H.; Bergeron, Y. Influence of environmental variability on root dynamics in northern forests. Crit. Rev. Plant Sci. 2009, 28, 179–197. [Google Scholar] [CrossRef]
  72. Quan, X.; Wang, C.; Zhang, Q.; Wang, X.; Luo, Y.; Bond-Lamberty, B. Dynamics of fine roots in five Chinese temperate forests. J. Plant Res. 2010, 123, 497–507. [Google Scholar] [CrossRef] [PubMed]
  73. Persson, H.Å.; Stadenberg, I. Spatial distribution of fine-roots in boreal forests in eastern Sweden. Plant Soil 2009, 318, 1–14. [Google Scholar] [CrossRef]
  74. Chen, H.Y.H.; Brassard, B.W. Intrinsic and extrinsic controls of fine root life span. Crit. Rev. Plant Sci. 2013, 32, 151–161. [Google Scholar] [CrossRef]
  75. Persson, H.Å.; Stadenberg, I. Fine root dynamics in a Norway spruce forest (Picea abies (L.) Karst) in eastern Sweden. Plant Soil 2010, 330, 329–344. [Google Scholar] [CrossRef]
  76. Xiao, C.W.; Sang, W.G.; Wang, R.Z. Fine root dynamics and turnover rate in an Asia white birch forest of Donglingshan Mountain, China. For. Ecol. Manag. 2008, 255, 765–773. [Google Scholar] [CrossRef]
  77. Ma, Z.; Chen, H.Y.H. Effects of species diversity on fine root productivity in diverse ecosystems: A global meta-analysis. Glob. Ecol. Biogeogr. 2016, 25, 1387–1396. [Google Scholar] [CrossRef]
  78. Wardle, D.A. Communities and Ecosystems: Linking the Aboveground and Belowground Components; Princeton University Press: Princeton, NJ, USA, 2002; pp. 387–392. [Google Scholar]
  79. McCormack, L.M.; Adams, T.S.; Smithwick, E.A.H.; Eissenstat, D.M. Predicting fine root lifespan from plant functional traits in temperate trees. New Phytol. 2012, 195, 823–831. [Google Scholar] [CrossRef] [PubMed] [Green Version]
  80. Yang, Y.S.; Chen, G.S.; Lin, P.; Xie, J.S.; Guo, J.F. Fine root distribution, seasonal pattern and production in four plantations compared with a natural forest in Subtropical China. Ann. For. Sci. 2004, 61, 617–627. [Google Scholar] [CrossRef] [Green Version]
  81. Liu, S.; Yang, H.; Luo, D.; Shi, Z.; Liu, Q.; Zhang, L. Seasonal dynamics of soil respiration and gross nitrification rate of different forests in the subalpine of western Sichuan. Acta Ecol. Sin. 2019, in press (In Chinese with English Abstract). [Google Scholar] [CrossRef]
  82. Zou, T.; Zhang, Z.; Li, N.; Yuan, Y.; Zheng, D.; Liu, Q.; Yin, H. Differential uptakes of different forms of soil nitrogen among major tree species in subalpine coniferous forests of western Sichuan, China. Chin. J. Plant Ecol. 2017, 41, 1051–1059, (In Chinese with English Abstract). [Google Scholar]
  83. Burton, A.J.; Pregitzer, K.S.; Hendrick, R.L. Relationships between fine root dynamics and nitrogen availability in Michigan northern hardwood forests. Oecologia 2000, 125, 389–399. [Google Scholar] [CrossRef] [PubMed]
  84. Tierney, G.L.; Fahey, T.J.; Groffman, P.M.; Hardy, J.P.; Fitzhugh, R.D.; Driscoll, C.T. Soil freezing alters fine root dynamics in a northern hardwood forest. Biogeochemistry 2001, 56, 175–190. [Google Scholar] [CrossRef]
  85. Silver, W.L.; Miya, R.K. Global patterns in root decomposition: Comparisons of climate and litter quality effects. Oecologia 2001, 129, 407–419. [Google Scholar] [CrossRef] [PubMed]
  86. Tierney, G.L.; Fahey, T.J.; Groffman, P.M.; Hardy, J.P.; Fitzhugh, R.D.; Driscoll, C.T.; Yavitt, J.B. Environmental control of fine root dynamics in a northern hardwood forest. Glob. Chang. Biol. 2003, 9, 670–679. [Google Scholar] [CrossRef]
  87. Majdi, H.; Pregitzer, K.; Moren, A.S.; Nylund, J.E.; Ågren, G.I. Measuring fine root turnover in forest ecosystems. Plant Soil 2005, 276, 1–8. [Google Scholar] [CrossRef]
  88. Kurz, W.A.; Kimmins, J.P. Analysis of some sources of error in methods used to determine fine roor production in forest ecosystems: A simulation approach. Can. J. For. Res. 1987, 17, 909–912. [Google Scholar] [CrossRef]
Figure 1. Comparison of biomass (a), necromass (b), biomass: necromass ratio (c), production (d), and turnover rate (e) of fine roots at the soil depth of 0–30 cm among the three forest types (MF = Picea asperata broadleaved mixed forest, NF = Natural secondary forest, PF = Picea asperata plantation forest) during the growing season (May–November). Data are means ± SE (n = 3). Different letters above the columns denote significantly different groups of means among forest types.
Forests 09 00517 g001
Figure 2. Fine root biomass (a) and necromass (b) at the soil profile of 0–30 cm in the three forest types (MF = Picea asperata broadleaved mixed forest, NF = Natural secondary forest, PF = Picea asperata plantation forest) across different seasons. Data are means ± SE (n = 3). Mean values were calculated from three plots of each forest type based on the average area of fine root biomass and necromass from all sampling occasions from each plot. Different letters indicate significant differences between sampling times (p < 0.05).
Forests 09 00517 g002
Figure 3. Mean values of fine root biomass (a), necromass (b), the ratio of fine root biomass to necromass (c), fine root production (d) and turnover rate (e) at different soil depths (0–30 cm) in the three forest types (MF = Picea asperata broadleaved mixed forest, NF = Natural secondary forest, PF = Picea asperata plantation forest). Data are means ± SE (n = 3). Mean values were calculated from three plots of each forest type using the average fine root biomass and necromass, and the ratio between the two from all sampling occasions from each plot. Different lower-case letters indicate significant differences between forest types at the same soil depth.
Forests 09 00517 g003
Figure 4. The changes in soil inorganic N from 0–10 cm soil depth during the growing season. The values represent the average value of three plots. Bars indicate the standard errors (n = 3). June, July, August, September, October, and November represent June, July, August, September, October and November, respectively. MF = Picea asperata broadleaved mixed forest, NF = Natural secondary forest, PF = Picea asperata plantation forest.
Forests 09 00517 g004
Figure 5. Relationships of fine root biomass (a), production (b), and turnover rate (c) with aboveground biomass. MF = Picea asperata broadleaved mixed forest, NF = Natural secondary forest, PF = Picea asperata plantation forest. The values calculated for the aboveground biomass for each forest type are the average values from six plots. Shapes indicate the soil layer: square = 0–10 cm, circle = 10–20 cm, triangle = 20–30 cm. Lines indicate significant relationships (p < 0.05): fine solid = 0–10 cm, thick solid = 10–20 cm, dot = 20–30 cm.
Forests 09 00517 g005
Figure 6. Fine root turnover rate in relation to the quantities of fine root biomass (a) and production (b) across forest types. Shapes indicate soil layer: square = 0–10 cm, circle = 10–20 cm, triangle = 20–30 cm. Lines indicate significant relationships (p < 0.05): fine solid = 0–10 cm, thick solid = 10–20 cm, dot = 20–30 cm.
Forests 09 00517 g006
Table 1. Stand characteristics and site factors of the three forest types: Picea asperata broadleaved mixed forest (MF), natural secondary forest (NF) and Picea asperata plantation forest (PF).
ParametersMFNFPF
OriginArtificial + naturalNaturalArtificial
Average age (year)~28~30~30
Altitude (m)2983~30462971~30292913~2955
SlopeSoutheastSoutheastSoutheast
Stand height (m)6.07 ± 0.39 b10.19 ± 0.96 a8.28 ± 0.33 a
Stand DBH (cm)9.02 ± 0.37 b9.50 ± 0.26 b11.40 ± 0.38 a
Stand density (stem ha−1)2266.67 ± 134.11 a2083.33 ± 151.61 a1433.33 ± 88.19 b
Stand basal area (m2 ha−1)14.41 ± 0.52 a14.67 ± 0.41 a14.65 ± 0.84 a
Aboveground biomass (kg m−2)6.75 ± 0.12 a7.02 ± 0.13 a7.28 ± 0.18 a
Dominant tree species 1Picea asperata Mast. (51.42)Abies faxoniana Rehd. et Wils (36.54)Picea asperata Mast. (100)
Betula albo-sinensis Burk. (23.47)Betula albo-sinensis Burk. (28.09)
Cerasus duclouxii (Koehne) Yu et Li (11.64)Sorbus koehneana Schneid. (10.50)
Sorbus koehneana Schneid. (5.35)Cerasus duclouxii (Koehne) Yu et Li (8.53)
Acer L. (5.02)Betula utilis D. Don (6.11)
Acer L. (5.56)
Tree species diversity0.75 ± 0.06 a0.91 ± 0.04 a0
Soil C content (g kg−1)
0–10 cm47.54 ± 6.89 a48.28 ± 7.84 a33.80 ± 7.59 a
10–20 cm25.84 ± 3.56 a43.92 ± 5.07 a26.93 ± 5.70 a
20–30 cm16.60 ± 2.67 a42.06 ± 8.74 a25.10 ± 5.29 a
Soil N content (g kg−1)
0–10 cm3.02 ± 0.53 a2.73 ± 0.25 a1.95 ± 0.66 a
10–20 cm1.51 ± 0.30 a2.38 ± 0.18 a1.30 ± 0.45 a
20–30 cm0.78 ± 0.16 a2.25 ± 0.36 a1.30 ± 0.53 a
C:N ratio
0–10 cm15.99 ± 0.66 a17.60 ± 1.80 a18.85 ± 2.34 a
10–20 cm17.51 ± 1.00 a18.48 ± 1.72 a22.61 ± 2.86 a
20–30 cm21.86 ± 1.22 a18.53 ± 1.71 a22.28 ± 3.75 a
Values were means ± SE. Stand density, stand basal area, aboveground biomass and tree species diversity were repeated six times, soil C and N contents were repeated three times. Different letters after the values indicate significant differences among forest types (p < 0.05). 1 Data in brackets are the proportion of its aboveground biomass to stand total aboveground biomass.
Table 2. Decision matrix for calculating fine root production [62].
TrendLive
IncreaseDecrease
Dead Blive < ∆BdeadBlive > ∆Bdead
IncreaseP = ∆Blive + ∆BdeadP = ∆Blive + ∆BdeadP = 0
DecreaseP = ∆BliveP = 0
∆ = changes in fine root biomass or necromass between two sampling intervals; P = fine root production; B = fine root biomass; live = living fine roots; dead = dead fine roots.
Table 3. Effects of forest type and soil depth on fine root biomass (FRB), necromass (FRN), the ratio of fine root biomass to necromass (FRB:FRN), fine root production (FRP), and fine root turnover rate (FRT), using a two-way ANOVA.
Sourced.f.FRBFRNFRB:FRNFRPFRT
Type296.42 ***61.69 ***21.17 ***37.25 ***59.56 ***
Depth2417.04 ***217.87 ***11.14 **699.38 ***68.43 ***
Type × Depth466.55 ***14.78 ***3.43 *54.20 ***1.15 NS
d.f. = degree of freedom; NS = no significant (p > 0.05); * = significant (p < 0.05); ** = significant (p < 0.01); *** = significant (p < 0.001).
Table 4. Pearson correlation coefficients and significance (** p < 0.01) between fine root dynamics and soil N availability in soil depth of 0–10 cm across forest types (n = 9). Inorganic N was the sum of ammonium and nitrate. The soil N contents of different months were averaged within each plot for the analysis.
Fine Root DynamicsAmmoniumNitrateInorganic N
Fine root biomass−0.96 **0.07−0.91 **
Fine root production−0.88 **0.04−0.86 **
Fine root turnover rate0.88 **−0.160.80 **

