Article

Estimation and Uncertainty of the Mixing Effects on Scots Pine—European Beech Productivity from National Forest Inventories Data

1
Department of Natural Systems and Resources, School of Forest Engineering and Natural Environment, Universidad Politécnica de Madrid, c/José Novais 10, 28040 Madrid, Spain
2
Department of Forest and Soil Sciences, BOKU University of Natural Resources and Life Sciences, Peter-Jordan-Straße 82, 1190 Wien, Austria
3
Department of Silviculture, Warsaw University of Life Sciences, Nowoursynowska 159, 02-776 Warszawa, Poland
4
Department of Biogeography and Global Change, National Museum of Natural Sciences-CSIC, C/Serrano 115bis, 28006 Madrid, Spain
5
Department of Agriculture and Forest Engineering (EAGROF), University of Lleida, Av. de l’Alcalde Rovira Roure 191, 25198 Lleida, Spain
6
Forest Sciences Centre of Catalonia (CTFC), Crta. de St. Llorenç de Morunys a Port del Comte, 25280 Solsona, Spain
7
Department of Silviculture, Institute of Forest Ecology and Silviculture, University of Agriculture in Krakow, Al. 29 Listopada 46, 31-425 Kraków, Poland
8
TUM School of Life Sciences Weihenstephan, Technische Universität München, Hans-Carl-von-Carlowitz-Platz 2, D-85354 Freising, Bavaria, Germany
9
University Grenoble Alpes, Irstea, UR LESSEM, Centre de Grenoble, F-38402 St-Martin-d’Hères, France
10
Department of Forest Dynamics and Management, Forest Research Center, Instituto Nacional de Investigación y Tecnología Agraria y Alimentaria, INIA, Ctra de la Coruña km 7.5, 28040 Madrid, Spain
11
Sustainable Forest Management Research Institute, University of Valladolid & INIA Avda. Madrid, 34004 Palencia, Spain
*
Author to whom correspondence should be addressed.
Forests 2018, 9(9), 518; https://doi.org/10.3390/f9090518
Submission received: 31 July 2018 / Revised: 22 August 2018 / Accepted: 25 August 2018 / Published: 28 August 2018
(This article belongs to the Special Issue Competition and Facilitation in Mixed Species Forests)

Abstract

:
An increasing amount of research is focusing on comparing productivity in monospecific versus mixed stands, although it is difficult to reach a general consensus as mixing effects differ both in sign (over-yielding or under-yielding) and magnitude depending on species composition as well as on site and stand conditions. While long-term experimental plots provide the best option for disentangling the mixing effects, these datasets are not available for all the existing mixtures nor do they cover large gradients of site factors. The objective of this study was to evaluate the effects and uncertainties of tree species mixing on the productivity of Scots pine–European beech stands along the gradient of site conditions in Europe, using models developed from National and Regional Forest Inventory data. We found a positive effect of pine on beech basal area growth, which was slightly greater for the more humid sites. In contrast, beech negatively affected pine basal area growth, although the effects switched to positive in the more humid sites. However, the uncertainty analysis revealed that the effect on pine at mid- and more humid sites was not-significant. Our results agree with studies developed from a European transect of temporal triplets in the same pine–beech mixtures, confirming the suitability of these datasets and methodology for evaluating mixing effects at large scale.

1. Introduction

Mixed-species forests have attracted the interest of both researchers and managers in recent decades, mainly due to increasing evidence that they provide ecosystem services, such as diversity, nutrient cycling, and adaptation to climate change or disease control, to a greater degree than the monocultures [1,2,3,4,5]. Furthermore, tree species richness has generally been linked to higher productivity not only at regional level [6,7] but also at larger [4,8] or even worldwide scales [9].
Furthermore, for certain species mixtures, productivity in mixed versus monospecific stands has been widely studied [10,11,12,13] although there is a lack of consensus in the findings as it is difficult to generalize the effects of mixture on growth and yield. Numerous publications have reported that the effects of complementarity on productivity may differ in terms of sign (over-yielding or under-yielding) and magnitude depending on species compositions and their traits [14,15], stand structure [16], age [17,18], stand density [12,19], or environmental conditions such as climate or soil [20,21,22]. These factors act as modulators, changing the interactions between a given pair of species when analyzing effects along spatial or temporal gradients [23,24,25,26].
Stand level empirical studies based on long-term experimental plots providing ceteris paribus conditions seem to be the best option for disentangling the mixing effects on productivity and the way in which they are modulated by certain factors [27]. These experimental plots consist of triplets, i.e., one plot located in a mixture of two-species together with two plots in neighboring monocultures. However, these datasets only exist for a limited number of species (e.g., [25,28,29]) and, when available, they rarely cover an appropriate range of desired conditions [21,30]. Hence, the analysis will only reflect the mixing effects under certain conditions. Moreover, some of the experiments were only established relatively recently or consist of temporal triplets [31] which means there is a lack of information about the stand history and therefore it is not always possible to assure that the three plots are at the same stage of stand development or even that they have the same stand densities or site conditions (e.g., soils).
The use of data from large-scale forest inventories, such as national forest inventories (NFI) allows a wider range of species mixtures and other factors to be covered. Moreover, recent studies have shown that these data provide a suitable alternative [13,19,21,32,33]. Although these datasets do not provide the same level of control of the conditions as that provided by the triplets, they present the advantage that they are systematically located across a much broader range of species assemblages, stand characteristics or site conditions [27,32,34]. However, inventory data analyses only provide statistical relationships between species composition and productivity, hence mixing effects could be confounded with hidden drivers affecting productivity, for instance, mixed stands could be located at slightly better sites compared with monocultures or data for mixed stands could be from different periods and different weather conditions [35].
When using inventory data to study the mixing effects on productivity and its variation across spatial and temporal gradients, forest growth or efficiency models are required [32,36]. These models would need to take into account all factors affecting productivity, such as those related to developmental stage or associated with silvicultural practices [21]. However, NFI data rarely provide reliable information in this regard. For example, due to the lack of stand age data in NFIs it is not possible to compare productivity between mixtures and monospecific stands at the same stage of development. This drawback can be partially overcome by comparing stands with the same quadratic mean diameter (e.g., [19]), although this approach does not take into account the differences in growth rates between species. Furthermore, the lack of information with regard to stand history and past management makes it difficult to distinguish between the effects of density and mixing, since mixing species can result in greater stand densities [37]. Moreover, correctly estimating maximum (or potential) densities by species is essential in order to obtain relative densities and species proportions in mixtures, which is probably the most frequently used variable for describing how species occupy growing space at stand level [38,39]. Using species proportions without reference to the potential densities could lead to erroneous conclusions being drawn with regard to over- or under-yielding in the productivity of mixed stands [40,41,42].
Among the studies which have used inventory data, there are considerable differences with regard to the structure of the models, the temporal and spatial scales, and the species and locations tested, which makes it difficult to interpret the results and highlights the need to test the ability of forest growth models to predict the mixing effects [30,36]. Moreover, the use of models always implies a certain degree of uncertainty in the predictions, stemming from different sources of errors such as the model parameter estimates or independent variable sampling and measurement errors [43]. The importance of these errors in predicting growth has been studied in forest science since the mid-1980s, first at plot or stand level and more recently at regional or national level [44], the general consensus being that sampling errors are the most important component of the uncertainty of predictions [45]. When the objective is to analyze the mixing effects, the uncertainty of the models is especially relevant. Despite this, very little information is available regarding the influence of this source of errors on the prediction of mixing effects.
The main objective of this study was to evaluate the effects and uncertainties of tree species mixing on stand productivity using models developed from National and Regional Forest Inventory data and to identify the strengths and limitations of these databases and methods. For this purpose, we used NFI data from five countries for two species which are widely found throughout Europe and are of considerable importance, Scots pine (Pinus sylvestris L.) and European beech (Fagus sylvatica L.). Scots pine covers 12 million ha and European beech 49 million ha across Europe with a potential area for mixtures of 32 million ha [31,46]. The information on these species includes maximum stand density relationships along climate gradients [38] and the effects of mixing have been extensively studied [19,31,45,47]. This may permit better interpretation of our results and allow us to discuss the potential of NFI data.
The specific objectives were (i) to develop stand basal area growth models based on NFI data for monospecific and mixed stands of Scots pine and European beech along a gradient of site conditions in Europe; (ii) to analyze the mixing effects according to the models and the way in which they are influenced by stand density and humidity, as a measure of site climate, and (iii) to assess the uncertainty of the models given the impossibility of controlling all the mixing effects’ modulators in the stands where monospecific and mixed plots are located.

2. Materials and Methods
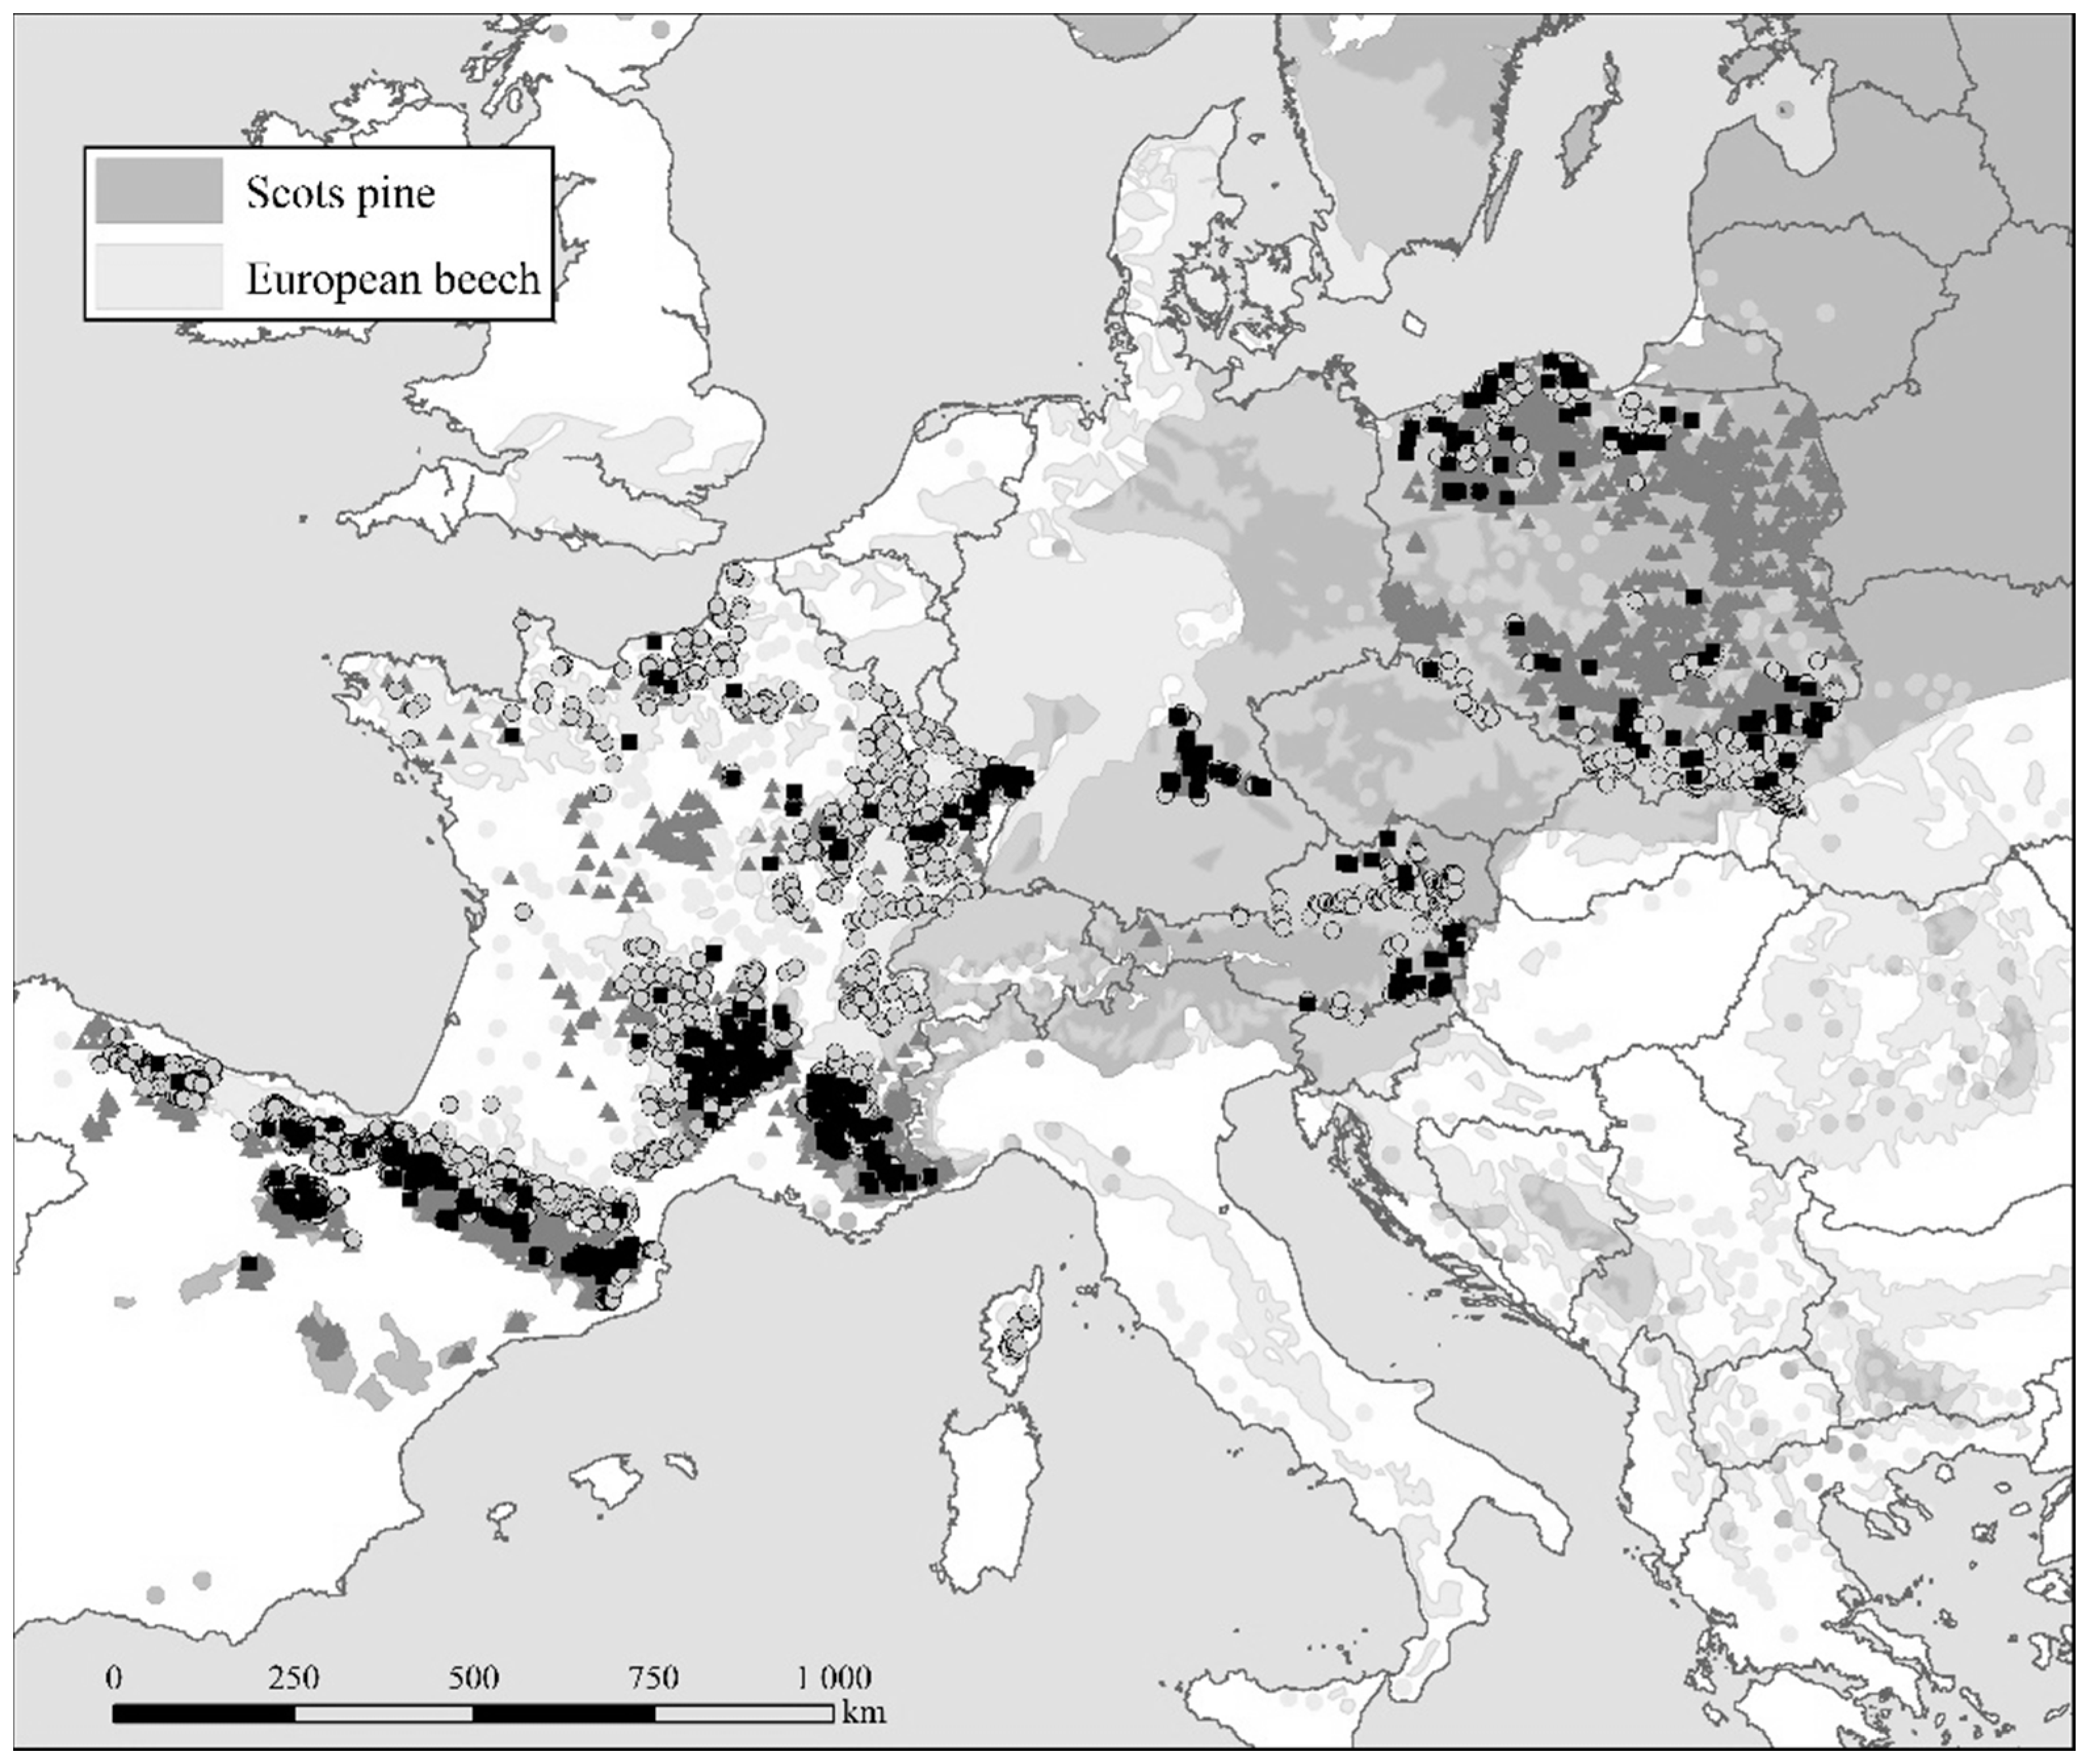
2.1. Data

We used data from National Forest Inventories (NFI) and regional forest inventories (RFI) across five countries—Austria, France, Spain (Spanish NFI and Catalonian RFI separately), Germany (RFI Bavaria), and Poland (Figure 1). Together with the inventory data, mean annual temperature (T, °C) and annual precipitation (P, mm) were provided for each plot. Plots in which thinning treatments affecting more than 5% of total basal area had been applied during the considered growth period were removed from the dataset. Plots’ type and size vary among countries, from the angle count plots in Austria to the concentric sample plots with a different number of radii in most of the other countries. A further description of the plots in each NFI and corresponding climate data for each country can be found in Condés et al. [38]. Using annual precipitation P, in mm, and mean annual temperature T, in °C, the Martonne aridity index [48] was calculated as M = P/(T + 10) and was used as a measure of climatic conditions.
From these data, a total number of 540 sample plots located in mixed stands of Pinus sylvestris and Fagus sylvatica with a Martonne aridity index ranging from 30 to 100 were selected together with 2460 plots in monospecific beech stands and 8109 in monospecific pine stands within the same aridity range, although the plots in monospecific stands and mixtures did not follow the same Martonne aridity index distribution. We considered that a plot belonged to a monospecific stand when the main species accounted for more than 90% of the total basal area and that it was located in a mixture when each species accounted for at least 10% of the total basal area and both species together made up more than 90%. It is important to remark that the selected plots might cover both even and uneven-aged stands as well as different structures (density, spatial distribution, species intermingling or size distribution). Summary statistics of the sample plots used in this study are given in Table 1.

2.2. Basal Area Growth Efficiency Models

With the aim of determining whether the basal area growth per hectare of each species was affected by the mixture effect, i.e., the effect of inter-specific competition is different from that of intra-specific competition, a growth efficiency model (GEsp) was developed. We followed a similar approach to that used in Condés et al. [19], although in this case the relative density of competitor species was considered instead of species proportions given that it has already been shown that mixing effects are modulated by density (see Section 2.2.1). Additionally, the Martonne aridity index as well as its interaction with relative density was included in the model to assess the influence of the humidity gradient given the wider spatial scale of the data used in this study:
log ( G E s p ) = a 0 + a 1 log ( H o ) + a 2 log ( d g s p ) + a 3 log ( R D ) + a 4 log ( M ) + a 5 R D i n t e r + b 1 log ( R D ) · log ( M ) + b 2 R D i n t e r · log ( M ) + ε
where Ho is the plot dominant height (m), dgsp the quadratic mean diameter of the species sp (cm), both together used as surrogates of site quality and age respectively, RD the plot relative density, M the Martonne aridity index and RDinter the relative density of the competitor species as a measure of the inter-specific competition.
The basal area growth efficiency GEsp, i.e., growth per hectare, was defined as the basal area growth, IGsp m2·ha−1·year−1, divided by the proportion by area occupied by this species: G E s p = I G s p / P s p , which allows comparisons to be made between the growth of species sp in monospecific and mixed stands [13].

2.2.1. Relative Density and Species Proportions by Area

The plot relative density (RD) was estimated as the ratio between the number of trees per ha and the number of trees for the same quadratic mean diameter taken from the maximum stand-density lines of each species [50]. For each plot in monospecific or mixed stands, the maximum stem number for the species sp, N m a x s p , was calculated as a function of the species quadratic mean diameter (dgsp in cm) in dependence of M using the maximum size-density relationships for Pinus sylvestris and Fagus sylvatica developed by Condés et al. [38] for the 95th percentile:
N max _ p i n e = ( 339979 2764.14 · M ) · d g p i n e ( 1.9662 + 0.0065 · M )
N max _ b e e c h = e x p ( 10.9 + 0.03 · M ) · d g b e e c h ( 1.2716 0.0091 · M )
The relative densities for each species (RDsp) were obtained as the ratio between the observed number of trees per hectare for the species, Nsp, and the corresponding maximum value:
R D s p = N s p N m a x s p = S D I s p S D I m a x s p
Note that the relative densities calculated as Equation (3) were exactly the same when calculated as the ratio between the stand density index (SDI) and the maximum SDI for the target species; the SDI being the number of stems per hectare for a reference diameter (Equation (2a) or Equation (2b)), for example, of 25 cm [50].
Total plot relative density RD was then calculated as the sum of the relative densities of all species present in the plot, i.e., R D = s p R D s p , and used to estimate species proportion by area (Psp):
P s p = R D s p s p R D s p
this being the estimation of stand-level species proportions, i.e., based on the potentials of each species, recommendable to prevent misinterpretations as regards productivity of mixed stands compared with monospecific stands [40,42].

2.2.2. Model Fitting

In a first step, the model in Equation (1) was fitted for each species using all available data from monospecific and mixed stands, i.e., 8649 sample plots for pine and 3000 plots for beech. Variables were incorporated into the model if they led to a statistically significant improvement in the quality of the model fit as assessed at the α = 0.05 significance level using the F-test based on the extra sum of squares principle.
Since the NFI data come from different countries, with different measurement protocols, a mixed model with random effects in the intercepts and with the country as the grouping structure was used for fitting the models. All models were fitted using the nlme R-package [51], Akaike’s information criterion (AIC) was used for selecting best models and conditional and marginal R2 were used as measures of the goodness-of-fit [52].

2.2.3. Uncertainty Assessment

The number of plots located in monospecific and mixed stands was clearly unbalanced, the number in the former being more than 10 times greater than that of the latter. Hence, when all plots together were used to develop growth efficiency models, this could have led to the models masking, or at least smoothing, the mixing effects. One possibility to address this shortcoming would be to fit the models using a subsample consisting of the same number of plots located in monospecific stands and in mixtures, hereafter referred to as pseudo-triplets. However, there was a lack of control of site conditions in the NFI plots and these conditions may be different between mixed and monospecific plots. Thus, the models developed from this artificial subsampling could be affected by the particularities of the pseudo-triplet selection and therefore the effects of site on growth efficiency could be confounded with the mixing effects.
To address these deficiencies and assess the consequence of not controlling all site conditions, a Monte Carlo bootstrap approach was used to select a set of 1000 different replications of a sample consisting of 540 pseudo-triplets. For each replication, r = 1 … 1000, a bootstrap resample of the same size as the original, i.e., 540 plots, was randomly drawn with replacement from all the plots located in mixed stands. The pseudo-triplets were completed by selecting, randomly and with replacement, 540 plots in monospecific pine stands and 540 in monospecific beech stands. The possible effect of different NFI protocols in different countries was minimized by always selecting the pseudo-triplet within the country. Furthermore, it was controlled that for each pseudo-triplet, the differences between the values of M, dg, and Ho in mixtures and monospecific plots were less than 20% of the corresponding variable range.
The general model (Equation (1)) was refitted for each replication of pseudo-triplets obtaining a set of 1000 models per species; each model developed using 1080 plots, half in monospecific and half in mixed stands. Predictions from these models were used to estimate mean values of basal area growth efficiency in monospecific and mixed stands. The overall means and their corresponding standard errors were then calculated and used to estimate the confidence interval of estimates at the 0.95 confidence level, which corresponds to the uncertainty due to the selection of pseudo-triplets.

3. Results

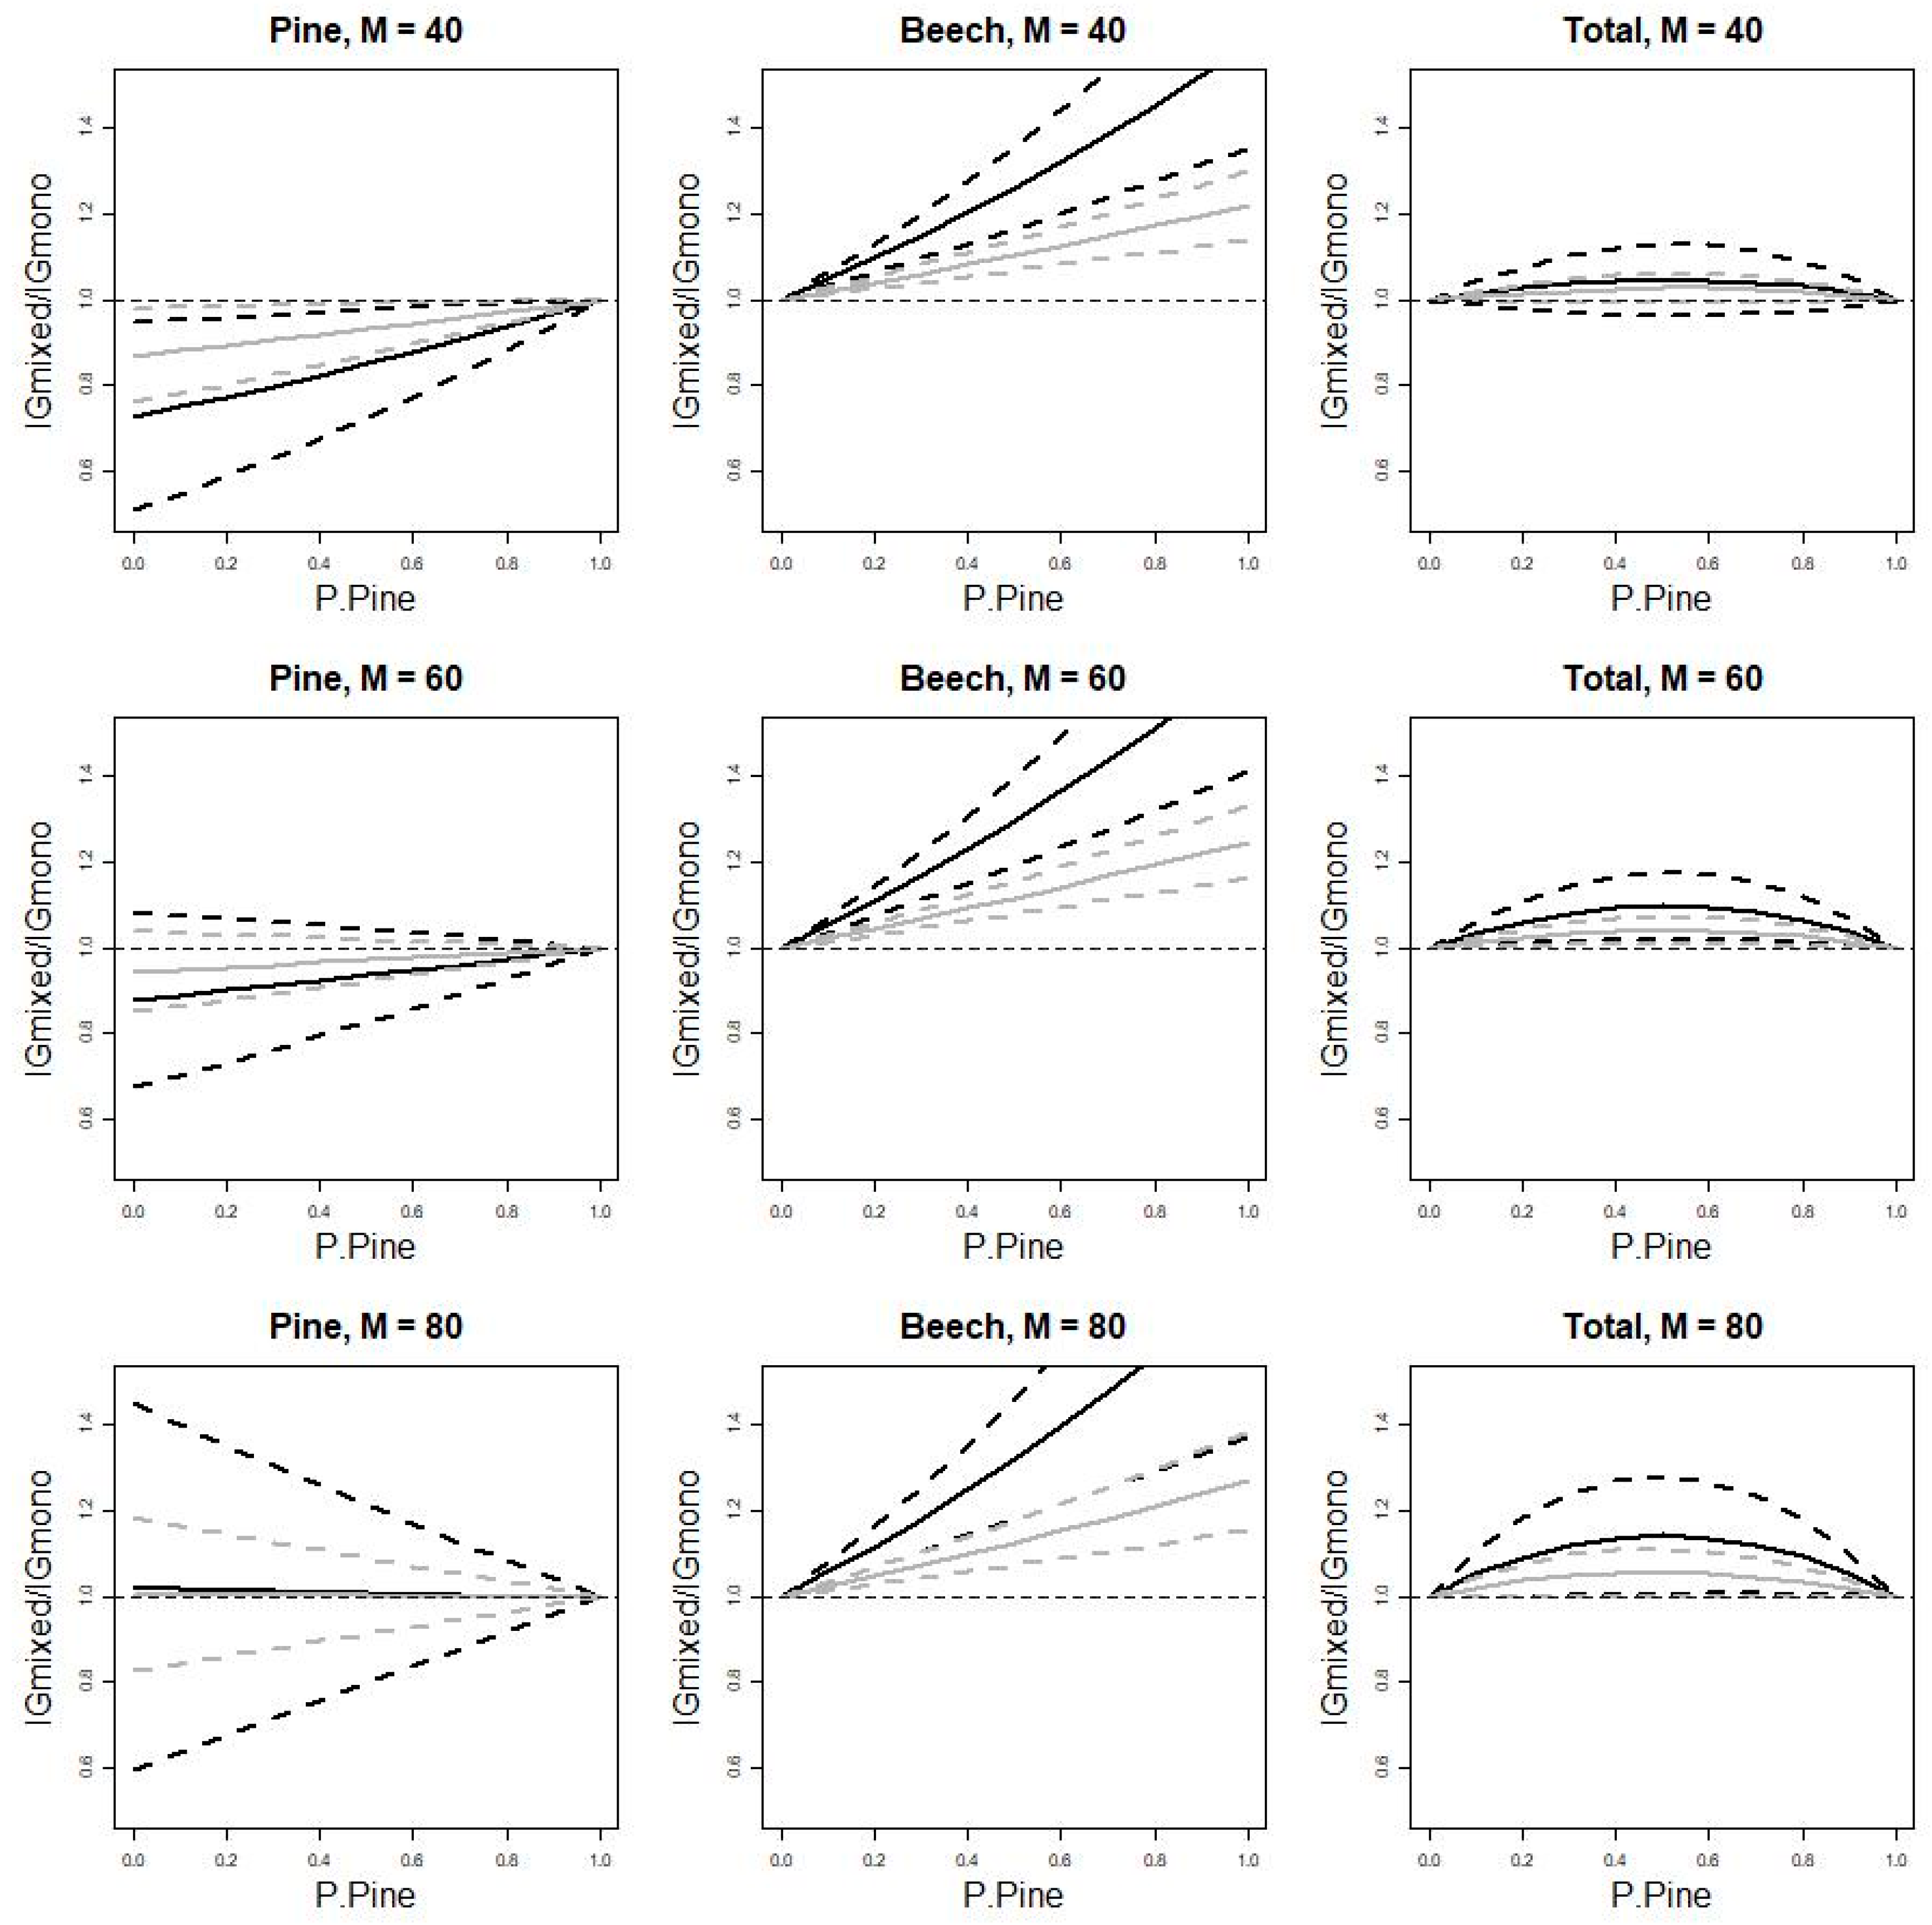
3.1. Mean Mixing Effects on Basal Area Growth

Table 2 shows the estimated coefficients and their corresponding standard errors for the model fitted using all the available data for pine and beech species. For both species the basal area growth efficiency increased when the quadratic mean diameter, as a surrogate of age, decreased (Figure 2a) or the dominant height, as a surrogate of site quality, increased. However the increase in Ho resulted in greater increments in GE for beech than for pine (Figure 2b). Moreover, the growth of both species increased with stocking degree (RD), although the loss in basal area increment when the stocking degree decreased was less for beech than for pine stands (Figure 2c). There was an opposite influence of humidity for each species: basal area growth improved in pine species but was worse in beech when M was higher (Figure 2d). However, in the case of pine the rate of increment decreased at high densities whereas there was no interaction between density and humidity for beech.
According to the models, the mixing effects on the growth efficiency of species depend on the climate. Hence, when comparing monospecific stands and mixed stands with the same relative density (RD), the inter-specific effect on beech basal area growth was always positive as well as greater under more humid conditions, i.e., greater M values (Figure 3). In contrast, the growth efficiency in pine mixtures was less than the corresponding growth efficiency in monospecific stands, although this negative effect changed to positive at the more humid sites, approximately at a Martonne aridity index above 75, regardless of the density of the stands (Figure 4).

3.2. Uncertainty of Mixing Effects

With regard to the mean mixing effects explained in Section 3.1, the confidence intervals of predictions obtained from the pseudo-triplets replication reveal that the mixing effects were not always significant (Figure 5).
In general, the higher the RD the more notable the inter-specific competition effect on over-yielding in both species as well as on total over-yielding, although the effect was positive for beech and negative for pine. However, the confidence intervals were also wider for the more dense stands or as humidity increased (Figure 5). As a result of both density and humidity the effect of mixing on pine did not seem to be significant under medium or high humidity site conditions (Figure 5, Pine M = 60 or Pine M = 80), as the confidence interval for the ratio between growth efficiency in mixed and monospecific stands included the value 1, i.e., both growth efficiencies could be equal. On the other hand, the positive effect that the inter-specific competition had on beech was always significant, regardless of aridity conditions or stand density.
The total basal area growth can be estimated as the sum of the growth of both species. Under the assumption that both species have the same quadratic mean diameter, the ratio between total basal area growth in mixtures and in monospecific stands resulted in values greater than 1 for medium to high humidity conditions while for the driest sites (Figure 5, Total M = 40) the effect ranged from positive to negative.

4. Discussion

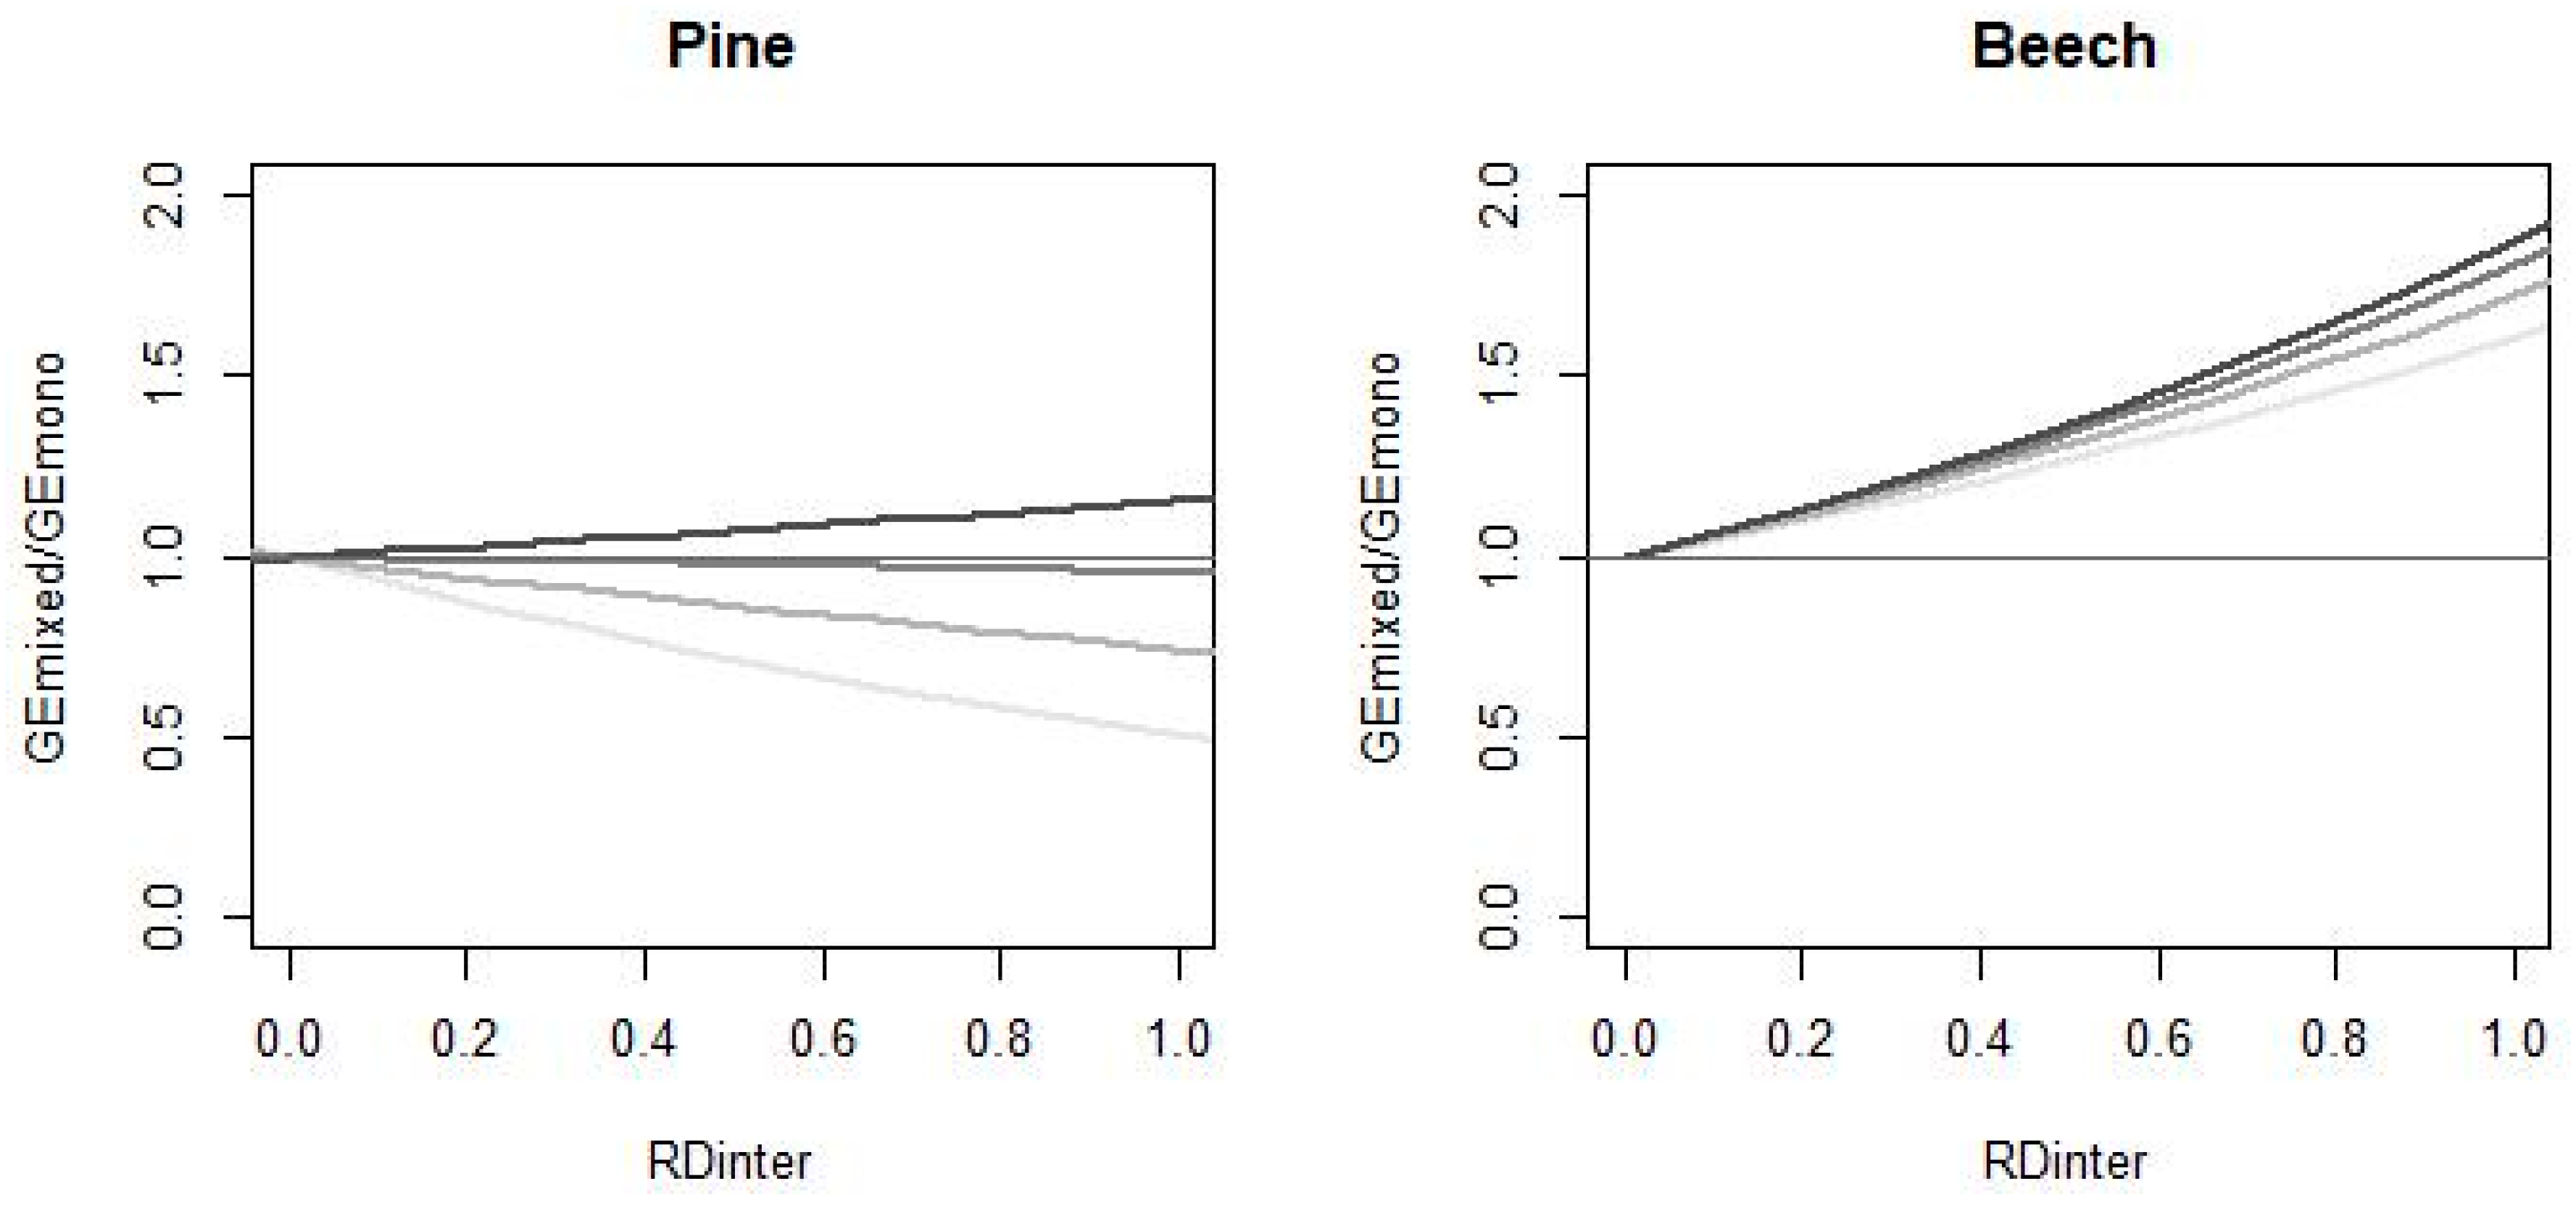
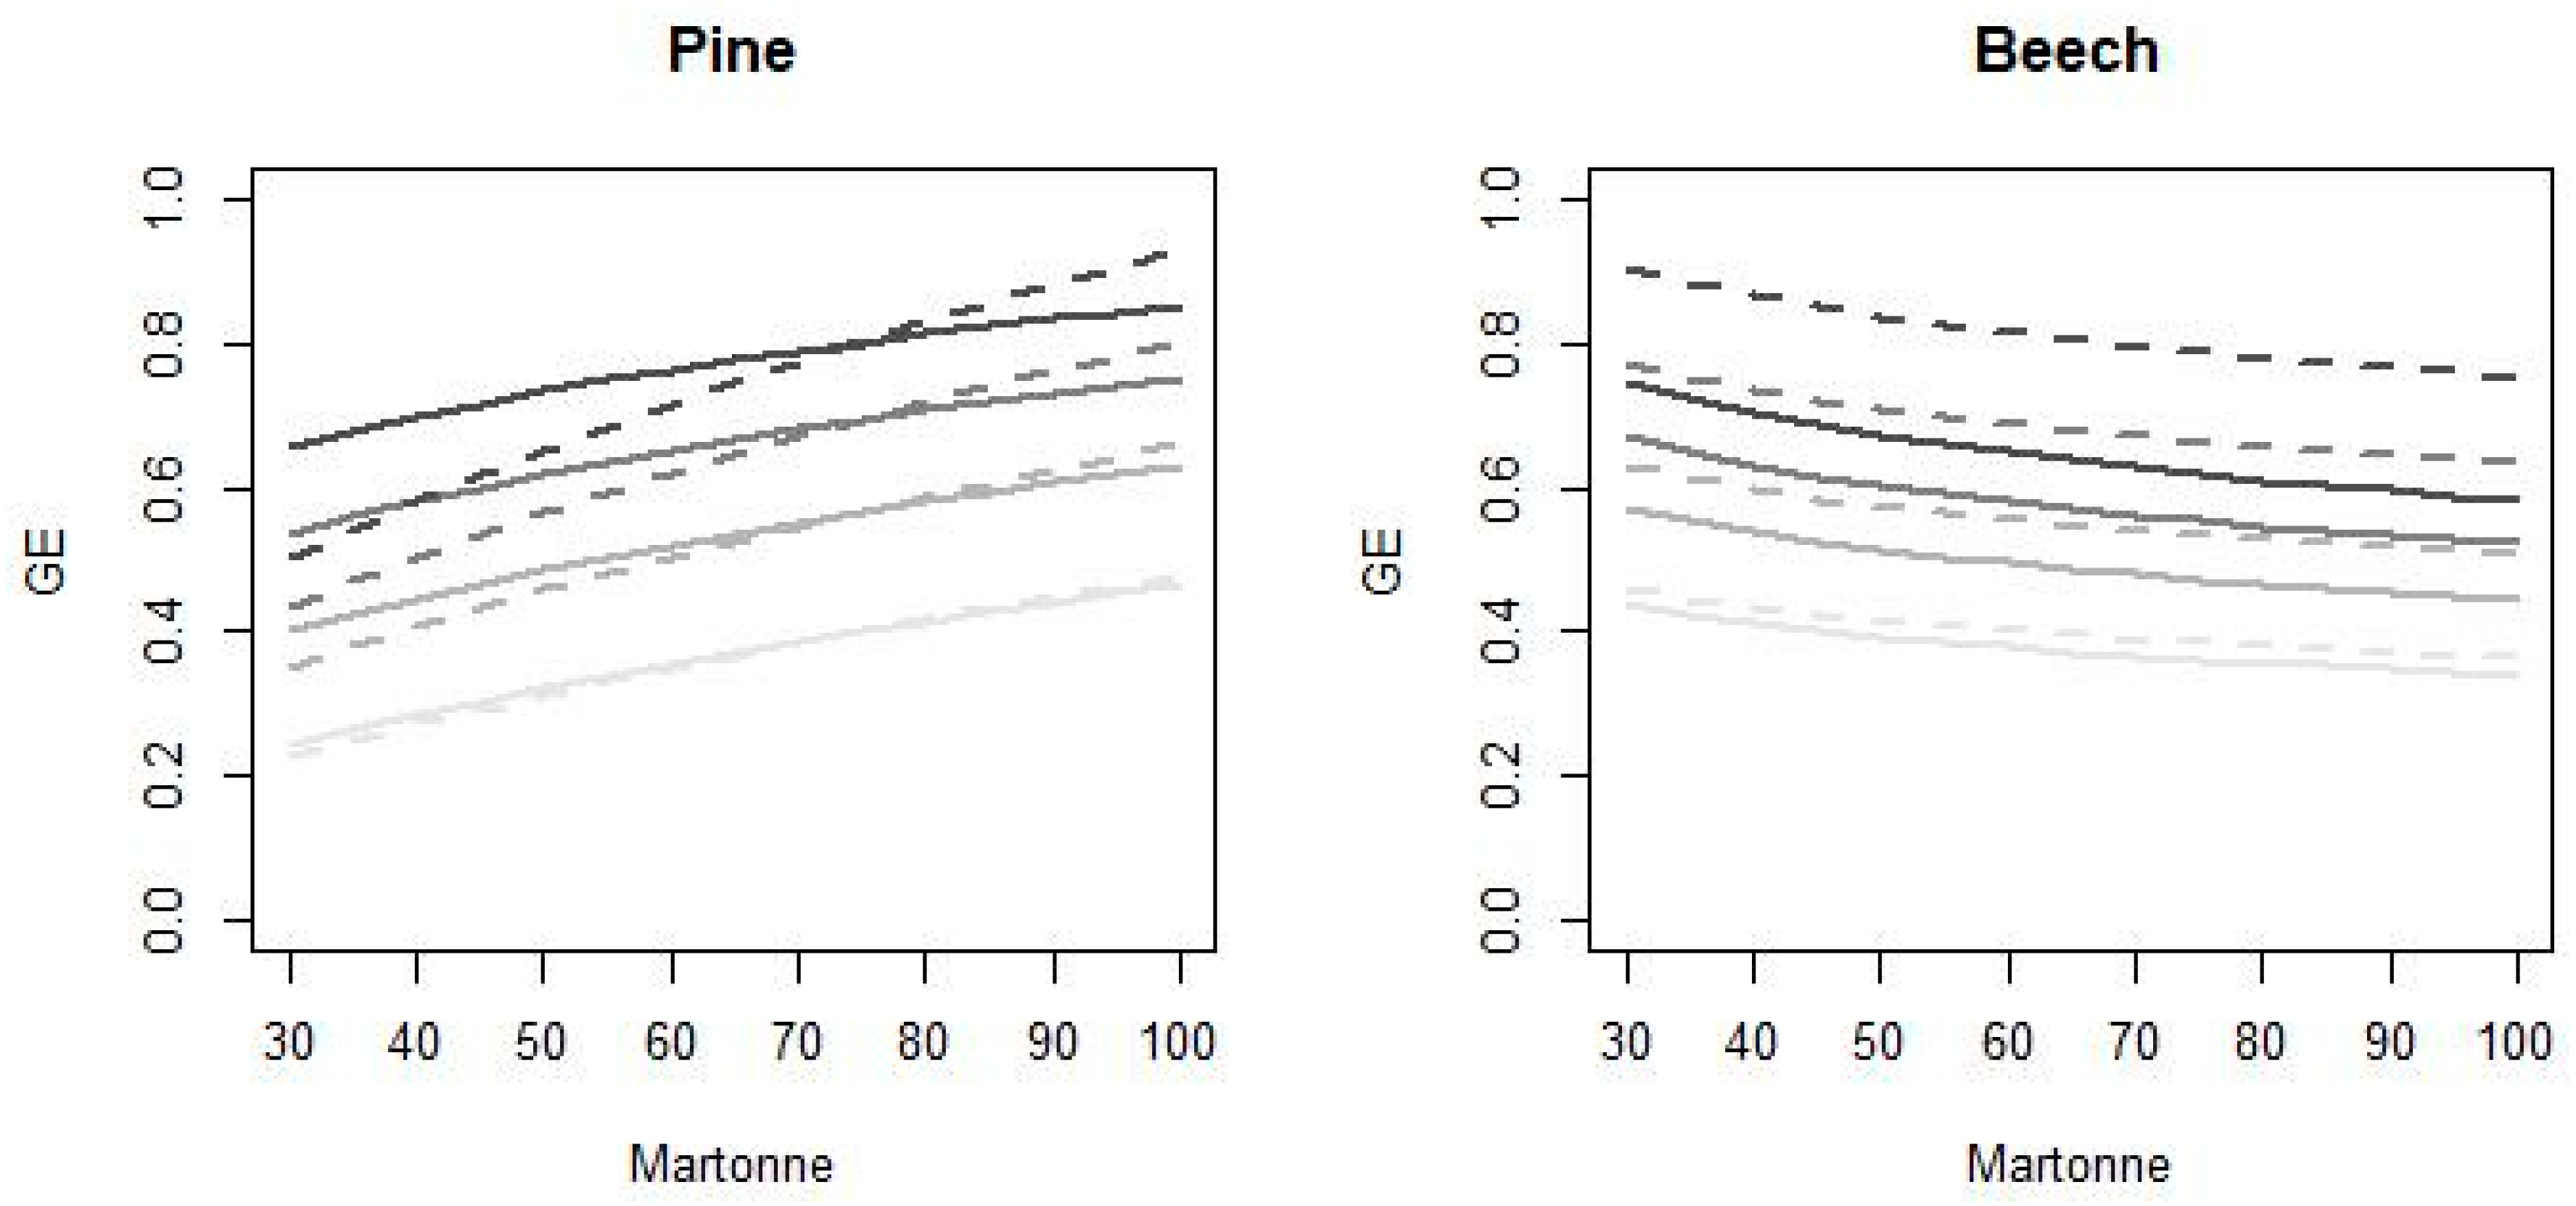
4.1. Species Growth Efficiency According to the General Model

The methodology employed in this study, i.e., the use of National Forest Inventory plots together with growth or efficiency models, has frequently been used to compare productivity between mixtures and the corresponding monospecific stands (e.g., [13,19,33,53]). However, debate surrounds the use of these data for this purpose given the lack of control of the conditions associated with the NFI data, which could result in the mixing effect being confounded with other factors [35,54].
One of the main limitations in the use of these data is the lack of information on stand ages and site quality conditions. In this study, the relationship between dominant height and quadratic mean diameter was used as a surrogate of these data. The stand basal area growth was found to increase with the stand dominant height, which might represent site quality when all the other variables remain constant (Figure 2). Analogously, the stand basal area growth decreases as the quadratic mean diameter increases, which could be interpreted as a proxy of the stand development stage [55]. These two variables have been used successfully as a method to quantify site productivity in other similar studies [56,57] as well as for modelling and analyzing mixing effects [13,19,26].
The Martonne aridity index was used as a measure of site conditions since it was expected that the relationship between species would vary under different climatic conditions [28,29,58]. This index was used as a measure of humidity, although it was positively related with other site conditions such as elevation. Therefore, the generally positive effect of the Martonne index on productivity may be counteracted by elevation as the latter reduces the length of the growing season and productivity [59]. Thus, while the positive effect of M on the pine basal area growth seems to be related to the humidity, the negative effect on beech may be explained as an effect of elevation (Figure 2d).
Furthermore, all models showed an increase in growth with the relative stand density (Figure 2c), although the increment of the pine basal area growth was steeper. This agrees with the findings of Assmann [60], who reported that the critical stocking level for beech was much lower than for Scots pine (Figure 2c). Relative value, i.e., observed density in relation to the maximum density, was used to allow comparison between monospecific and mixed stands otherwise, mixing effects that do not exist could be presumed or the other way around [40]. It is important to note that when working with a large gradient of sites, the use of site-dependent species-specific maximum density lines is critical because the maximum density of a species can differ greatly for a given site [38,61]. In this study, the maximum density lines dependent on the Martonne aridity index developed by Condés et al. [38] as the same mixtures were used, being proven that the methods based on these for calculating species proportions performed correctly [42].
The influence of relative stand density on the mixing effects has been reported in other studies, which have found stronger species interactions at higher growing stocks [12,62]. In the case of beech, the positive effect of growing in a mixture was stronger as stand density increased, which is in agreement with results reported by Condés et al. [19] for the same mixture in the region of Navarra (Spain). However, the observed mixing effects on pine differ between the two studies, in both cases positive and negative effects are reported although in each case dependent on different factors, i.e., species proportion and humidity. This is supported by the lack of significance of mixing effects on pine under medium and high humidity conditions (Figure 5), suggesting high variability in the response of pine.
Comparing our results with the findings of an empirical study based on a pine–beech transect of triplets across Europe [31], we were able to verify the positive effect of pine on beech basal area growth and the non-significant effect of beech on pine. In contrast to our study, no significant effects of the Martonne index on the relative productivity were found in the European transect study, either for total stand or by species. This could be due to the fact that the Martonne index range was narrower in the triplet transect study (usually between 30 and 60 mm/°C) than in our study, or to the much smaller sample size in the triplets transect study, or to the different definition of species proportions, which in the case of the transect study did not consider variation in maximum stand density with site conditions [31].

4.2. Total Stand Over-Yielding

When estimating total over-yielding (Figure 5), both species were considered to have the same quadratic mean diameter, i.e., they reach the same diameter at the same time. However, our data shows that the plots located in mixtures are clearly dominated by pine trees in terms of quadratic mean diameter (on average dgpine/dgbeech is 1.6 with standard deviation 0.7). Only 22% of the plots located in mixtures present a dominance of beech over pines. Similarly, in the European transect study, the mean value of this ratio was 1.47, with only one triplet where the quadratic mean diameter of beech was greater than that of pine in the mixed plot [63,64]. Figure 6 shows that the total over-yielding in the basal area was influenced by the different stages of development of each species. The greater the quadratic mean diameter of pine the greater the total over-yielding, although this effect was more evident when there was a high proportion of pine and humidity was low. This general over-yielding observed when the pines are of a greater size than beech agrees with the findings of Pretzsch et al. [31] who reported over-yielding in terms of stand basal area growth. The opposite effect occurred as the quadratic mean diameter of beech increased, leading to a decrease in the total over-yielding (Figure 6). This finding was especially notable at the less humid sites (M near 30 mm/°C), where the ratio could switch from less than 1 to greater than 1, i.e., from under-yielding to over-yielding, when the European beech was the size-dominant species in the mixtures.
Despite the differences found in the quadratic mean diameters of the species, the methodology may not be the most appropriate to study the contribution of each species to the total over-yielding, as we did not analyze them simultaneously. Other sources of data such as triplets under ceteris paribus conditions or replacement series experiments, where the growth of each species in monospecific and mixed stands can be directly compared, are more suitable for this purpose [31,34]. Furthermore, species mixing may substantially increase stand density [37] and therefore total over-yielding, which cannot be assessed in our approach, highlighting the complexity of species interactions [23].

4.3. Mixing Effect Uncertainty

One of the more innovative aspects of this work is the uncertainty analysis, which allowed us to confirm the mixing effects on some species and/or under certain conditions and to highlight the weakness of other results. Several authors have used similar Monte Carlo techniques for assessing the uncertainty of growth models [44,65]. However these authors generally used the hybrid inference, i.e., the combination of different sources of errors (e.g., sampling and models) in order to determine the total uncertainty of predictions [66,67]. The novel aspect of the present study is that the same technique was used to analyze the mixing effects using inventory data. In this case, model uncertainty becomes essential as the conclusions reached through model predictions will be highly dependent on the data used for parameterization [68].
Unlike the triplets established for analyzing mixtures, the NFI plots are rarely fully stocked [31]. In our data, 75% of plots in monospecific pine stands had a RD of less than 0.73 and less than 0.68 for monospecific beech stands. Hence, the confidence intervals for predictions of the mixing effects at high density levels were greater (Figure 5—dark lines). The same occurred with high Martonne aridity index values when analyzing the mixing effect of pine. Although monospecific stands of pine could be located even at sites with M around 100 mm/°C, most were located at sites with M less than 70 mm/°C, and therefore the results for pine at higher levels of humidity are not conclusive (Figure 5).
The uncertainty analysis decisively influences the reliability of the results and therefore should be taken into account, for instance, when developing more precise silvicultural guidelines for mixed forests. However, to the best of our knowledge, this is the first time that a mixing effects study based on models developed from inventory data goes beyond a discussion of the results and includes any kind of uncertainty analysis.

4.4. Strengths and Limitations of NFI Databases

NFI were originally designed to estimate species distribution and timber stocks and, although their scope has broadened to include new variables, permitting new assessments related to sustainable ecosystem management [69,70], their use in growth modelling has frequently been criticized [71,72]. Critics point to the lack of information on site characteristics, stand age, stand history or past management as the main shortcomings of these databases [27] and suggest that this lack of control of all factors may result in the mixing effects being confounded with other hidden drivers [35]. Similarly, the difficulty to estimate correctly size distribution from NFIs data (due to the concentric sample plots design and the different plot radius between countries) made us give up the inclusion of size structure in the analysis. However recent studies found that stand productivity in mixed stands is related not only to species composition but to size structure (e.g., [73,74,75]). On the other hand, the main advantage of using data from NFIs is that they provide systematic information and therefore there are data of many species mixtures covering larger gradients of site and stand conditions than those available through other sample plots [21,30]. Thus, the NFI data allows us to evaluate interactions between mixing effects and site- and stand conditions.
There is no doubt that long-term experiments, or temporal plots with back-tracing of their history through increment coring like the pine-beech transect we already talked about [31], are of particular interest to quantify the mixing effects. Despite the debate surrounding the use of NFI data for analyzing the effects of mixing given the lack of ceteris paribus control of conditions [27], the fact that our findings agree with the results from pine–beech transect across Europe [31] highlights the suitability of these datasets for evaluating species interactions. Moreover, for many combinations of species, such data, including a wide spectrum of developmental stages, soil, and climatic conditions are rare or non-existent. Therefore, in such cases, NFI data may provide the only possibility for analyzing the mixing effects. However, the results obtained should be treated with caution and always accompanied by uncertainty assessments.

5. Conclusions

The main objective of this study was to evaluate the mixing effects on Scots pine and European beech productivity using models developed from NFI data across the gradient of site conditions in Europe, identifying the strengths and limitations of this approach.
Our results showed that the mixing effects are species specific and are modulated by site humidity as a measure of climatic conditions. We found a positive effect of pine on beech basal area growth, which was slightly greater for the more humid sites. In contrast, beech generally had a negative effect on pine basal area growth, although the effect seems to switch to positive at the more humid sites. Furthermore, the analysis of uncertainties confirmed the positive effect of mixing on beech and suggested a high variability in the response of pine, showing a lack of significance of mixing effects on pine, especially under conditions of medium and high levels of humidity.
The agreement between our results and those from studies developed using data from pine–beech triplets [31], together with the methodology developed for assessing model uncertainty, represent a step forward in the use of NFI datasets to evaluate mixing effects.

Author Contributions

S.C. and H.S. conceptualized this study and designed the methodology. S.C., H.S., K.B., L.C., H.P. and P.V. contributed with computing the required NFI meta-data. S.C. developed models and analysis. S.C., M.d.R. and H.S. led the discussion on interpreting results. All authors critically discussed the results and contributed to the revision of the manuscript drafted by S.C. and M.d.R.

Funding

This research was partially funded by the COST Action FP1206 through the Short Term Scientific Mission COST-STSM-ECOST-STSM-FP1206-091115-068270.

Acknowledgments

This article is based on work from COST Action FP1206 (EuMIXFOR), supported by COST (European Cooperation in Science and Technology). The authors would like to thank the Spanish Ministry of Economy and Competitiveness for funding the research project AGL2014-51964-C2-2-R, which supported part of this study, and to the project CARE4C (# GA 778322). The authors are also grateful to Bayerische Staatsforsten, BaySF for providing the forest inventory data for Bavaria/Germany and to all those who make the National Forest Inventory possible in the different countries, and to those providing the data used for this study. We also thank the German Science Foundation, DFG, for funding the project PR 292/15-1 “Structure and Dynamics of mixed-species stands of Scots pine and European beech in comparison with mono-specific stands”.

Conflicts of Interest

The authors declare no conflict of interest. The funders had no role in the design of the study; in the collection, analyses, or interpretation of data; in the writing of the manuscript, and in the decision to publish the results.

References

  1. Cannell, M.G.R.; Malcolm, D.C.; Robertson, P.A. The Ecology of Mixed-Species Stands of Trees; Blackwell Scientific Publications: Oxford, UK, 1992. [Google Scholar]
  2. Griess, V.C.; Acevedo, R.; Härtl, F.; Staupendahl, K.; Knoke, T. Does mixing tree species enhance stand resistance against natural hazards? A case study for spruce. For. Ecol. Manag. 2012, 267, 284–296. [Google Scholar] [CrossRef]
  3. Jactel, H.; Nicoll, B.C.; Branco, M.; Gonzalez-Olabarria, J.R.; Grodzki, W.; Långström, B.; Moreira, F.; Netherer, S.; Orazio, C.; Piou, D. The influences of forest stand management on biotic and abiotic risks of damage. Ann. For. Sci. 2009, 66, 1–18. [Google Scholar] [CrossRef]
  4. Gamfeldt, L.; Snäll, T.; Bagchi, R.; Jonsson, M.; Gustafsson, L.; Kjellander, P.; Ruiz-Jaen, M.C.; Fröberg, M.; Stendahl, J.; Philipson, C.D. Higher levels of multiple ecosystem services are found in forests with more tree species. Nat. Commun. 2013, 4, 1340. [Google Scholar] [CrossRef] [PubMed] [Green Version]
  5. Brockerhoff, E.G.; Barbaro, L.; Castagneyrol, B.; Forrester, D.I.; Gardiner, B.; González-Olabarria, J.R.; Lyver, P.O.B.; Meurisse, N.; Oxbrough, A.; Taki, H.; et al. Forest biodiversity, ecosystem functioning and the provision of ecosystem services. Biodiv. Conserv. 2017, 26, 3005–3035. [Google Scholar] [CrossRef] [Green Version]
  6. Vilà, M.; Vayreda, J.; Comas, L.; Ibáñez, J.J.; Mata, T.; Obón, B. Species richness and wood production: A positive association in mediterranean forests. Ecol. Lett. 2007, 10, 241–250. [Google Scholar] [CrossRef] [PubMed]
  7. Vilà, M.; Vayreda, J.; Gracia, C.; Ibáñez, J.J. Does tree diversity increase wood production in pine forests? Oecologia 2003, 135, 299–303. [Google Scholar] [CrossRef] [PubMed]
  8. Paquette, A.; Messier, C. The effect of biodiversity on tree productivity: From temperate to boreal forests. Global Ecol. Biogeogr. 2011, 20, 170–180. [Google Scholar] [CrossRef] [Green Version]
  9. Liang, J.; Crowther, T.W.; Picard, N.; Wiser, S.; Zhou, M.; Alberti, G.; Schulze, E.-D.; McGuire, A.D.; Bozzato, F.; Pretzsch, H. Positive biodiversity-productivity relationship predominant in global forests. Science 2016, 354, 8957. [Google Scholar] [CrossRef] [PubMed]
  10. Kelty, M.J. Comparative productivity of monocultures and mixed-species stands. In The Ecology and Silviculture of Mixed-Species Forests; Kelty, M.J., Larson, B.C., Oliver, C.D., Eds.; Kluwer Academic Publishers: Dordrecht, The Netherlands, 1992; Volume 40, pp. 125–141. [Google Scholar]
  11. Brown, A. Functioning of Mixed-Species Stands at Gisburn, NW England; Blackwell Scientific Publications: London, UK, 1992; pp. 125–150. [Google Scholar]
  12. Amoroso, M.M.; Turnblom, E.C. Comparing productivity of pure and mixed douglas-fir and western hemlock plantations in the pacific northwest. Can. J. For. Res. 2006, 36, 1484–1496. [Google Scholar] [CrossRef]
  13. Del Río, M.; Sterba, H. Comparing volume growth in pure and mixed stands of Pinus sylvestris and Quercus pyrenaica. Ann. For. Sci. 2009, 66, 502. [Google Scholar]
  14. Toïgo, M.; Pérot, T.; Courbaud, B.; Castagneyrol, B.; Gégout, J.C.; Longuetaud, F.; Jactel, H.; Vallet, P. Difference in shade tolerance drives the mixture effect on Oak productivity. J. Ecol. 2018, 106, 1073–1082. [Google Scholar] [CrossRef]
  15. Del Río, M.; Condés, S.; Sterba, H. Productividad en Masas mixtas vs. Masas puras: Influencia de la Espesura en la Interacción Entre Especies; Congreso Forestal Español, Sociedad Española de Ciencias Forestales: Pontevedra, Spain, 2013. [Google Scholar]
  16. Bauhus, J.; Van Winden, A.P.; Nicotra, A.B. Aboveground interactions and productivity in mixed-species plantations of acacia mearnsii and eucalyptus globulus. Can. J. For. Res. 2004, 34, 686–694. [Google Scholar] [CrossRef]
  17. Binkley, D.; Greene, S. Production in Mixtures of Conifers and Red Alder: The Importance of Site Fertility and Stand Age; Ballard, R., Gessel, S., Eds.; International Union of Forestry Research Organizations Symposium on Forest Site and Continuous Productivity; US Department of Agriculture and Forest Service: Portland, OR, USA, 1983; pp. 112–117.
  18. Waskiewicz, J.; Kenefic, L.; Weiskittel, A.; Seymour, R. Species mixture effects in northern red oak–eastern white pine stands in maine, USA. For. Ecol. Manag. 2013, 298, 71–81. [Google Scholar] [CrossRef]
  19. Condés, S.; del Río, M.; Sterba, H. Mixing effect on volume growth of Fagus sylvatica and Pinus sylvestris is modulated by stand density. For. Ecol. Manag. 2013, 292, 86–95. [Google Scholar] [CrossRef] [Green Version]
  20. Lu, H.; Condés, S.; del Río, M.; Goudiaby, V.; den Ouden, J.; Mohren, G.M.; Schelhaas, M.-J.; de Waal, R.; Sterck, F.J. Species and soil effects on over-yielding of tree species mixtures in The Netherlands. For. Ecol. Manag. 2018, 409, 105–118. [Google Scholar] [CrossRef]
  21. Toïgo, M.; Vallet, P.; Perot, T.; Bontemps, J.D.; Piedallu, C.; Courbaud, B. Over-yielding in mixed forests decreases with site productivity. J. Ecol. 2015, 103, 502–512. [Google Scholar] [CrossRef]
  22. Jactel, H.; Gritti, E.; Drössler, L.; Forrester, D.; Mason, W.; Morin, X.; Pretzsch, H.; Castagneyrol, B. Positive biodiversity–productivity relationships in forests: Climate matters. Biol. Lett. 2018, 14, 20170747. [Google Scholar] [CrossRef] [PubMed]
  23. Forrester, D.I. The spatial and temporal dynamics of species interactions in mixed-species forests: From pattern to process. For. Ecol. Manag. 2014, 312, 282–292. [Google Scholar] [CrossRef]
  24. Houpert, L.; Rohner, B.; Forrester, D.I.; Mina, M.; Huber, M.O. Mixing effects in Norway spruce—European beech stands are modulated by site quality, stand age and moisture availability. Forests 2018, 9, 83. [Google Scholar] [CrossRef]
  25. Pretzsch, H.; Block, J.; Dieler, J.; Dong, P.H.; Kohnle, U.; Nagel, J.; Spellmann, H.; Zingg, A. Comparison between the productivity of pure and mixed stands of Norway spruce and European beech along an ecological gradient. Ann. For. Sci. 2010, 67, 1–12. [Google Scholar] [CrossRef]
  26. Pretzsch, H.; Bielak, K.; Block, J.; Bruchwald, A.; Dieler, J.; Ehrhart, H.-P.; Kohnle, U.; Nagel, J.; Spellmann, H.; Zasada, M. Productivity of mixed versus pure stands of oak (Quercus petraea (Matt.) Liebl. and Quercus robur L.) and European beech (Fagus sylvatica Ll.) along an ecological gradient. Eur. J. For. Res. 2013, 132, 1–18. [Google Scholar] [CrossRef]
  27. Pretzsch, H.; Forrester, D.I.; Bauhus, J. Mixed-Species Forests; Springer: Berlin, Germany, 2017. [Google Scholar]
  28. Bielak, K.; Dudzińska, M.; Pretzsch, H. Mixed stands of Scots pine (Pinus sylvestris L.) and Norway spruce (Picea abies (L.) Karst) can be more productive than monocultures. Evidence from over 100 years of observation of long-term experiments. For. Syst. 2014, 23, 573–589. [Google Scholar] [CrossRef]
  29. Forrester, D.I.; Kohnle, U.; Albrecht, A.T.; Bauhus, J. Complementarity in mixed-species stands of Abies alba and Picea abies varies with climate, site quality and stand density. For. Ecol. Manag. 2013, 304, 233–242. [Google Scholar] [CrossRef]
  30. Pretzsch, H.; Forrester, D.I.; Rötzer, T. Representation of species mixing in forest growth models. A review and perspective. Ecol. Model. 2015, 313, 276–292. [Google Scholar] [CrossRef] [Green Version]
  31. Pretzsch, H.; del Río, M.; Ammer, C.; Avdagic, A.; Barbeito, I.; Bielak, K.; Brazaitis, G.; Coll, L.; Dirnberger, G.; Drössler, L.; et al. Growth and yield of mixed versus pure stands of Scots pine (Pinus sylvestris L.) and European beech (Fagus sylvatica L.) analysed along a productivity gradient through europe. Eur. J. For. Res. 2015, 134, 927–947. [Google Scholar] [CrossRef] [Green Version]
  32. Mina, M.; Huber, M.O.; Forrester, D.I.; Thürig, E.; Rohner, B. Multiple factors modulate tree growth complementarity in central European mixed forests. J. Ecol. 2017, 106, 1106–1119. [Google Scholar] [CrossRef]
  33. Vallet, P. Silver fir stand productivity is enhanced when mixed with norway spruce: Evidence based on large-scale inventory data and a generic modelling approach. J. Veg. Sci. 2011, 22, 932–942. [Google Scholar] [CrossRef]
  34. Ruiz-Peinado, R.; Heym, M.; Drössler, L.; Condés, S.; Corona, P.; Bravo, F.; Pretzsch, H.; Bravo-Oviedo, A.; del Río, M. Data platforms for mixed forest research: Contributions from the eumixfor network. In Dynamics, Silviculture and Management of Mixed Forests; Bravo-Oviedo, A., Pretzsch, H., del Río, M., Eds.; Springer: Berlin, Germany, 2018. [Google Scholar]
  35. Vilà, M.; Carrillo-Gavilán, A.; Vayreda, J.; Bugmann, H.; Fridman, J.; Grodzki, W.; Haase, J.; Kunstler, G.; Schelhaas, M.; Trasobares, A. Disentangling biodiversity and climatic determinants of wood production. PLoS ONE 2013, 8, e53530. [Google Scholar] [CrossRef] [PubMed] [Green Version]
  36. Forrester, D.I.; Ammer, C.; Annighöfer, P.J.; Avdagic, A.; Barbeito, I.; Bielak, K.; Brazaitis, G.; Coll, L.; del Río, M.; Drössler, L. Predicting the spatial and temporal dynamics of species interactions in Fagus sylvatica and Pinus sylvestris forests across Europe. For. Ecol. Manag. 2017, 405, 112–133. [Google Scholar] [CrossRef]
  37. Pretzsch, H.; Biber, P. Tree species mixing can increase maximum stand density. Can. J. For. Res. 2016, 46, 1179–1193. [Google Scholar] [CrossRef] [Green Version]
  38. Condés, S.; Vallet, P.; Bielak, K.; Bravo-Oviedo, A.; Coll, L.; Ducey, M.J.; Pach, M.; Pretzsch, H.; Sterba, H.; Vayreda, J. Climate influences on the maximum size-density relationship in Scots pine (Pinus sylvestris L.) and European beech (Fagus sylvatica L.) stands. For. Ecol. Manag. 2017, 385, 295–307. [Google Scholar] [CrossRef]
  39. De Río, M.; Pretzsch, H.; Alberdi, I.; Bielak, K.; Bravo, F.; Brunner, A.; Condés, S.; Ducey, M.J.; Fonseca, T.; von Lüpke, N.; et al. Characterization of the structure, dynamics, and productivity of mixed-species stands: Review and perspectives. Eur. J. For. Res. 2016, 135, 23–49. [Google Scholar] [CrossRef]
  40. Sterba, H.; del Río, M.; Brunner, A.; Condés, S. Effect of species proportion definition on the evaluation of growth in pure vs. mixed stands. For. Syst. 2014, 23, 547–559. [Google Scholar] [CrossRef]
  41. Dirnberger, G.F.; Sterba, H. A comparison of different methods to estimate species proportions by area in mixed stands. For. Syst. 2014, 23, 534–546. [Google Scholar] [CrossRef]
  42. Dirnberger, G.; Sterba, H.; Condés, S.; Ammer, C.; Annighöfer, P.; Avdagić, A.; Bielak, K.; Brazaitis, G.; Coll, L.; Heym, M. Species proportions by area in mixtures of Scots pine (Pinus sylvestris L.) and European beech (Fagus sylvatica L.). Eur. J. For. Res. 2017, 136, 171–183. [Google Scholar] [CrossRef]
  43. Kangas, A.S. Methods for assessing uncertainty of growth and yield predictions. Can. J. For. Res. 1999, 29, 1357–1364. [Google Scholar] [CrossRef]
  44. Fortin, M.; Robert, N.; Manso, R. Uncertainty assessment of large-scale forest growth predictions based on a transition-matrix model in catalonia. Ann. For. Sci. 2016, 73, 871–883. [Google Scholar] [CrossRef]
  45. McRoberts, R.E.; Westfall, J.A. Effects of uncertainty in model predictions of individual tree volume on large area volume estimates. For. Sci. 2014, 60, 34–42. [Google Scholar] [CrossRef]
  46. Brus, D.; Hengeveld, G.; Walvoort, D.; Goedhart, P.; Heidema, A.; Nabuurs, G.; Gunia, K. Statistical mapping of tree species over Europe. Eur. J. For. Res. 2012, 131, 145–157. [Google Scholar] [CrossRef]
  47. Vospernik, S.; Nothdurft, A. Can trees at high elevations compensate for growth reductions at low elevations due to climate warming? Can. J. For. Res. 2018, 48, 650–662. [Google Scholar] [CrossRef] [Green Version]
  48. Martonne, E. Une nouvelle fonction climatologique: L’indice d’aridite (a new climatological function: The aridity index). La Météorologie 1926, 2, 449–458. [Google Scholar]
  49. EUFORGEN. Distribution Map of European Beech (Fagus sylvatica L.) and Scots pine (Pinus sylvestris L.). Available online: http://www.euforgen.org (accessed on 4 August 2018).
  50. Reineke, L.H. Perfecting a stand-density index for even-aged forests. J. Agric. Res. 1933, 46, 627–638. [Google Scholar]
  51. Pinheiro, J.; Bates, D.; DebRoy, S.; Sarkar, D. R Core Team (2017) Nlme: Linear and Nonlinear Mixed Effects Models. R Package Version 3.1-131. Available online: http://CRAN. R-project. org/package = nlme (accessed on 4 August 2018).
  52. Maj, A. Lmmfit: Goodness-of-Fit-Measures for Linear Mixed Models with One-Level-Grouping. R package version 2011, 1. Available online: https://www.ncbi.nlm.nih.gov/pmc/articles/PMC5426279/ (accessed on 4 August 2018).
  53. Riofrío, J.; del Río, M.; Bravo, F. Mixing effects on growth efficiency in mixed pine forests. For. Int. J. For. Res. 2017, 90, 381–392. [Google Scholar] [CrossRef]
  54. Vilà, M.; Inchausti, P.; Vayreda, J.; Barrantes, O.; Gracia, C.; Ibáñez, J.; Mata, T. Confounding factors in the observational productivity-diversity relationship in forests. In Forest Diversity and Function; Springer: Berlin/Heidelberg, Germany, 2005; pp. 65–86. [Google Scholar]
  55. Pretzsch, H. Stand density and growth of Norway spruce (Picea abies (L.) Karst.) and European beech (Fagus sylvatica L.): Evidence from long-term experimental plots. Eur. J. For. Res. 2005, 124, 193–205. [Google Scholar] [CrossRef]
  56. Vanclay, J.K.; Henry, N.B. Assessing site productivity of indigenous cypress pine forest in southern Queensland. Commn. For. Rev. 1988, 67, 53. [Google Scholar]
  57. Huang, S.; Titus, S.J. An index of site productivity for uneven-aged or mixed-species stands. Can. J. For. Res. 1993, 23, 558–562. [Google Scholar] [CrossRef]
  58. Meier, E.S.; Edwards, T.C., Jr.; Kienast, F.; Dobbertin, M.; Zimmermann, N.E. Cooccurrence patterns of trees along macroclimatic gradients and their potential influence on the present and future distribution of Fagus sylvatica L. J. Biogeogr. 2011, 38, 371–382. [Google Scholar] [CrossRef]
  59. Prislan, P.; Gričar, J.; de Luis, M.; Smith, K.T.; Čufar, K. Phenological variation in xylem and phloem formation in Fagus sylvatica from two contrasting sites. Agric. For. Meteorol. 2013, 180, 142–151. [Google Scholar] [CrossRef]
  60. Assmann, E. The principles of yield study. In Studies in the Organic Production, Structure, Increment and Yield of Forest Stands; Oxford Pergamon Press: Oxford, UK, 1970. [Google Scholar]
  61. Forrester, D.I.; Pretzsch, H. Tamm review: On the strength of evidence when comparing ecosystem functions of mixtures with monocultures. For. Ecol. Manag. 2015, 356, 41–53. [Google Scholar] [CrossRef]
  62. Garber, S.M.; Maguire, D.A. Stand productivity and development in two mixed-species spacing trials in the central Oregon cascades. For. Sci. 2004, 50, 92–105. [Google Scholar]
  63. Heym, M.; Ruíz-Peinado, R.; del Río, M.; Bielak, K.; Forrester, D.; Dirnberger, G.; Barbeito, I.; Brazaitis, G.; Ruškytė, I.; Coll, L.; et al. Data from: Eumixfor empirical forest mensuration and ring width data from pure and mixed stands of Scots pine (Pinus sylvestris L.) and European beech (Fagus sylvatica L.) through Europe. Dryad Digit. Repos. 2017, 10, 5061. [Google Scholar]
  64. Heym, M.; Ruíz-Peinado, R.; Del Río, M.; Bielak, K.; Forrester, D.I.; Dirnberger, G.; Barbeito, I.; Brazaitis, G.; Ruškytkė, I.; Coll, L.; et al. Eumixfor empirical forest mensuration and ring width data from pure and mixed stands of Scots pine (Pinus sylvestris L.) and European beech (Fagus sylvatica L.) through europe. Ann. For. Sci. 2017, 74, 63. [Google Scholar] [CrossRef]
  65. Condés, S.; McRoberts, R.E. Updating national forest inventory estimates of growing stock volume using hybrid inference. For. Ecol. Manag. 2017, 400, 48–57. [Google Scholar] [CrossRef]
  66. Corona, P.; Fattorini, L.; Franceschi, S.; Scrinzi, G.; Torresan, C. Estimation of standing wood volume in forest compartments by exploiting airborne laser scanning information: Model-based, design-based, and hybrid perspectives. Can. J. For. Res. 2014, 44, 1303–1311. [Google Scholar] [CrossRef]
  67. McRoberts, R.E.; Chen, Q.; Domke, G.M.; Ståhl, G.; Saarela, S.; Westfall, J.A. Hybrid estimators for mean aboveground carbon per unit area. For. Ecol. Manag. 2016, 378, 44–56. [Google Scholar] [CrossRef]
  68. Porté, A.; Bartelink, H. Modelling mixed forest growth: A review of models for forest management. Ecol. Model. 2002, 150, 141–188. [Google Scholar] [CrossRef]
  69. Vidal, C.; Alberdi, I.; Redmond, J.; Vestman, M.; Lanz, A.; Schadauer, K. The role of European national forest inventories for international forestry reporting. Ann. For. Sci. 2016, 73, 793–806. [Google Scholar] [CrossRef]
  70. Tomppo, E.; Gschwantner, T.; Lawrence, M.; McRoberts, R.E. National Forest Inventories: Pathways for Common Reporting; Springer: Berlin, Germany, 2010; p. 601. [Google Scholar]
  71. Álvarez-González, J.; Cañellas, I.; Alberdi, I.; Gadow, K.; Ruiz-González, A. National forest inventory and forest observational studies in spain: Applications to forest modeling. For. Ecol. Manag. 2013, 316, 54–64. [Google Scholar] [CrossRef]
  72. McCullagh, A.; Black, K.; Nieuwenhuis, M. Evaluation of tree and stand-level growth models using national forest inventory data. Eur. J. For. Res. 2017, 136, 1–8. [Google Scholar] [CrossRef]
  73. Dănescu, A.; Albrecht, A.T.; Bauhus, J. Structural diversity promotes productivity of mixed, uneven-aged forests in southwestern Germany. Oecologia 2016, 182, 319–333. [Google Scholar] [CrossRef] [PubMed]
  74. Silva Pedro, M.; Rammer, W.; Seidl, R. Disentangling the effects of compositional and structural diversity on forest productivity. J. Veg. Sci. 2017, 28, 649–658. [Google Scholar] [CrossRef]
  75. Zeller, L.; Liang, J.; Pretzsch, H. Tree species richness enhances stand productivity while stand structure can have opposite effects, based on forest inventory data from Germany and the United States of America. For. Ecosyst. 2018, 5, 4. [Google Scholar] [CrossRef]
Figure 1. Location of the sample plots in monospecific pine stands (dark grey triangles), and monospecific beech stands (light grey circles) and mixtures of both species (black squares) used in this study together with the natural range of both tree species according to EUFORGEN [49].
Forests 09 00518 g001
Figure 2. Influence of (a) quadratic mean diameter (dg, cm); (b) dominant height (Ho, m); (c) relative density (RD) and (d) Martonne aridity index (M, mm/°C) on the basal area growth efficiency (GE) of Scots pine and European beech when the inter-specific competition is null. Lines represent GE for the variable on the x-axis ranging between percentiles 1% and 99% of its values in monospecific stands. Other variables approximately equal to mean values: for pine dg = 25 cm, Ho = 20 m, RD = 0.6 and M = 45 mm/°C; for beech dg = 30 cm, Ho = 20 m, RD = 0.6 and M = 65 mm/°C.
Forests 09 00518 g002
Figure 3. Influence of humidity, defined by the Martonne aridity index M (mm/°C), on the growth efficiency ratios between mixed and monospecific stands (GEmixed/GEmono), reflecting the variation in the inter-specific competition effect on pine and beech.
Forests 09 00518 g003
Figure 4. Comparison between the influence of humidity on the basal growth efficiency (GE m2 ha−1 year−1) of monospecific stands (solid lines) and mixed stands with proportion of competitor species 0.5 (dashed lines), from the least dense (RD = 0.2 light grey) to the most dense stands (RD = 0.8 dark grey), increased gradually by 0.2.
Forests 09 00518 g004
Figure 5. Variation in the ratio between basal area growth in mixtures and monospecific stands (IGmixed/IGmono) together with confidence intervals (dashed lines) versus pine proportion by area (P.Pine) for different humidity (M) and stand density conditions. RD = 0.3 is represented as light grey lines and RD = 0.7 as dark grey lines.
Forests 09 00518 g005
Figure 6. Influence of differences in species diameter on the total basal area growth ratios between total mixed and monospecific stands (IGmixed/IGmono). Dominant height Ho = 20 m and relative density RD = 0.6. Light grey lines for Martonne aridity index M = 30, medium grey lines M = 60, and dark grey lines M = 90 mm/°C. P. Pine and P. Beech represent pine and beech proportion respectively.
Forests 09 00518 g006
Table 1. Summary of the plot data (pine, beech, and mixtures of both species) used in this study. Note that a small number of stems of other species may be present in monospecific or mixed stands.
PineBeechTotal
NdgHoRDIGNdgHoRDIGNdgHoRDIGM
Pine8109 plotsMean75723.518.30.550.65 79422.918.30.560.6745.2
Sd5848.27.80.250.41 5957.87.80.250.4211.9
Min286.82.80.100.01 286.82.80.100.0130.0
Max561267.142.11.873.48 561261.942.11.873.5999.8
Mixtures540 plotsMean30129.719.60.320.3248923.117.30.250.3383823.620.40.580.6753.6
Sd2599.58.50.220.2946614.86.60.170.225518.38.20.250.3614.9
Min145.32.30.020.0157.24.60.020.00757.46.10.110.0730.5
Max210857.943.91.092.212865114.839.31.021.19370156.643.91.463.0299.0
Beech2460 plotsMean 67529.821.10.530.5569829.221.10.540.5764.7
Sd 67914.96.90.250.3268814.46.90.250.3317.9
Min 105.55.60.100.01105.55.60.100.0130.0
Max 8524155.747.51.932.718524155.747.52.032.9899.9
N—number of trees per ha; dg—quadratic mean diameter (cm); Ho—dominant height (m), RD—relative density, IG—basal area growth (m2 ha−1 year−1), M—Martonne aridity index (mm/°C), Sd—standard deviation.
Table 2. Coefficient estimates and their standard errors for the Pine and Beech basal area growth efficiency models fitted using all national forest inventories (NFI) data.
Pine Beech
ValueStandard ErrorValueStandard Error
(Intercept)0.83920.21270.92620.2010
log(Ho)0.27120.02840.48870.0389
log(dgsp)−0.80890.0242−0.62790.0250
log(RD)1.48730.16570.38790.0216
log(M)0.16710.0470−0.20690.0390
log(M)·log(RD)−0.22850.0431ns
RDinter−3.20021.1075ns
log(M)·RDinter0.74240.28110.13900.0172
R2 marginal0.3711 0.3588
R2 conditional0.4946 0.4002
dgsp—quadratic mean diameter of target species(cm); Ho—dominant height (m), RD—relative density, RDinter—relative density of the competitor species, M—Martonne aridity index (mm/°C).

