Interactions between Vegetation, Hydrology, and Litter Inputs on Decomposition and Soil CO2 Efflux of Tropical Forests in the Brazilian Pantanal

 ,
,
Abstract
:
1. Introduction
2. Materials and Methods
2.1. Study Area
2.2. Experimental Design
2.3. Field Data Collection
2.4. Data Analysis
3. Results
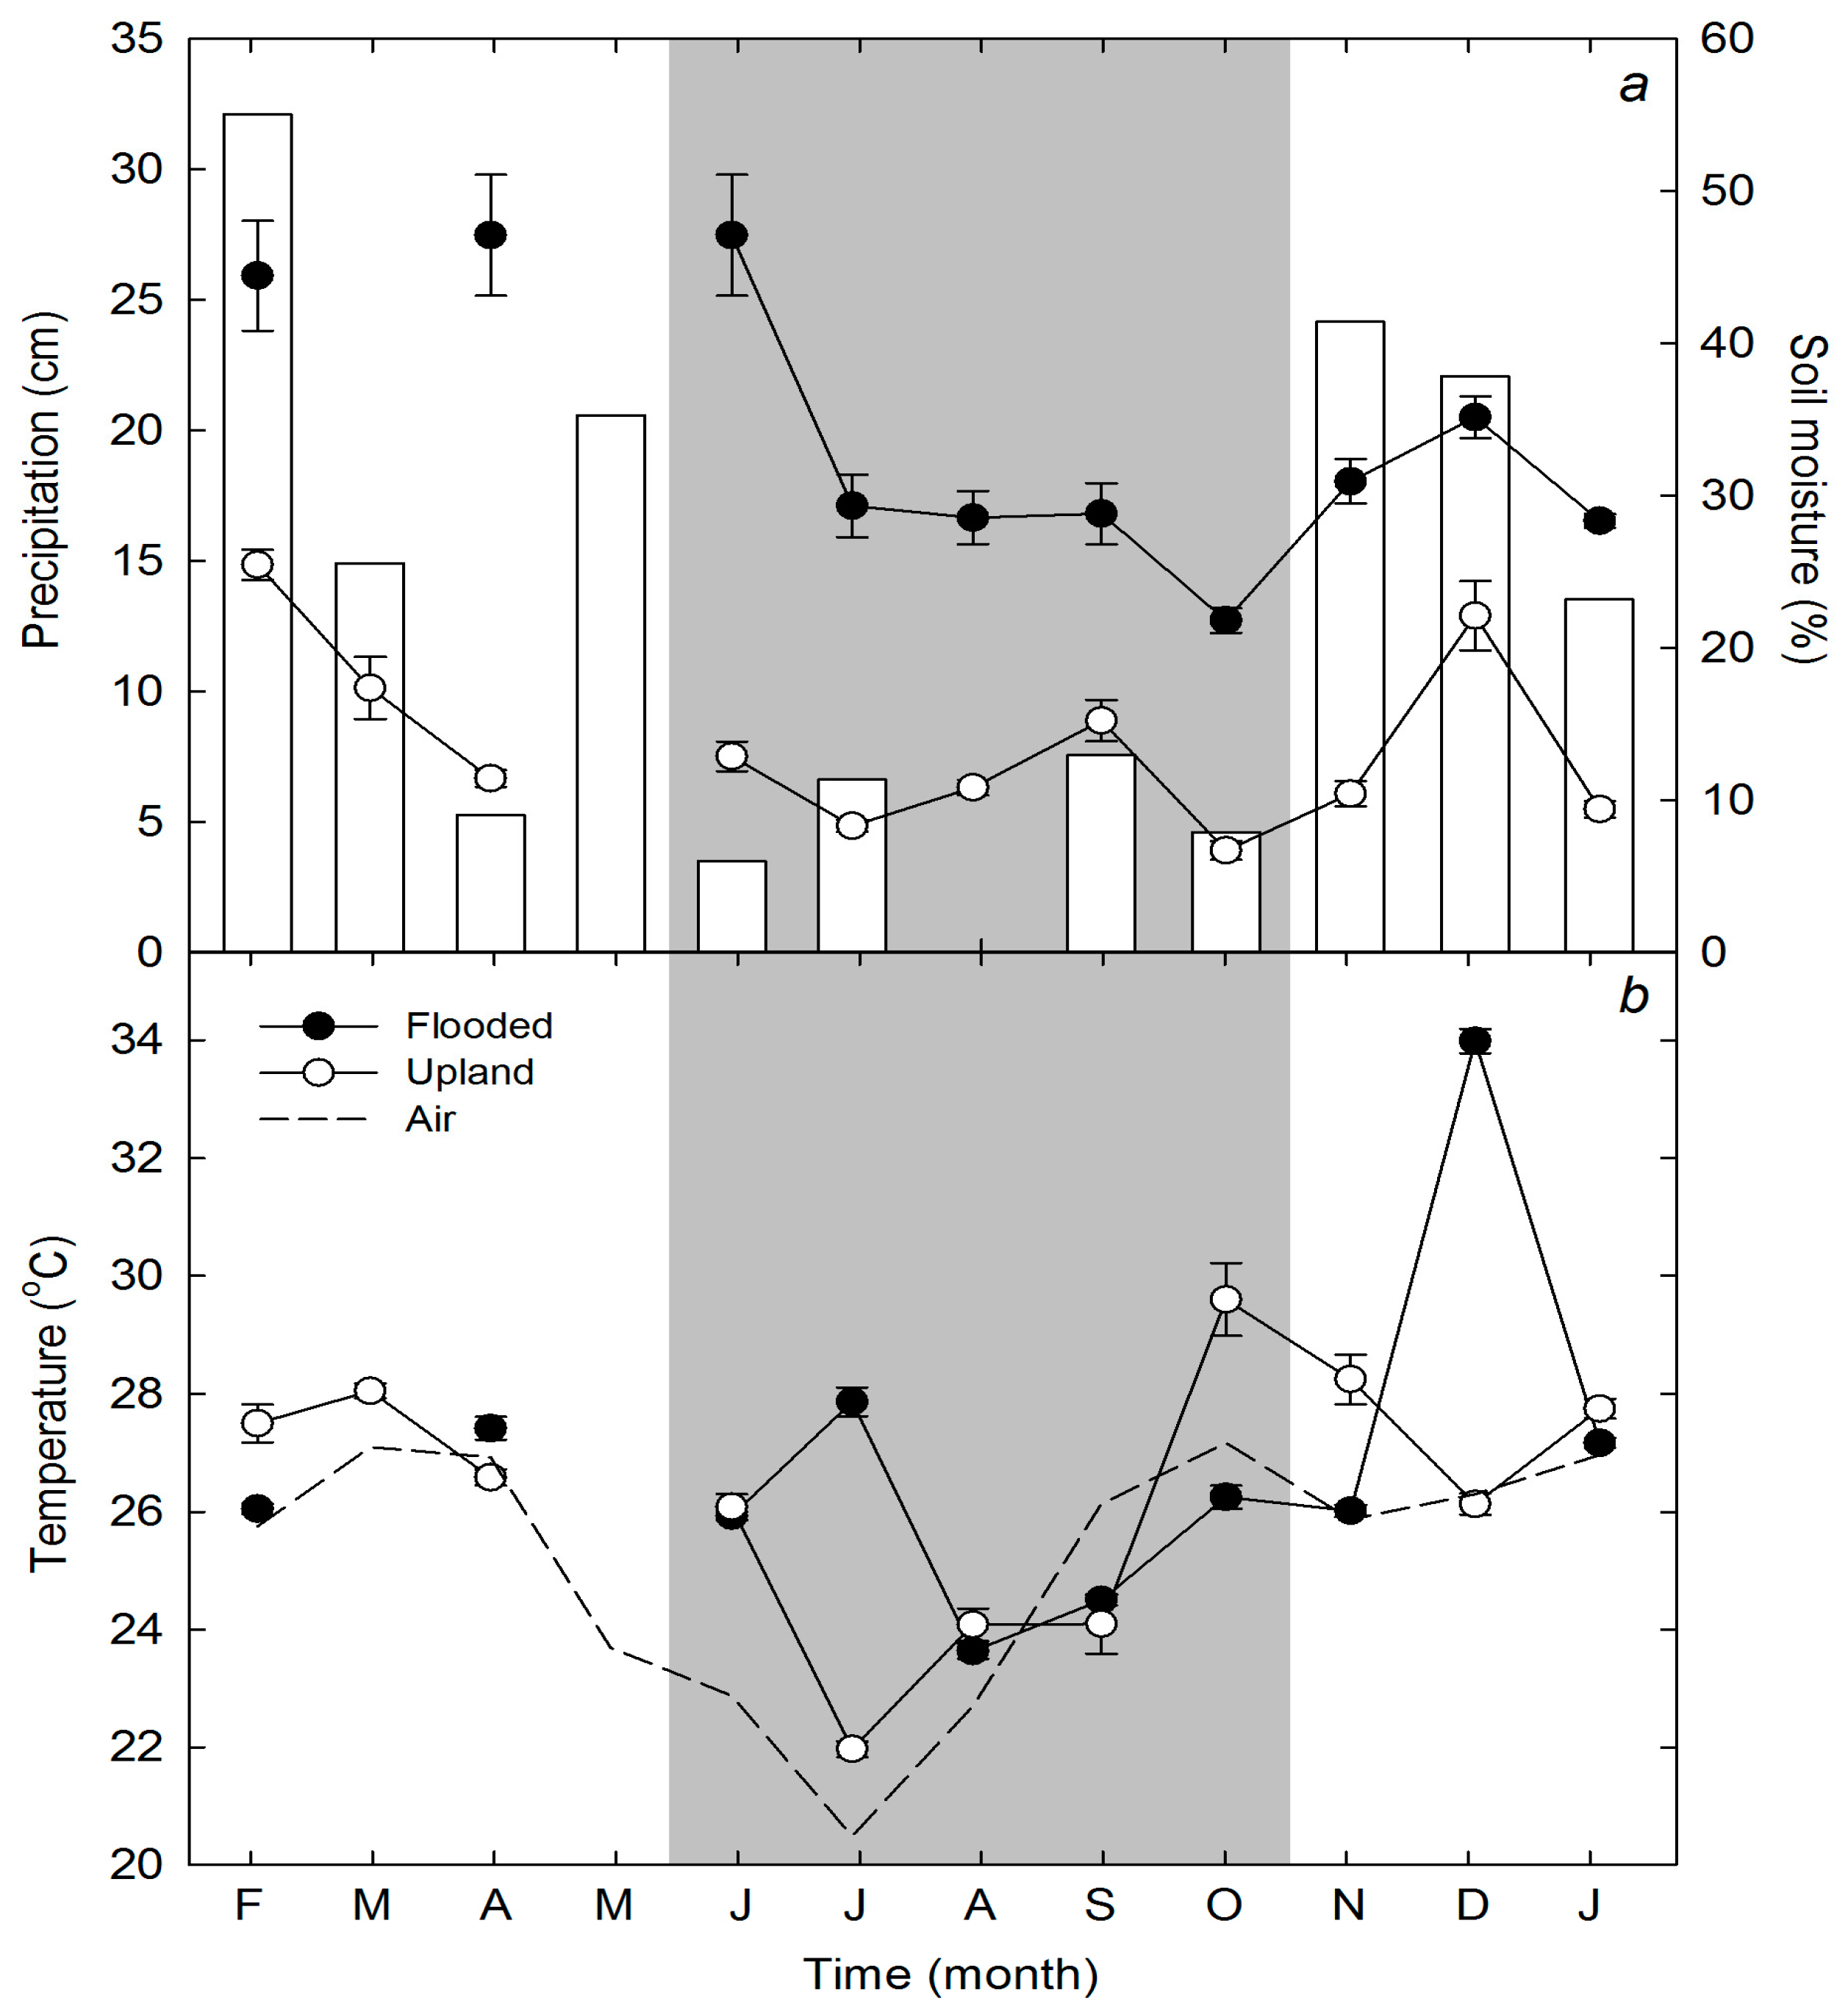
3.1. Site Characteristics and Climate
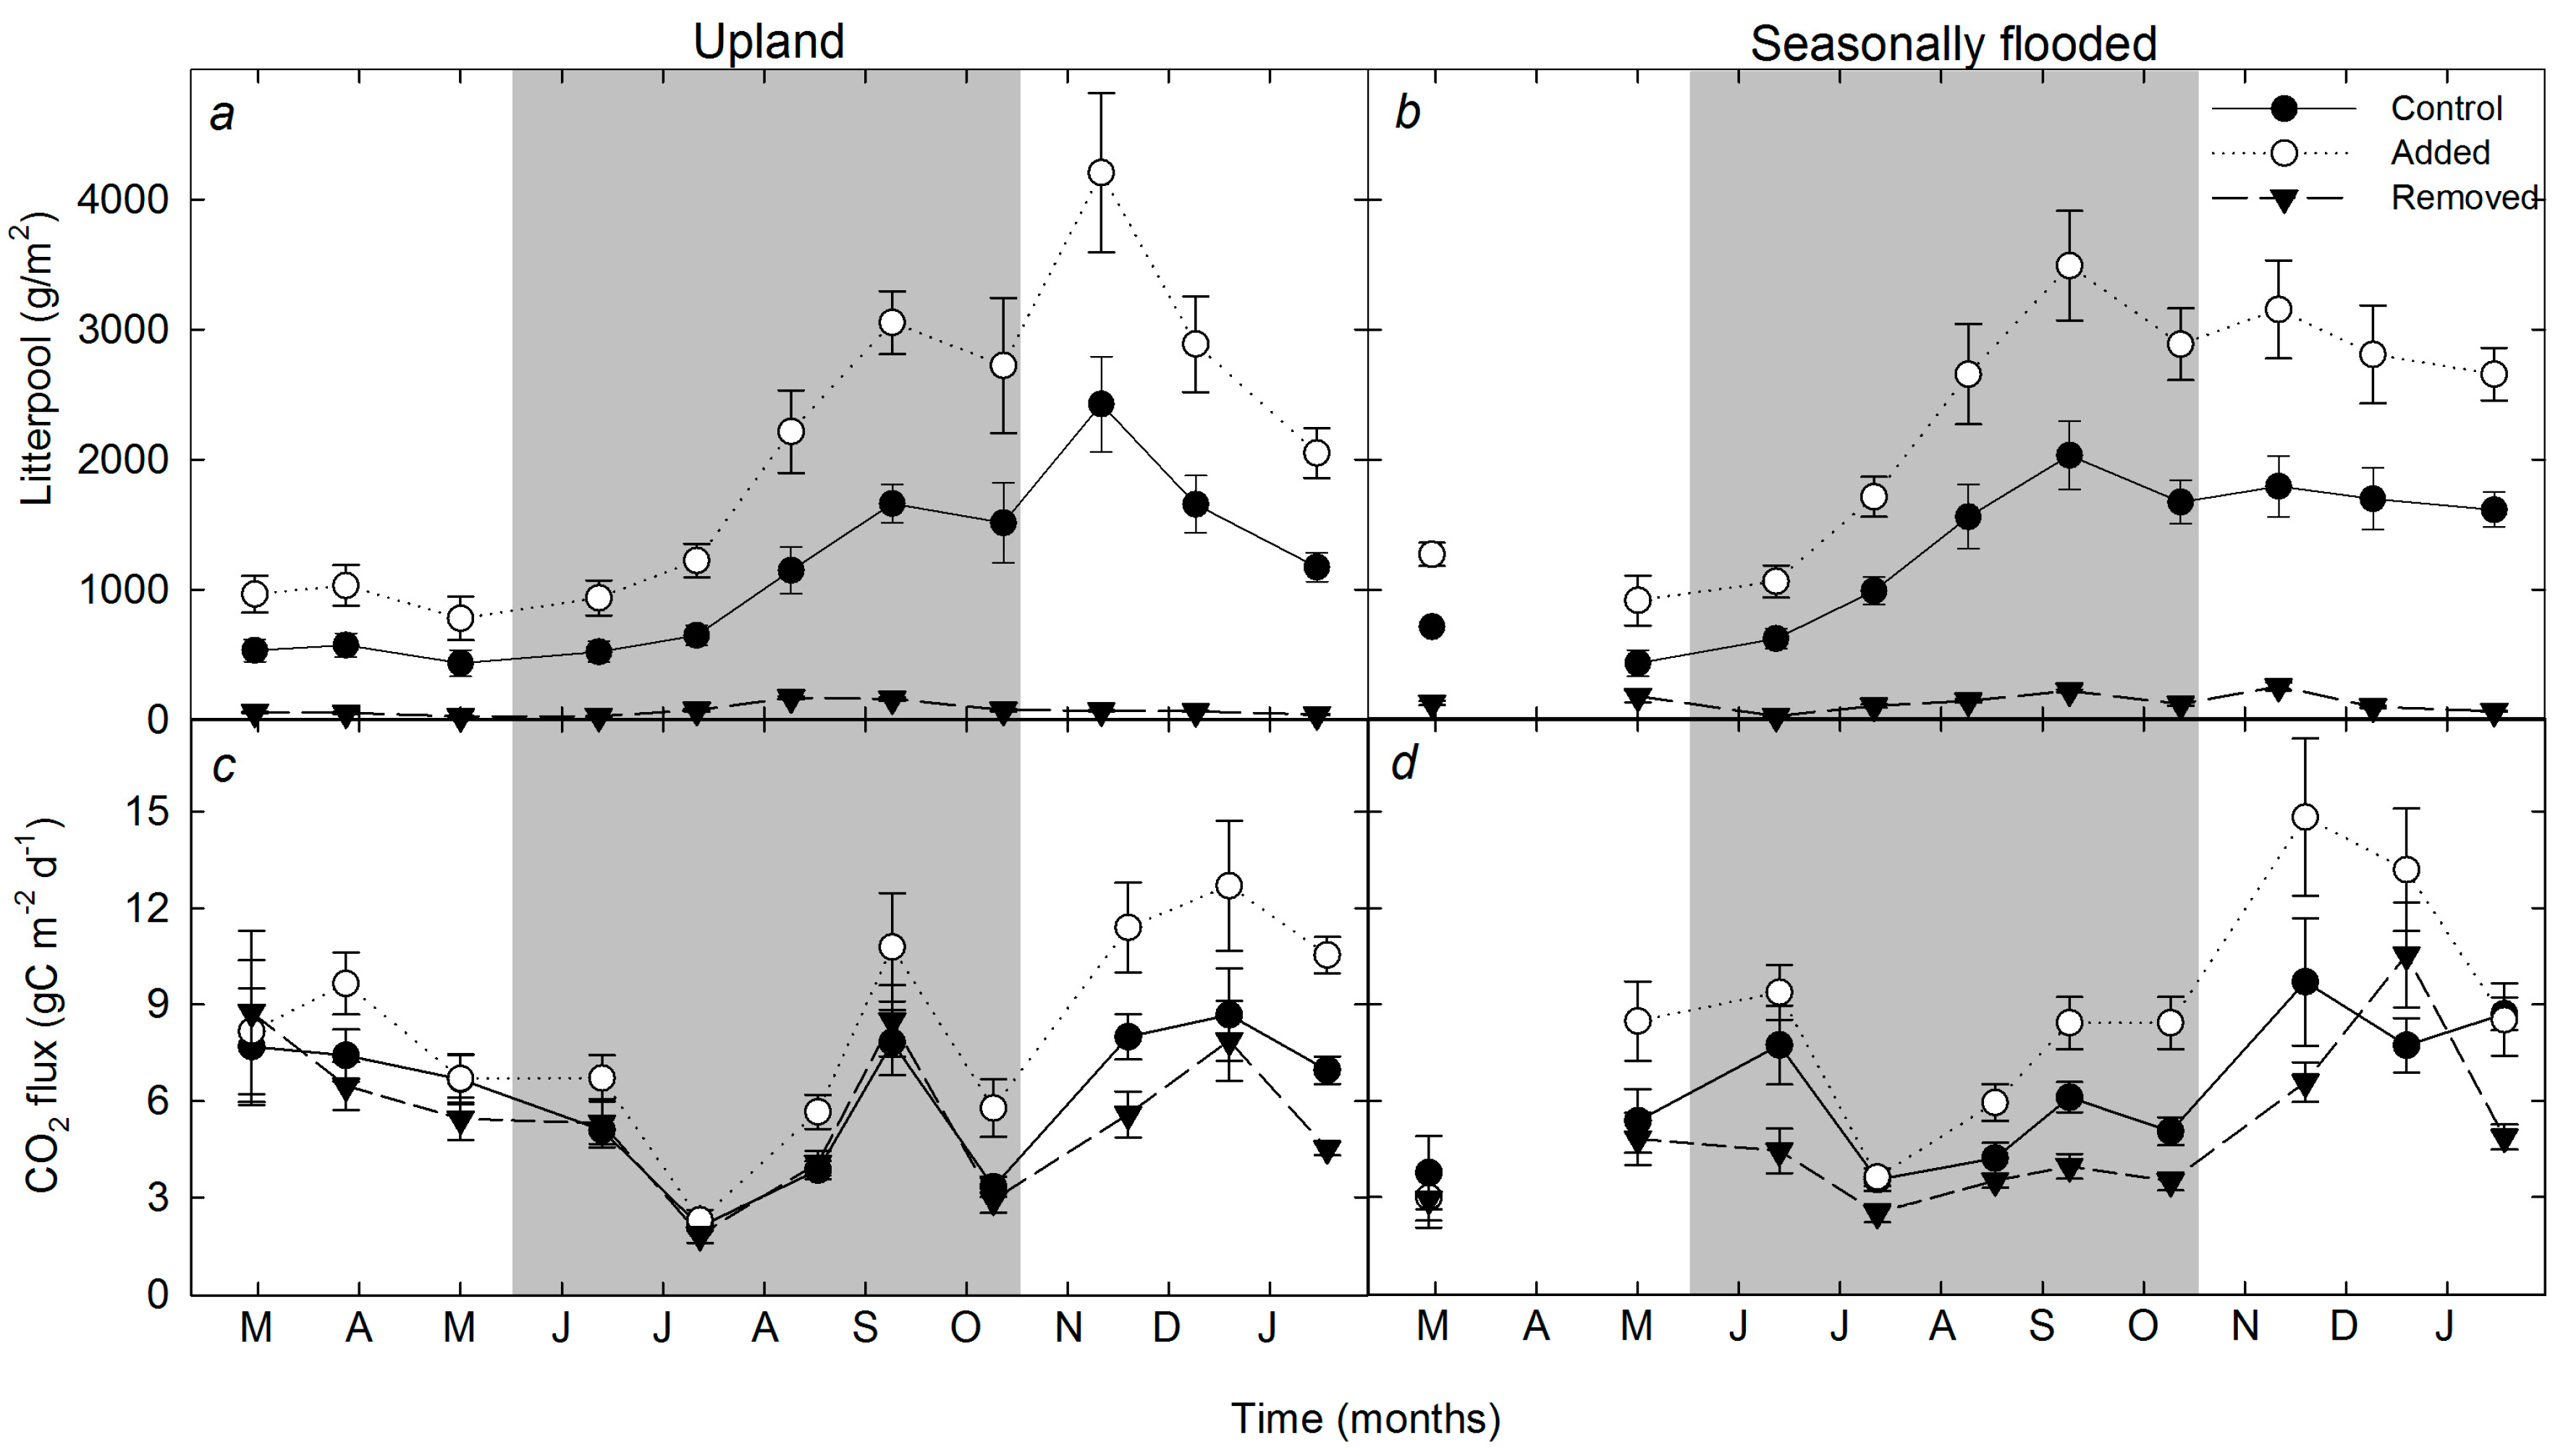
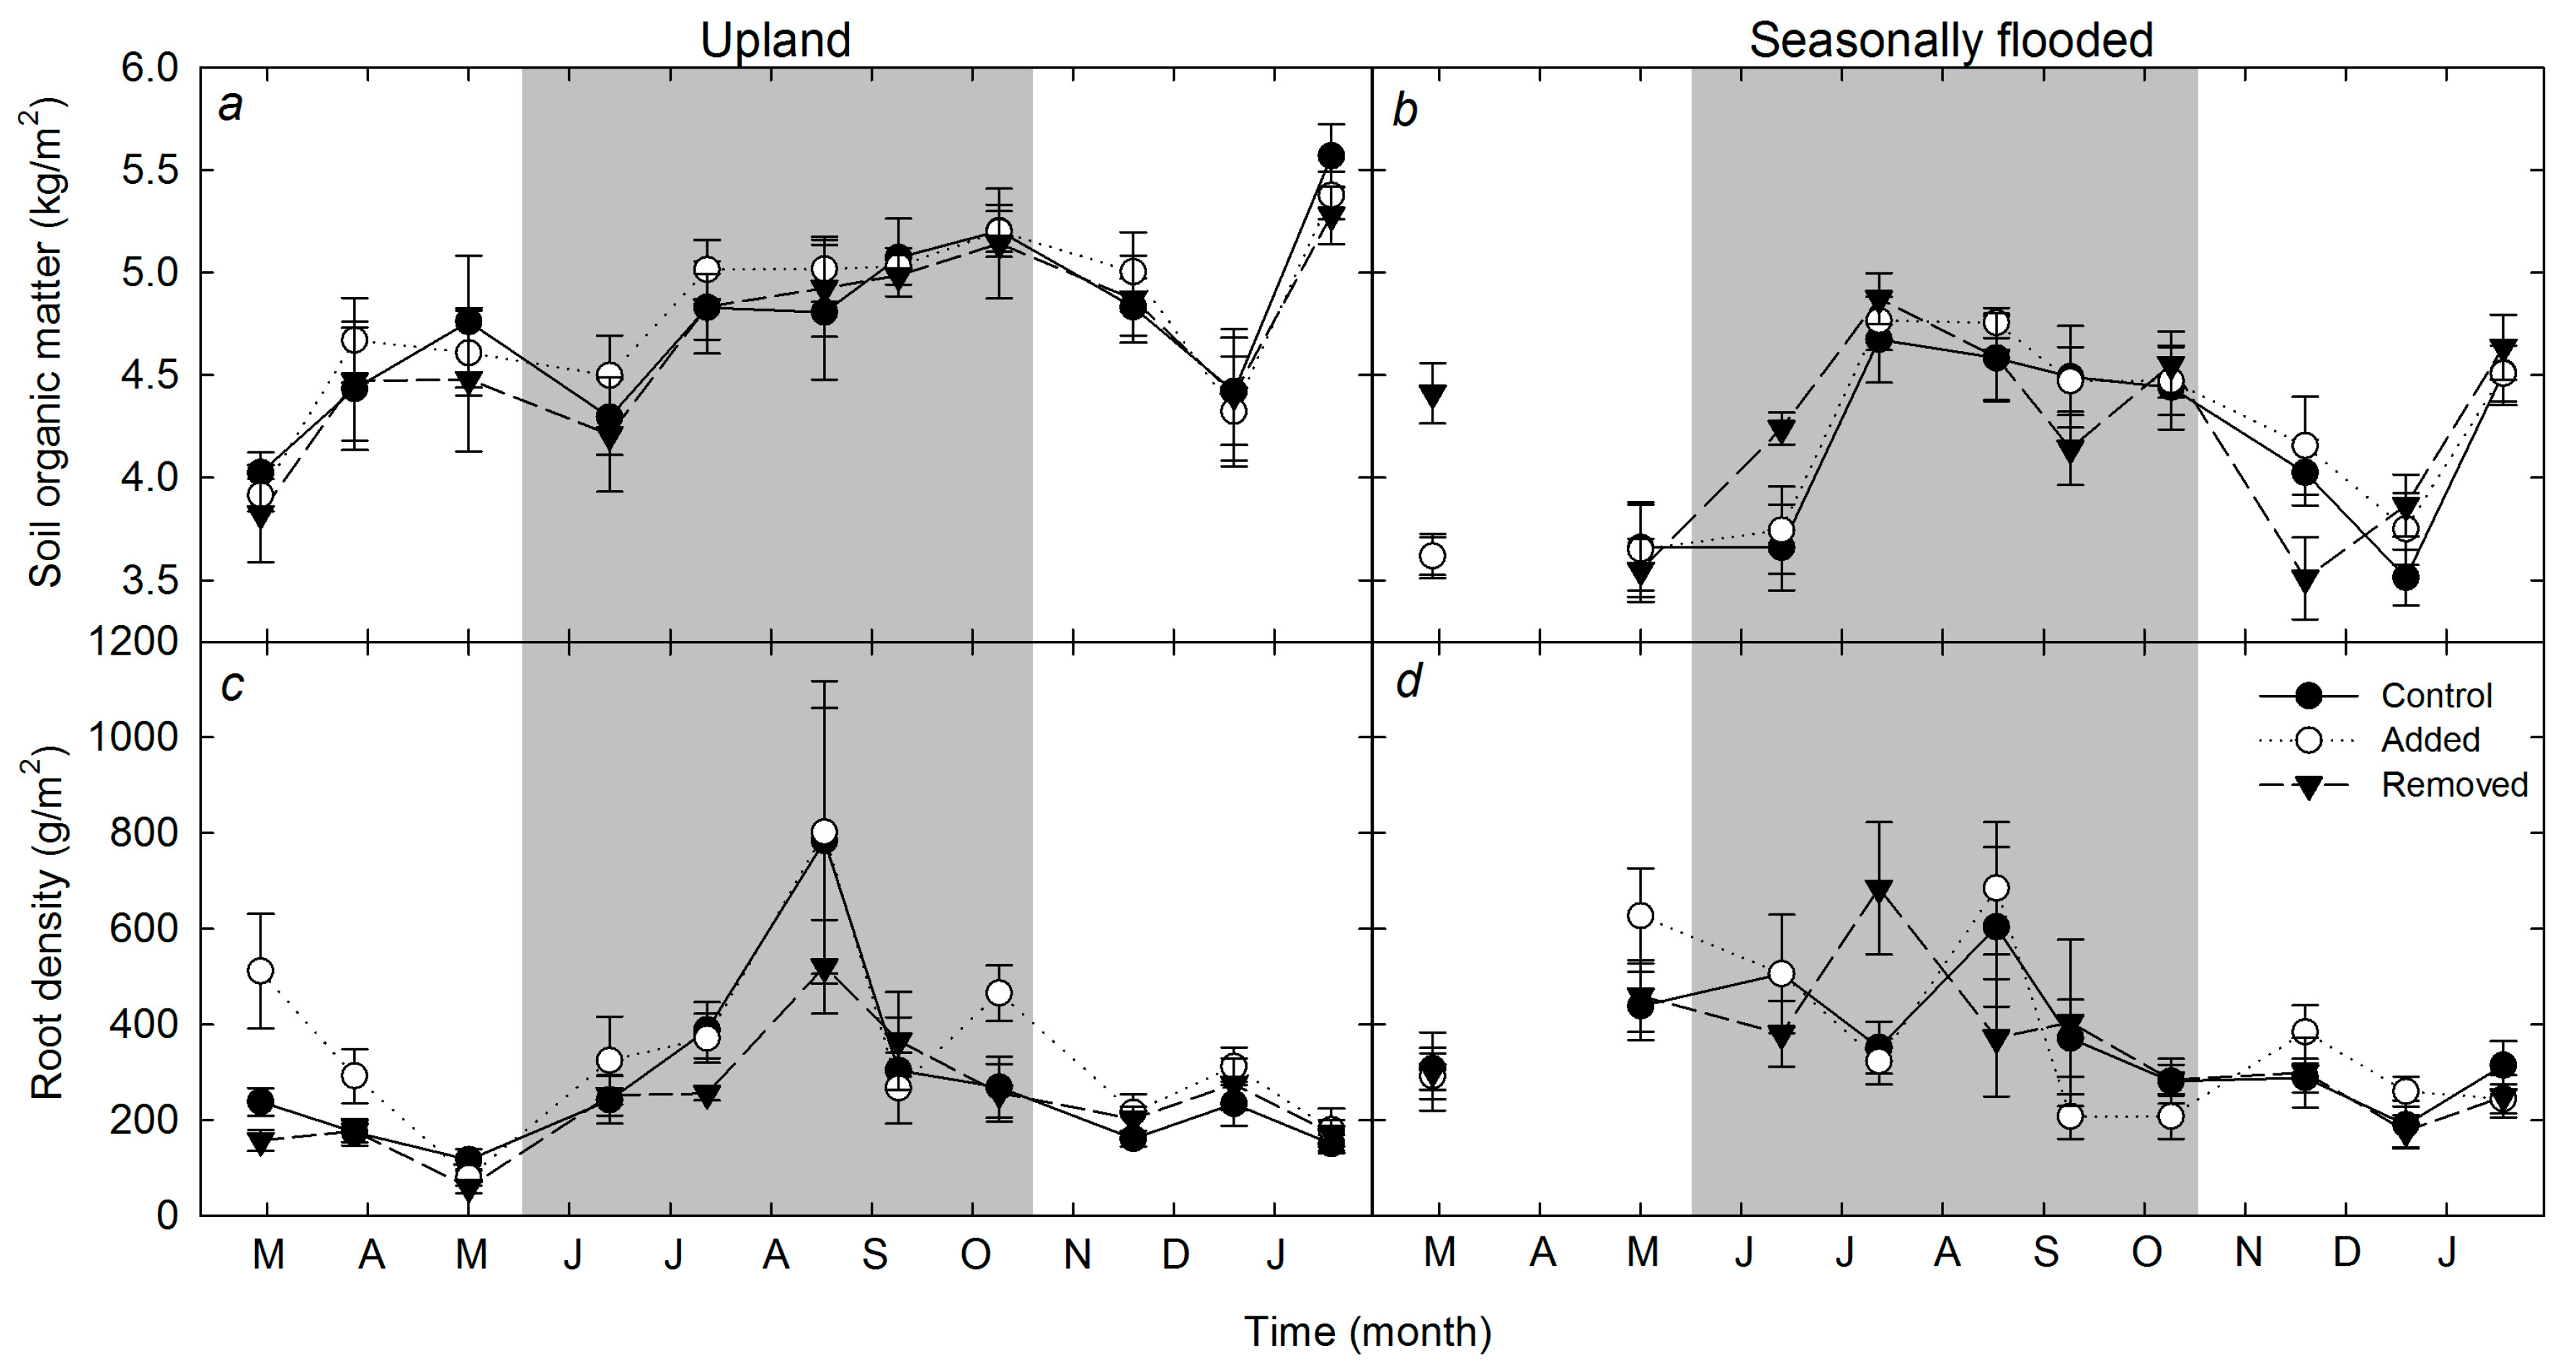
3.2. Temporal Trends in Soil Respiration, Litter Pool, Organic Matter Content, and Root Density
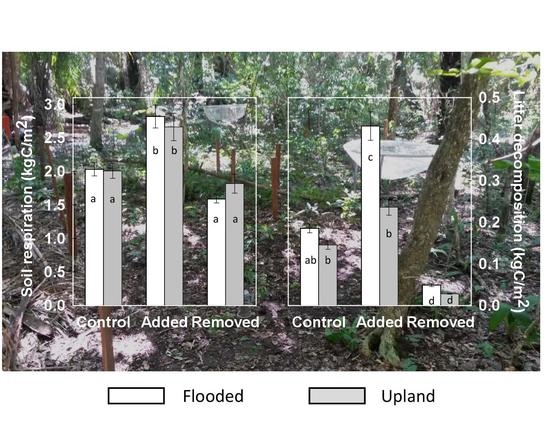
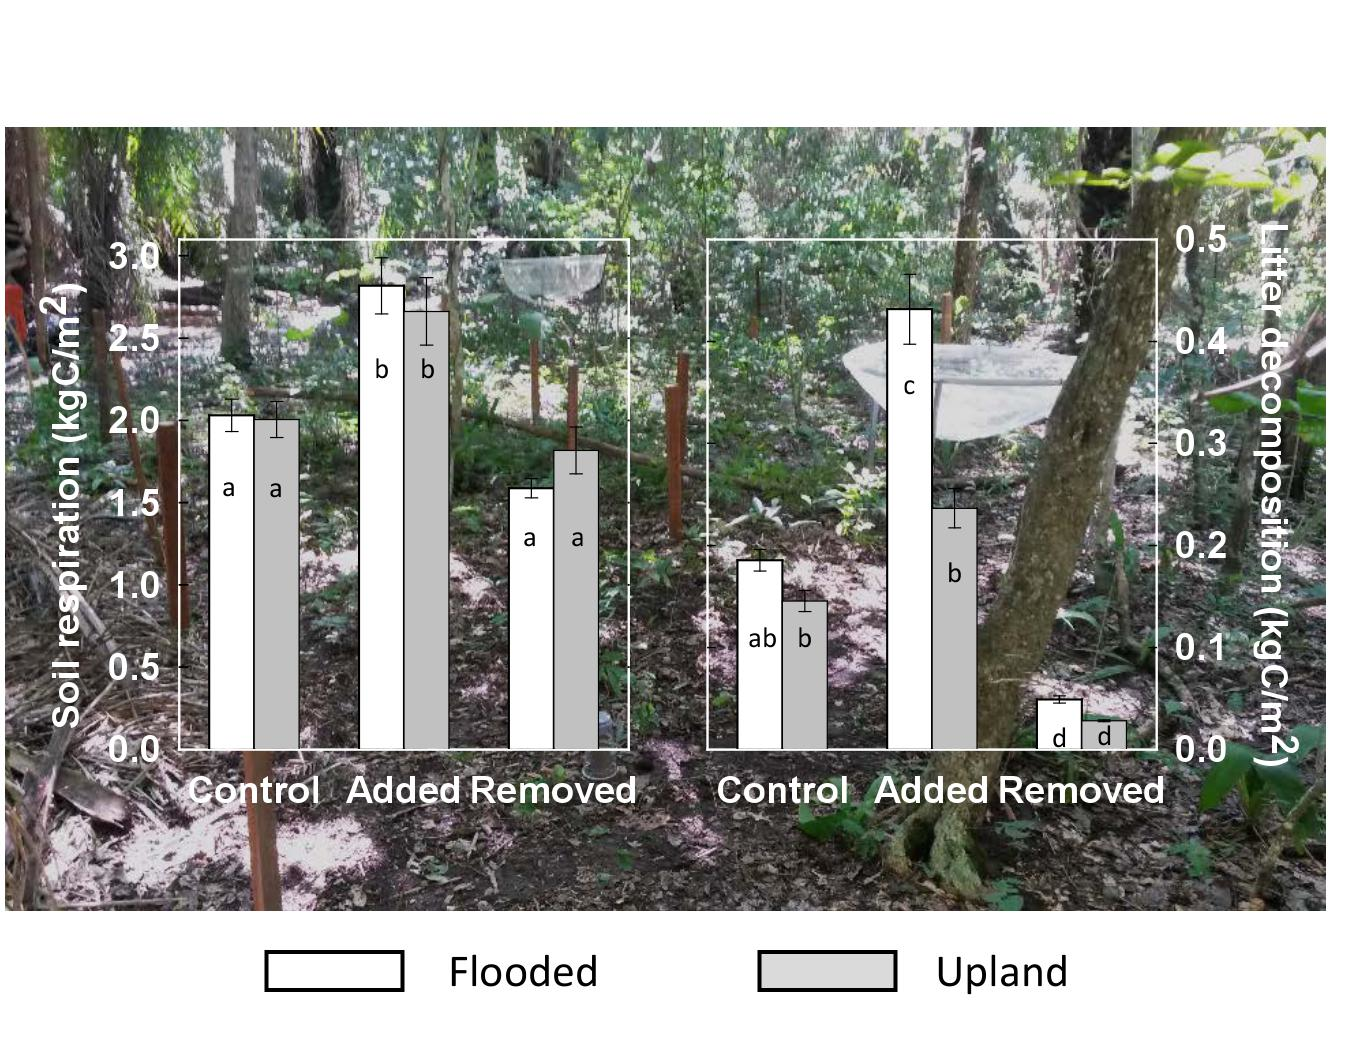
3.3. Annual Patterns of Soil Respiration, Decomposition, Root Density, and Soil Organic Matter
4. Discussion
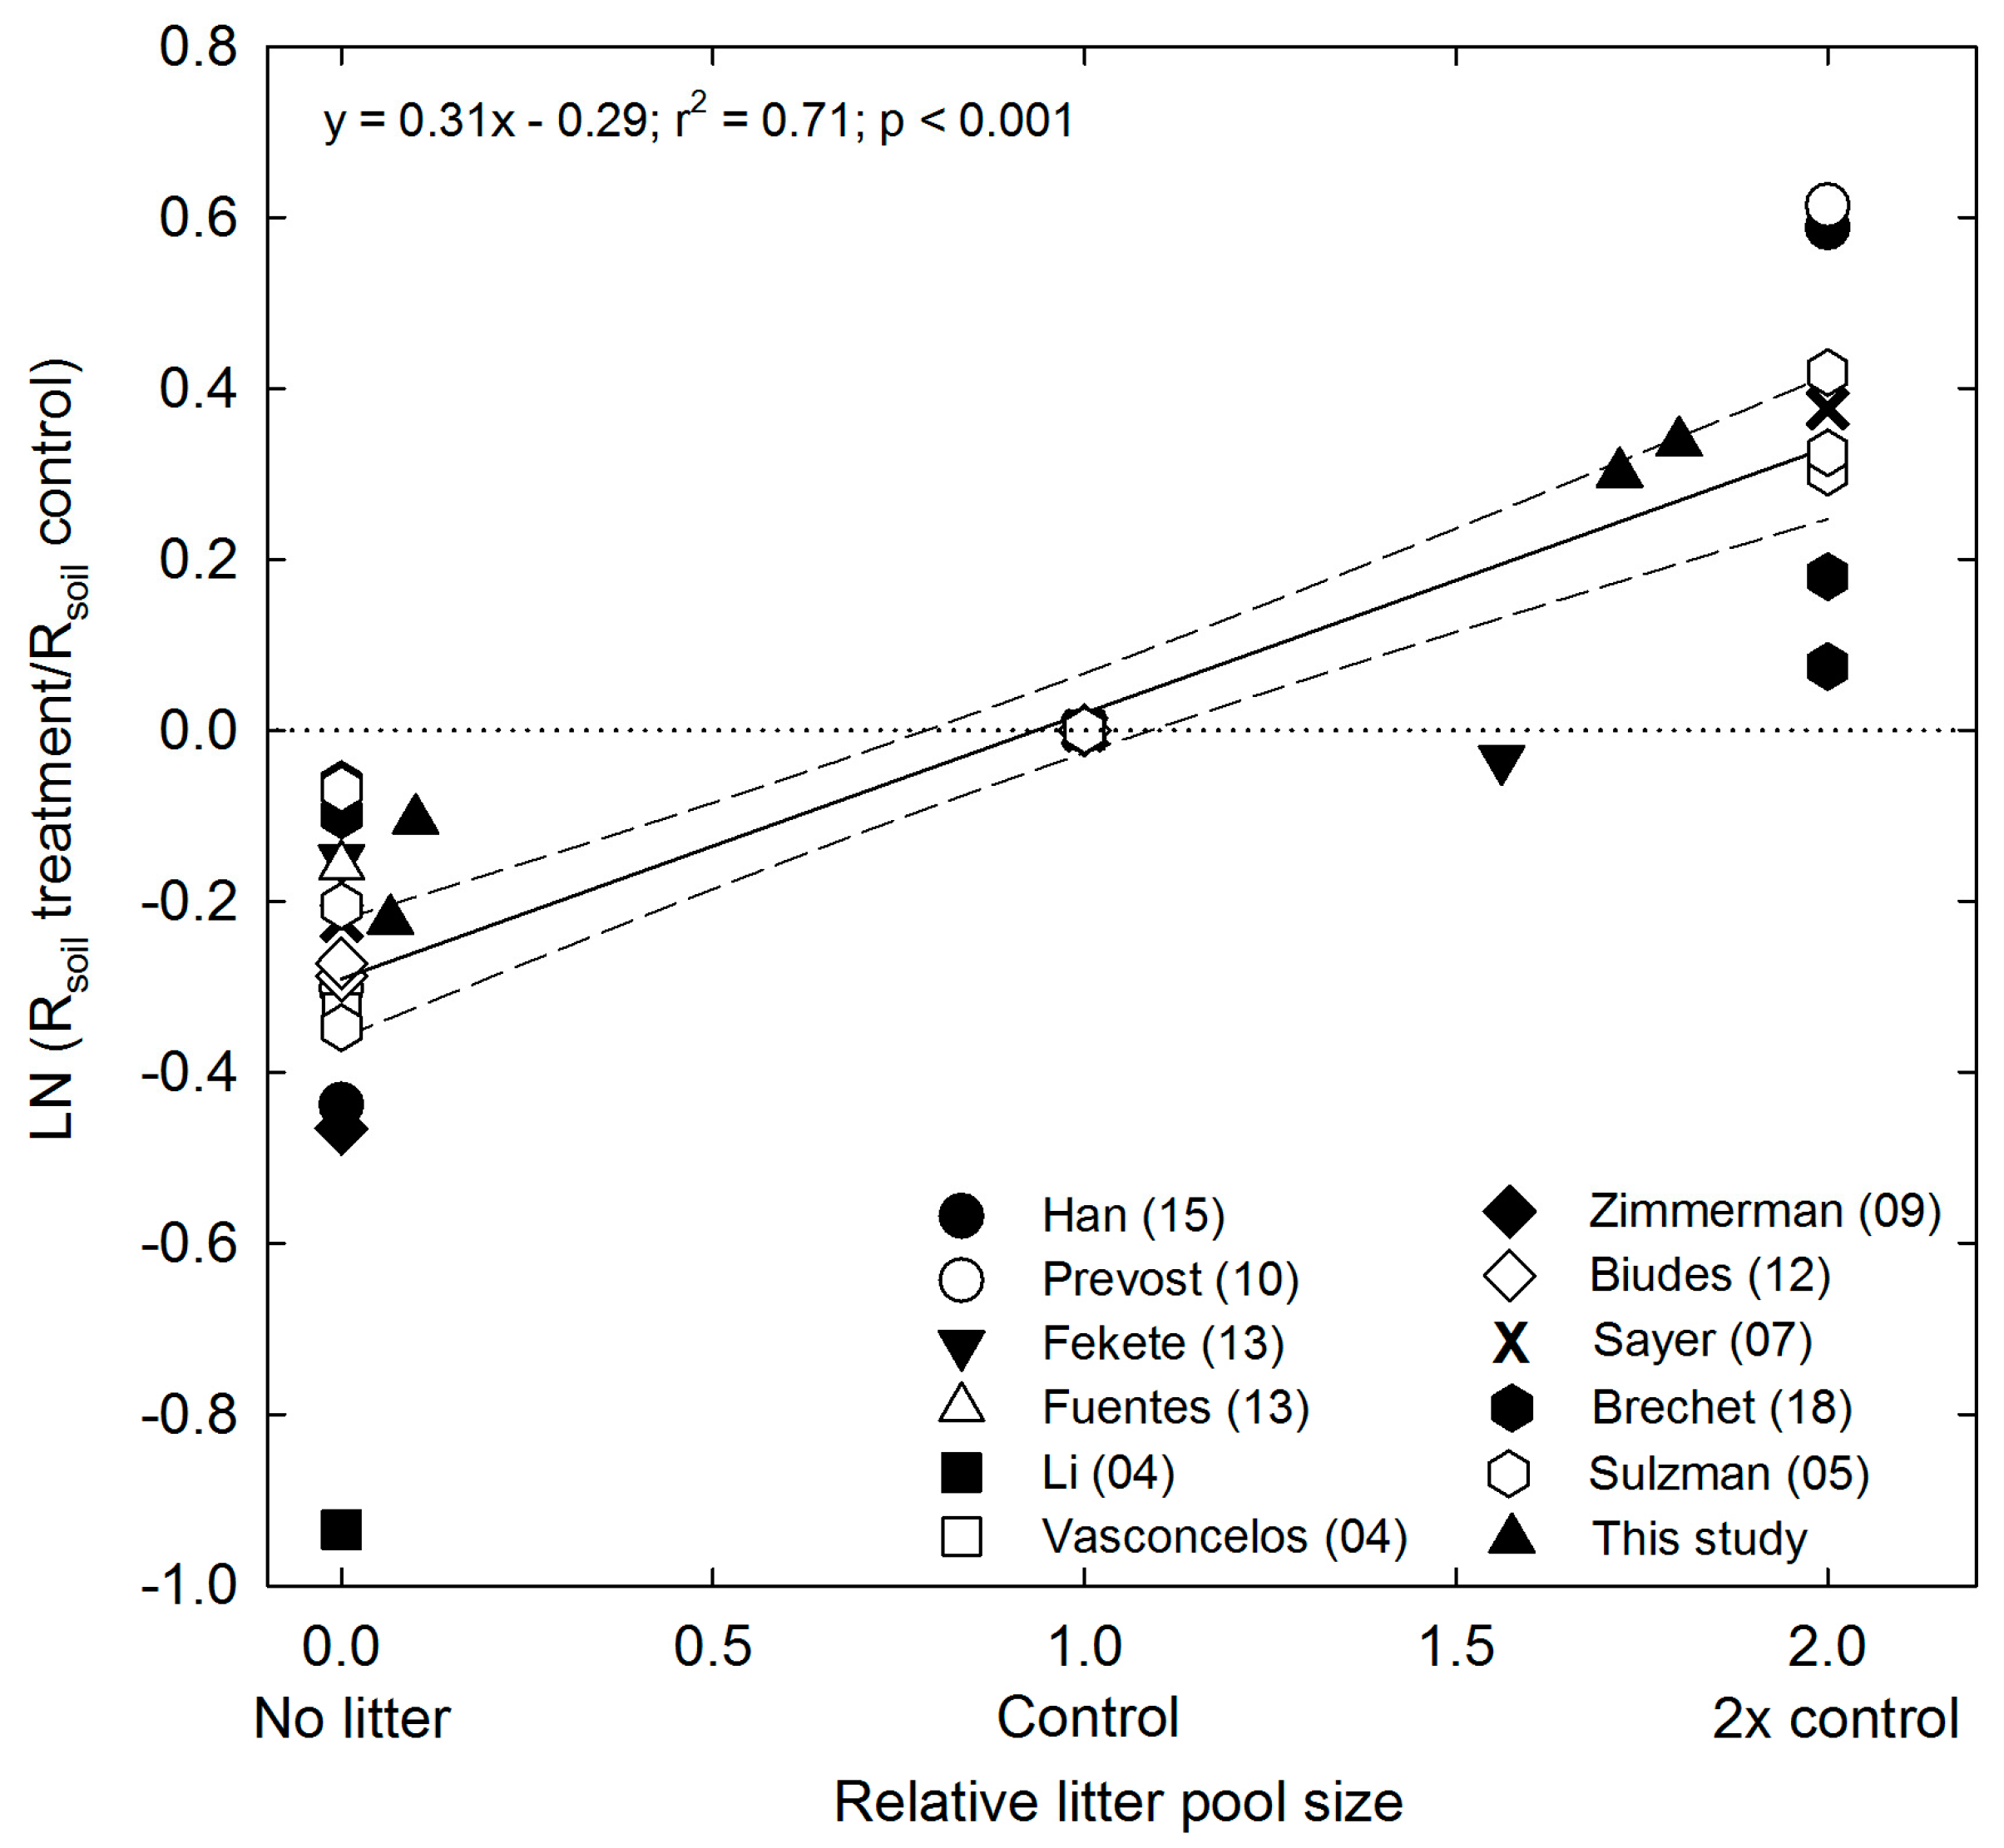
4.1. Effects of Litter Pool Size on CO2 Emission and Decomposition
4.2. Differences in Rsoil and Litter Decomposition between the Seasonally Flooded and Upland Forests
4.3. Limitations
4.4. Conclusions
Author Contributions
Acknowledgments
Conflicts of Interest
References
- Boisier, J.P.; Ciais, P.; Ducharne, A.; Guimberteau, M. Projected strengthening of Amazonian dry season by constrained climate model simulations. Nat. Clim. Chang. 2015, 5, 656–661. [Google Scholar] [CrossRef]
- Li, W.H.; Fu, R.; Juarez, R.I.N.; Fernandes, K. Observed change of the standardized precipitation index, its potential cause and implications to future climate change in the Amazon region. Philos. Trans. R. Lond. Soc. B 2008, 363, 1767–1772. [Google Scholar] [CrossRef] [PubMed]
- Vourlitis, G.L.; Nogueira, J.S.; Lobo, F.A.; Pinto, O.B., Jr. Long-term variation in evapotranspiration and climate for a tropical semi-deciduous forest of the southern Amazon Basin. Int. J. Biometeorol. 2015, 59, 217–230. [Google Scholar] [CrossRef] [PubMed]
- Gatti, L.V.; Gloor, M.; Miller, J.B.; Doughty, C.E.; Malhi, Y.; Domingues, L.G.; Basso, L.S.; Martinewski, A.; Correia, C.S.C.; Borges, V.F.; et al. Drought sensitivity of Amazonian carbon balance revealed by atmospheric measurements. Nature 2014, 506, 76–80. [Google Scholar] [CrossRef] [PubMed] [Green Version]
- Rohr, T.; Manzoni, S.; Feng, X.; Menezes, R.S.C.; Porporato, A. Effect of rainfall seasonality on carbon storage in tropical dry ecosystems. J. Geophys. Res. Biogeosci. 2013, 118, 1156–1167. [Google Scholar] [CrossRef]
- Levine, N.M.; Zhanga, K.; Longo, M.; Baccini, A.; Phillips, O.L.; Lewis, S.L.; Alvarez-Davila, E.; Andrade, A.C.S.; Brienen, R.J.W.; Erwin, T.L.; et al. Ecosystem heterogeneity determines the ecological resilience of the Amazon to climate change. Proc. Natl. Acad. Sci. USA 2015. [Google Scholar] [CrossRef] [PubMed]
- Vourlitis, G.L.; Lobo, F.A.; Zeilhofer, P.; Nogueira, J.S. Temporal patterns of net CO2 exchange for a tropical semideciduous forest of the southern Amazon Basin. J. Geophys. Res. Biogeosci. 2011, 116, G03029. [Google Scholar] [CrossRef]
- Restrepo-Coupe, N.; da Rocha, H.R.; Hutyra, L.R.; Araujo, A.C.; Borma, L.S.; Christoffersen, B.; Cabral, O.M.R.; Carmago, P.B.; Cardoso, F.L.; Costa, A.C.L.; et al. What drives the seasonality of photosynthesis across the Amazon basin? A cross-site analysis of eddy flux tower measurements from the Brasil flux network. Agric. For. Meteorol. 2013, 182–183, 128–144. [Google Scholar] [CrossRef]
- Dalmagro, H.J.; Lobo, F.A.; Vourlitis, G.L.; Dalmolin, Â.C.; Antunes, M.Z., Jr.; Ortíz, C.E.R.; Nogueira, J.S. The physiological light response of two tree species across a hydrologic gradient in Brazilian savanna (Cerrado). Photosynthetica 2014, 52, 22–35. [Google Scholar] [CrossRef]
- Arruda, P.H.Z.; Vourlitis, G.L.; Pinto, O.B., Jr.; Lobo, F.A.; Santanna, F.N.; Nogueira, J.S. Large net CO2 loss from a grass-dominated tropical savanna in south-central Brazil in response to seasonal and interannual drought. J. Geophys. Res. Biogeosci. 2016, 121, 2110–2124. [Google Scholar] [CrossRef]
- Davidson, E.A.; Janssens, I.A. Temperature sensitivity of soil carbon decomposition and feedbacks to climate change. Nature 2006, 440, 165–173. [Google Scholar] [CrossRef] [PubMed]
- Bond-Lamberty, B.; Thomson, A.M. Temperature-associated increases in the global soil respiration record. Nature 2010, 464, 579–582. [Google Scholar] [CrossRef] [PubMed]
- Edenhofer, O.R.; Pichs-Madruga, Y.; Sokona, E.; Farahani, E.; Kadner, S.; Seyboth, K.; Adler, A.; Baum, I.; Brunner, S.; Eickemeier, P.; et al. Climate Change 2014: Mitigation of Climate Change; Contribution of Working Group III to the Fifth Assessment Report of the Intergovernmental Panel on Climate Change; Cambridge University Press: Cambridge, UK; New York, NY, USA, 2014. [Google Scholar]
- Sotta, E.D.; Meir, P.; Malhi, Y.; Nobre, A.D.; Grace, J. Soil CO2 efflux in a tropical forest in the central Amazon. Glob. Chang. Biol. 2004, 10, 601–617. [Google Scholar] [CrossRef]
- Valentini, C.M.A.; Sanches, L.; de Paula, S.R.; Vourlitis, G.L.; Nogueira, J.S.; Pinto, O.B., Jr.; Lobo, F.A. Soil respiration and aboveground litter dynamics of a tropical transitional forest in northwest Mato Grosso, Brazil. J. Geophys. Res. Biogeosci. 2008, 113, G00B10. [Google Scholar] [CrossRef]
- Dalmolin, Â.C.; Lobo, F.A.; Vourlitis, G.; Silva, P.R.; Dalmagro, P.R.; Antunes, M.Z., Jr.; Ortíz, C.E.R. Is the dry season an important driver of phenology and growth for two Brazilian savanna tree species with contrasting leaf habits? Plant Ecol. 2015, 216, 407–417. [Google Scholar] [CrossRef]
- Condit, R.; Hubbell, S.P.; Foster, R.B. Mortality rates of 205 Neotropical tree and shrub species and the impact of a severe drought. Ecol. Monogr. 1995, 65, 419–439. [Google Scholar] [CrossRef]
- Phillips, O.L.; Aragão, L.E.O.C.; Lewis, S.L.; Fisher, J.B.; Lloyd, J.; Lopez-Gonzalez, G.; Malhi, Y.; Monteagudo, A.; Peacock, J.; Quesada, C.A.; et al. Drought sensitivity of the Amazon rainforest. Science 2009, 323, 1344–1347. [Google Scholar] [CrossRef] [PubMed] [Green Version]
- Brando, P.M.; Nepstad, D.C.; Davidson, E.A.; Trumbore, S.E.; Ray, D.; Camargo, P. Drought effects on litterfall, wood production and belowground carbon cycling in an Amazon forest: Results of a throughfall reduction experiment. Philos. Trans. R. Soc. B 2008, 363, 1839–1848. [Google Scholar] [CrossRef] [PubMed]
- Ter Steege, H.; Pitman, N.C.A.; Phillips, O.L.; Chave, J.; Sabatier, D.; Duque, A.; Molino, J.-F.; Prevost, M.-F.; Spichiger, R.; Castellanos, H.; et al. Continental-scale patterns of canopy tree composition and function across Amazonia. Nature 2006, 443, 444–447. [Google Scholar] [CrossRef] [PubMed]
- Fang, X.; Zhao, L.; Zhou, G.; Huang, W.; Liu, J. Increased litter input increases litter decomposition and soil respiration but has minor effects on soil organic carbon in subtropical forests. Plant Soil 2015, 392, 139–153. [Google Scholar] [CrossRef]
- Fanin, N.; Hättenschwiler, S.; Barantal, S.; Schimann, H.; Fromin, N. Does variability in litter quality determine soil microbial respiration in an Amazonian rainforest? Soil Biol. Biochem. 2011, 43, 1014–1022. [Google Scholar] [CrossRef]
- Fekete, I.; Kotroczó, Z.; Varga, C.; Nagy, P.T.; Várbíró, G.; Bowden, R.D.; Tóth, J.A.; Lajtha, K. Alterations in forest detritus inputs influence soil carbon concentration and soil respiration in a Central-European deciduous forest. Soil Biol. Biochem. 2014, 74, 106–114. [Google Scholar] [CrossRef] [Green Version]
- DeForest, J.L.; Chen, J.; McNulty, S.G. Leaf litter is an important mediator of soil respiration in an oak-dominated forest. Int. J. Biometeorol. 2009, 53, 127–134. [Google Scholar] [CrossRef] [PubMed]
- Prévost-Bouré, N.C.; Soudani, K.; Damesin, C.; Berveiller, D.; Lata, J.-C.; Dufrêne, E. Increase in aboveground fresh litter quantity over-stimulates soil respiration in a temperate deciduous forest. Appl. Soil Ecol. 2014, 46, 26–34. [Google Scholar] [CrossRef]
- Zhao, X.; Li, F.; Zhang, W.; Ai, Z. Contribution of aboveground litter to soil respiration in Populus davdiana Dode plantations at different stand ages. J. Mt. Sci. 2016, 13, 1000–1012. [Google Scholar] [CrossRef]
- Han, T.; Huang, W.; Liu, J.; Zhou, G.; Xiao, Y. Different soil respiration responses to litter manipulation in three subtropical successional forests. Sci. Rep. 2015, 5, 18166. [Google Scholar] [CrossRef] [PubMed]
- Zimmermann, M.; Meir, P.; Bird, M.; Malhi, Y.; Ccahuana, A. Litter contribution to diurnal and annual soil respiration in a tropical montane cloud forest. Soil Biol. Bichem. 2009, 41, 1338–1340. [Google Scholar] [CrossRef]
- Sayer, E.J.; Powers, J.S.; Tanne, E.V.J. Increased litterfall in tropical forests boosts the transfer of soil CO2 to the atmosphere. PLoS ONE 2007, 2, e1299. [Google Scholar] [CrossRef] [PubMed] [Green Version]
- Raich, J.W.; Tufekcioglu, A. Vegetation and soil respiration: Correlations and controls. Biogeochemistry 2000, 48, 71–90. [Google Scholar] [CrossRef]
- Malhi, Y.R.; Baker, T.R.; Phillips, O.L.; Almeida, S.; Alvarez, E.; Arroyo, L.; Chave, J.; Czimczik, I.; DiFiore, A.; Higuchi, N.; et al. The above-ground coarse wood productivity of 104 Neotropical forest plots. Glob. Chang. Biol. 2004, 10, 563–591. [Google Scholar] [CrossRef]
- Grace, J.; San Jose, J.; Meir, P.; Miranda, H.S.; Montes, R.A. Productivity and carbon fluxes of tropical savannas. J. Biogeogr. 2006, 33, 387–400. [Google Scholar] [CrossRef]
- Vourlitis, G.L.; da Rocha, H.R. Flux dynamics in the Cerrado and Cerrado-Forest Transition of Brazil. In Ecosystem Function in Global Savannas: Measurement and Modeling at Landscape to Global Scales; Hill, M.J., Hanan, N.P., Eds.; CRC Inc.: Boca Raton, FL, USA, 2011; pp. 97–116. [Google Scholar]
- Junk, W.J.; Nunes da Cunha, C.; Wantzen, K.M.; Petermann, P.; Strussmann, C.; Marques, M.I.; Adis, J. Biodiversity and its conservation in the Pantanal of Mato Grosso, Brazil. Aquat. Sci. 2006, 68, 278–309. [Google Scholar] [CrossRef]
- Nunes da Cunha, C.; Junk, W.J. Distribution of woody plants communities along the flood gradient in the Pantanal of Poconé, Mato Grosso, Brazil. Int. J. Ecol. Environ. Sci. 2001, 27, 63–70. [Google Scholar]
- Vourlitis, G.L.; Lobo, F.A.; Pinto, O.B., Jr.; Dalmagro, H.D.; Arruda, P.H.Z.; Nogueira, J.S. Variations in aboveground vegetation structure along a nutrient availability gradient in the Brazilian Pantanal. Plant Soil 2015, 389, 307–321. [Google Scholar] [CrossRef]
- Vourlitis, G.L.; Hentz, C.S.; Pinto, O.B., Jr.; Carneiro, E.; Nogueira, J.S. Soil N, P, and C dynamics of upland and seasonally flooded forests of the Brazilian Pantanal. Glob. Ecol. Conserv. 2017, 12, 227–240. [Google Scholar] [CrossRef]
- Dalmagro, H.J.; Lathuillière, M.J.; Vourlitis, G.L.; Campos, R.C.; Pinto, O.B., Jr.; Johnson, M.S.; Ortiz, C.E.R.; Couto, E.G. Soil oxidation-reduction potential and its impacts on plant physiology in seasonally inundated soils of the Brazilian Pantanal. J. Veg. Sci. 2016, 27, 568–577. [Google Scholar] [CrossRef]
- Junk, W.J. Current state of knowledge regarding South America wetlands and their future under global climate change. Aquat. Sci. 2013, 75, 113–131. [Google Scholar] [CrossRef]
- Nunes da Cunha, C.; Junk, W.J. Year-to-year changes in water level drive the invasion of Vochysia divergens in Pantanal grasslands. Appl. Veg. Sci. 2004, 7, 103–110. [Google Scholar] [CrossRef]
- Vourlitis, G.L.; Lobo, F.A.; Lawrence, S.; Holt, K.; Zappia, A.; Pinto, O.B., Jr.; Nogueira, J.S. Nutrient resorption in tropical savanna forests and woodlands of central Brazil. Plant Ecol. 2014, 215, 963–975. [Google Scholar] [CrossRef]
- Lathuillière, M.J.; Pinto, O.B., Jr.; Johnson, M.S.; Jassal, R.S.; Dalmagro, H.J.; Leite, N.K.; Speratti, A.B.; Krampe, D.; Couto, E.G. Soil CO2 concentrations and efflux dynamics of a tree island in the Pantanal wetland. J. Geophys. Res. Biogeosci. 2017, 122, 2154–2169. [Google Scholar] [CrossRef]
- Nelson, D.W.; Sommers, L.E. Total carbon, organic carbon, and organic matter. In Methods of Soil Analysis: Part 3. Chemical Methods; Soil Science Society of America Book Series No. 5; Soil Science Society of America, Inc.: Madison, WI, USA, 1996. [Google Scholar]
- Olsen, J.S. Energy Storage and the Balance of Producers and Decomposers in Ecological Systems. Ecology 1963, 44, 322–331. [Google Scholar] [CrossRef]
- Sanches, L.; Valentini, C.M.A.; Pinto, O.B., Jr.; Nogueira, J.S.; Vourlitis, G.L.; Biudes, M.S.; da Silva, C.J.; Bambi, P.; Lobo, F.A. Seasonal and interannual litter dynamics of a tropical semideciduous forest of the southern Amazon Basin, Brazil. J. Geophys. Res. Biogeosci. 2008, 113, G04007. [Google Scholar] [CrossRef]
- Hintze, J. NCSS and PASS; Number Cruncher Statistical Systems: Kaysville, UT, USA, 2004; Available online: www.NCSS.com (accessed on 4 February 2018).
- Sokal, R.R.; Rohlf, F.J. Biometry, 3rd ed.; Freeman: San Francisco, CA, USA, 1995; p. 887. [Google Scholar]
- Wieder, R.K.; Wright, S.J. Tropical forest litter dynamics and dry season irrigation on Barro Colorado Island, Panama. Ecology 1995, 76, 1971–1979. [Google Scholar] [CrossRef]
- Biudes, M.S.; Vourlitis, G.L. Initial litter and soil C and N mineralization dynamics for a semi-arid scrubland exposed to experimental N deposition. Soil Sci. Soc. Am. J. 2012, 76, 2068–2073. [Google Scholar] [CrossRef]
- Fuentes, J.P.; Bown, H.E.; Perez-Quezada, J.F.; Franck, N. Litter removal in a sclerophyll forest: Short- and medium-term consequences for soil properties. Soil Sci. Soc. Am. J. 2014, 78, 634–644. [Google Scholar] [CrossRef]
- Li, Y.; Xu, M.; Sun, O.F.; Cui, W. Effects of root and litter exclusion on soil CO2 efflux and microbial biomass in wet tropical forests. Soil Biol. Biochem. 2004, 36, 2111–2114. [Google Scholar] [CrossRef]
- Vasconcelos, S.S.; Zarin, D.J.; Capanu, M.; Littell, R.; Davidson, E.A.; Ishida, F.Y.; Santos, E.B.; Araujo, M.M.; Aragao, D.V.; Rangel-Vasconcelos, L.G.T.; et al. Moisture and substrate availability constrain soil trace gas fluxes in an eastern Amazonian regrowth forest. Glob. Biogeochem. Cycles 2004, 18, GB2009. [Google Scholar] [CrossRef]
- Brechet, L.M.; Lopez-Sangil, L.; George, C.; Birkett, A.J.; Baxendale, C.; Trujillo, B.C.; Sayer, E.J. Distinct responses of soil respiration to experimental litter manipulation in temperate woodland and tropical forest. Ecol. Evol. 2018, 1–10. [Google Scholar] [CrossRef] [PubMed]
- Sulzman, E.W.; Brant, J.B.; Bowden, R.D.; Lajtha, K. Contribution of aboveground litter, belowground litter, and rhizosphere respiration to total soil CO2 efflux in an old growth coniferous forest. Biogeochemistry 2005, 73, 231–256. [Google Scholar] [CrossRef]
- Jenkinson, D.S.; Fox, R.H.; Rayner, J.H. Interactions between fertilizer nitrogen and soil nitrogen-the so-called ‘priming’ effect. J. Soil Sci. 1985, 36, 425–444. [Google Scholar] [CrossRef]
- Prescott, C.E.; Reid, A.; Wu, S.Y.; Nilsson, M.-C. Decomposition rates of surface and buried forest-floor material. Can. J. For. Res. 2017, 47, 1140–1144. [Google Scholar] [CrossRef]
- Powers, J.S.; Montgomery, R.A.; Adair, E.C.; Brearley, F.Q.; DeWalt, S.J.; Castanho, C.T.; Chave, J.; Deinert, E.; Ganzhorn, J.U.; Gilbert, M.E.; et al. Decomposition in tropical forests: A pan-tropical study of the effects of litter type, litter placement and mesofaunal exclusion across a precipitation gradient. J. Ecol. 2009, 97, 801–811. [Google Scholar] [CrossRef]
- Pinto, O.B., Jr.; Sanches, L.; Dalmolin, A.C.; Nogueira, J.S. Efluxo de CO2 do solo em floresta de transição Amazônia Cerrado e em área de pastagem. Acta Amazon. 2009, 39, 813–822. [Google Scholar] [CrossRef]
- Butler, A.; Meir, P.; Saiz, G.; Maracahipes, L.; Marimon, B.S.; Grace, J. Annual variation in soil respiration and its component parts in two structurally contrasting woody savannas in Central Brazil. Plant Soil 2012, 352, 129–142. [Google Scholar] [CrossRef]
- Johnson, M.S.; Couto, E.G.; Pinto, O.B., Jr.; Milesi, J.; Amorim, R.S.S.; Messias, I.A.M.; Biudes, M.S. Soil CO2 dynamics in a tree island soil of the Pantanal: The role of soil water potential. PLoS ONE 2013, 8, e64874. [Google Scholar] [CrossRef] [PubMed]
- Huang, W.; Hall, S.J. Elevated moisture stimulates carbon loss from mineral soils by releasing protected organic matter. Nat. Commun. 2017, 8, 1774. [Google Scholar] [CrossRef] [PubMed]
- Bayley, S.E.; Mewhort, R.L. Plant community structure and functional differences between marshes and fens in the southern boreal region of Alberta, Canada. Wetlands 2004, 24, 277–294. [Google Scholar] [CrossRef]


| Sourcedf | Litterfall † | Litterpool | Respiration | Soil Moisture | Soil Temperature | Organic Matter | Root Density |
|---|---|---|---|---|---|---|---|
| T2,30 | NA | 18.7 *** | 2.0 | 0.1 | 0.6 | 0.1 | 1.0 |
| S1,30 (1,94) | 1.5 | 0.1 | 0.4 | 25.5 *** | 793.2 *** | 2.9 | 0.8 |
| S × T2,30 | NA | 0.1 | 0.8 | 0.2 | 0.6 | 0.1 | 0.1 |
| M10,282 (10,94) | 33.5 *** | 44.5 *** | 27.4 *** | 93.0 *** | 497.3 *** | 47.1 *** | 9.5 *** |
| T × M20,282 | NA | 12.7 *** | 2.8 *** | 1.1 | 2.0 | 1.5 | 1.1 |
| S × M10,282 (10,94) | 7.0 *** | 2.4 * | 6.6 *** | 33.6 *** | 319.0 *** | 8.8 *** | 4.4 ** |
| S × T × M20,282 | NA | 1.0 | 0.8 | 1.2 | 1.3 | 1.7 | 0.9 |
| Soil Respiration | Decomposition | |||
|---|---|---|---|---|
| Variable | Direct Effect | Indirect Effect | Direct Effect | Indirect Effect |
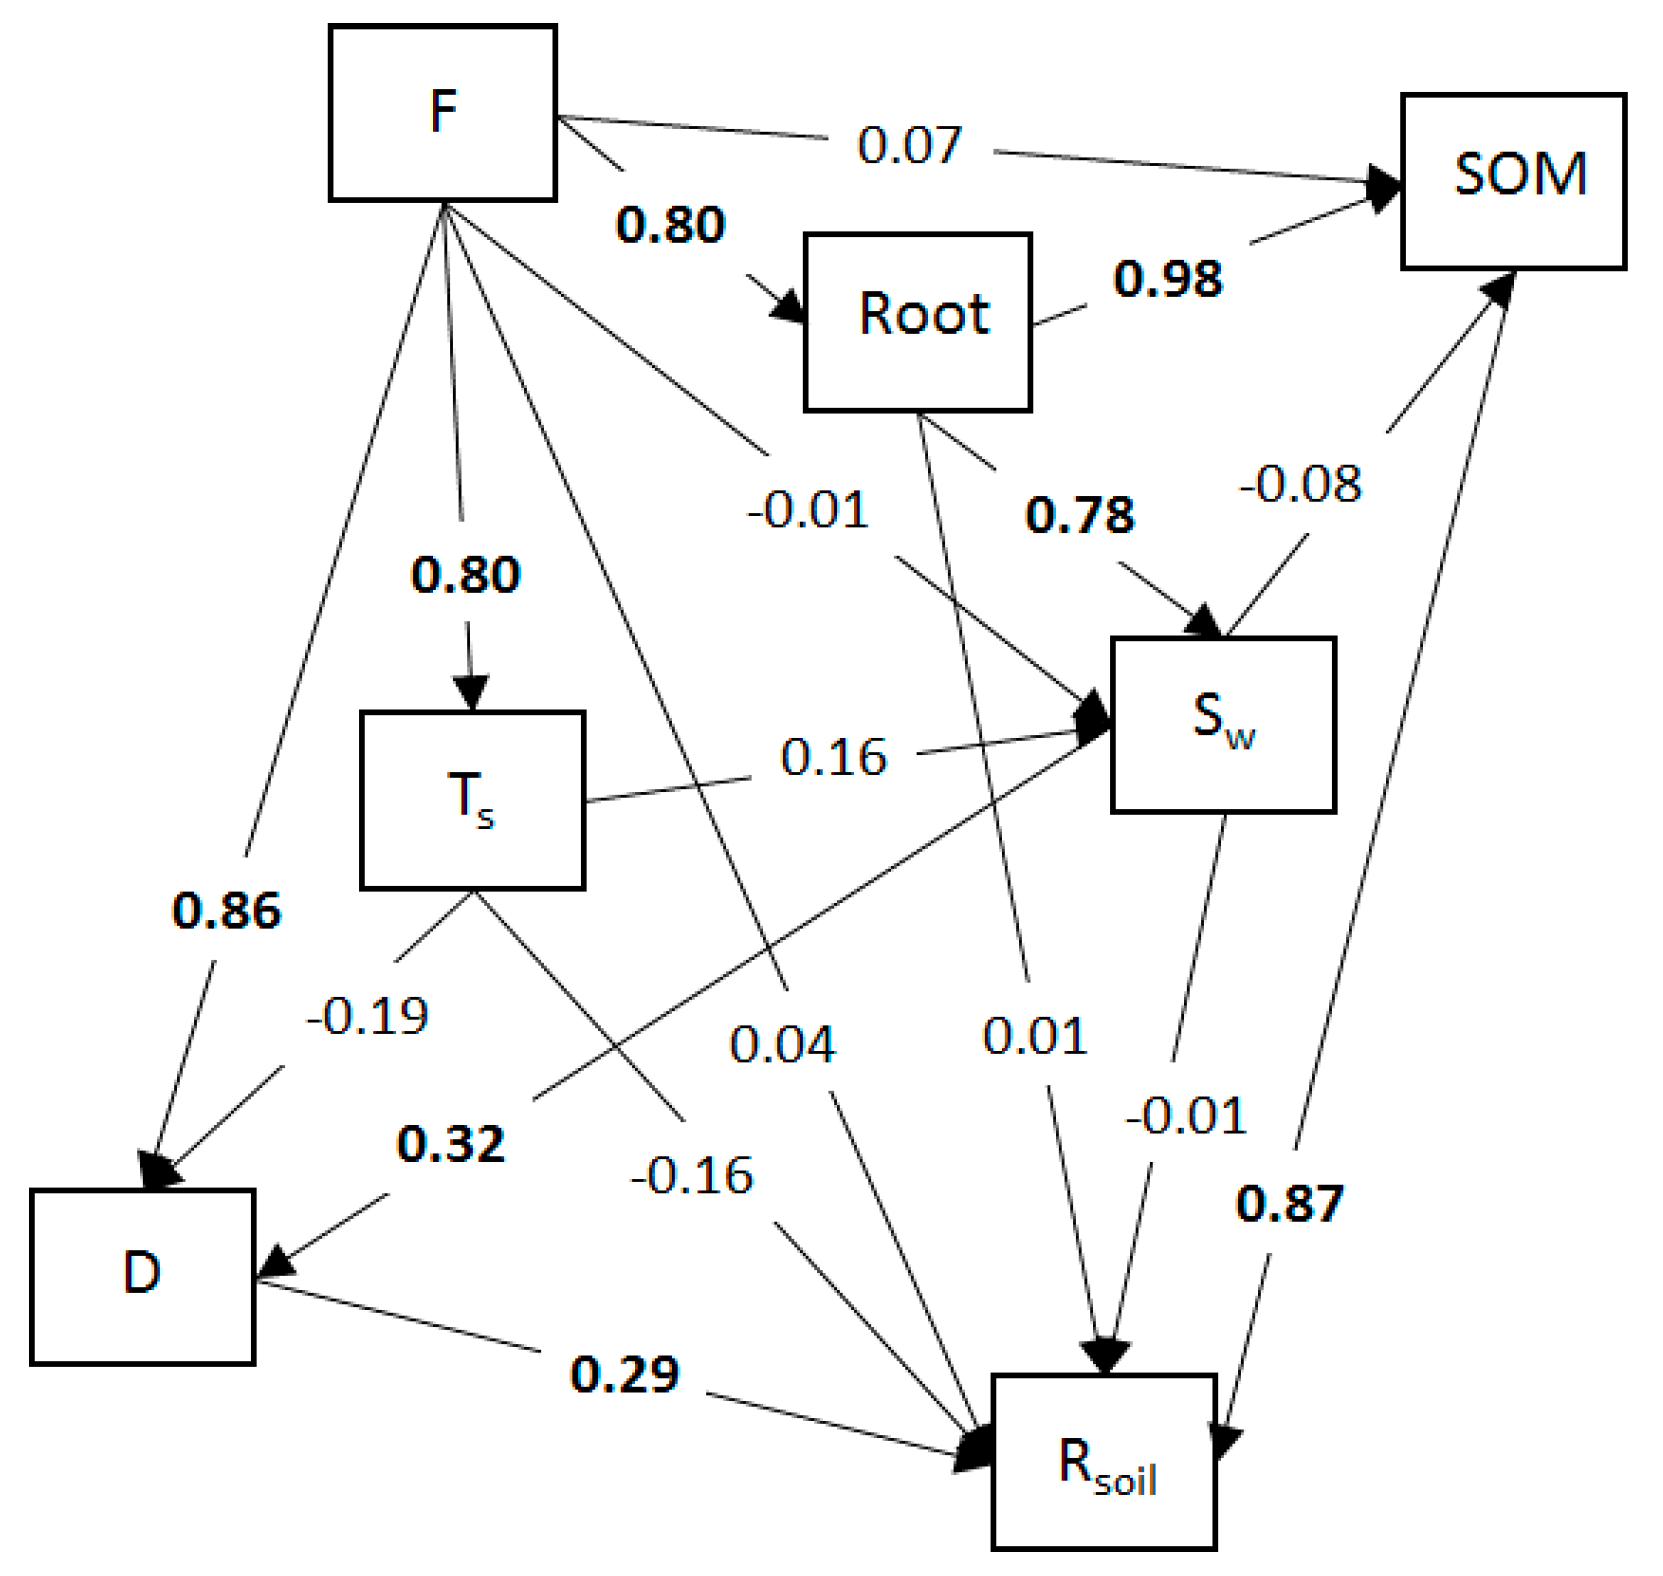
| Decomposition | 0.290 * | NA | NA | NA |
| Litter pool | 0.037 | 0.158 | 0.858 * | 0.089 |
| Soil moisture | −0.002 | NA | 0.318 * | NA |
| Soil temperature | −0.163 | −0.053 | −0.189 | 0.051 |
| Soil organic matter | 0.870 * | NA | NA | NA |
| Root density | 0.011 | 0.863 | NA | −0.039 |
© 2018 by the authors. Licensee MDPI, Basel, Switzerland. This article is an open access article distributed under the terms and conditions of the Creative Commons Attribution (CC BY) license (http://creativecommons.org/licenses/by/4.0/).
Share and Cite
Borges Pinto, O.; Vourlitis, G.L.; De Souza Carneiro, E.M.; De França Dias, M.; Hentz, C.; De Souza Nogueira, J. Interactions between Vegetation, Hydrology, and Litter Inputs on Decomposition and Soil CO2 Efflux of Tropical Forests in the Brazilian Pantanal. Forests 2018, 9, 281. https://doi.org/10.3390/f9050281
Borges Pinto O, Vourlitis GL, De Souza Carneiro EM, De França Dias M, Hentz C, De Souza Nogueira J. Interactions between Vegetation, Hydrology, and Litter Inputs on Decomposition and Soil CO2 Efflux of Tropical Forests in the Brazilian Pantanal. Forests. 2018; 9(5):281. https://doi.org/10.3390/f9050281
Chicago/Turabian StyleBorges Pinto, Osvaldo, George L Vourlitis, Edna Maria De Souza Carneiro, Marizeth De França Dias, Cloe Hentz, and Jose De Souza Nogueira. 2018. "Interactions between Vegetation, Hydrology, and Litter Inputs on Decomposition and Soil CO2 Efflux of Tropical Forests in the Brazilian Pantanal" Forests 9, no. 5: 281. https://doi.org/10.3390/f9050281