Article

Disentangling Contributions of CO2 Concentration and Climate to Changes in Intrinsic Water-Use Efficiency in the Arid Boreal Forest in China’s Altay Mountains

1
State Key Laboratory of Cryospheric Science, Northwest Institute of Eco-Environment and Resources, Chinese Academy of Sciences, Lanzhou 730000, China
2
Laboratory of Tree-Ring Research, University of Arizona, Tucson, 85721, USA
3
School of Geography and Tourism, Shaanxi Normal University, Xi’an 710119, China
4
Institute of Mountain Hazards and Environment, Chinese Academy of Sciences, Chengdu 610041, China
*
Author to whom correspondence should be addressed.
Forests 2018, 9(10), 642; https://doi.org/10.3390/f9100642
Submission received: 30 August 2018 / Revised: 8 October 2018 / Accepted: 9 October 2018 / Published: 13 October 2018
(This article belongs to the Section Forest Ecology and Management)

Abstract

:
Intrinsic water-use efficiency (iWUE) is affected by the balance of photosynthetic rate, stomatal conductance, and climate, along with many other exogenous factors, such as the CO2 concentration in the atmosphere (CO2atm), nutrients, and water holding capacity of the soil. The relative contributions of CO2atm and climate to iWUE are still incompletely understood, particularly for boreal forests where the climate is undergoing unprecedented warming. We combined δ13C and δ18O in tree rings from the Siberian larch (Larix sibirica Ledeb.) in Northwestern China’s Altay Mountains, which receives 190 mm in annual precipitation, to detect the drivers of long-term iWUE changes and their time-varying contributions over the past 222 years. A climate optimization approach was used to isolate the influence of climate from CO2atm influence on iWUE. We found that iWUE increased about 33.6% from 1790 to 2011, and rising CO2atm contributed 48.8% to this iWUE increase. The contributions of CO2atm and climate (drought conditions) varied during the study period 1790–2011. From 1790 to 1876, the climate was the most important factor contributing to the changes in iWUE. From 1877 to 1972, CO2atm was the main contributor; however, after 1973, the climate was again the dominant contributor to the increase in iWUE, especially during 1996–2011. During the period 1996–2011, climate substantially (83%) contributed to the iWUE increase. Our findings imply that, in the boreal forest in Northwestern China’s arid region, iWUE experienced three changes: (1) the climate dominating from 1790 to 1876; (2) CO2atm dominating from 1877 to 1972, and (3) climate dominating again during the past four decades. We observed that the relationships between iWUE and tree-ring width shifted from positive to negative from 1996 onwards. These relationship changes indicate that CO2atm-mediated effects of increasing iWUE on tree growth are counteracted by climatic drought stress and iWUE increase cannot counter the stress from drought on tree growth in China’s arid boreal forest.

1. Introduction

The global carbon and hydrological cycles are coupled through leaf gas exchange [1,2]. Water-use efficiency (WUE), the ratio of CO2 assimilation to water loss, is a critical link between carbon and the terrestrial water cycle. WUE has been identified as an effective indicator to assess ecosystem and forest response to climate change and the rising CO2 concentration in the atmosphere (CO2atm) [3,4,5]. Therefore, understanding WUE changes and their driving forces is essential to project climate change and regional forest carbon sequestration.
The stable carbon isotope ratios (δ13C) in tree rings can be used to estimate the intrinsic water-use efficiency (iWUE) [6,7] and the plant’s physiological response to CO2atm, often explored in strategies for stomatal regulation of leaf gas exchange [8,9,10]. The iWUE is defined as the ratio of CO2 photosynthetic assimilation rate (A) to stomatal conductance (gs) [7]. Variability of gs is related to relative humidity, vapor pressure deficit (VPD) and other climatic variables [7,11].
Tree-ring δ18O values are mainly influenced by the δ18O signature of source water and the evaporative enrichment of leaf water [12], which is controlled by relative humidity and gs, as well as the size of stomatal aperture [12,13]. gs affects tree-ring δ18O through: 1) cooling the leaf temperature during evaporation; 2) the diffusive resistance of water vapor; and 3) the magnitude of the transpiration and 18O enrichment in the leaf water [14]. Therefore, coupling δ13C and δ18O can help detect to what extent the variability of ci is driven by changes in gs or A, and can further indicate whether gs or A contributes to the observed trend of iWUE in response to change in CO2atm and climate [13].
Climate (i.e., drought) and CO2atm can profoundly impact forest iWUE [9,15,16,17,18]. iWUE derived from the tree-ring δ13C has often shown a positive trend since the industrial period (the 1850s). Forests in regions with a warming and drying climate (such as in Europe) exhibit a large increase in iWUE [19,20]. Temperate, boreal, and tropical forests show an increase in iWUE over the 20th century, suggesting strong or moderate stomatal controls in response to rising CO2atm [3,18,21]. Increased iWUE by itself does not systematically result in tree growth enhancement, and rather increased iWUE can also correspond with periods of tree growth decline or mortality [6,16,17,20,22]. The reasons for this may be that climate and other exogenous factors, such as drought [18,22,23,24], mistletoe infection, and nutrient availability [20,22,25], can concurrently affect tree growth by causing stress that counteracts the effect of changes in CO2atm. The relationships between iWUE, climate, and tree growth are not always linear [3,17,25,26]. Thus, to disentangle the contributions of CO2atm and climate to an increase in iWUE, it is important to determine the drivers of iWUE variability in trees or forests [9,10].
Understanding and predicting the dynamics of boreal forests and their physiological responses to climate change has been recognized as increasingly important due to their vital roles in the regional and global carbon cycle and budget [18,24]. Boreal forests are vulnerable ecosystems that have been dramatically impacted by the unprecedented modern rates of warming and increasing CO2atm [18]. Determining their physiological functions requires intensive monitoring of tree growth, productivity, and iWUE [18,24]. Several studies have reported that iWUE has increased in boreal forests [3,5,6,18]; however, the extent, to which climate and/or rising CO2atm contribute to the observed iWUE variability, is not well understood. Improved knowledge of tree physiological performances under changing climate and CO2atm is important for exploring the mechanism of iWUE and its drivers and for predicting future forest change, such as greening or declines in tree growth.
In the present study, we combined tree-ring δ13C and δ18O from the arid boreal forest in China’s Altay Mountains to investigate the relationships between iWUE, climate, and CO2atm. The aims of the study were to: (1) disentangle the contributions of climate and rising CO2atm to observed iWUE variability between 1790 and 2011; and (2) detect the interaction between changes in iWUE and tree-ring growth.

2. Data and Methods

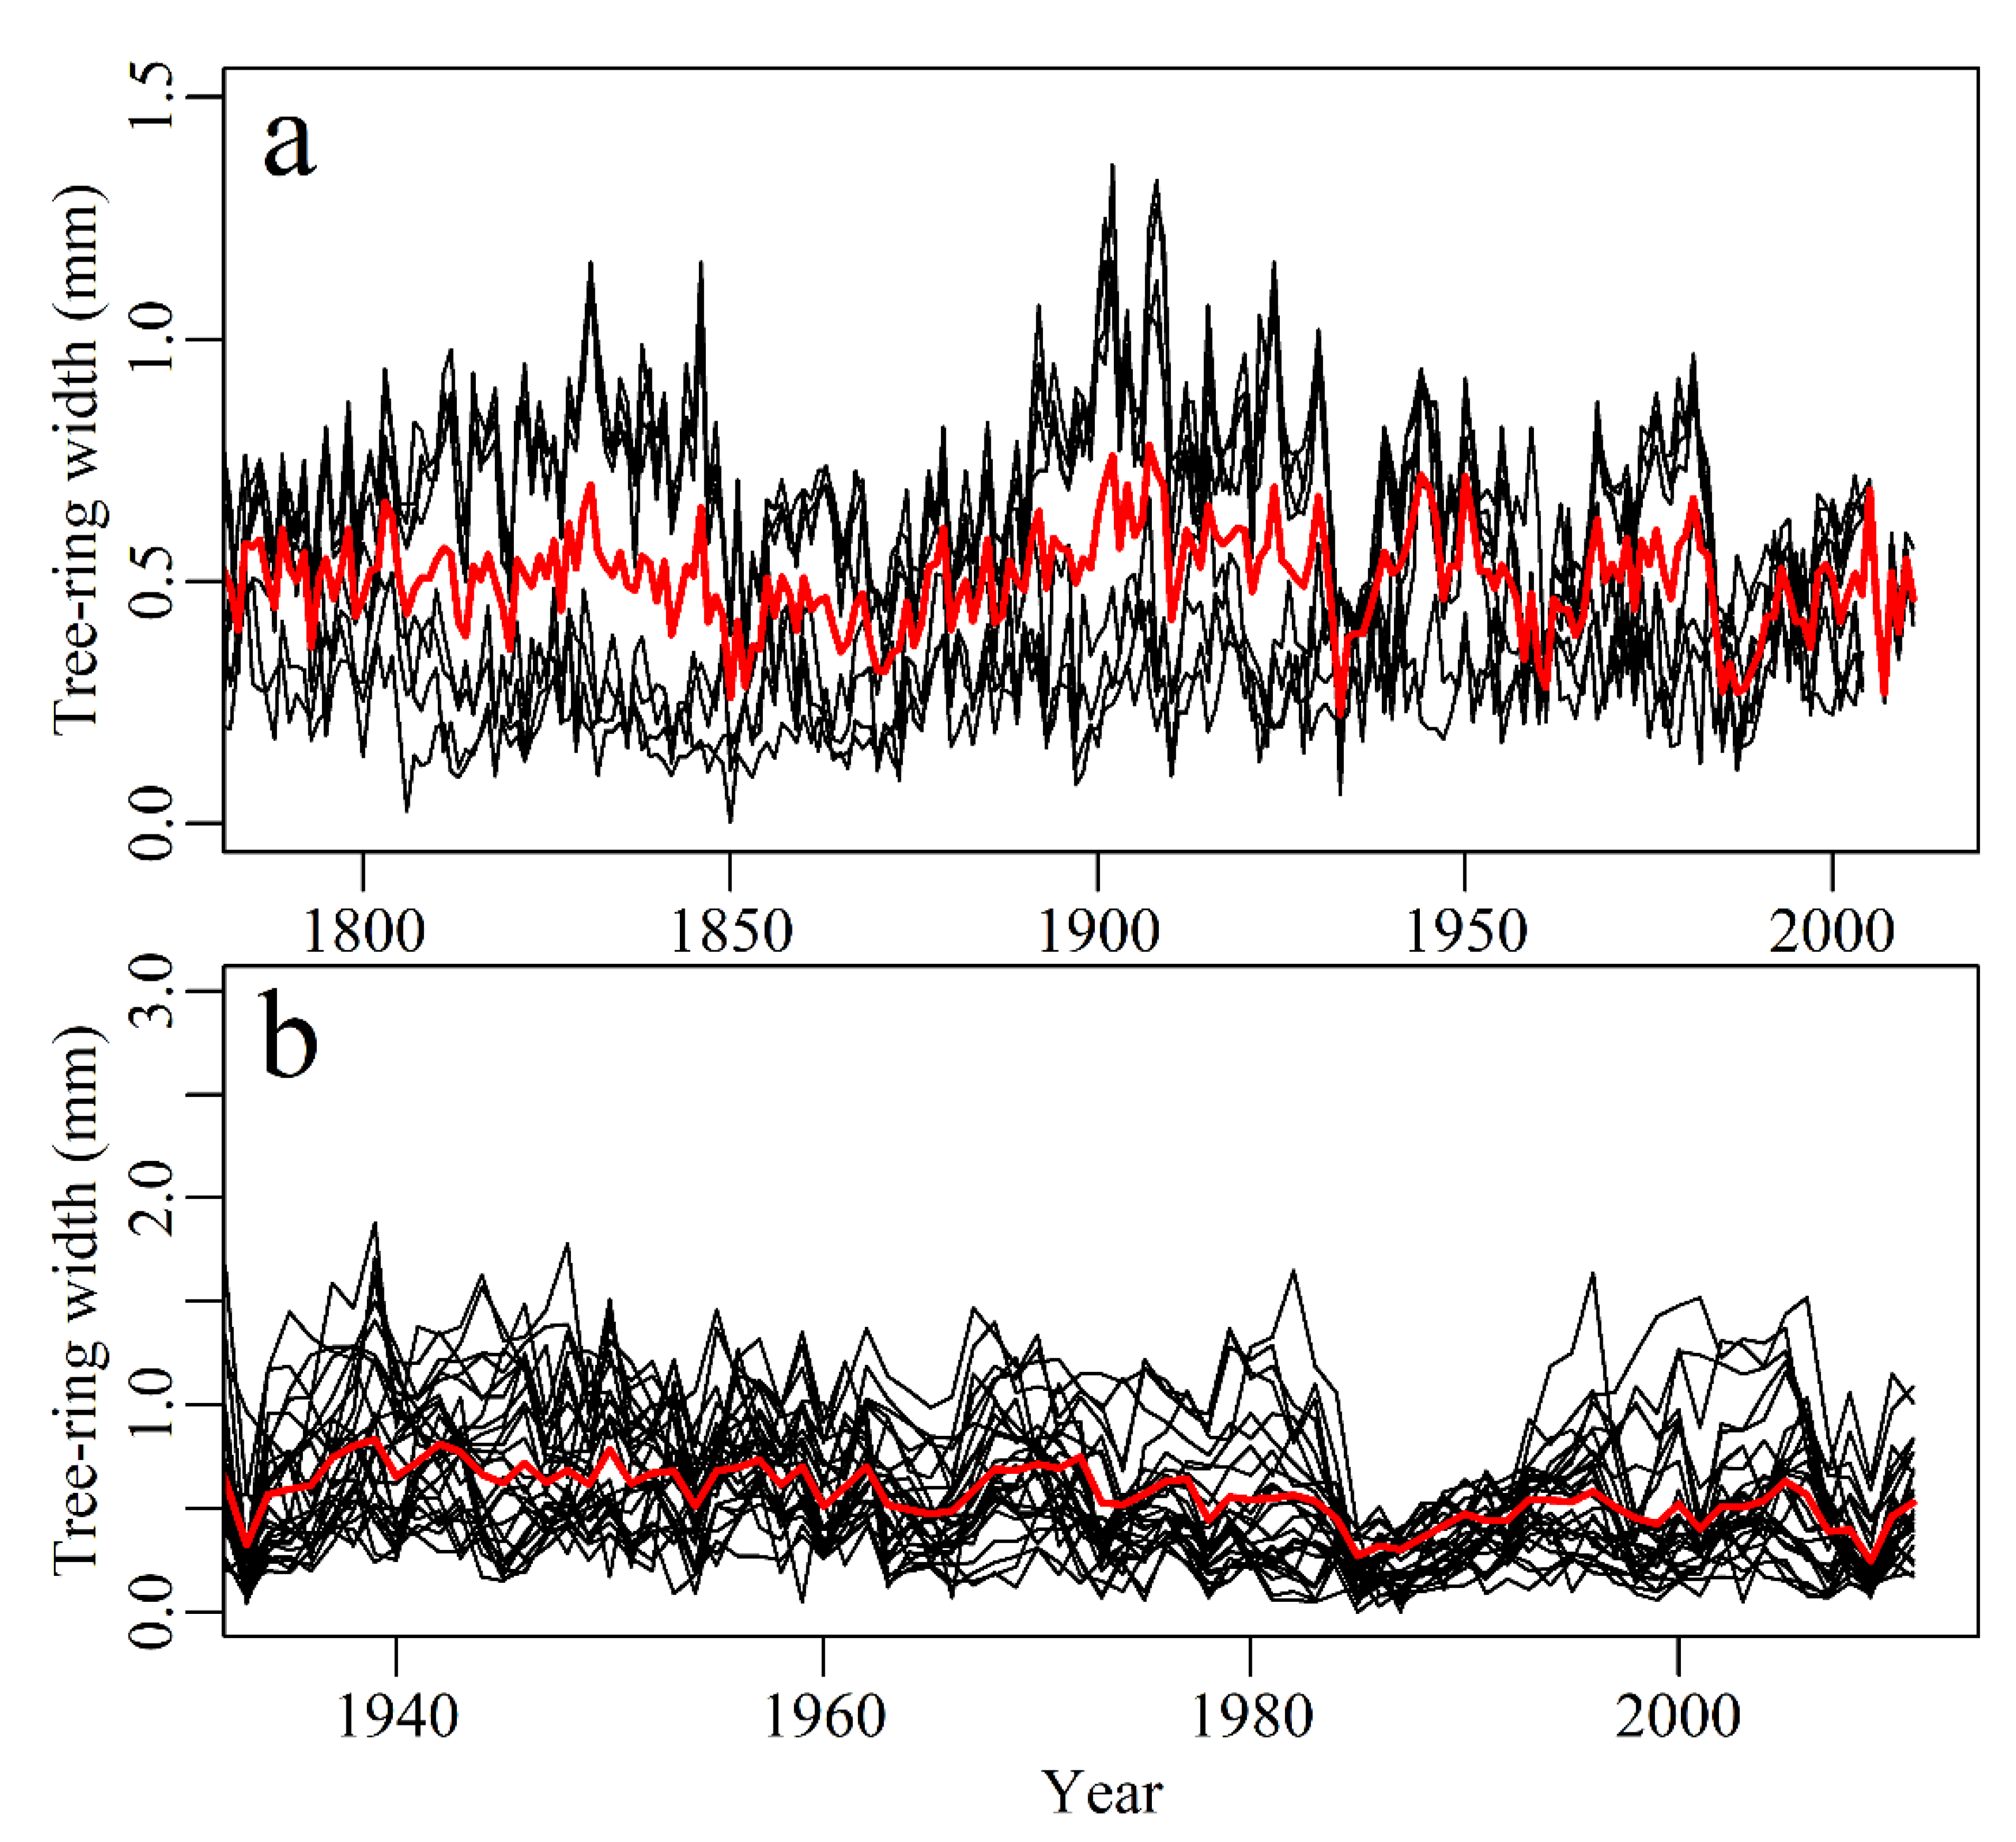
2.1. Sampling Site and Tree-Ring Width Measurements

We obtained samples at the Daqiao natural forest reserve (47.52° N, 89.48° E; 2100 m a.s.l.) in Northwestern China’s Altay Mountains [27]. The dominant tree species in the study region is the Siberian larch (Larix sibirica Ledeb.), a typical tree species of the Taiga forest. We sampled 35 mature trees without any obvious damage and collected 70 tree-ring cores at breast height using increment borers (Haglof, Mora, Sweden). All cores were air-dried, sanded and dated using the Time Series Analysis and Presentation (TSAP) features of LINTAB (LINTAB 6; Rinntech, Heidelberg; [28]). All the measurements were checked for cross-dating accuracy with COFECHA software [29].

2.2. Climate Data

Climate data of the Fuyun meteorological station (46.98° N, 89.52° E; 826.6 m a.s.l., 60 km far from the sampling site) were obtained from the Chinese meteorological data service center (http://data.cma.cn/). Climate variables included monthly mean temperature, monthly precipitation sums, and monthly mean relative humidity over the period 1961–2011. Monthly mean temperature and monthly mean relative humidity datasets were used to calculate monthly mean VPD [30]. The annual mean temperature is 3.01 °C, with the coldest monthly mean temperature in January (−20.60 °C) and the warmest monthly mean temperature in July (22.16 °C) (Figure 1). The climate at the site is typically arid with a total annual precipitation of 190 mm [27], with half of the total annual precipitation falling from May to September (the tree-growing season). The mean annual relative humidity is 59.28%, with the highest monthly relative humidity in December (77.84%) and the lowest in May (43.23%). The highest monthly mean VPD value appears in July (14.20 hPa) (Figure 1).
To extend the instrumental climate record and validate the climate signal detection back to 1901, we used CRU TS 3.22 climate data from four grid points (0.5° × 0.5°, domain: 47~48° N, 89~90° E) [31] and calculated regional climate by taking the arithmetic mean across those grid points. We calculated monthly relative humidity using the ratio of vapor pressure (ea) to saturation vapor pressure (esw) estimated from CRU monthly temperature [30]. The VPD was calculated as the difference between esw and ea [30].
To directly compare the climate data from the Fuyun meteorological station and CRU TS 3.22, we converted the climate data to z-scores relative to the period 1961–2011 (Figure S1, Supplementary Materials). Then, we compared the co-variability in each of the climatic variables using Pearson’s correlation coefficients and tested their trends using linear regressions.

2.3. Tree-Ring Stable Isotope Measurements

We selected nine cores for isotopic measurements from nine trees (Figure 2) with homogeneous growth patterns and similar ages (around 200–260 years). We pooled the wood material from the same calendar year and extracted α-cellulose using the Jayme-Wise method [27,32]. The α-cellulose was homogenized using an ultrasound machine ([33]; JY92-2D, Scientz Industry, Ningbo, China). Tree-ring α-cellulose δ13C values were measured using an elemental analyzer (Flash EA 1112, Italy) coupled to a continuous-flow isotope ratio mass spectrometer (Delta Plus, Thermo Electron Corporation, Bremen, Germany) at the Key Laboratory of West China’s Environmental System, Lanzhou University. Tree-ring α-cellulose δ18O was determined using a high-temperature conversion elemental analyzer (TC/EA) coupled to a Finnigan MAT-253 isotope ratio mass spectrometer (Thermo Electron Corporation, Bremen, Germany) at the State Key Laboratory of Cryospheric Science, Chinese Academy of Sciences, Lanzhou, China. The analytical uncertainty (1σ) for these measurements was below 0.05‰ for δ13C and below 0.25‰ for δ18O.

2.4. IWUE Estimation from Tree-Ring Δ13C and Climate Optimization in ci

The tree-ring δ13C can be used to derive the iWUE [6,7] as follows:
i W U E = A g s = c a c i 1.6 = c a × 1 c i c a 1.6 = c a ( b Δ 13 C ) 1.6 ( b a )
where Δ13C is the carbon isotopic discrimination and reflects its relationship with CO2 intercellular concentration (ci) and the concentration in the ambient atmospheric air (ca) [8]. Δ13C is described as [7]:
Δ 13 C = δ 13 C a δ 13 C plant 1 + δ 13 C plant 1000 = a + ( b a ) ( c i / c a )
where a is the fractionation during CO2 diffusion through the stomata (≈ 4.4‰, [34]), and b is the fractionation due to carboxylation (≈ 27‰; [8]).
We corrected the tree-ring δ13C using the difference in δ13C between the leaf-level process and the wood cellulose (2.1‰) owing to post-photosynthesis fractionation, and estimated its uncertainty as 1.5‰ [7,9]. Tree-ring δ13C values were then corrected for the Suess effect using Δ13C in Equation (2) [7]. δ13C and ca values of the air from 1850 to 2003 were obtained from Reference [11]. ca data since 2004 were obtained from NOAA (https://www.esrl.noaa.gov/).
Isolating how CO2atm affects tree physiology and the leaf-to-CO2atm gradient is important to quantify how ci or ci/ca of trees has changed since the 1850s [6,9,10,20,35]. It is necessary to remove the climatic effects on ci. The following general procedures were applied [9,36]. First, we calculated the Pearson’s correlations between ci and climatic parameters (temperature, precipitation, relative humidity, and VPD) at high-frequency scales (herein, the first-order difference (FOD, the current year minus the previous year) and 30-year spline “high-pass” filter (HF)) to identify the potential climatic signals, using the bootstrap resampling method in the “treeclim” R package [37]. The climatic windows were from monthly (from October of the previous year to October of the current year) to seasonal windows. We then applied principal component analysis (PCA) to these potential climatic variables to achieve an optimum climatic target (PC1), which has a high correlation and meaningful mechanistic relationship with ci. The tree-ring ci series was then adjusted by adding a factor τ value (ci + τ * (ca-280)) [9]. We varied the τ range [−1, 2] with an interval of 0.002 and regressed the adjusted ci (shortened as ci-tau) series to the optimum climatic target. The optimum τ value was determined by the mean values of τ yielding the maximization of explained variance and the minimization of the absolute trend in model residuals [9]. The advantage of this approach is that it considers the low-frequency changes in estimating plant response, but not in the climatic screening [9]. We represented ci adjusted by optimum τ value as ci-climate. The difference between tree-ring ci and ci-climate was the physiological influence (mainly from CO2) of removing climate (climate corrected ci, ccci) based on empirical quantification. The influence of climate on iWUE was removed by producing a climate-corrected iWUE (cciWUE) using Equation (1).

2.5. Data Analysis

The changepoints of tree-ring Δ13C and δ18O, ci, ci-climate, ci/ca, iWUE, and cciWUE based on mean and variance over the past 222 years were detected using the “cpt.meanvar” function in the R package “changepoint” [38]. We used the Schwarz Information Criterion (“SIC”) penalty parameter to assess the statistical significance of changepoints [38], and the significant changepoint years were applied to divide the series into multiple sub-periods.
We assessed the percent change of the ci, ci-climate, iWUE and cciWUE relative to the first decade (1791–1800). The percent change did not vary with the absolute value changes from different periods and had the advantage of reflecting the variations of the series. Then, in order to quantify the drivers of iWUE, we calculated the contributions of CO2atm and climate to changes in iWUE for each sub-period using the cumulative values of the FOD in percent change, thereby estimating the proportion of their relative contributions.

2.6. Climatic Signals from Tree-Ring δ18O

Tree-ring δ18O responses to climate were calculated using the R package “treeclim”, and temporal stability was explored using running correlations over a 25-year interval [37]. We used tree-ring δ18O to investigate potential climatic targets for reconstruction, based on results of climatic response analysis and a reasonable mechanistic explanation. A linear regression model was developed between the chosen target and tree-ring δ18O (as an independent variable). We conducted cross-calibration/verification and leave-one-out calibration/verification procedures using the statistical parameters of the reduction of error (RE) and coefficient of efficiency (CE) to assess the skills of the reconstruction [29].

2.7. Tree-ring Growth and IWUE

In order to avoid potential artifacts caused by dendroclimatic standardization detrending methods [20,39], we assessed tree growth by comparing the density distribution of tree-ring widths during recent sub-periods with those of previous sub-periods using all individual core ring-width time series. The density distribution was estimated using the density probability of the ring-width for each period. We examined the homogeneity of variance of ring-width for each sub-period using a non-parametric chi-squared test (Kruskal–Wallis). We conducted an analysis of variance (ANOVA) using the Tukey multiple comparisons (Tukey HSD) test to examine the differences in the average ring-width between the sub-periods in R [40]. Before the density distribution estimation, we split the trees into old (>350 years) and medium-aged (200–350 years) groups, using the cambial age of the trees. After binning, we discarded the first 130–200 years to estimate the density distribution of ring-width. This approach has been applied successfully to assess tree growth [20,39]. We truncated the ring-width time series to only portions of the time series with no long-term trend: after 1790 for the old trees and after 1930 for the medium-aged trees. The correlations between the average tree-ring width time series and the climate variables were calculated to detect the main climate drivers for tree growth. We used linear regressions to detect the relationships between tree growth and iWUE at the tree-ring core level and group mean values level.

3. Results

3.1. Climate Variability in the Study Region

The CRU TS 3.22 and Fuyun meteorological station data showed similar variability (Pearson’s correlation coefficient: r > 0.59, p < 0.001; 1961–2011; Figure S1, Supplementary Materials) in May–August temperature, precipitation, and VPD, but slightly different trends in relative humidity from 1961 to 1980. May–August mean temperature (0.04 per year) and VPD (0.04 per year) from the Fuyun meteorological station showed significant (p < 0.001) increasing trends, while the May–August relative humidity decreased (−0.03 per year, p < 0.001) from 1961 to 2011 (Figure S1, Supplementary Materials). The May–August precipitation showed a non-significant decreasing trend (−0.03 per year) from 1983 to 2011.

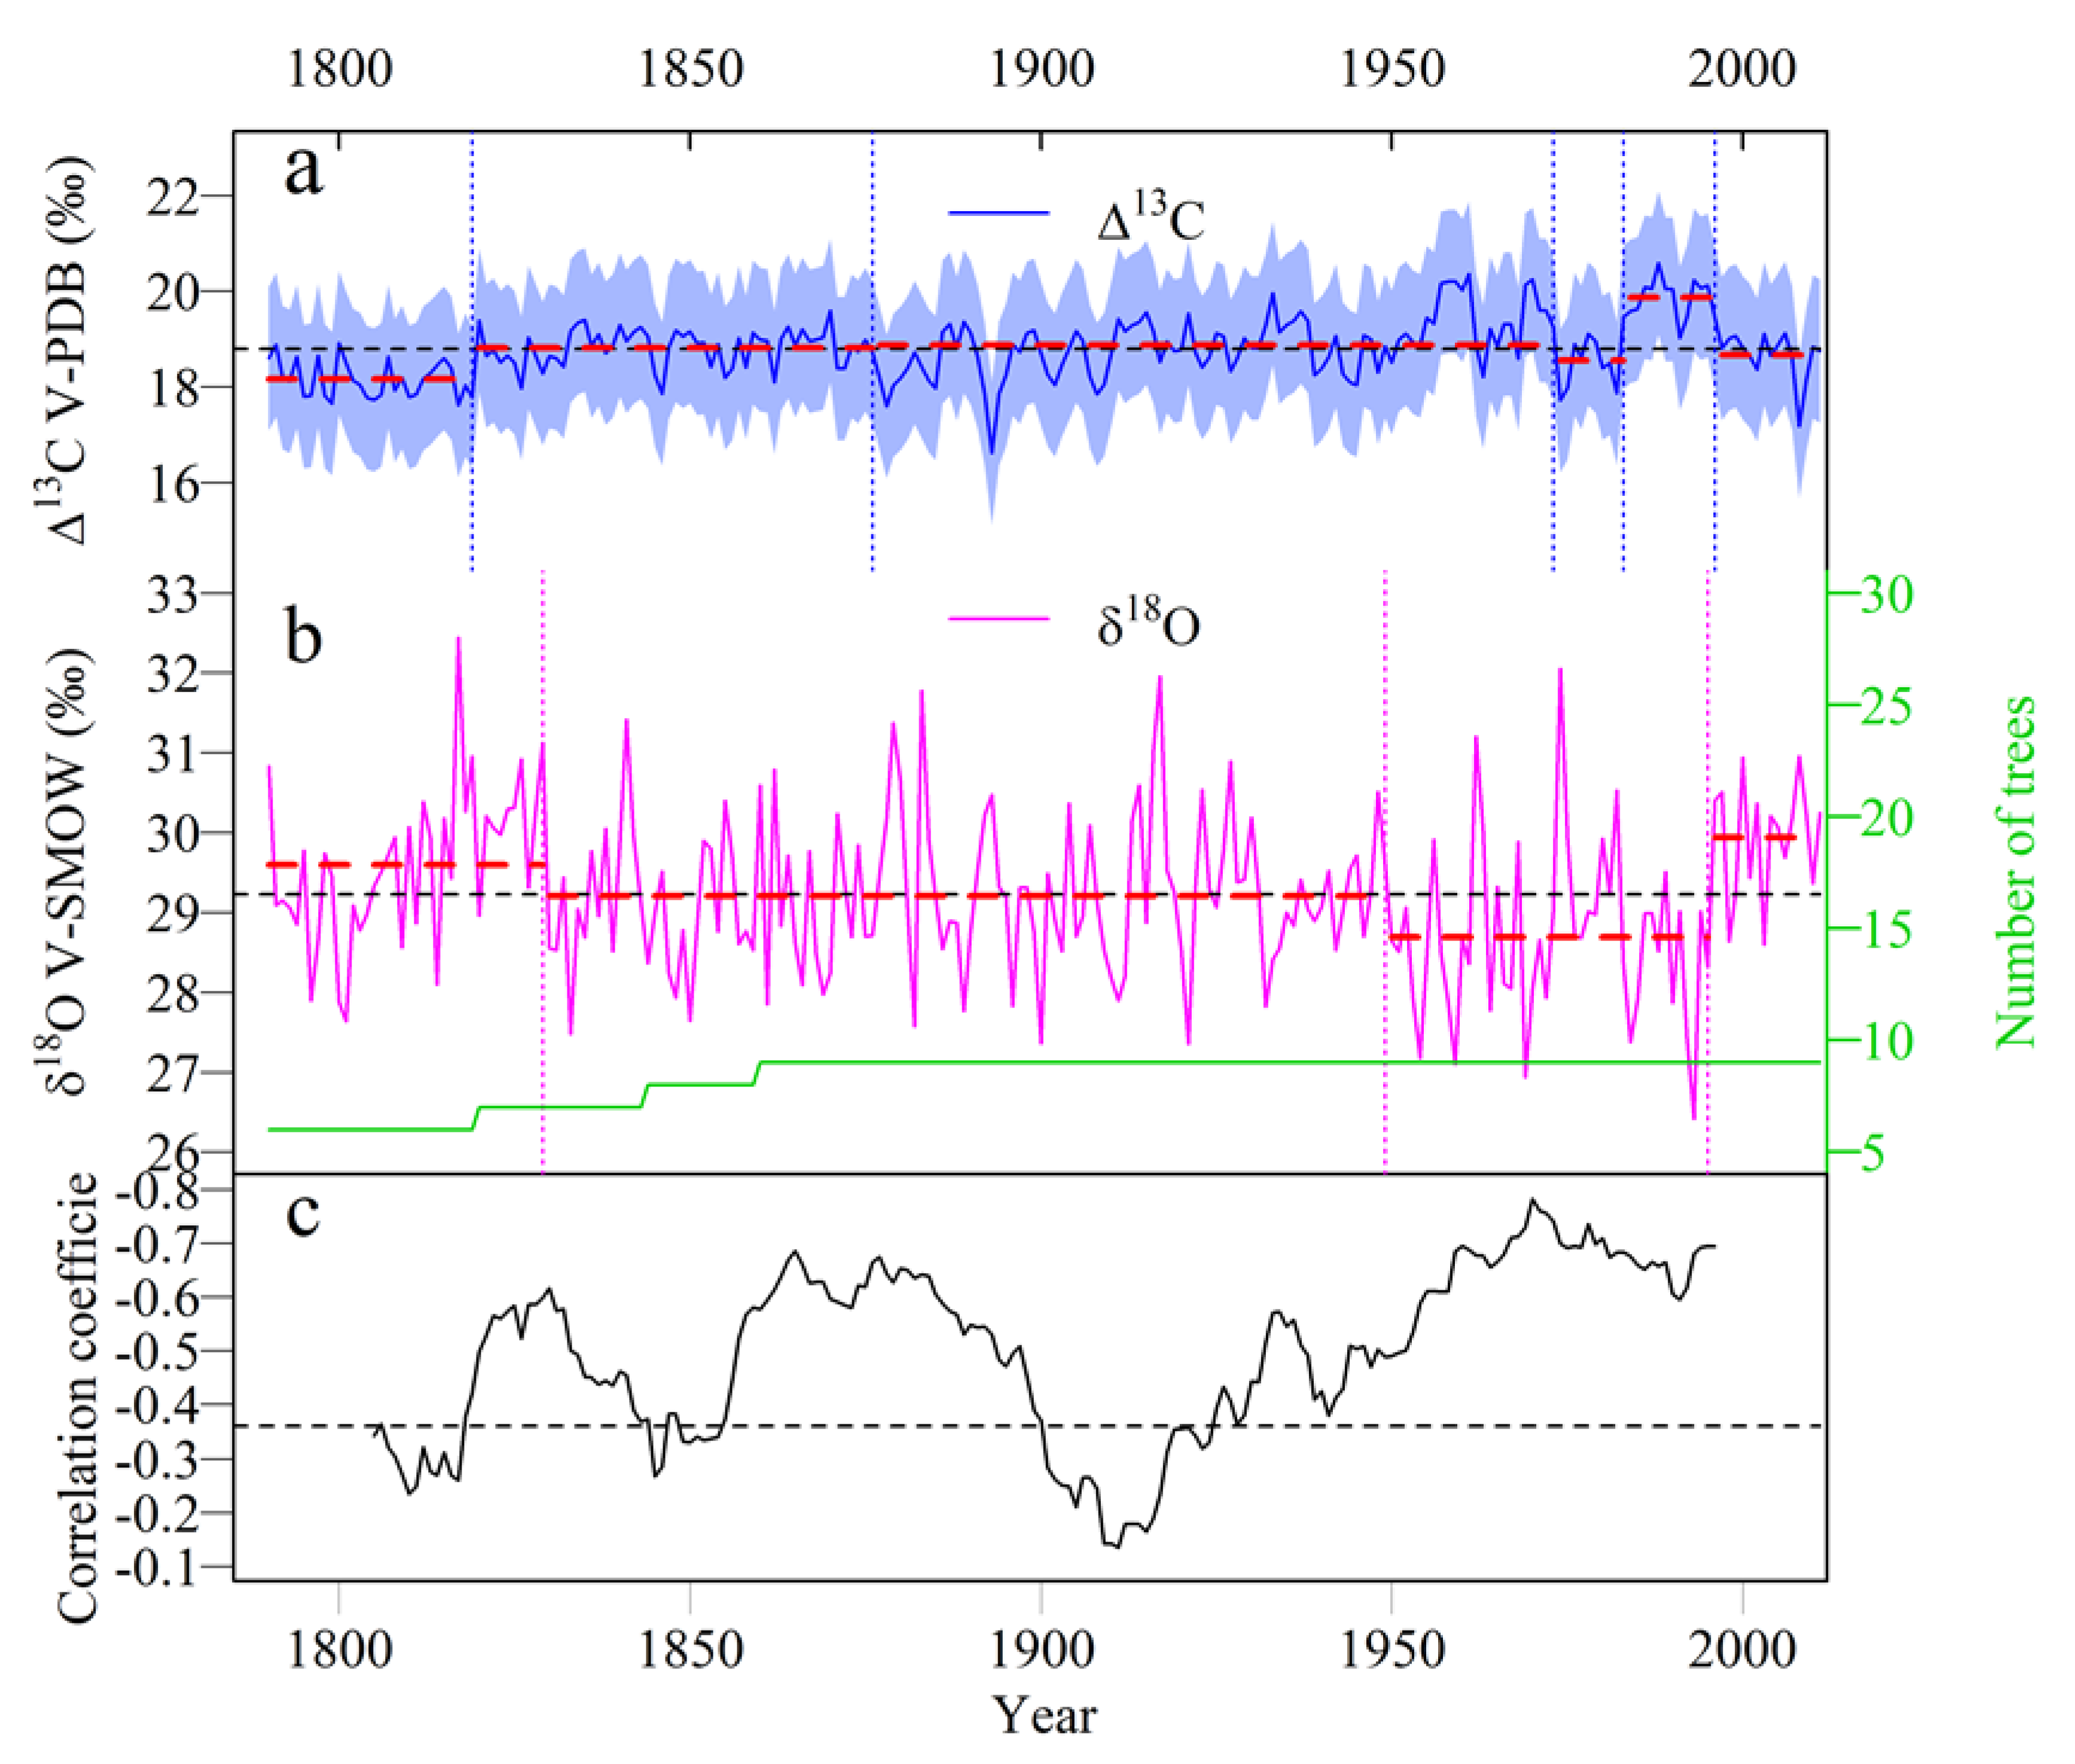
3.2. Temporal Variations of the Tree-Ring Δ13C and δ18O

The tree-ring Δ13C series showed a significant (p < 0.001) increasing trend (0.004‰ per year) over the past 222 years, with changepoint years in 1819, 1876, 1972, 1982, and 1995 (Figure 2a). The shift of mean values of the tree-ring Δ13C occurred in the periods 1790–1819, 1972–1982, 1983–1995, and 1996–2011. The tree-ring δ18O series revealed no significant trend during the whole investigation period, and changepoint years occurred in 1829, 1949 and 1995 (Figure 2b).
The tree-ring Δ13C showed a co-variability with the tree-ring δ18O for most of the study periods (Figure 2c). Specifically, the 31-year running correlations between tree-ring Δ13C and δ18O revealed negative correlations were stronger than −0.5 for the periods centered around 1820–1840, 1860–1890 and 1960–2011.

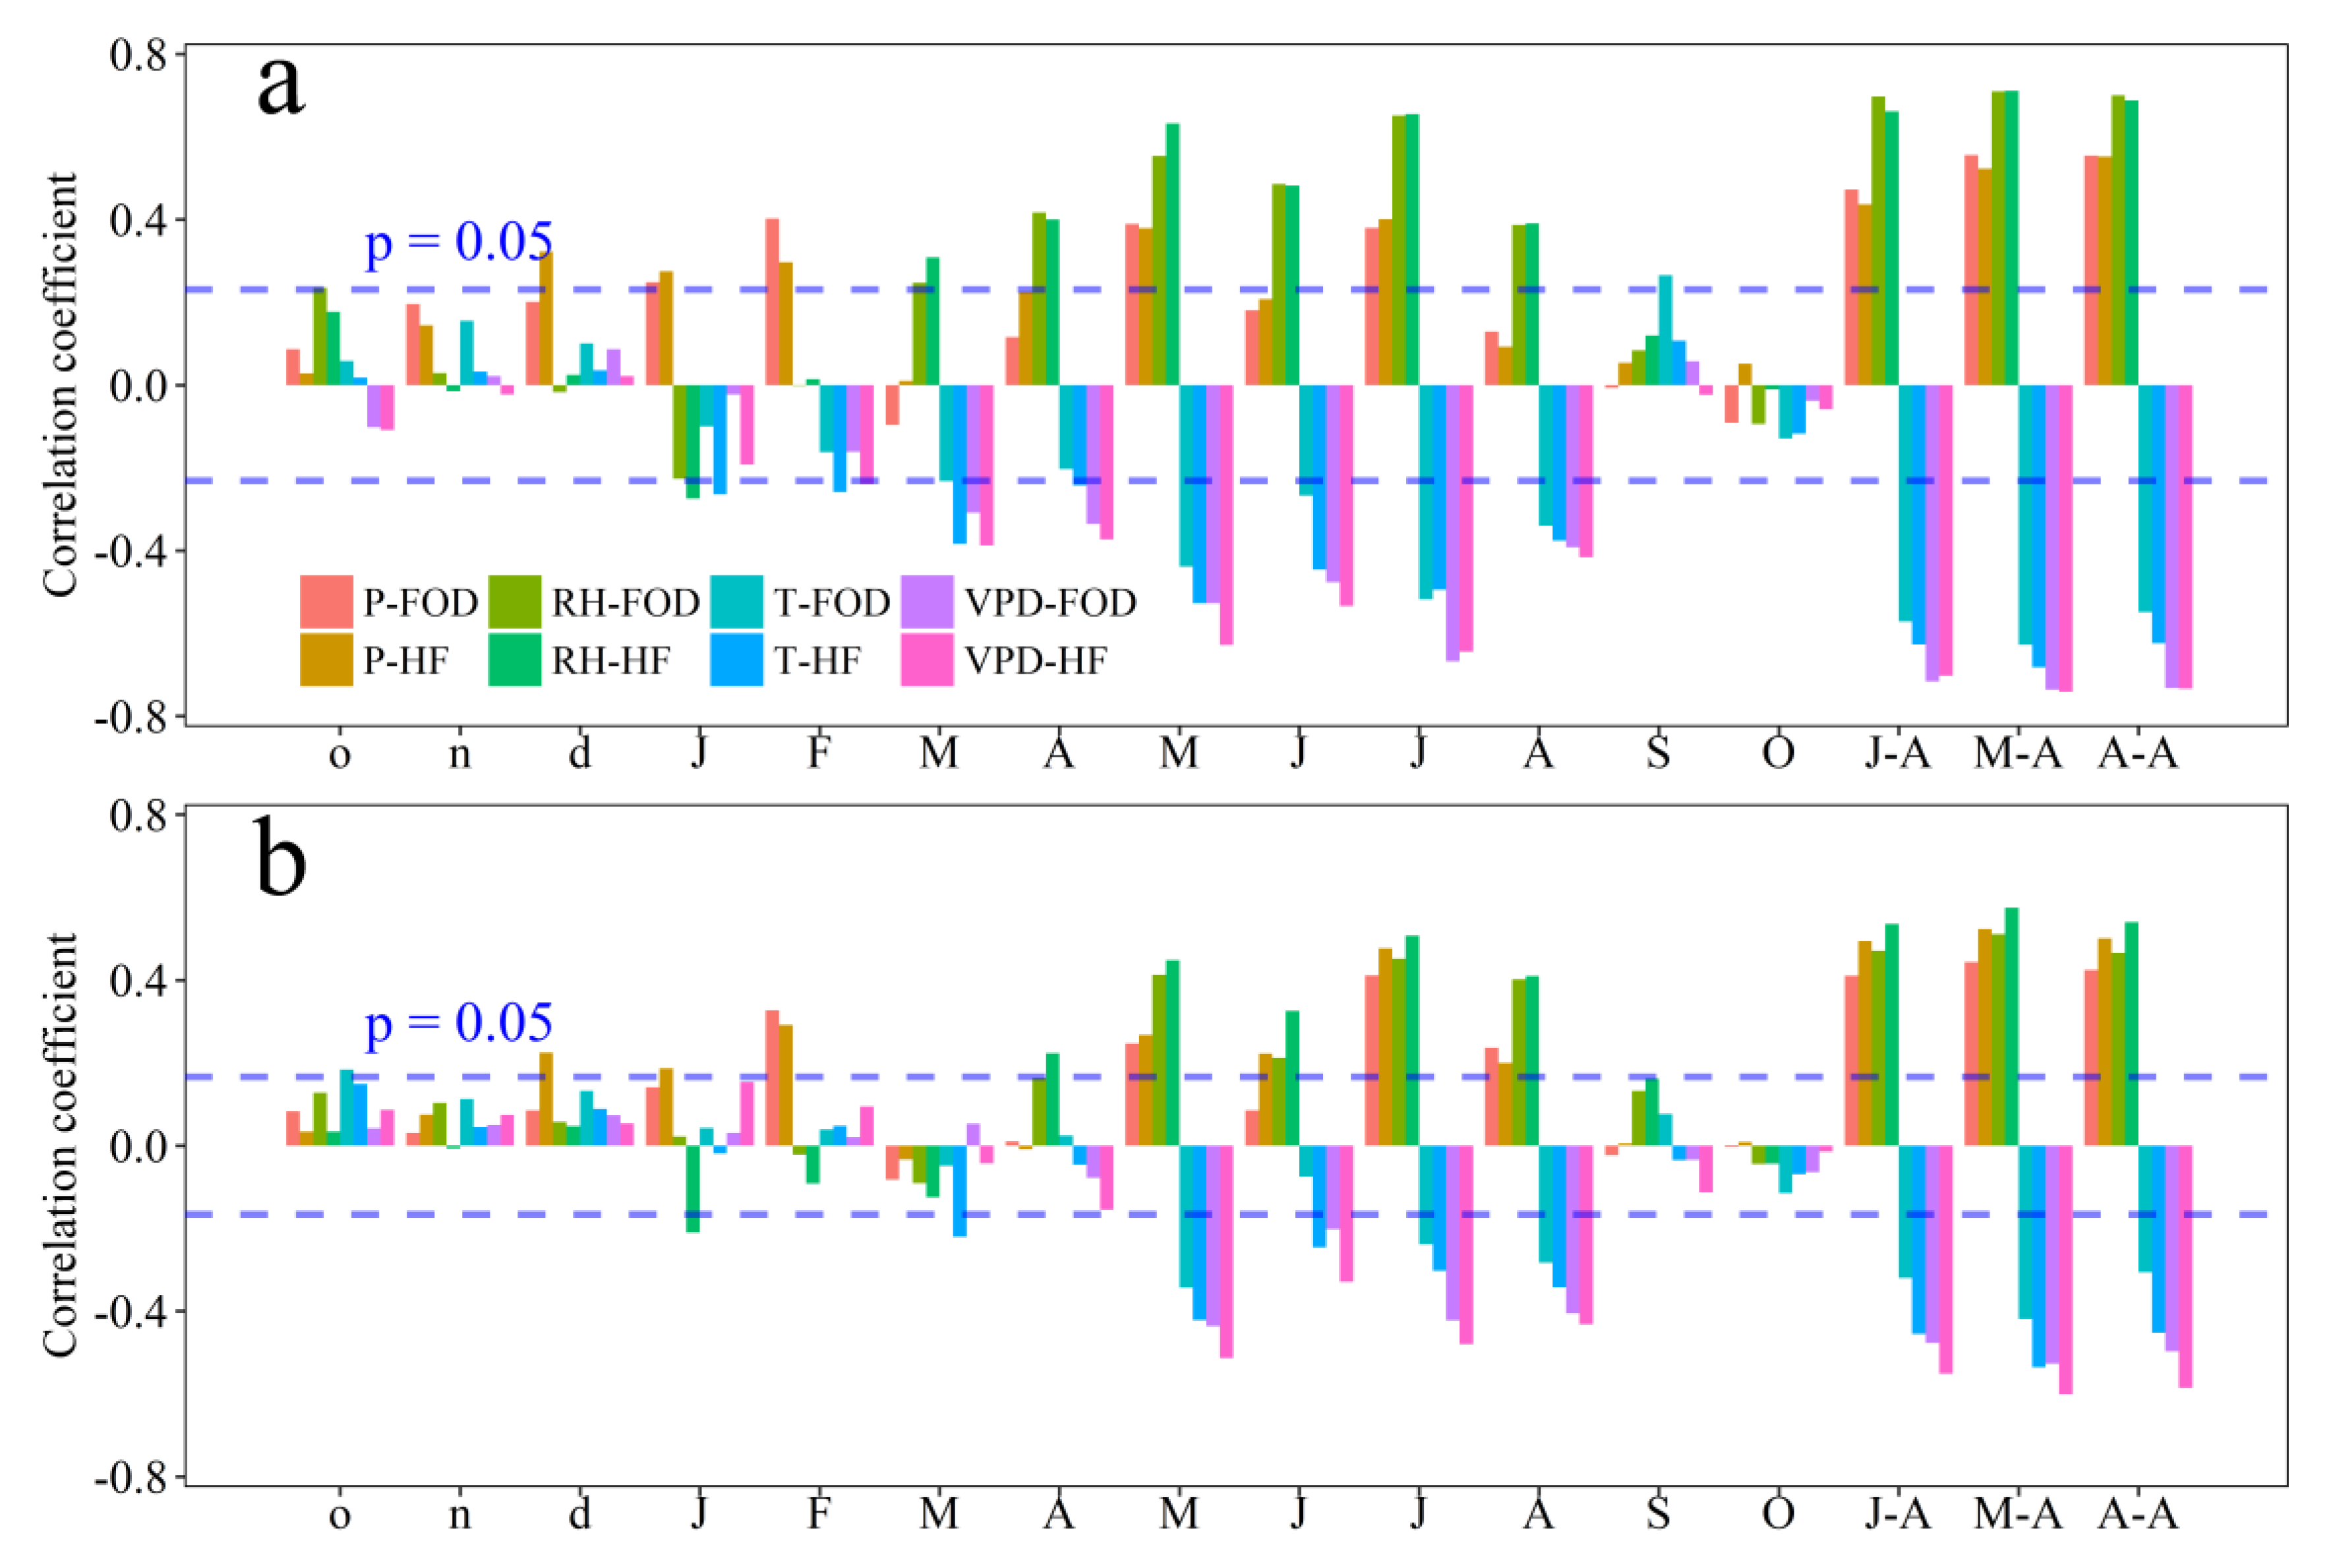
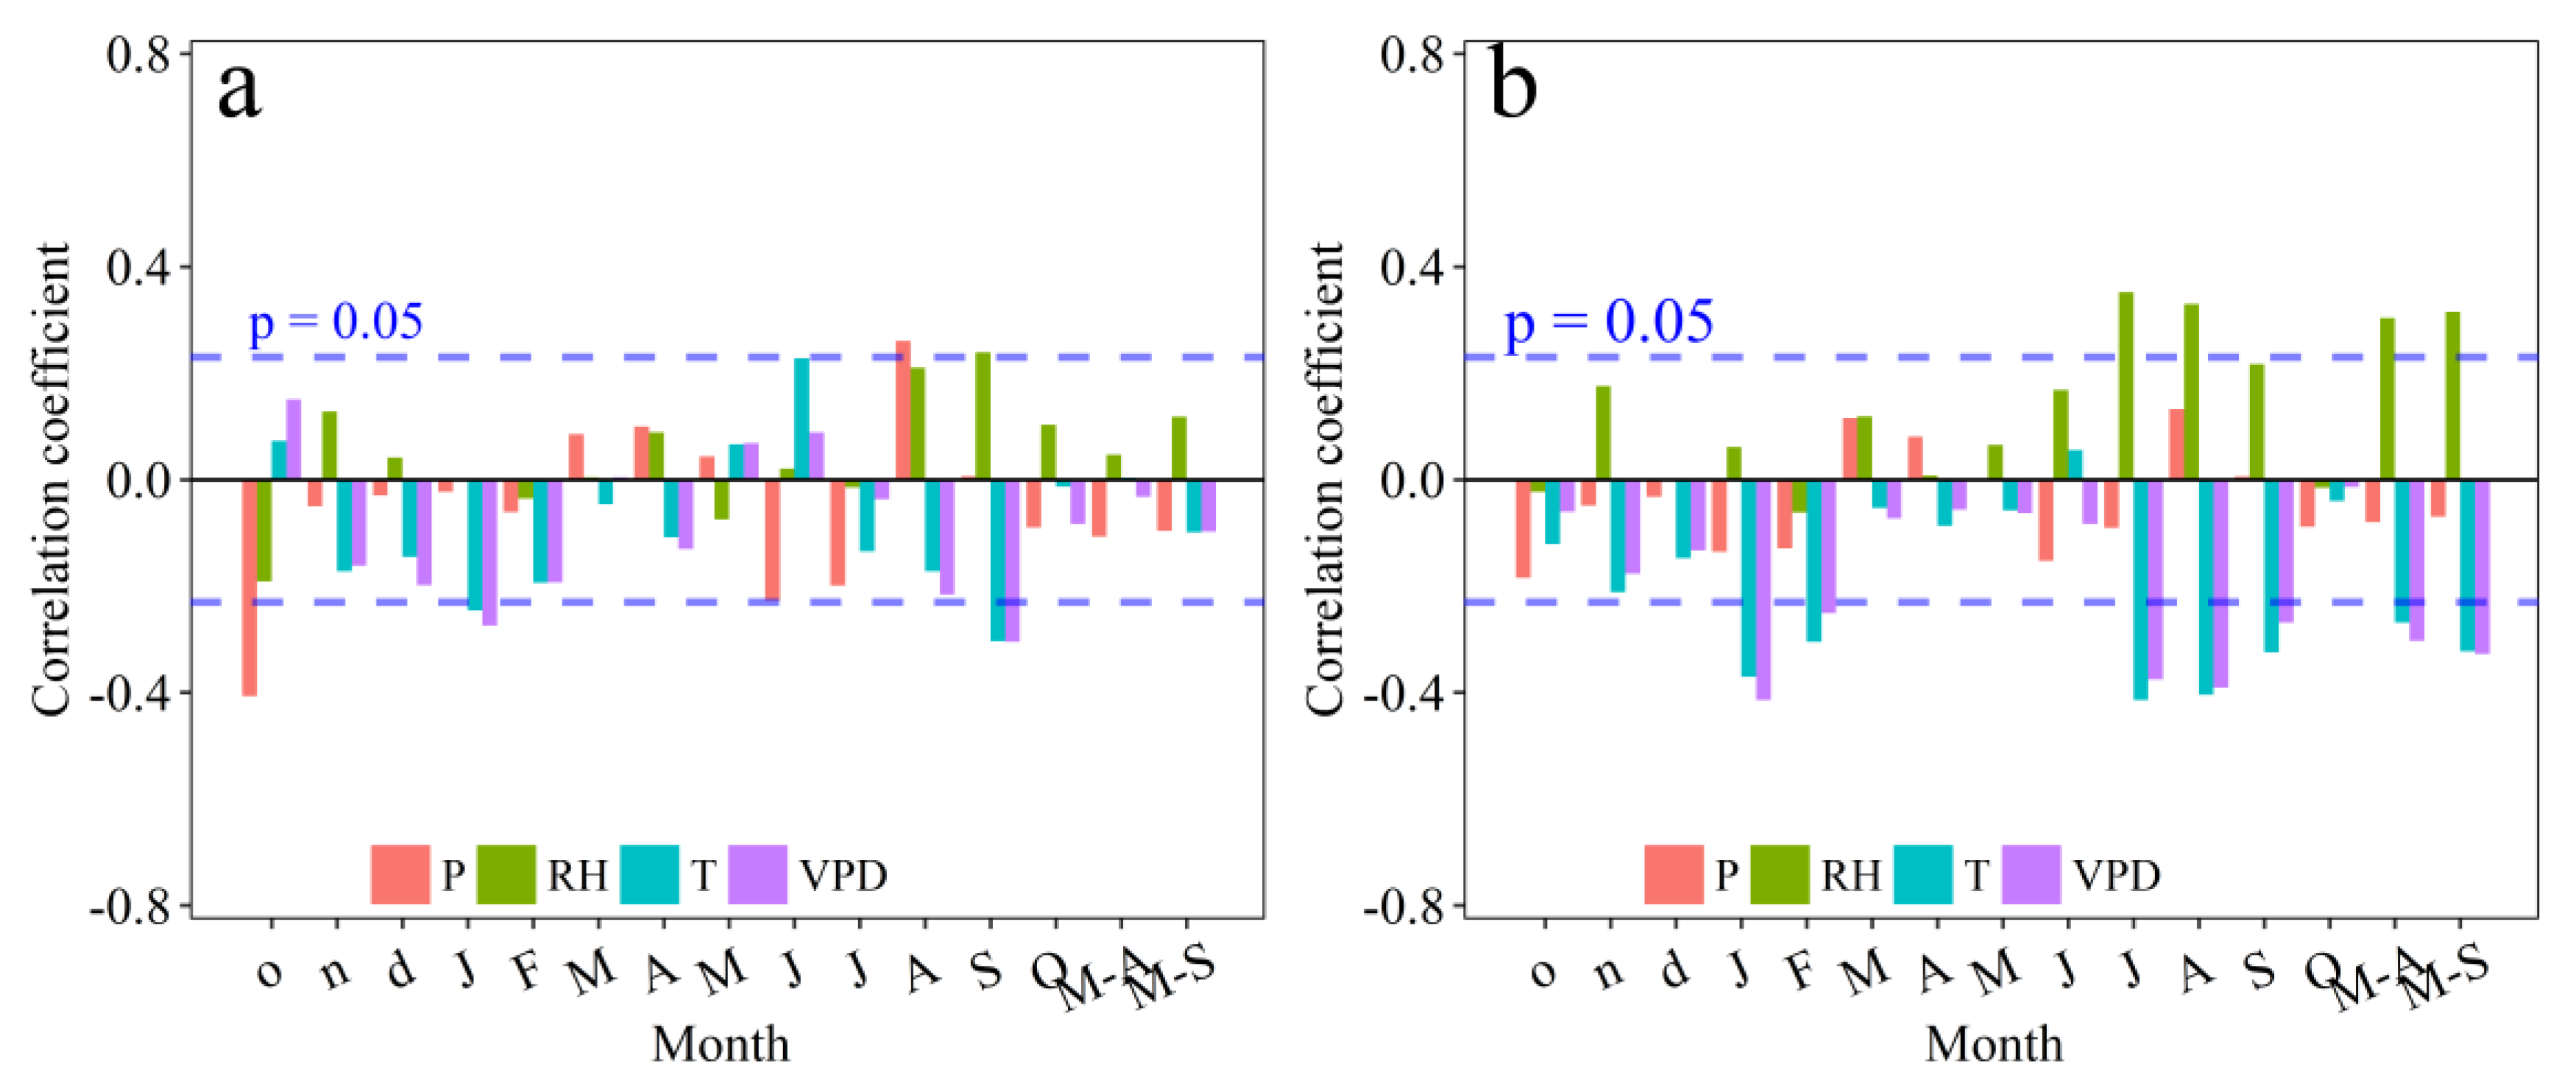
3.3. Climate Response of ci and Tree-Ring Width

Pearson’s correlation coefficients indicated similar climatic response patterns of ci for the two climatic datasets (meteorological station and CRU). Specifically, ci was correlated (p < 0.05) with temperature and VPD (meteorological station: −0.39 to −0.74; CRU: r = −0.20 to −0.60) from May to August, for individual months and combinations of months (Figure 3a,b). ci was positively (p < 0.05) correlated with precipitation in February, May, and July. In addition, ci showed significant (p < 0.05) positive correlations with relative humidity from May to August (meteorological station: r = 0.39–0.65; CRU r = 0.36–0.51; Figure 3). We used PC1, which explained 76% of the total variance based on VPD, temperature, precipitation, and relative humidity in May–August as the optimum climatic target. PC1 had the strongest correlations (meteorological station: r = −0.74; CRU: r = −0.54, p < 0.01; not shown) with ci at the FOD time scale. A series of ci-tau were numerically simulated to detect the optimum τ values for climate corrections (Figure 4). The final optimum τ value (−0.67) was used to calculate ci-climate, which showed a strong co-variability with PC1 from observations (r = −0.65) and CRU (r = −0.60) (Figure 4b,c).
The truncated ring-width time series did not show significant long-term trend (Figure 5). Averaged tree-ring width time series showed weak Pearson’s correlation coefficients to climate variables but were significantly correlated with precipitation in October of the previous year and August of the current year for old trees (Figure 6). Temperature and VPD in January and September were negatively (p < 0.05) correlated with tree-ring width for both old and medium-aged trees. In addition, the tree-ring width series from medium-aged trees was negatively (p < 0.05) correlated with VPD and temperature in July, August and the May–September seasonal window (M–S: r = −0.32 for temperature and r = −0.33 for VPD), but was positively (p < 0.05) correlated with relative humidity in July (r = 0.35), August (r = 0.33) and May–August and May–September seasons (M–A: r = 0.30; M–S: r = 0.32; Figure 6).

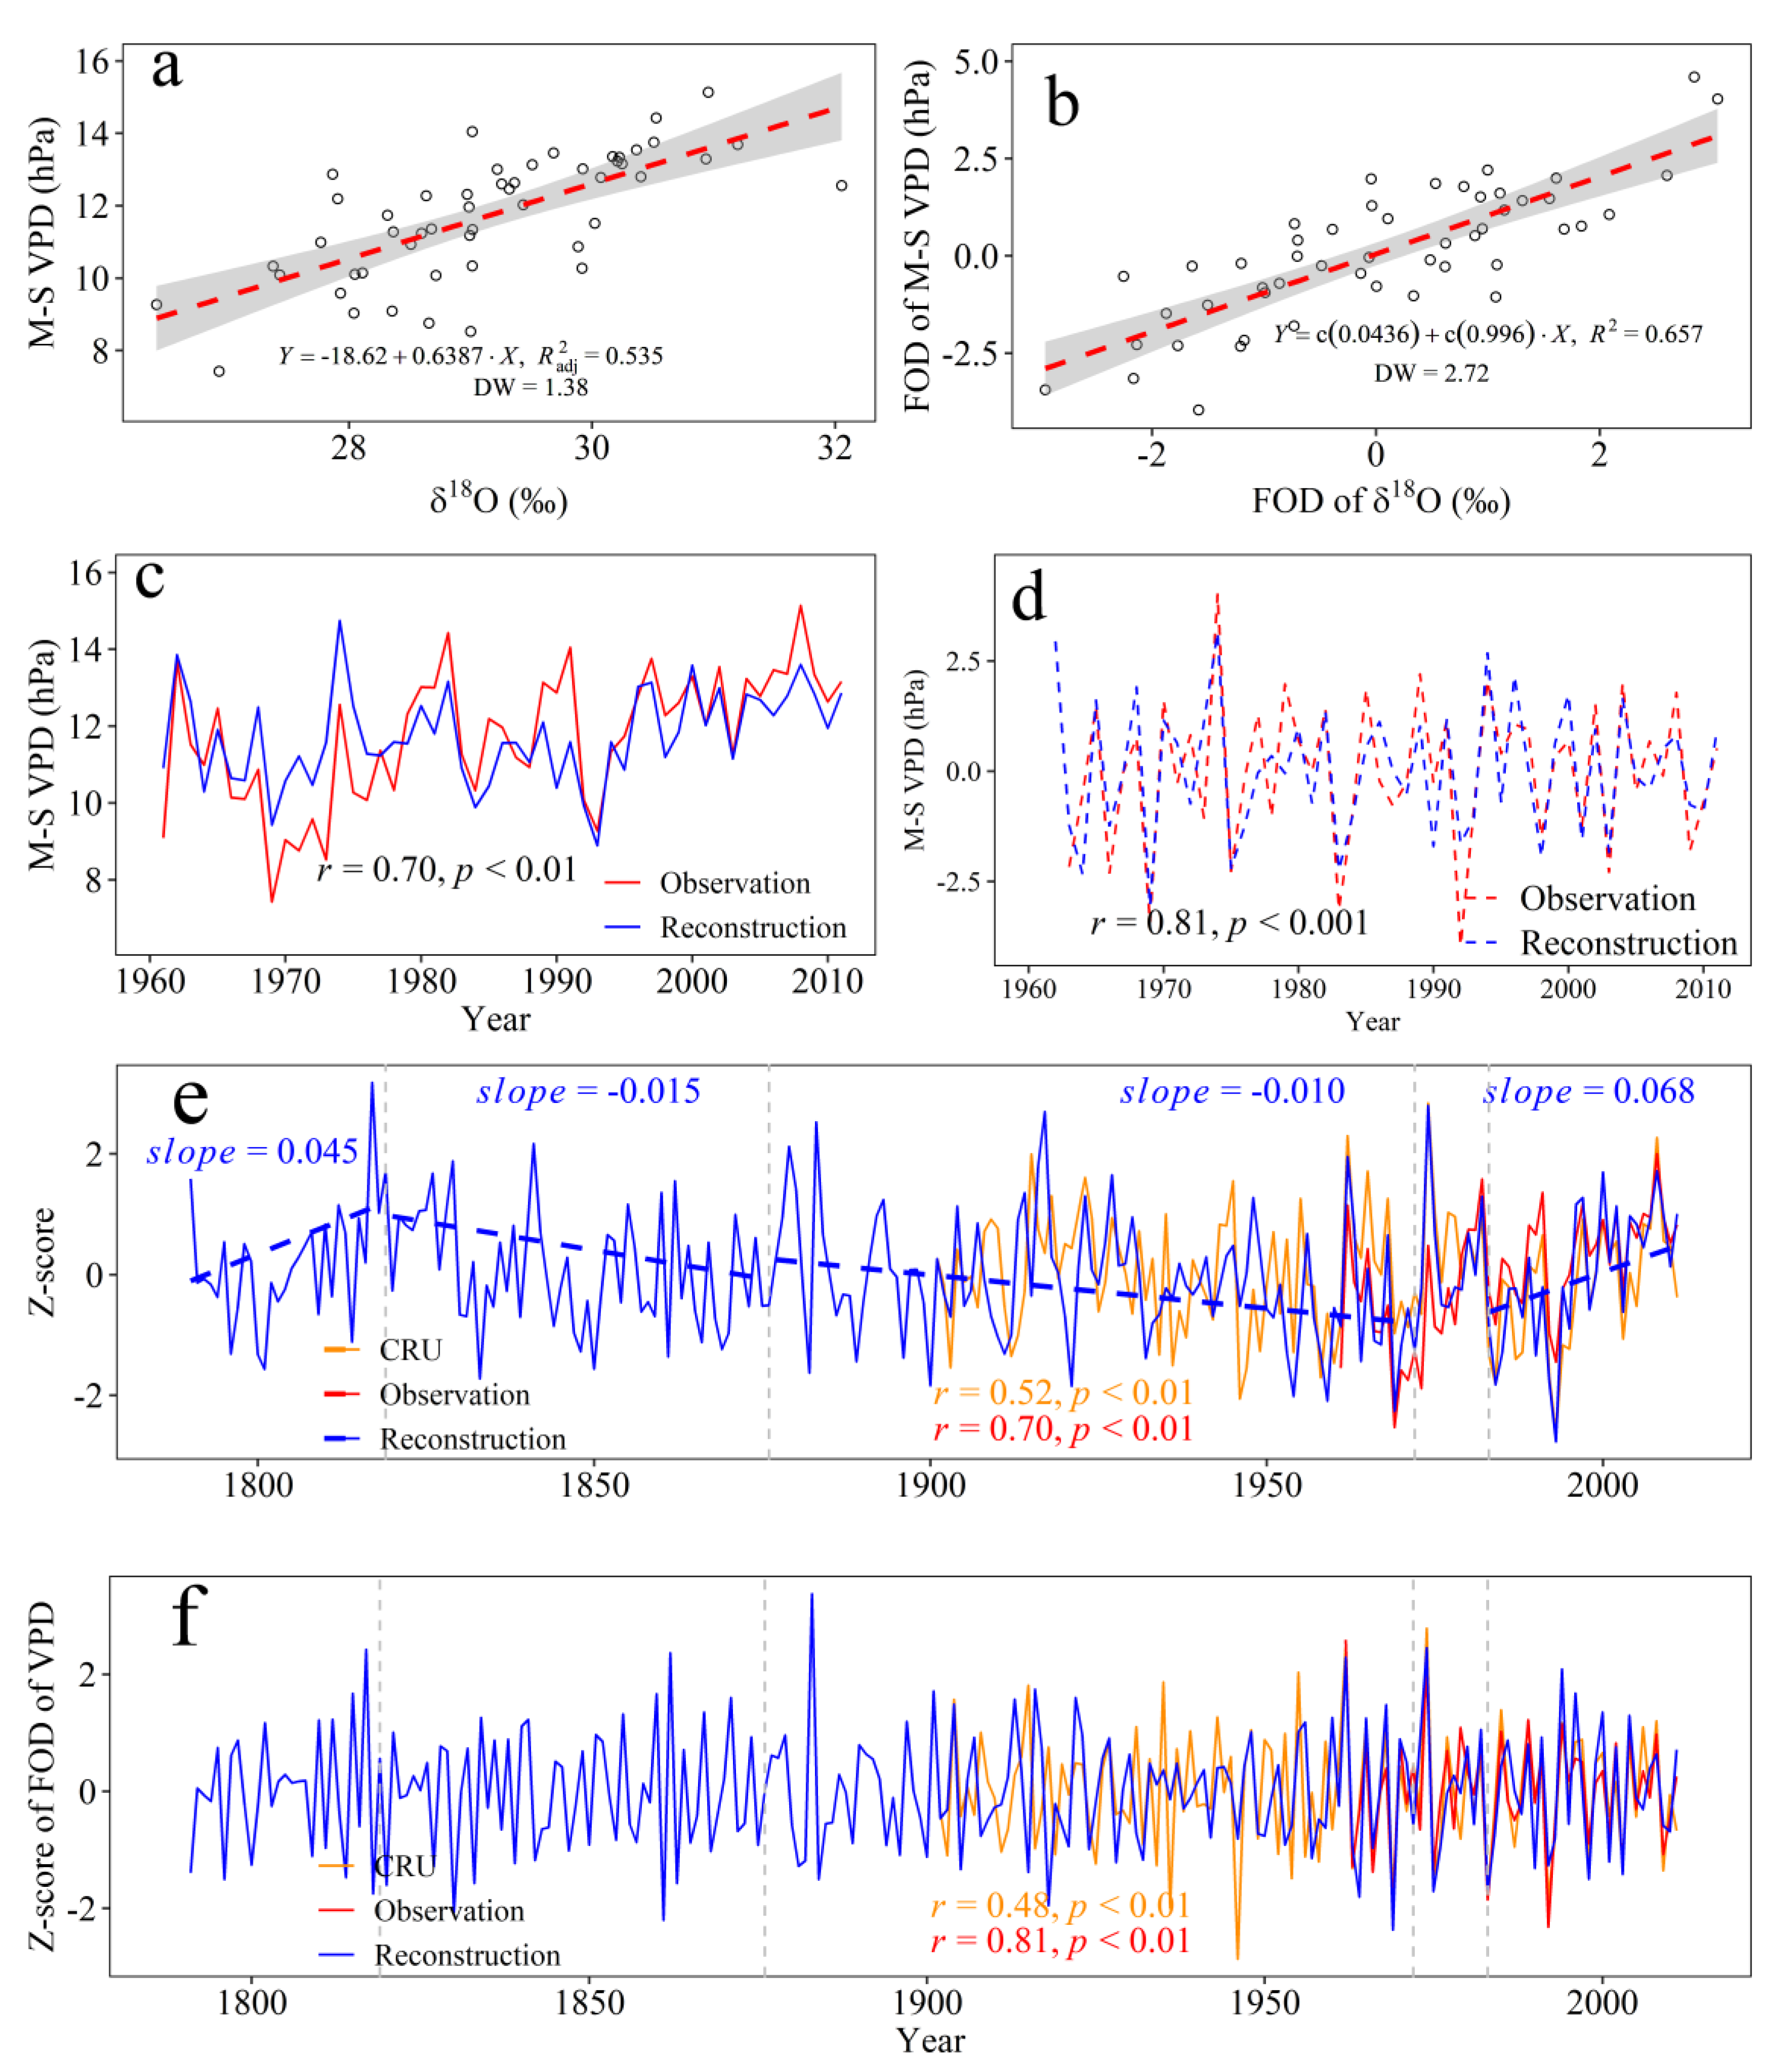
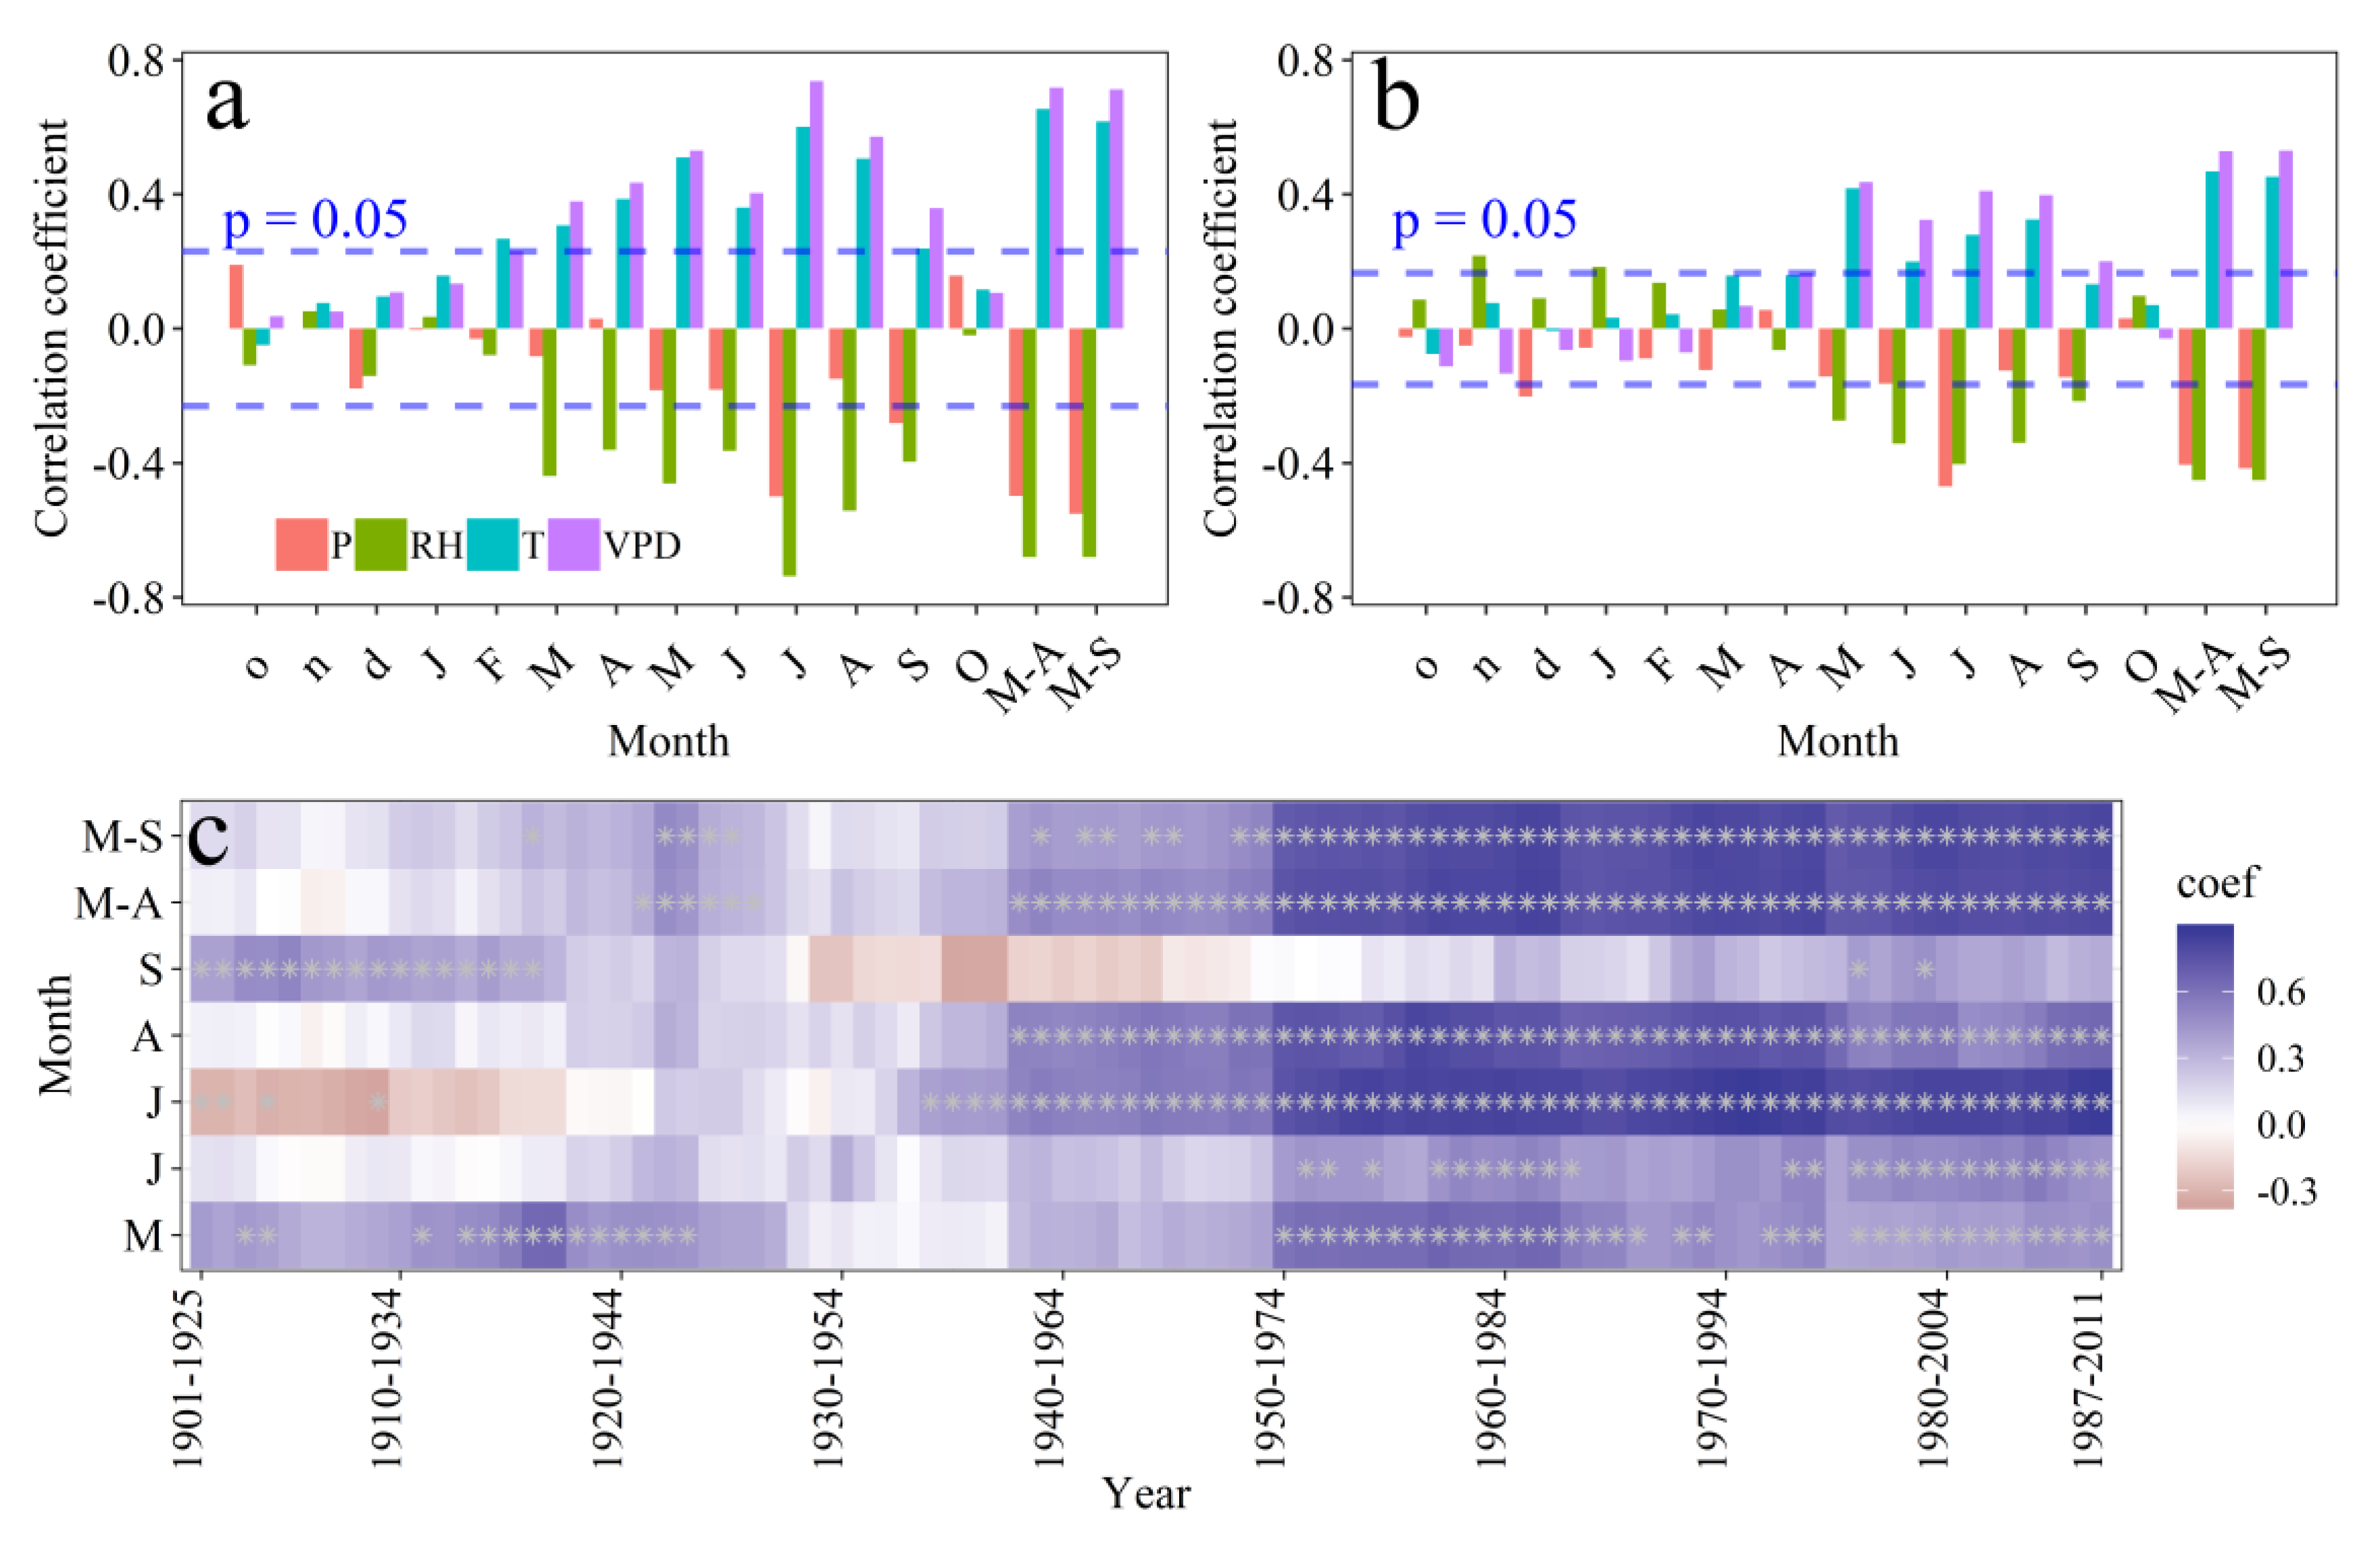
3.4. Climate Response of the Tree-Ring δ18O and VPD Reconstruction

The tree-ring δ18O was correlated (p < 0.05) with temperature from May to August, and with VPD from May to September (CRU: r > 0.20; meteorological station: r = 0.4–0.69) (Figure 7a,b). The tree-ring δ18O showed significant (p < 0.05) correlations with July precipitation (r = −0.48) and relative humidity from May to August (r = −0.2 to −0.69) (Figure 7a,b). The highest correlations were detected between the tree-ring δ18O and May–September VPD (CRU: r = −0.52; meteorological station: r = −0.69), which were more stable after the 1950s (Figure 7c).
To avoid potential errors in the climate data (i.e., interpolation in the CRU data before the 1960s) and because of the stable temporal relationship between tree-ring δ18O and May–September VPD, we used only the meteorological data to develop the transfer functions and the CRU data to validate the reconstructions. Two transfer functions, with explained variances of 53.5% and 65.7%, respectively, over 1961–2011, were developed using tree-ring δ18O as an independent variable and May–September VPD as a dependent variable at the annual and FOD scales (Figure 8a,b). The models have significant results (p < 0.01). Positive RE (0.42) was obtained during the calibration and validation procedure at the annual scale (Table 1). However, the tree-ring δ18O–VPD model did not pass the Durbin–Watson statistic (1.38, p = 0.04) (Figure 8a) and the residuals of the model showed a positive trend (not shown), which indicate that other climatic factors (e.g. temperature) may affect the residual trend. To further justify the VPD reconstruction, we developed a tree-ring δ18O–VPD model at the FOD scale (Figure 8b). The calibration and verification results showed positive RE (0.66 for 1961–1986 and 0.65 for 1987–2011) and CE (0.66 for 1961–1986 and 0.65 for 1987–2011) (Table 1), which means that the δ18O-VPD model at the FOD scale skillfully captured the VPD variability at the high frequency. Furthermore, the results of leave-one-out calibration and verification between tree-ring δ18O and VPD also showed positive RE and CE values at the annual (both 0.45) and FOD (both 0.63) scales (Table 1). This further confirmed that the δ18O–VPD model at the annual-scale reconstruction can indicate the long-term changes of VPD, although it has small negative CE values (−0.075 and −0.15) (Table 1).
The May–September VPD reconstructions showed good agreement with observational VPD at inter-annual (r = 0.70, p < 0.01; 1961–2011; Figure 8c) and at FOD (r = 0.81, p < 0.01; 1962–2011; Figure 8d) time scales, as well as with CRU VPD (inter-annual: r = 0.52, p < 0.01; 1901–2011; FOD: r = 0.48, p < 0.01; 1901–2011) (Figure 8e,f). These results further suggest that the VPD reconstruction captured VPD variability well. We explored the VPD variability within the sub-periods detected in the tree-ring Δ13C. Specifically, May–September VPD significantly (p < 0.05) increased during 1790–1819, decreased during 1820–1876 and 1877–1972 with different magnitudes, and increased during 1983–2011 (slope: 0.68 per decade) (Figure 8e).

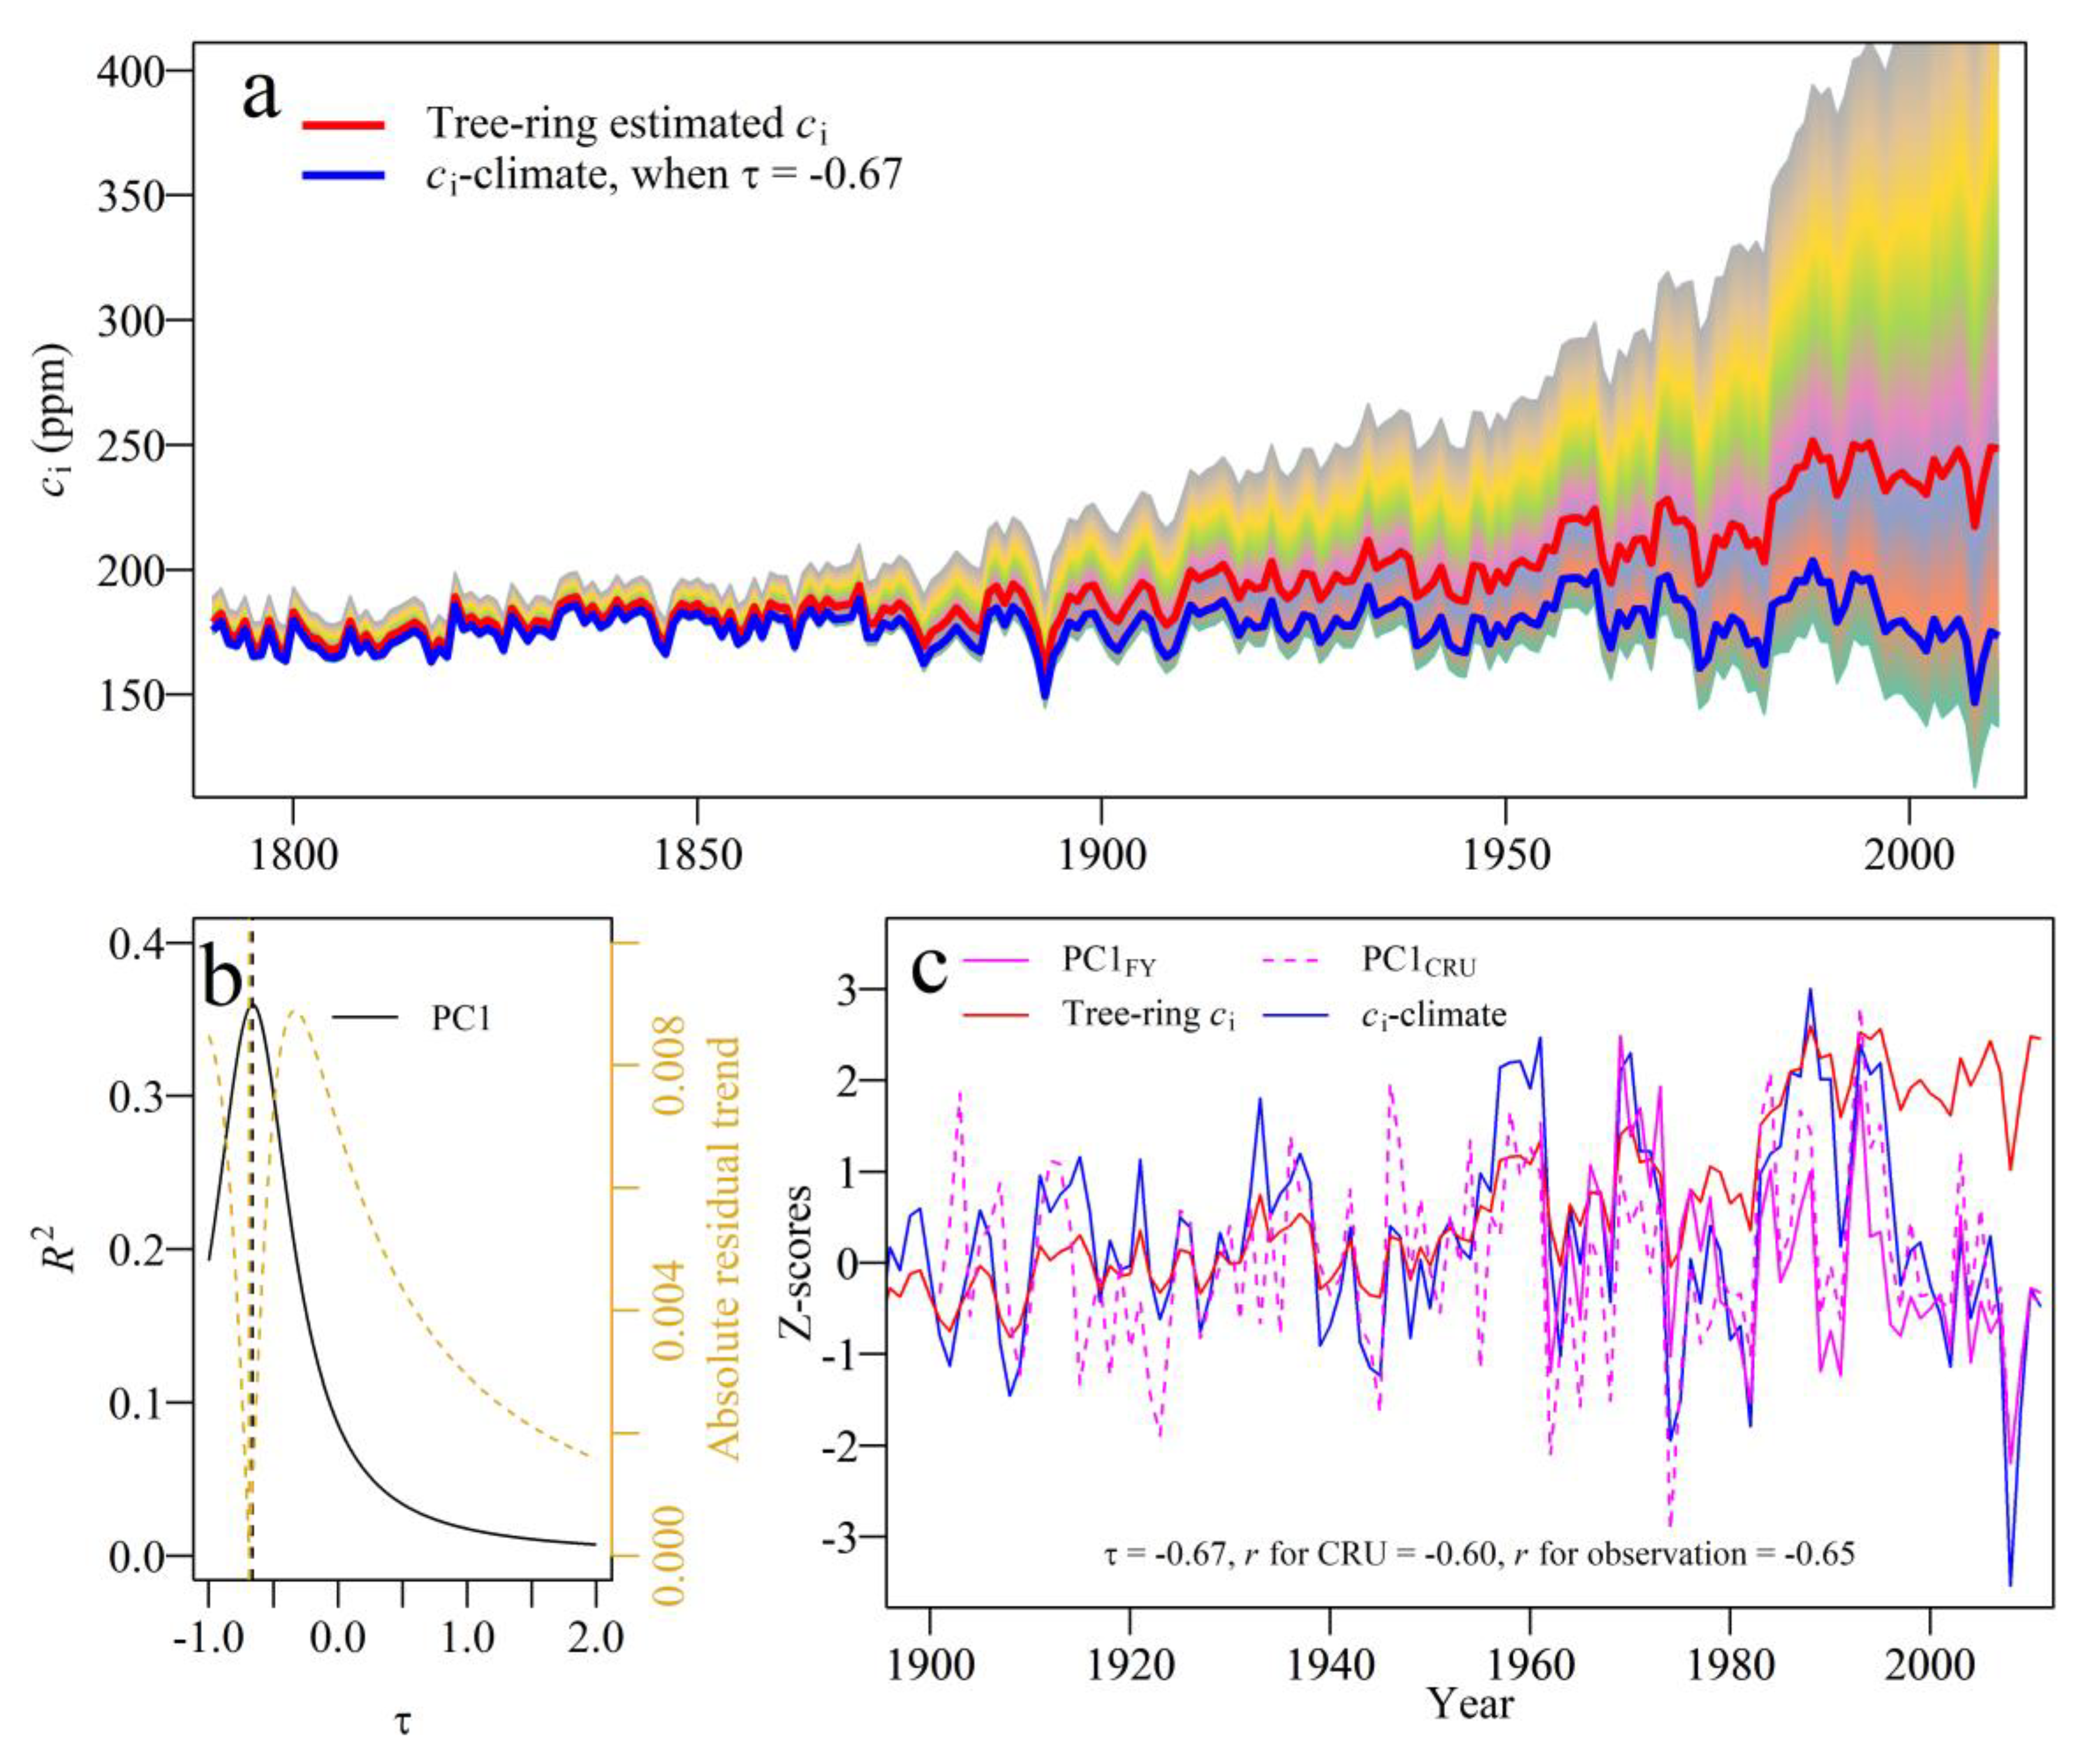
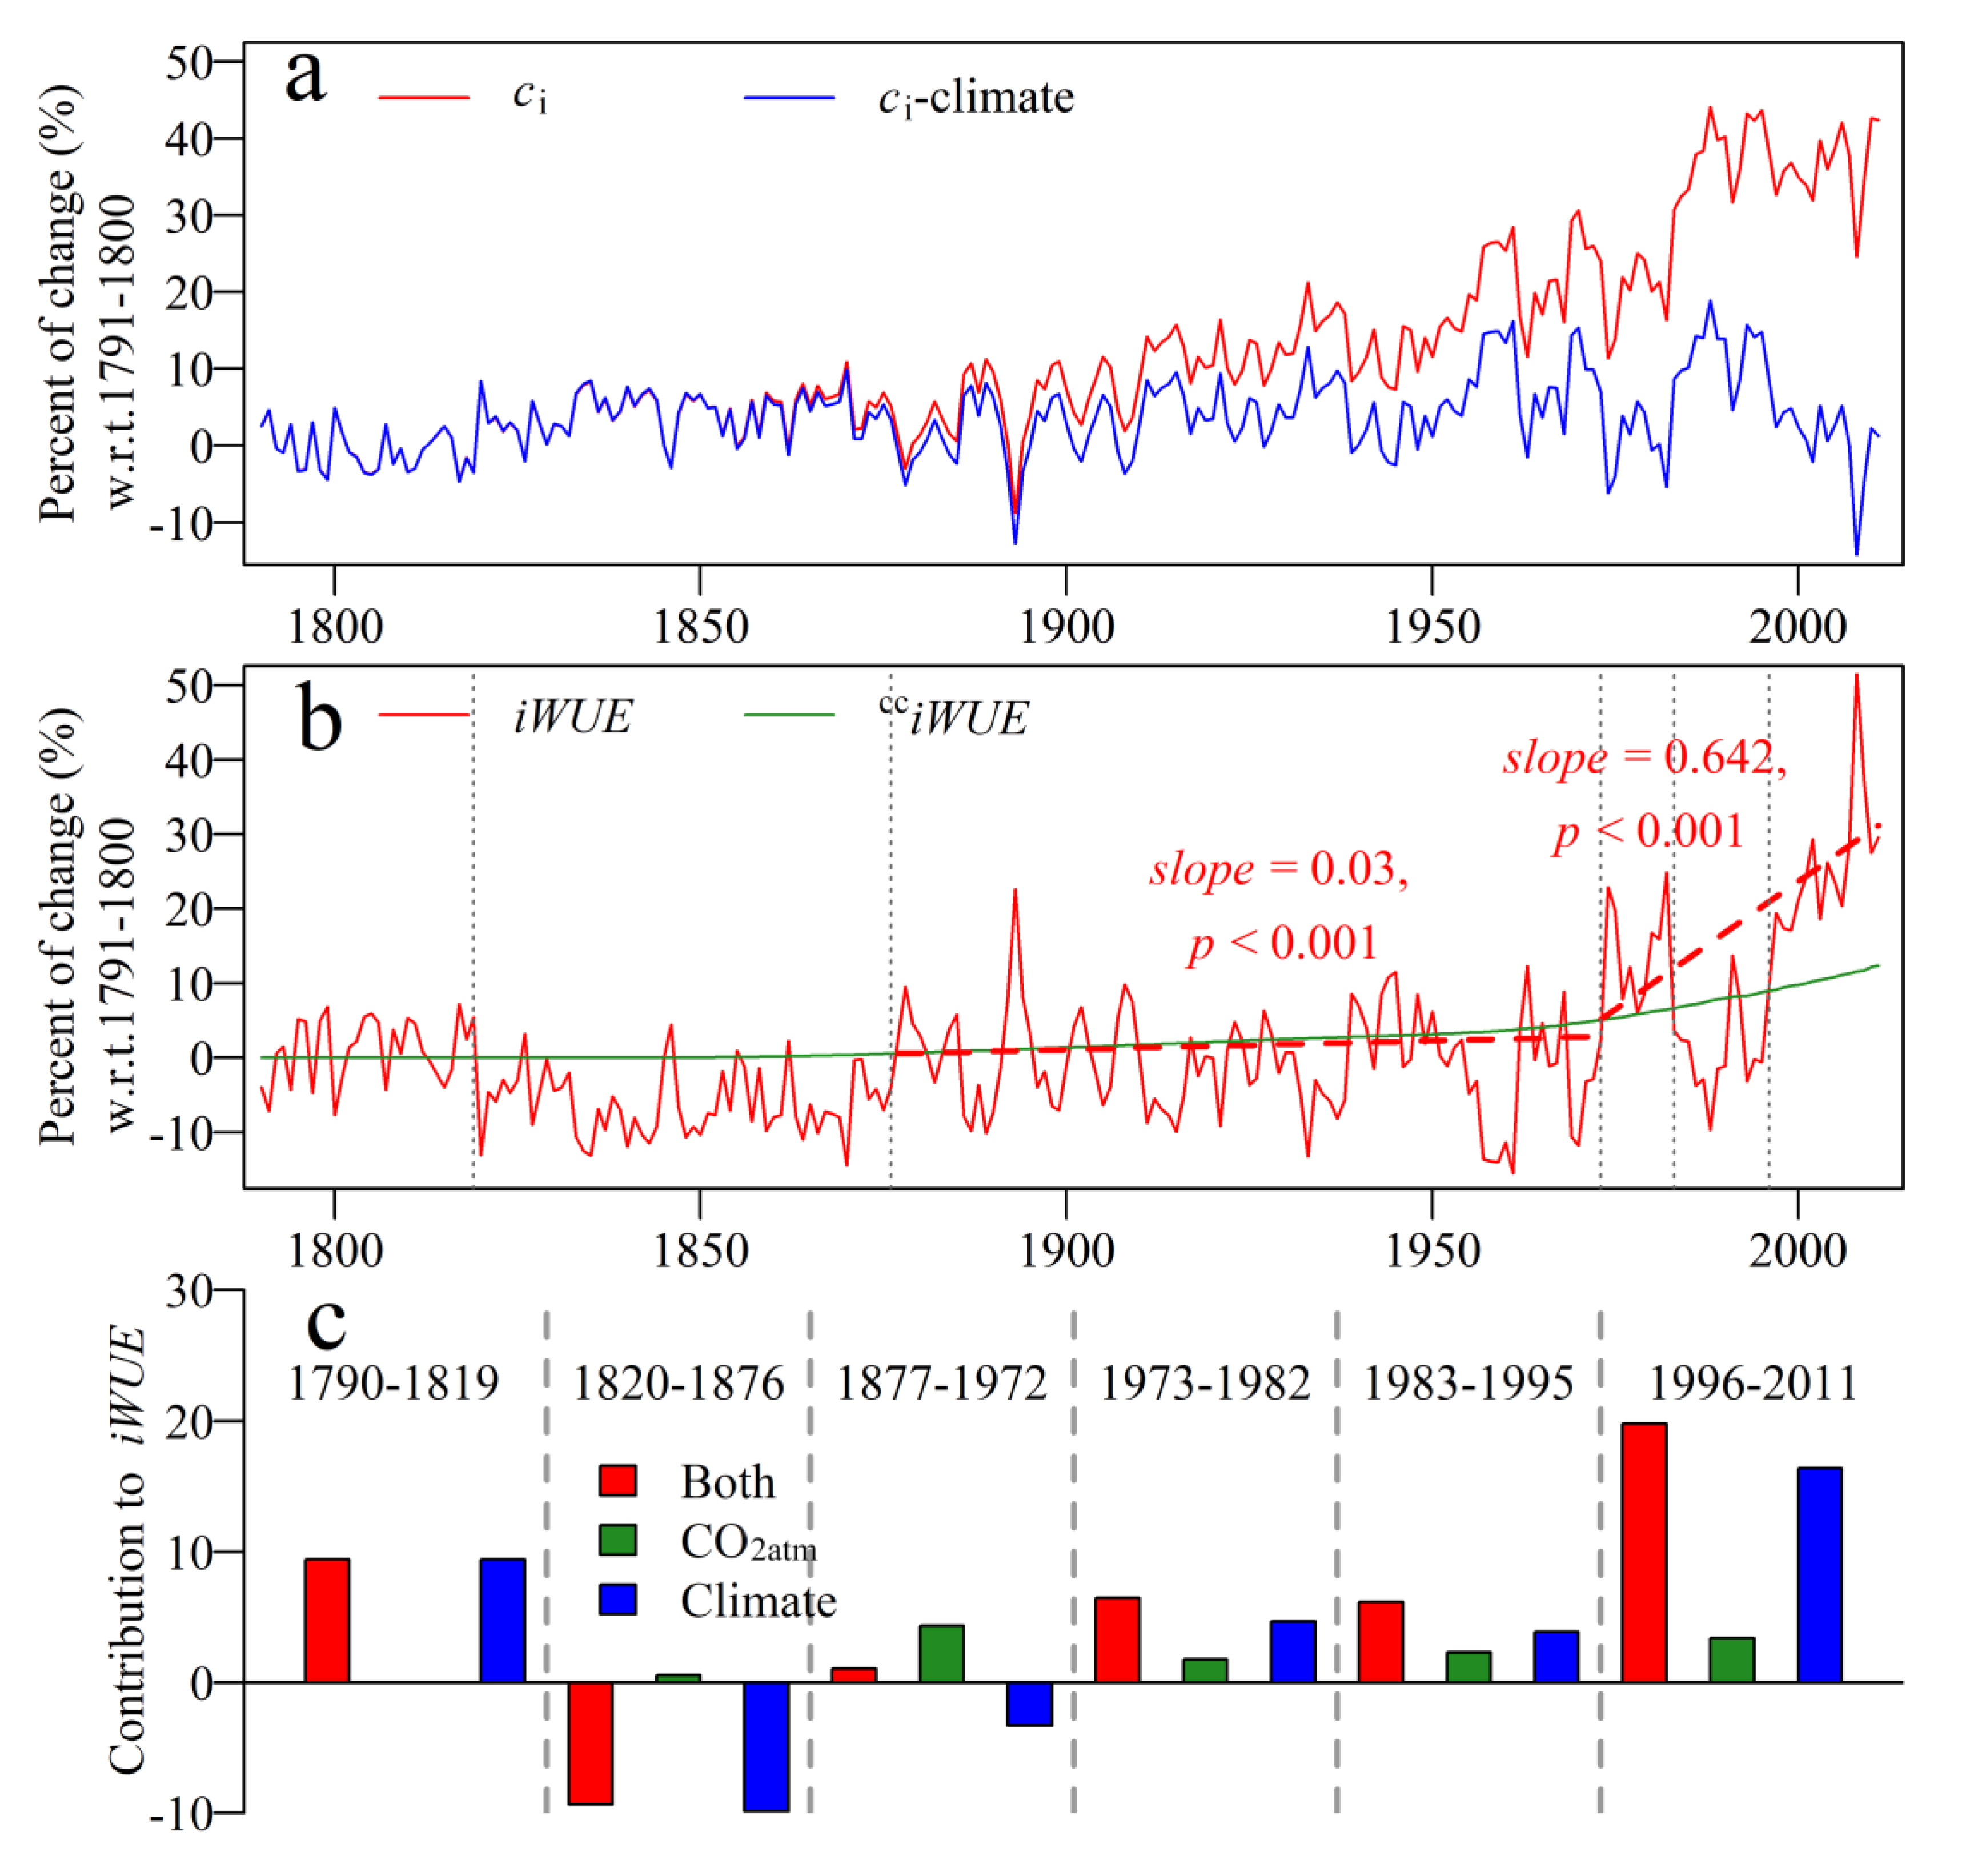
3.5. Percent Changes of ci and IWUE, and Contributions of Climate and CO2atm

Overall, the percent change of ci and ci-climate showed positive trends, and the differences between them were larger since 1973 (Figure 9a). ci increased by 39.8% (a cumulative increase of 69.5 ppm), and ci-climate had a non-significant trend over the past 222 years (Figure S2, Supplementary Materials). However, ci-climate showed a decreasing trend during the period 1983–2011 (Figure 9a and Figure S2, Supplementary Materials). ci and ci-climate showed the same changepoint in the years 1819, 1955 and 1982. ci/ca from tree-ring and climate had common changepoint years in 1819, 1972 and 1995. iWUE changed in the years 1819, 1876, 1972, 1982 and 1995 (Figure S2, Supplementary Materials).
Taking into account the changepoints of both ci and iWUE (Figure S2, Supplementary Materials), we split the past 222 years as six sub-periods (1790–1819, 1820–1876, 1877–1972, 1973–1982, 1983–1995, and 1996–2011) to detect the driving forces in iWUE. Percent change of iWUE increased significantly (p < 0.01) during 1877–2011, and it increased rapidly during 1973–2011 (0.642% per year; p < 0.001; Figure 9b). iWUE increased by 33.6%, and cciWUE increased by 16.4% over the past 222 years (Figure 9b), CO2atm thus contributed to about 48.8% of the increase in iWUE overall. iWUE change was mainly due to the climate before 1877 (Figure 9c) because the CO2atm was nearly constant before the 1850s (Figure S2b, Supplementary Materials). The contribution of CO2atm exceeded that of climate during 1877–1972, while the contribution of climate surpassed that of CO2atm since 1973 with a mean relative contribution of 73% (Figure 9c). Particularly from 1996 to 2011, iWUE increased rapidly by 16.4% and climate contributed to the 13.6% increase of iWUE (accounting for 83% of the increase in iWUE) (Figure 9c).

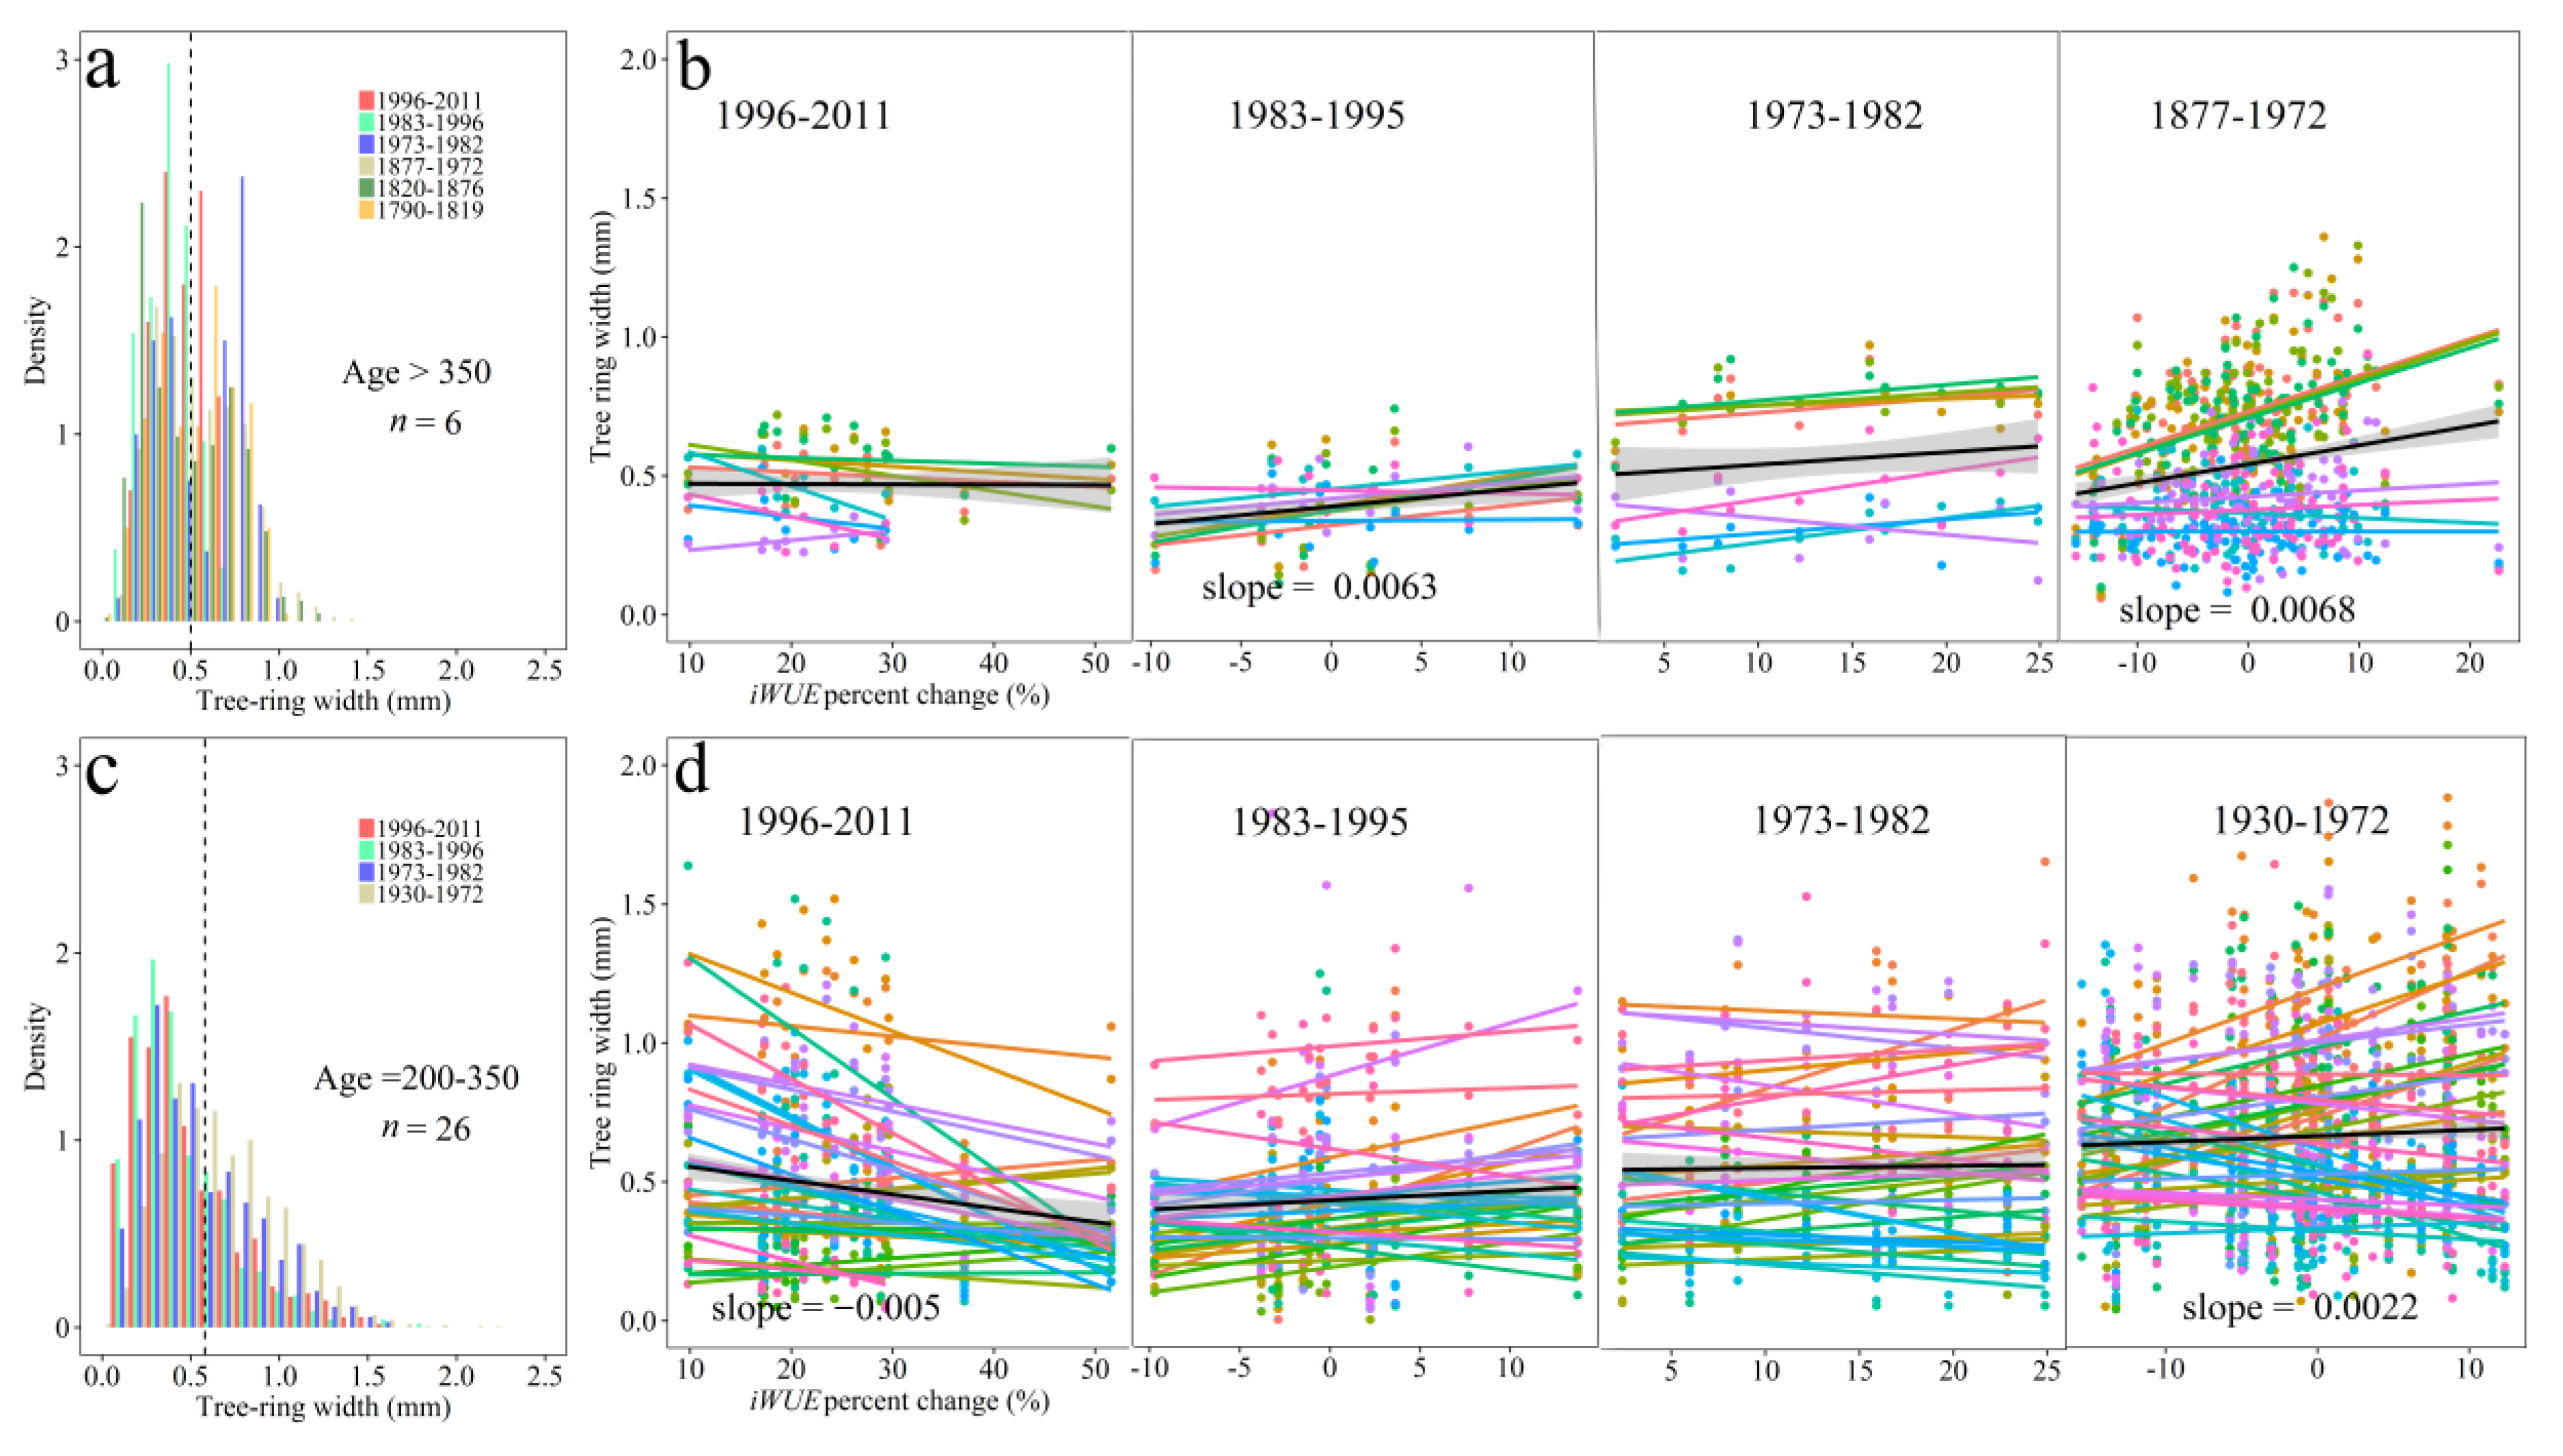
3.6. IWUE and Tree-ring Growth

Tree-ring width had a higher density of narrow rings (below the mean value; <0.5 mm for old trees and <0.58 mm for the medium-aged trees) and lower mean tree-ring width (p < 0.05, ANOVA test; Table 2) during 1983–1995 and 1996–2011 compared to those during the previous periods for both old and medium-aged trees (Figure 10). The linear relationships between iWUE and ring-width are consistent for 70% of the trees at the tree level, especially for medium-aged trees in the period 1930–1972. iWUE showed positive linear relationships with mean tree-ring width during all of the sub-periods, except for 1996–2011 (negative) in both old and medium-aged trees (Figure 10b,d). Significantly (p < 0.05) positive linear relationships between iWUE and tree-ring width were found for old trees in 1877–1972 and 1983–1995, and for medium-aged trees in 1930–1972 (Figure 10).

4. Discussion

4.1. Climate Drivers of Tree’s Physiology

The correlations between ci and climate parameters (negative with temperature and VPD; positive with precipitation and relative humidity) (Figure 3) were similar to the results observed for European forests [9]. This can be explained by the sensitivity of plant physiology, particularly δ13C fractionation, to environmental factors. An increase in temperature can increase the photosynthesis rate [7,8,41]: high temperature increases soil water evaporation and plant transpiration, leading to water stress (high VPD) and a decline of gs [18,20,23], and thereby a decline in Δ13C and ci (equation 1). VPD has been demonstrated to control gs and daytime transpiration in plants [7,42]. A negative relationship between VPD and gs was observed for Larix [43], and gs was affected by VPD and drought stress (e.g., soil moisture and/or relative humidity) [8,42,44,45]. The strong relationship between ci and VPD (Figure 3) mainly reflects the influence of drought stress on ci through gs.
Tree-ring δ18O was significantly correlated with the relative humidity and VPD (Figure 7). The magnitude of the leaf-water enrichment of leaf water δ18O depends on the ratio of vapor pressure in the atmosphere to intercellular spaces ( relative humidity), during which the leaf-water δ18O fractionation is related to gs and the leaf boundary layer through transpiration [12,14,41]. Dry air (reduced relative humidity and increased VPD) causes a strong degree of the 18O enrichment in leaf water through transpiration, thereby producing high tree-ring δ18O [12,13]. Leaf δ18O enrichment in Larix is expected to be controlled by the water availability, which in turn is usually controlled by the VPD [46,47]. The high explained variance in VPD reconstruction at the FOD scale further illustrates the controls of VPD on tree-ring δ18O (Figure 8). Several studies have shown a positive correlation between Larix tree-ring δ18O and VPD [46,47], and have used this relationship to reconstruct past VPD variations [47]. In addition, Larix is sensitive to drought and soil moisture because of low drought tolerance [48]. Larix will regulate water loss in response to drought and low water availability [49].
Tree-ring δ18O can reflect the effects of stomatal control on transpiration during the growing season, which can provide insight into past dynamics in gs and A by combining with tree-ring δ13C [13]. However, several concerns must be taken into account applying this dual-isotope approach [41,50], mainly with regard to the spatial and temporal change of the δ18O of the source water. In our previous study, the trees grew in the same conditions and δ18O of precipitation (source water) did not change, based on δ18O data of snow/firn near our site [51]. Thus, it is reasonable to interpret the variability of the tree-ring δ13C and δ18O to understand the contributing factors to changes of iWUE. As a result, VPD reconstruction from tree-ring δ18O could indicate the magnitude of water stress and the partial gs over isotopic fractionations. Specifically, increased VPD resulted in a decrease in gs (i.e., 1996–2011), while decreased VPD led to an increase in gs (i.e., 1877–1972) (Figure 8c).
The tree-ring width showed positive correlations with relative humidity and negative correlations with temperature and VPD during the growing season (Figure 6). These results indicate that tree-ring width was controlled by water availability. At an arid site, higher temperatures stimulate evapotranspiration and lead to a decrease in water availability, which affects the radial growth of larch [48]. This is confirmed by other studies [52,53] that also point to water availability as an important factor for tree-growth in this region.

4.2. Contributions of CO2atm and Climate to Changes in IWUE

An increased iWUE could result from an increase in A or a decrease in gs or both [8]. Saurer et al. [35] proposed three theoretical scenarios to describe the responses of A and gs to rising CO2atm: (1) ci constant; (2) ci/ca constant; and (3) ca/ci constant. Both scenarios (1) and (2) would result in an increase in iWUE with different magnitudes under rising CO2atm [35]. In the present study, the increase in iWUE indicated proportional changes in ci in response to changes in the CO2atm, and hence, a proportional regulation of A and gs (Figure S2c, scenario 2 in Reference [35]). Growth experiments on C3 plants indicate that elevated ci partly resulted from an increase in carbon demand during photosynthetic uptake under rising CO2atm [7]. Increased ci and iWUE with higher CO2atm (Figure 9 and Figure S2, Supplementary Materials) have been observed in many Free-Air CO2 Enrichment (FACE) experiments [54]. However, long-term increases in iWUE are likely caused by both rising CO2atm and climate change (e.g., increased drought stress or warming) [16,17,18,19,20,54]. The optimum τ value method [9], which includes all of the ci scenarios, along with the long-term climate variability (VPD), provides a method to quantify the contributions of climate and CO2atm to iWUE.
In the present study, the increased rate of cciWUE (16.4%) in Northwestern China’s larch was within the range of that observed in conifer tree species in Europe (22 ± 6%) [9]. The increase in cciWUE implied that rising CO2atm had a stimulation effect (about 48.8%) on iWUE (Figure 9), which was similar to the contribution of rising CO2atm to iWUE (50%) in larches from Northeastern Siberia [18].
During 1790–1876, the climate must have been the main contributor to iWUE variability because of nearly constant CO2atm before the industrial period (Figure 9b and Figure S2, Supplementary Materials). The reconstructed VPD showed an increasing trend during 1790–1819 (Figure 8) while the cciWUE was constant. This situation likely corresponds to decreases in gs according to the dual-isotope concept model [13]. During 1820–1876, a slight increase in cciWUE (Figure 9b) but a significant decrease in VPD (Figure 8) indicated that A increased a little and gs increased significantly, and as a consequence, iWUE decreased [13]. The high correlation coefficients between dual isotopes around 1820–1840 (Figure 2d) indicate that other climate parameters (e.g. temperature) also affected iWUE [18]. During 1877–1972, the contribution of CO2atm to iWUE was higher than that of climate (Figure 9c), with a decrease in VPD and an increase in cciWUE (Figure 8 and Figure 9b) indicating that increasing iWUE may result from increases in A [13]. This can be supported by the low correlation between Δ13C and δ18O (Figure 2d), which indicates that the common control of gs on dual isotopes decreased. A similar increase in iWUE was also found in the Norway spruce [15], where the increase in photosynthetic rate enhanced iWUE. Such an increase in A has also been confirmed by young larch trees in the Swiss alpine line in a 9-year FACE experiment [55]. Similar responses across many sites may point towards an optimization of leaf gas exchange and stomatal control [10].
During the recent three sub-periods (1973–1982, 1983–1996, and 1996–2011), however, the contribution of climate was two times higher than that of CO2atm, regardless of the fact that both contributions of climate and CO2atm were increasing (Figure 9c). An enhanced relationship between dual isotopes since the 1970s (Figure 2) also indicates that climate variability (such as VPD; Figure 9d) resulted in the decrease of gs. During 1973–1982, the reconstructed VPD was higher than the mean value over the past 222 years (Figure 8e), and cciWUE increased (Figure 9a), which indicated a decline in gs and an increase in A with rising CO2atm. For the period 1983–1995, the contribution of climate was lower compared to that during 1973–1982 (Figure 9c). The situation during 1983–1995 implies that the contribution of A to iWUE was largely counteracted by other climate factors. From 1996 to 2011, high VPD and increases in cciWUE imply that high contribution of climate (83%) to iWUE led to a rapid increase in iWUE [13] (Figure 9). Larch will increase the stomatal closure in response to a continuous increase in air evaporative demand or VPD, leading to a reduction of gs that minimizes the influence of hydraulic failure [16,19,22]. This scenario is similar to the conceptual model developed by Scheidegger et al. [13], where tree-ring ci was nearly constant; however, warming/drying trends tend to accelerate the rate of decrease in ci-climate [16,19,20], resulting in a higher iWUE in 1996–2011 (Figure 9 and Figure S2, Supplementary Materials).
In summary, the dominant drivers of iWUE changed from CO2atm (A) in 1877–1972, to climate in 1973–2011 (all three sub-periods). A similar transition has been reported for larch, where iWUE was controlled by both A and gs to mainly gs for the last two decades at the Central European Alps’ tree line [4].

4.3. Implications of IWUE for Tree-ring Growth

Detecting the relationships between iWUE and tree-ring growth is important for predicting future boreal forest growth under projected climate conditions [9,10]. At our study site, the percent change of iWUE showed significant but slight positive relationships with tree-ring width in 1877–1972 for old trees and in 1930–1972 for medium-aged trees (Figure 10 and Figure S3). These relationships were similar to the relationships between iWUE and tree-ring growth of trees that were used for the stable isotope measurements (Figure S4, Supplementary Materials). However, tree-ring width showed a weak negative relationship with percent change of iWUE during 1963–1972 in the 11-year consecutive interval periods for medium-aged trees (Figure S5, Supplementary Materials). These results suggest that iWUE had a weak effect on tree-ring growth and did not fully confirm the enhancement of tree-ring growth. The different regression trends between iWUE and tree-ring width at each core level (Figure 10) may be caused by the influences of the micro-environment (such as nutrient and individual differences in response to iWUE change) [20,22,25]. The relationships between tree-ring growth and iWUE are not straightforward in boreal forests. In some studies, iWUE did not lead to an enhancement of tree growth [16,17,56], but did in others [15,21], or iWUE was unable to be disentangled from other factors in tree growth [57]. Counteracting effects from climate and other factors may cause growth limitation by controlling the allocation of carbohydrate into wood growth [57]. In addition, higher CO2atm always leads to more growth in young trees compared to more mature trees. Faster carbon assimilation does not scale to greater carbon pool size, as we know by comparing tree plantations to old forest [58]. Radial tree growth will probably never be CO2atm-limited [58,59] and experimental CO2atm enrichment cannot identify consequences of rising CO2atm for net ecosystem production [58]. These studies further explained the weak relationship between tree-ring width and iWUE. In the present study, the strengthened drought stress since 1983 (increase in VPD and temperature, and a decrease in precipitation, Figure 8 and Figure S1, Supplementary Materials) would further complicate the tissue formation constraints on tree-ring width (Figure 8). The negative effects of climate on tree-ring width would counteract the possible positive effects of increasing iWUE. Such counteracting effects were also reported in Northeastern China’s boreal forests [56]. The reasons for the high density of wide rings in the old trees during the period 1973–1982 are unknown.
However, during 1996–2011, iWUE showed negative relationships with the tree-ring width both for old and medium-aged trees at the inter-annual and FOD scales (Figure 10 and Figure S3, Supplementary Materials). Climatic factors mainly contributed to the rapidly increased iWUE (Figure 9), and trees showed a high density of the narrower rings (Figure 10a,c). This implies that the high iWUE did not result in an enhancement but rather a decrease in tree growth. Trees are likely switched to a more conservative water-use strategy by enhancing stomatal control during the continuous drying trend, resulting in tree growth decline, even though iWUE increases [22,26].

5. Conclusions

We synthesized both tree-ring δ13C and δ18O to disentangle the contributions of climate and CO2atm to changes of iWUE based on an optimum “tau-approach” [9]. In the present study, iWUE increased over the past 222 years (1790–2011), which reflected a proportional regulation of A and gs to rising CO2atm (contributing 48.8% of the increase in iWUE) and climate. iWUE increased during 1790–1819 and decreased during 1820–1876, and was mainly driven by climate (drought) for these two periods. During 1877–1972, the increase in iWUE was mainly due to rising CO2atm. Afterwards, the increase in iWUE was again mainly caused by climate. In recent decades (1996–2011), climate mainly contributed (83%) to a rapid increase in iWUE. The increased iWUE showed a slight positive relationship with tree-ring width but cannot confirm any fertilization effects. The relationships between iWUE and tree-ring growth changed from positive during 1973–1982 and 1983–1996 to negative during 1996–2011. Concurrently, tree-ring growth showed a higher density of narrow rings during 1996–2011. These results indicated that a rapid increase in iWUE is not a signal of tree growth enhancement, but rather a possible pre-alarm of decline for larch in Northwestern China’s boreal forests. This research helps us understand the long-term variability of iWUE and predict tree growth change of moisture-sensitive boreal forests in arid Northwestern China.

Supplementary Materials

The following are available online at https://www.mdpi.com/1999-4907/9/10/642/s1, Figure S1. Comparison between meteorological data and CRU data for May-August (MJJA). Figure S2.Tree-ring Δ13C estimated ci, ci-climate, ci/ ca, and iWUE with their mean value change (dashed lines) for different periods. Figure S3. Scatter plots and linear regressions between percent change of iWUE and raw tree-ring width for medium-aged trees during each period at the high-frequency time scale. Figure S4. Scatter plot and linear regressions between percent change of iWUE and tree-ring width for the nine trees that were used in stable isotope measurements during each period at the annual scale. Figure S5. Scatter plots and linear regressions between percent change of iWUE and tree-ring width for ~11–year consecutive intervals for the period 1930-1972 at annual and FOD time scales.

Author Contributions

G.X., X.L. and T.C. planned and designed the research. G.X., T.C., W.W., W.B., G.W., and X.Z. conducted the fieldwork and laboratory work. G.X. and S.B. analyzed the data. G.X., S.B. and X.L. interpreted the data. G.B. wrote the manuscript. S.B. and X.L. helped improve the manuscript.

Acknowledgments

This research was supported by the National Natural Science Foundation of China (41501049, 41871030 & 41721091), the Self-determination Project of the State Key Laboratory of Cryospheric Sciences (SKLCS-ZZ-2018), the foundation of Light of West China Program of Chinese Academy of Sciences, the Youth Innovation Promotion Association (2016372), Chinese Academy of Sciences, the fundamental Research funds for the Central Universities (GK201801007), and by the funding from the China Scholarship Council. Data and code can be available freely by contacting G Xu ([email protected]). We are grateful to Dr. William Ed Wright and Amy Hudson from the University of Arizona and Dr. Kerstin Treydte from WSL, who helped improve the English. We greatly appreciate suggestions from three anonymous reviewers and editorial staff for the improvement of our manuscript.

Conflicts of Interest

The authors declare that there is no conflict of interest.

References

  1. Chen, B.; Chen, J.M.; Huang, L.I.N.; Tans, P.P. Modeling dynamics of stable carbon isotopic exchange between a boreal forest ecosystem and the atmosphere. Glob. Chang. Biol. 2006, 12, 1842–1867. [Google Scholar] [CrossRef]
  2. Jasechko, S.; Sharp, Z.D.; Gibson, J.J.; Birks, S.J.; Yi, Y.; Fawcett, P.J. Terrestrial water fluxes dominated by transpiration. Nature 2013, 496, 347–350. [Google Scholar] [CrossRef] [PubMed]
  3. Keenan, T.F.; Hollinger, D.Y.; Bohrer, G.; Dragoni, D.; Munger, J.W.; Schmid, H.P.; Richardson, A.D. Increase in forest water-use efficiency as atmospheric carbon dioxide concentrations rise. Nature 2013, 499, 324–327. [Google Scholar] [CrossRef] [PubMed]
  4. Wieser, G.; Oberhuber, W.; Waldboth, B.; Gruber, A.; Matyssek, R.; Siegwolf, R.T.W.; Grams, T.E.E. Long-term trends in leaf level gas exchange mirror tree-ring derived intrinsic water-use efficiency of Pinus cembra at treeline during the last century. Agric. For. Meteorol. 2018, 248, 251–258. [Google Scholar] [CrossRef]
  5. Charney, N.D.; Babst, F.; Poulter, B.; Record, S.; Trouet, V.M.; Frank, D.; Enquist, B.J.; Evans, M.E.K. Observed forest sensitivity to climate implies large changes in 21st century North American forest growth. Ecol. Lett. 2016, 19, 1119–1128. [Google Scholar] [CrossRef] [PubMed]
  6. Gagen, M.; Finsinger, W.; Wagner-Cremer, F.; McCarroll, D.; Loader, N.J.; Robertson, I.; Jalkanen, R.; Young, G.; Kirchhefer, A. Evidence of changing intrinsic water-use efficiency under rising atmospheric CO2 concentrations in Boreal Fennoscandia from subfossil leaves and tree ring δ13C ratios. Glob. Chang. Biol. 2011, 17, 1064–1072. [Google Scholar] [CrossRef]
  7. Farquhar, G.D.; Ehleringer, J.R.; Hubick, K.T. Carbon isotope discrimination and photosynthesis. Annu. Rev. Plant Physiol. Plant Mol. Biol. 1989, 40, 503–537. [Google Scholar] [CrossRef]
  8. Farquhar, G.D.; O’Leary, M.H.; Berry, J.A. On the relationship between carbon isotope discrimination and the intercellular carbon dioxide concentration in leaves. Aust. J. Plant Physiol. 1982, 9, 121–137. [Google Scholar] [CrossRef]
  9. Frank, D.C.; Poulter, B.; Saurer, M.; Esper, J.; Huntingford, C.; Helle, G.; Treydte, K.; Zimmermann, N.E.; Schleser, G.H.; Ahlstrӧm, A.; et al. Water-use efficiency and transpiration across European forests during the Anthropocene. Nat. Clim. Chang. 2015, 5, 579–583. [Google Scholar] [CrossRef]
  10. Voelker, S.L.; Brooks, J.R.; Meinzer, F.C.; Anderson, R.; Bader, M.K.; Battipaglia, G.; Becklin, K.M.; Beerling, D.; Bert, D.; Betancourt, J.L.; et al. A dynamic leaf gas-exchange strategy is conserved in woody plants under changing ambient CO2: Evidence from carbon isotope discrimination in paleo and CO2 enrichment studies. Glob. Chang. Biol. 2016, 22, 889–902. [Google Scholar] [CrossRef] [PubMed]
  11. McCarroll, D.; Loader, N.J. Stable isotopes in tree rings. Quat. Sci. Rev. 2004, 23, 771–801. [Google Scholar] [CrossRef] [Green Version]
  12. Roden, J.S.; Lin, G.; Ehleringer, J.R. A mechanistic model for interpretation of hydrogen and oxygen isotope ratios in tree-ring cellulose. Geochim. Cosmochim. Acta 2000, 64, 21–35. [Google Scholar] [CrossRef]
  13. Scheidegger, Y.; Saurer, M.; Bahn, M.; Siegwolf, R. Linking stable oxygen and carbon isotopes with stomatal conductance and photosynthetic capacity: A conceptual model. Oecologia 2000, 125, 350–357. [Google Scholar] [CrossRef] [PubMed]
  14. Barbour, M.M.; Roden, J.S.; Farquhar, G.D.; Ehleringer, J.R. Expressing leaf water and cellulose oxygen isotope ratios as enrichment above source water reveals evidence of a Péclet effect. Oecologia 2004, 138, 426–435. [Google Scholar] [CrossRef] [PubMed]
  15. Giammarchi, F.; Cherubini, P.; Pretzsch, H.; Tonon, G. The increase of atmospheric CO2 affects growth potential and intrinsic water-use efficiency of Norway spruce forests: Insights from a multi-stable isotope analysis in tree rings of two Alpine chronosequences. Trees 2017, 31, 503–515. [Google Scholar] [CrossRef]
  16. Levesque, M.; Siegwolf, R.; Saurer, M.; Eilmann, B.; Rigling, A. Increased water-use efficiency does not lead to enhanced tree growth under xeric and mesic conditions. New Phytol. 2014, 203, 94–109. [Google Scholar] [CrossRef] [PubMed] [Green Version]
  17. Peñuelas, J.; Canadell, J.G.; Ogaya, R. Increased water-use efficiency during the 20th century did not translate into enhanced tree growth. Glob. Ecol. Biogeogr. 2011, 20, 597–608. [Google Scholar] [CrossRef]
  18. Trahan, M.W.; Schubert, B.A. Temperature-induced water stress in high-latitude forests in response to natural and anthropogenic warming. Glob. Chang. Biol. 2016, 22, 782–791. [Google Scholar] [CrossRef] [PubMed]
  19. Saurer, M.; Spahni, R.; Frank, D.C.; Joos, F.; Leuenberger, M.; Loader, N.J.; McCarroll, D.; Gagen, M.; Poulter, B.; Siegwolf, R.T.; et al. Spatial variability and temporal trends in water-use efficiency of European forests. Glob. Chang. Biol. 2014, 20, 3700–3712. [Google Scholar] [CrossRef] [PubMed] [Green Version]
  20. Andreu-Hayles, L.; Planells, O.; Gutierrez, E.; Muntan, E.; Helle, G.; Anchukaitis, K.J.; Schleser, G.H. Long tree-ring chronologies reveal 20th century increases in water-use efficiency but no enhancement of tree growth at five Iberian pine forests. Glob. Chang. Biol. 2011, 17, 2095–2112. [Google Scholar] [CrossRef]
  21. Knorre, A.A.; Siegwolf, R.T.W.; Saurer, M.; Sidorova, O.V.; Vaganov, E.A.; Kirdyanov, A.V. Twentieth century trends in tree ring stable isotopes (δ13C and δ18O) of Larix sibirica under dry conditions in the forest steppe in Siberia. J. Geophys. Res. 2010, 115. [Google Scholar] [CrossRef]
  22. Timofeeva, G.; Treydte, K.; Bugmann, H.; Rigling, A.; Schaub, M.; Siegwolf, R.; Saurer, M. Long-term effects of drought on tree-ring growth and carbon isotope variability in Scots pine in a dry environment. Tree Physiol. 2017, 37, 1028–1041. [Google Scholar] [CrossRef] [PubMed]
  23. Xu, G.; Liu, X.; Qin, D.; Chen, T.; An, W.; Wang, W.; Wu, G.; Zeng, X.; Ren, J. Climate warming and increasing atmospheric CO2 have contributed to increased intrinsic water-use efficiency on the northeastern Tibetan Plateau since 1850. Trees 2013, 27, 465–475. [Google Scholar] [CrossRef]
  24. Girardin, M.P.; Bouriaud, O.; Hogg, E.H.; Kurz, W.; Zimmermann, N.E.; Metsaranta, J.M.; de Jong, R.; Frank, D.C.; Esper, J.; Büntgen, U.; et al. No growth stimulation of Canada’s boreal forest under half-century of combined warming and CO2 fertilization. Proc. Natl. Acad. Sci. USA 2016, 113, E8406–E8414. [Google Scholar] [CrossRef] [PubMed]
  25. Ward, E.J.; Domec, J.-C.; Laviner, M.A.; Fox, T.R.; Sun, G.; McNulty, S.; King, J.; Noormets, A. Fertilization intensifies drought stress: Water use and stomatal conductance of Pinus taeda in a midrotation fertilization and throughfall reduction experiment. For. Ecol. Manag. 2015, 355, 72–82. [Google Scholar] [CrossRef]
  26. Gessler, A.; Cailleret, M.; Joseph, J.; Schönbeck, L.; Schaub, M.; Lehmann, M.; Treydte, K.; Rigling, A.; Timofeeva, G.; Saurer, M. Drought induced tree mortality—A tree-ring isotope based conceptual model to assess mechanisms and predispositions. New Phytol. 2018, 219, 485–490. [Google Scholar] [CrossRef] [PubMed]
  27. Xu, G.; Liu, X.; Qin, D.; Chen, T.; Wang, W.; Wu, G.; Sun, W.; An, W.; Zeng, X. Relative humidity reconstruction for northwestern China’s Altay Mountains using tree-ring δ18O. Chin. Sci. Bull. 2014, 59, 190–200. [Google Scholar] [CrossRef]
  28. Rinn, F. TSAPWin: Time Series Analysis and Presentation for Dendrochronology and Related Applications; Rinn Tech: Heidelberg, Germany, 2003; Available online: http://www.rinntech.de/content/view/17/48/lang,english/index.html (accessed on 9 October 2018).
  29. Cook, E.R.; Kairiukstis, L.A. Methods of Dendrochronology: Applications in the Environmental Sciences; Kluwer Academic Publishers: Boston, MA, USA, 1990. [Google Scholar]
  30. Bolton, D. The computation of equivalent potential temperature. Mon. Weather Rev. 1980, 108, 1046–1053. [Google Scholar] [CrossRef]
  31. Harris, I.; Jones, P.D.; Osborn, T.J.; Lister, D.H. Updated high-resolution grids of monthly climatic observations—The CRU TS3.10 Dataset. Int. J. Climatol. 2014, 34, 623–642. [Google Scholar] [CrossRef] [Green Version]
  32. Leavitt, S.W. Tree-ring isotopic pooling without regard to mass: No difference from averaging δ13C values of each tree. Chem. Geol. 2008, 252, 52–55. [Google Scholar] [CrossRef]
  33. Laumer, W.; Andreu, L.; Helle, G.; Schleser, G.H.; Wieloch, T.; Wissel, H. A novel approach for the homogenization of cellulose to use micro-amounts for stable isotope analyses. Rapid Commun. Mass Spec. 2009, 23, 1934–1940. [Google Scholar] [CrossRef] [PubMed]
  34. O’Leary, M.H. Carbon isotope fractionation in plants. Phytochemistry 1981, 20, 553–567. [Google Scholar] [CrossRef]
  35. Saurer, M.; Siegwolf, R.T.W.; Schweingruber, F.H. Carbon isotope discrimination indicates improving water-use efficiency of trees in northern Eurasia over the last 100 years. Glob. Chang. Biol. 2004, 10, 2109–2120. [Google Scholar] [CrossRef]
  36. Treydte, K.S.; Frank, D.C.; Saurer, M.; Helle, G.; Schleser, G.H.; Esper, J. Impact of climate and CO2 on a millennium-long tree-ring carbon isotope record. Geochim. Cosmochim. Acta 2009, 73, 4635–4647. [Google Scholar] [CrossRef]
  37. Zang, C.; Biondi, F. Treeclim: An R package for the numerical calibration of proxy-climate relationships. Ecography 2015, 38, 431–436. [Google Scholar] [CrossRef]
  38. Killick, R.; Eckley, I.A. Changepoint: An R package for changepoint analysis. J. Stat. Softw. 2014, 58, 1–19. [Google Scholar] [CrossRef]
  39. Salzer, M.W.; Hughes, M.K.; Bunn, A.G.; Kipfmueller, K.F. Recent unprecedented tree-ring growth in bristlecone pine at the highest elevations and possible causes. Proc. Natl. Acad. Sci. USA 2009, 106, 20348–20353. [Google Scholar] [CrossRef] [PubMed] [Green Version]
  40. R-Core-Team. R: A Language and Environment for Statistical Computing; R Foundation for Statistical Computing: Vienna, Austria, 2016. [Google Scholar]
  41. Roden, J.S.; Farquhar, G.D. A controlled test of the dual-isotope approach for the interpretation of stable carbon and oxygen isotope ratio variation in tree rings. Tree Physiol. 2012, 32, 490–503. [Google Scholar] [CrossRef] [PubMed] [Green Version]
  42. Barbour, M.M.; Walcroft, A.S.; Farquhar, G.D. Seasonal variation in δ13C and δ18O of cellulose from growth rings of Pinus radiata. Plant Cell Environ. 2002, 25, 1483–1499. [Google Scholar] [CrossRef]
  43. Vygodskaya, N.N.; Milyukova, I.; Varlagin, A.; Tatarinov, F.; Sogachev, A.; Kobak, K.I.; Desyatkin, R.; Bauer, G.; Hollinger, D.Y.; Kelliher, F.M.; et al. Leaf conductance and CO2 assimilation of Larix gmelinii growing in an eastern Siberian boreal forest. Tree Physiol. 1997, 17, 607–615. [Google Scholar] [CrossRef] [PubMed]
  44. Novick, K.A.; Ficklin, D.L.; Stoy, P.C.; Williams, C.A.; Bohrer, G.; Oishi, A.C.; Papuga, S.A.; Blanken, P.D.; Noormets, A.; Sulman, B.N.; et al. The increasing importance of atmospheric demand for ecosystem water and carbon fluxes. Nat. Clim. Chang. 2016, 6, 1023–1027. [Google Scholar] [CrossRef] [Green Version]
  45. Belmecheri, S.; Wright, W.E.; Szejner, P.; Morino, K.A.; Monson, R.K. Carbon and oxygen isotope fractionations in tree rings reveal interactions between cambial phenology and seasonal climate. Plant Cell Environ. 2018. [Google Scholar] [CrossRef] [PubMed]
  46. Sidorova, O.; Siegwolf, R.; Saurer, M.; Shashkin, A.; Knorre, A.; Prokushkin, A.; Vaganov, E.; Kirdyanov, A. Do centennial tree-ring and stable isotope trends of Larix gmelinii (Rupr.) Rupr. indicate increasing water shortage in the Siberian north? Oecologia 2009, 161, 825–835. [Google Scholar] [CrossRef] [PubMed]
  47. Liu, X.; Zhang, X.; Zhao, L.; Xu, G.; Wang, L.; Sun, W.; Zhang, Q.; Wang, W.; Zeng, X.; Wu, G. Tree ring δ18O reveals no long-term change of atmospheric water demand since 1800 in the northern Great Hinggan Mountains, China. J. Geophys. Res. Atmos. 2017, 122, 6697–6712. [Google Scholar] [CrossRef]
  48. Eilmann, B.; Rigling, A. Tree-growth analyses to estimate tree species’ drought tolerance. Tree Physiol. 2012, 32, 178–187. [Google Scholar] [CrossRef] [PubMed]
  49. Oberhuber, W.; Kofler, W.; Schuster, R.; Wieser, G. Environmental effects on stem water deficit in co-occurring conifers exposed to soil dryness. Int. J. Biometeorol. 2015, 59, 417–426. [Google Scholar] [CrossRef] [PubMed]
  50. Gessler, A.; Ferrio, J.P.; Hommel, R.; Treydte, K.; Werner, R.A.; Monson, R.K. Stable isotopes in tree rings: Towards a mechanistic understanding of isotope fractionation and mixing processes from the leaves to the wood. Tree Physiol. 2014, 34, 796–818. [Google Scholar] [CrossRef] [PubMed]
  51. Aizen, V.B.; Aizen, E.; Fujita, K.; Nikitin, S.A.; Kreutz, K.J.; Takeuchi, L.N. Stable-isotope time series and precipitation origin from firn-core and snow samples, Altai glaciers, Siberia. J. Glaciol. 2005, 51, 637–654. [Google Scholar] [CrossRef] [Green Version]
  52. Chen, F.; Yuan, Y.; Wei, W.; Zhang, T.; Shang, H.; Zhang, R. Precipitation reconstruction for the southern Altay Mountains (China) from tree rings of Siberian spruce, reveals recent wetting trend. Dendrochronologia 2014, 32, 266–272. [Google Scholar] [CrossRef]
  53. Zhang, T.; Yuan, Y.; Chen, F.; Yu, S.; Zhang, R.; Qin, L.; Jiang, S. Reconstruction of hydrological changes based on tree-ring data of the Haba River, northwestern China. J. Arid Land 2018, 10, 53–67. [Google Scholar] [CrossRef]
  54. Battipaglia, G.; Saurer, M.; Cherubini, P.; Calfapietra, C.; McCarthy, H.R.; Norby, R.J.; Cotrufo, M.F. Elevated CO2 increases tree-level intrinsic water use efficiency: Insights from carbon and oxygen isotope analyses in tree rings across three forest FACE sites. New Phytol. 2013, 197, 544–554. [Google Scholar] [CrossRef] [PubMed]
  55. Streit, K.; Siegwolf, R.T.W.; Hagedorn, F.; Schaub, M.; Buchmann, N. Lack of photosynthetic or stomatal regulation after 9 years of elevated [CO2] and 4 years of soil warming in two conifer species at the alpine treeline. Plant Cell Environ. 2014, 37, 315–326. [Google Scholar] [CrossRef] [PubMed]
  56. Zhang, X.; Liu, X.; Zhang, Q.; Zeng, X.; Xu, G.; Wu, G.; Wang, W. Species-specific tree growth and intrinsic water-use efficiency of Dahurian larch (Larix gmelinii) and Mongolian pine (Pinus sylvestris var. mongolica) growing in a boreal permafrost region of the Greater Hinggan Mountains, Northeastern China. Agric. For. Meteorol. 2018, 248, 145–155. [Google Scholar]
  57. Weigt, R.B.; Streit, K.; Saurer, M.; Siegwolf, R.T.W. The influence of increasing temperature and CO2 concentration on recent growth of old-growth larch: Contrasting responses at leaf and stem processes derived from tree-ring width and stable isotopes. Tree Physiol. 2018, 38, 706–720. [Google Scholar] [CrossRef] [PubMed]
  58. Körner, C. Paradigm shift in plant growth control. Curr. Opin. Plant Biol. 2015, 25, 107–114. [Google Scholar] [CrossRef] [PubMed]
  59. Fatichi, S.; Leuzinger, S.; Körner, C. Moving beyond photosynthesis: From carbon source to sink-driven vegetation modeling. New Phytol. 2014, 201, 1086–1095. [Google Scholar] [CrossRef] [PubMed]
Figure 1. Climates of the study area: (a) monthly precipitation and temperature; and (b) relative humidity and vapor pressure deficit (VPD). Data based on the Fuyun meteorological station data from 1961 to 2011.
Forests 09 00642 g001
Figure 2. (a) Tree-ring stable carbon discrimination (Δ13C) based on the model described by Farquhar et al. [8]. The shaded areas represent uncertainties related to post-photosynthetic fractionation (±1.5‰). (b) Tree-ring δ18O series along with the number of trees used for δ13C and δ18O measurements. In panels in (a) and (b), the horizontal dashed lines indicate the mean of Δ13C and δ18O over the period 1790–2011. The thick dashed lines (red) represent the mean values of Δ13C and δ18O over different sub-periods divided by the changepoints years (dotted vertical lines) based on “changepoint” detection (see details in the text). (c) 31-year running correlations between tree-ring Δ13C and δ18O. In the panel in (c), the plotted values are in the center of the investigated 31-year window. The dashed line represents the p = 0.05 significance level.
Forests 09 00642 g002
Figure 3. Correlation analyses between ci and climate parameters (mean monthly temperature (T); monthly precipitation (P); relative humidity (RH); and atmospheric vapor pressure deficit (VPD)) at the high-frequency time scales (the first-order difference (FOD) and 30-year “high-pass” spline filter (HF)) for (a) the meteorological data from the Fuyun meteorological station (1961–2011) and (b) the CRU data (1901–2011). For climatic variables in the previous year, the data covered 1962–2011 and 1902–2011 for the Fuyun meteorological station and CRU data, respectively. In the panels, J–A represents the mean value from June to August; M–A represents the mean value from May to August; A–A represents the mean value from April to August. The legend of panel b is the same as that in the panel a. Please note that the significant level lines changed for the panels a and b due to the number of the statistical samples.
Forests 09 00642 g003
Figure 4. (a) Tree-ring Δ13C estimated ci with the correction of the ci data (ci + τ* (ca-280)) used to diagnose the τ most consistent with the historical climate data. This numerical optimization procedure could isolate the climatic influences on isotope discrimination by controlling the parameter τ (see details in the main text). (b) The optimum τ value decided by the mean τ values maximizing the explained variance and minimizing the absolute residual trend. The climatic PC1 (see details in the text) was used to detect the optimum τ value. (c) Comparison of the PC1 (both from the Fuyun meteorological station and CRU) with ci variability (both for the tree-ring estimated ci and ci-climate). The Pearson correlation coefficient (r) between PC1 and ci-climate are also provided in the panel c. We inverted PC1 data to enhance the visualization.
Forests 09 00642 g004
Figure 5. Tree-ring width variability for (a) old trees (>350 years) and (b) medium-aged (200–350 years) trees after truncation (see text for details). The red lines are the mean values of each group.
Forests 09 00642 g005
Figure 6. Correlations between mean tree-ring width (a) from old trees group and (b) from medium-aged trees group and monthly climatic parameters (T, P, RH, and VPD) from the Fuyun meteorological station. On the x-axes, the lowercase letters represent the months of the previous year, and the uppercase letters represent the months of the current year. Seasonal windows include the periods of May to August (M–A) and May to September (M–S).
Forests 09 00642 g006
Figure 7. Climate response of tree-ring δ18O to monthly climatic parameters (T, P, RH, and VPD) from (a) the meteorological data (1961–2011) and (b) the CRU data (1901–2011). On the x-axes, the lowercase letters represent the months of the previous year, and the uppercase letters represent the months of the current year. Seasonal windows include May to August (M–A) and May to September (M–S). (c) The temporal stability of the relationship between tree-ring δ18O and CRU VPD from May to September and seasonal windows based on 25-year window correlation analyses. The significant correlations at the level of p = 0.05 are indicated by “*”.
Forests 09 00642 g007
Figure 8. (a) The linear regression between mean May–September (M–S) VPD and tree-ring δ18O. In the panel (a), a transfer function was established using the tree-ring δ18O as an independent variable. The shaded area indicates the p = 0.05 significance level of the regression. DW indicates the Durbin–Watson index. (b) The linear regression between mean May–September (M–S) VPD and tree-ring δ18O FOD. The comparison of May–September VPD between observations from the Fuyun meteorological station and reconstruction based on tree-ring δ18O (c) at the annual and (d) FOD time scales, and their associated Pearson correlation coefficients (r). (e) The co-variability of reconstructed May–September VPD and May–September VPD from the CRU dataset and the Fuyun station associated with their Pearson correlation coefficients. The significant (p < 0.05) linear trends in the reconstructed VPD for different periods (1790–1819, 1820–1876, 1877–1972, and 1983–2011) are indicated in the panel (e). (f) The co-variability of May–September VPD FOD reconstruction and May–September VPD FOD from the CRU dataset and the Fuyun meteorological station associated with their Pearson correlation coefficients. We used the z-score values to enhance the visualization in panels (e) and (f).
Forests 09 00642 g008
Figure 9. (a) The percent change of ci and ci-climate relative to 1791–1800. (b) The percent change of iWUE and cciWUE as well as the rate of iWUE change with time for periods 1877–1972 and 1973–2011. (c) The different contributions of CO2atm and climate to iWUE for the separate time periods. The contributions were calculated as the cumulative value of the FOD in percent change (see details in the text) for the different periods.
Forests 09 00642 g009
Figure 10. Density distribution of ring width based on all single-core values in the different periods for (a) old and (c) medium-aged trees. The vertical dashed lines indicate the mean tree-ring width, with tree-ring widths to the left of the dashed lines indicating a narrow ring. The “n” indicates the number of the trees ((a) 8 cores from 6 old trees and (c) 36 cores from 26 medium-aged trees). Scatter plots and linear regressions (individual cores are colored and the average across the group is in black) show the relationship between the percent change of iWUE (see details in text) and the raw tree-ring width for (b) old trees and (d) medium-aged trees during each period. The gray shaded areas denote the significant intervals of the linear regression between the percent change of iWUE and the group mean tree-ring width. Only the significant (p < 0.05) trends (slope) are labeled.
Forests 09 00642 g010
Table 1. Calibration and verification statistics for May–September VPD reconstructions for the annual and the FOD scales based on tree-ring δ18O. The cross-calibration and verification were performed for 26-year intervals. r is the Pearson correlation coefficient; RE is the reduction of error; and CE is the coefficient of efficiency.
InterannualPeriodrRECEPeriodrRECE
Calibration1987–20110.82 1961–19860.64
Verification1961–19860.640.42−0.081987–20110.820.52−0.17
Full period1961–20110.70
Leave-one-out method1961–20110.670.450.45
FODPeriodrRECEPeriodrRECE
Calibration1987–20110.79 1961–19860.81
Verification1961–19860.810.660.661987–20110.790.650.65
Full period1961–20110.81
Leave-one-out method1961–20110.790.630.63
Table 2. Tukey multiple comparisons of tree-ring width means of old and medium-aged trees for different sub-periods. Only the differences that passed the 95% family-wise confidence level are listed. The superscript letters “a” and “b” indicate the significant difference between tree-ring width for the two comparison periods (period 1 and period 2).
Old Trees (Age > 350)Medium-Aged Trees (Age 200–350)
period 1period 2difference (period 1–period 2)p-valueperiod 1period 2difference (period 1–period 2)p-value
1790–18191996–20110.0390.741930–19721996–2011 b0.1830.001
1983–1995 a0.1200.0011983–1995 b0.2300.001
1973–1982−0.0470.6461973–1982 b0.1090.001
1877–1972−0.0270.631973–19821996–2011 b0.0740.003
1820–18760.0440.1661983–1995 b0.1220.001
1820–18761996–2011−0.0060.9991983–19951996–2011−0.0470.080
1983–1995 a0.0750.042
1973–1982 a−0.0920.018
1877–1972 a−0.0720.001
1877–19721996–20110.0660.091
1983–1995 a0.1470.001
1973–1982−0.0190.980
1973–19821996–20110.0860.153
1983–1995 a0.1670.001
1983–19951996–2011−0.0810.143

