Assessing the Impact of Forest Change and Climate Variability on Dry Season Runoff by an Improved Single Watershed Approach: A Comparative Study in Two Large Watersheds, China


Abstract
:1. Introduction
2. Materials and Methods
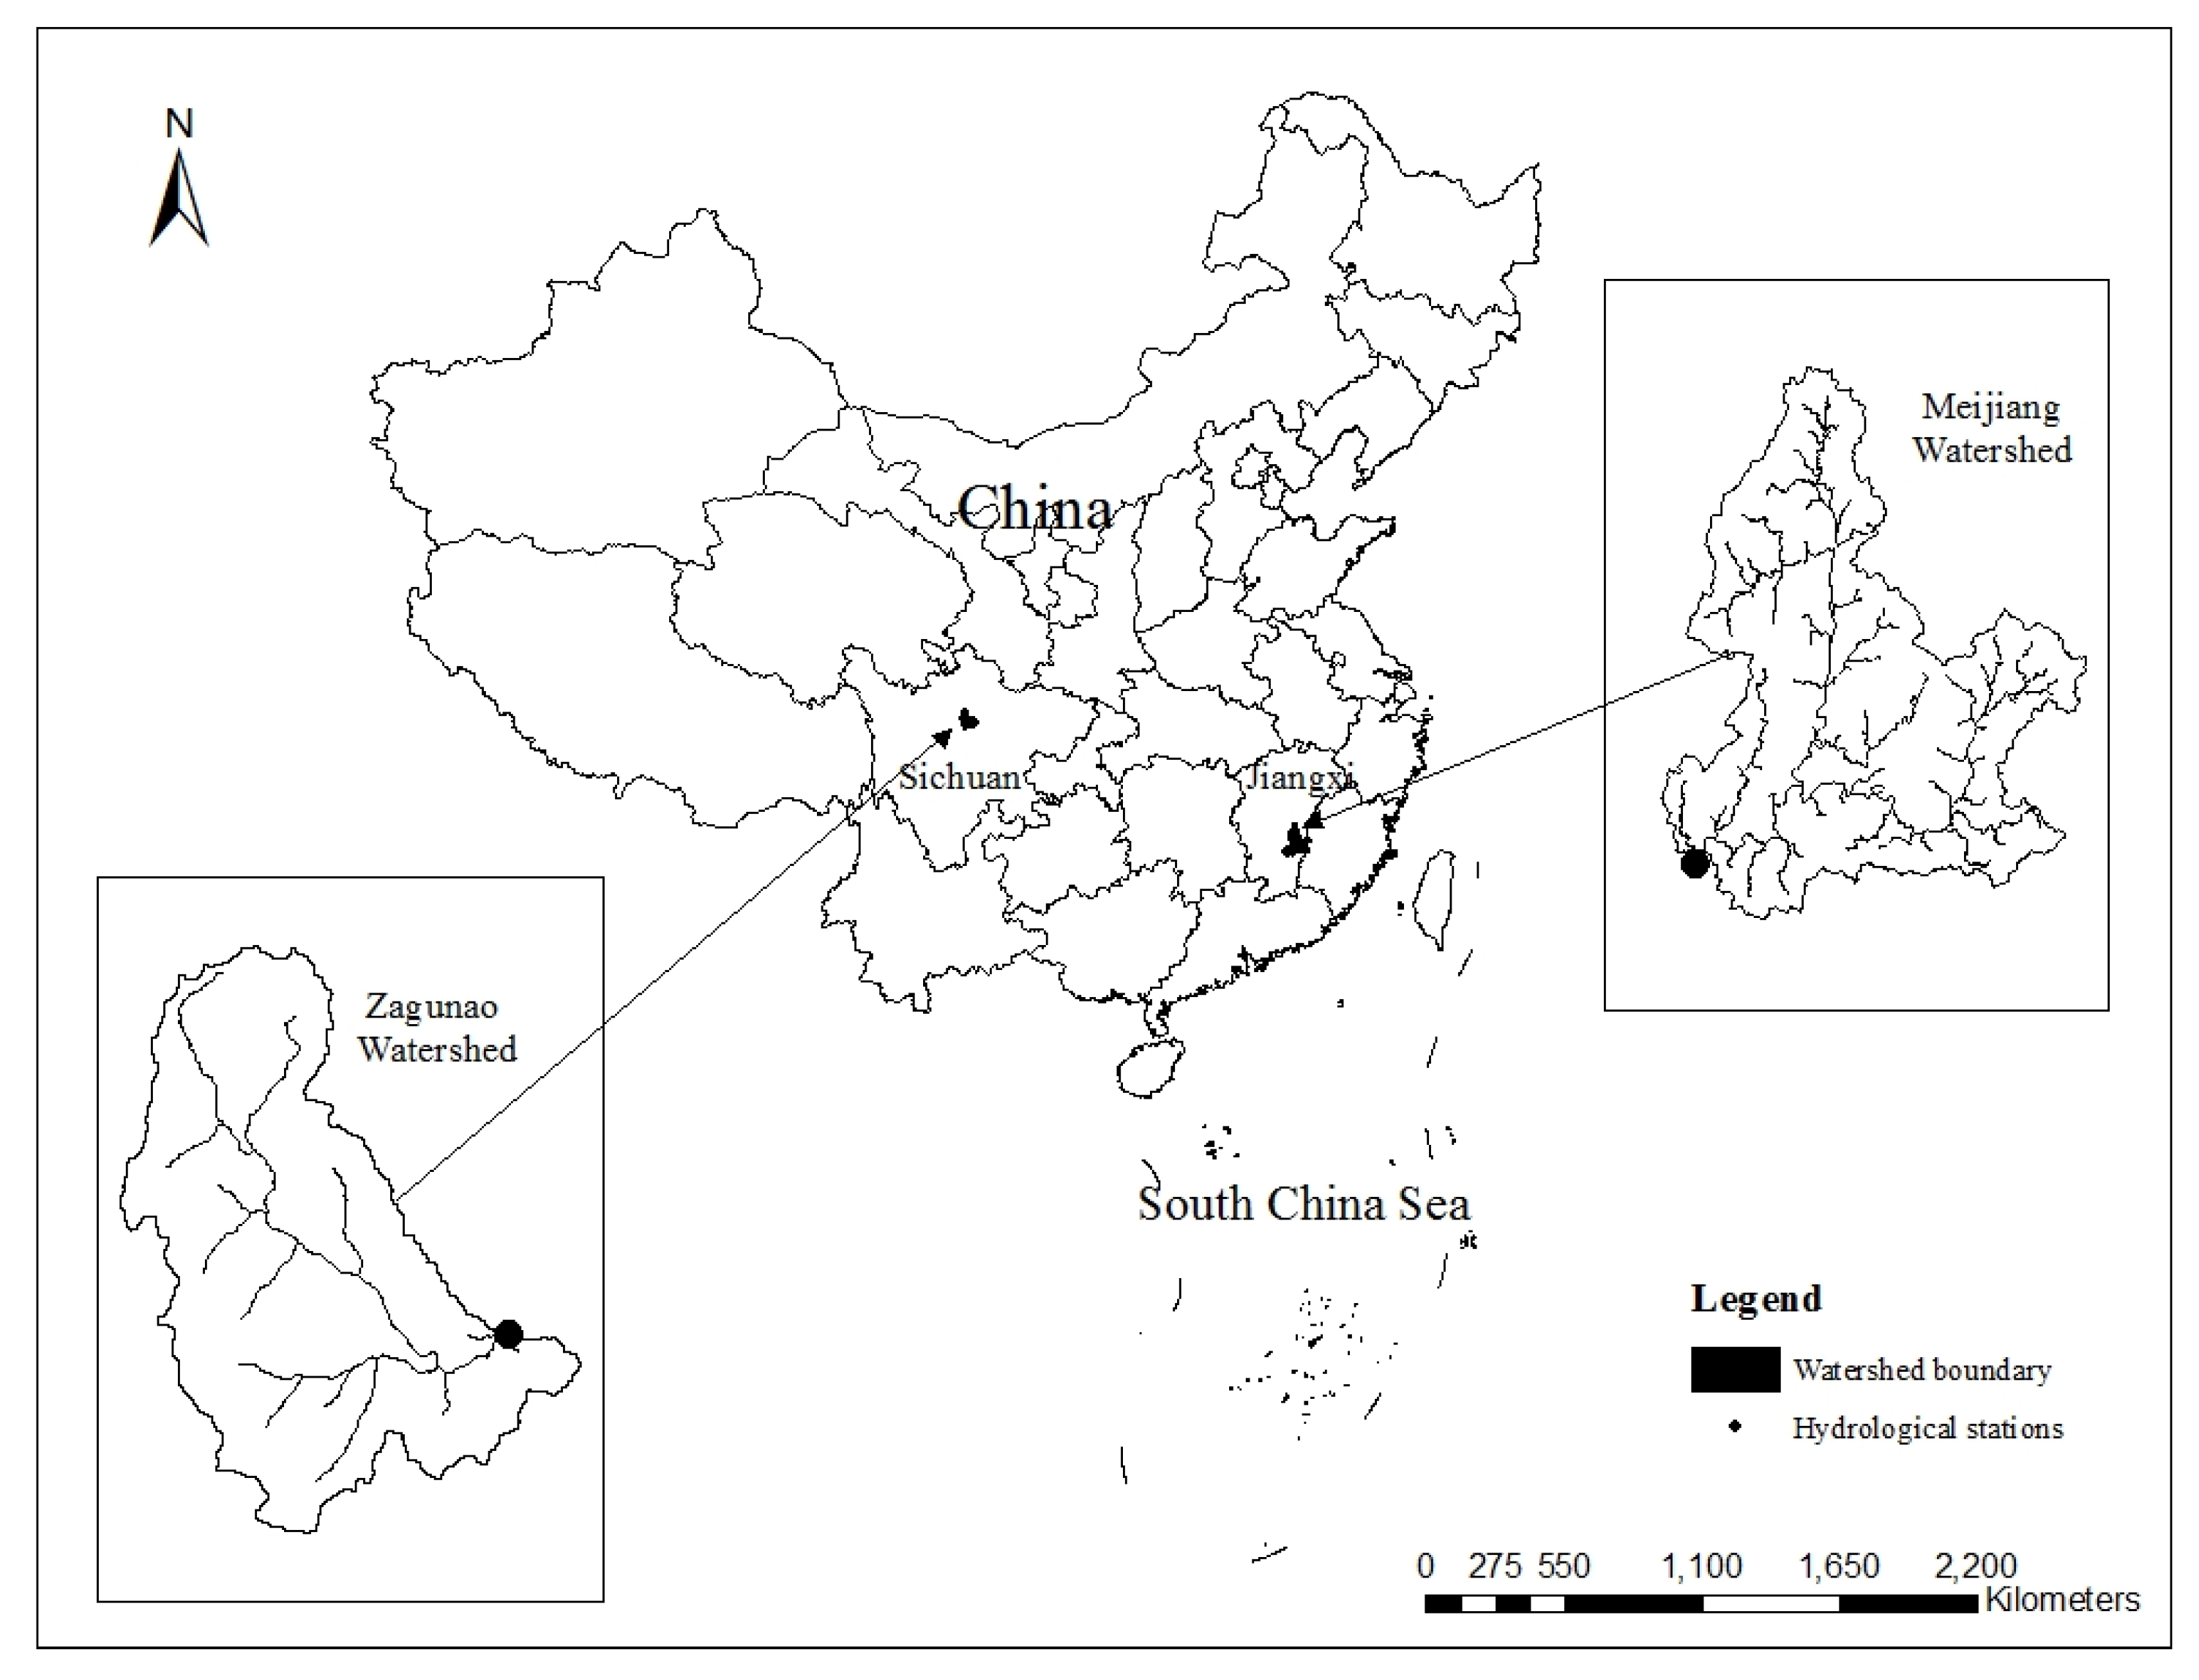
2.1. Study Watersheds
2.2. Data
2.3. Methods
2.3.1. Trend Analysis
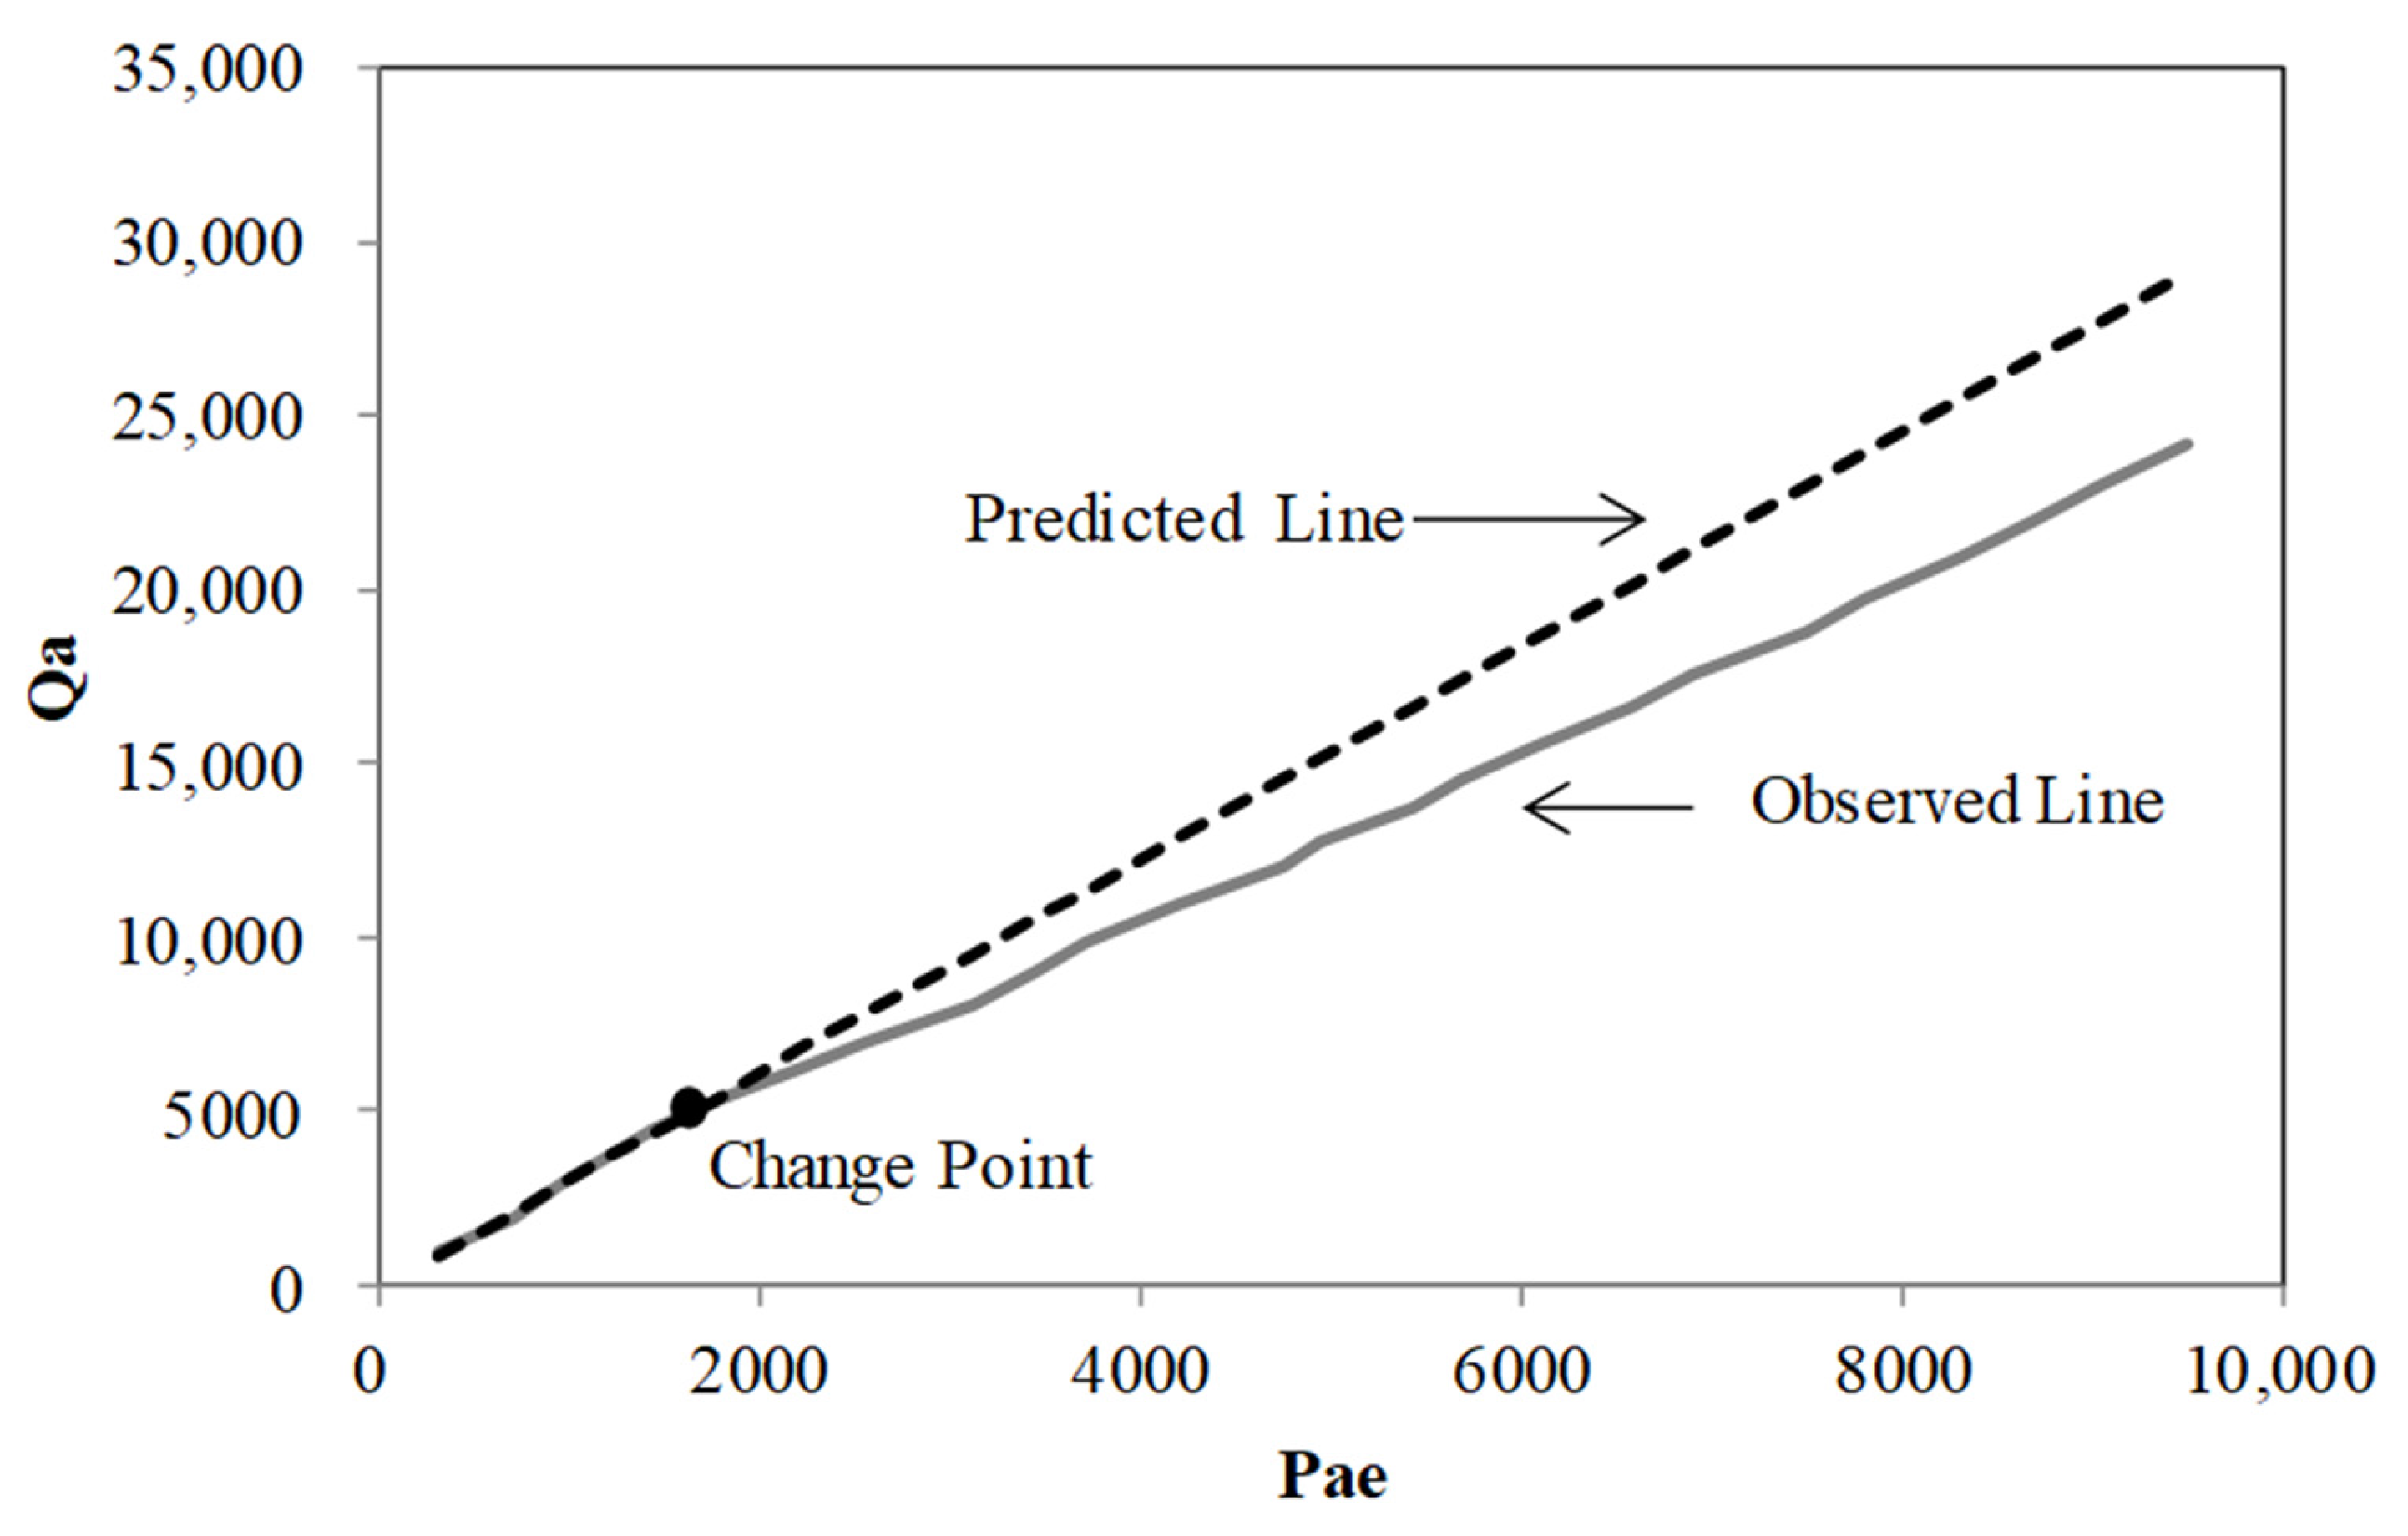
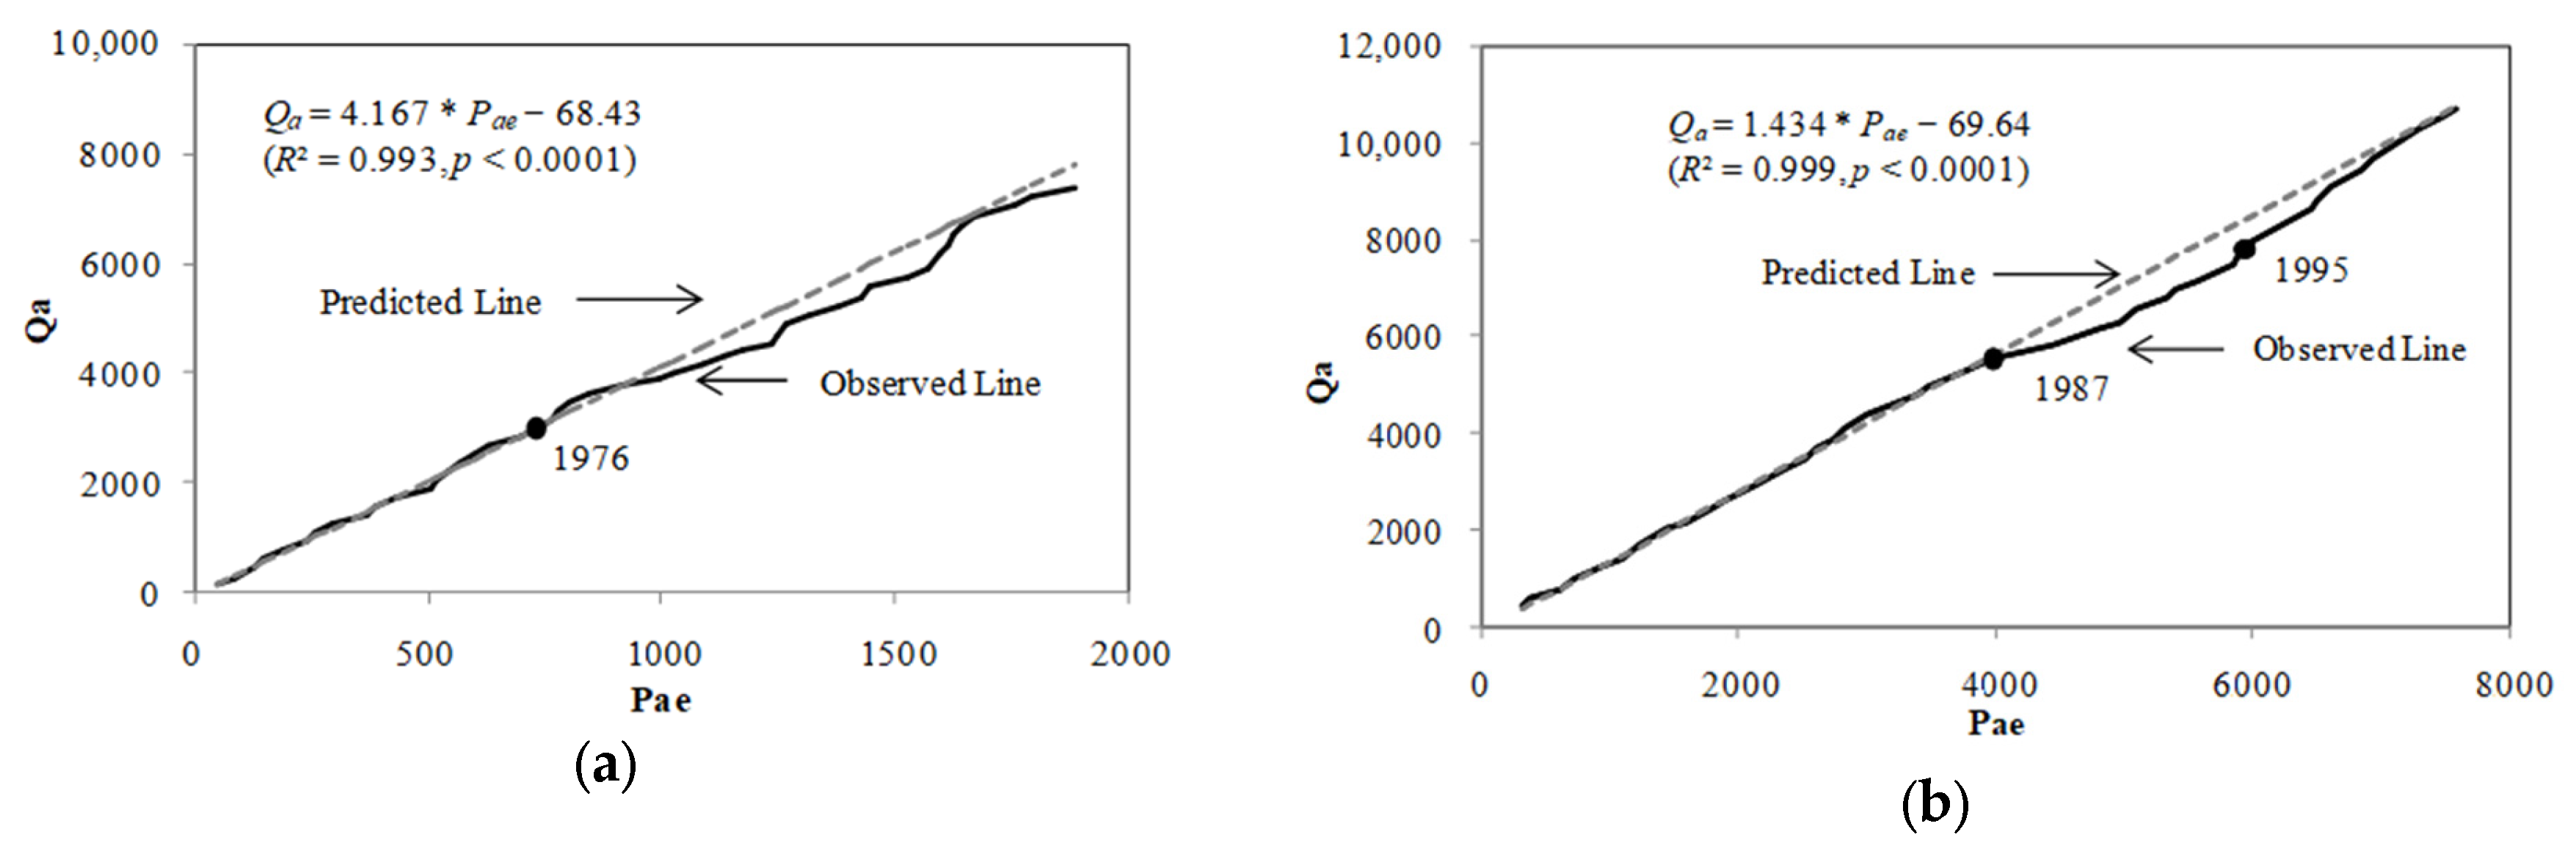
2.3.2. Excluding the Effect of Climate Variability on Dry Season Runoff
2.3.3. Quantifying the Effect of Forest Change on Dry Season Runoff
3. Results
3.1. Trend Analysis
3.2. Dry Season Runoff Variation Caused by Non-Climate Factors
3.3. Hydrological Response to Forest Change and Other Factors
4. Discussion
4.1. Dry Season Runoff Response to Forest Change
4.2. Relative Contributions of Forest Change and Climate Variability on Dry Season Runoff
4.3. Limitations and Future Studies
5. Conclusions
Acknowledgments
Author Contributions
Conflicts of Interest
References
- Van Dijk, A.; Peña-Arancibia, J.; Bruijnzeel, L. Land cover and water yield: Inference problems when comparing catchments with mixed land cover. Hydrol. Earth Syst. Sci. 2012, 16, 3461–3473. [Google Scholar] [CrossRef] [Green Version]
- Sahin, V.; Hall, M. The effects of afforestation and deforestation on water yields. J. Hydrol. 1996, 178, 293–309. [Google Scholar] [CrossRef]
- Stednick, J. Monitoring the effects of timber harvest on annual water yield. J. Hydrol. 1996, 176, 79–95. [Google Scholar] [CrossRef]
- Andreassian, V. Watershed and forests: From historical controversy to scientific debate. J. Hydrol. 2004, 291, 1–27. [Google Scholar] [CrossRef]
- Brown, A.; Zhang, L.; McMahon, T.A.; Western, A.W.; Vertessy, R.A. A review of paired catchment studies for determining changes in water yield resulting from alterations in vegetation. J. Hydrol. 2005, 310, 28–61. [Google Scholar] [CrossRef]
- Bruijnzeel, L. Hydrological functions of tropical forests: Not seeing the soils for the trees. Agric. Ecosyst. Environ. 2004, 104, 185–228. [Google Scholar] [CrossRef]
- Moore, R.; Wondzell, S. Physical hydrology and the effects of forest harvesting in the Pacific Northwest: A review. J. Am. Water Reour. Assoc. 2005, 41, 763–784. [Google Scholar] [CrossRef]
- Calder, I.R. Blue Revolution–Integrated Land and Water Resources Management, 2nd ed.; Earthscan: London, UK, 2005. [Google Scholar]
- Bosch, J.; Hewlett, J. A review of catchment experiments to determine the effect of vegetation changes on water yield and evapotranspiration. J. Hydrol. 1982, 55, 3–23. [Google Scholar] [CrossRef]
- Hicks, B.J.; Beschta, R.L.; Harr, R.D. Long-term changes in streamflow following logging in western Oregon and associated fisheries implications. Water Resour. Bull. 1991, 27, 217–226. [Google Scholar] [CrossRef]
- Chandler, D.G. Reversibility of forest conversion impacts on water budgets in tropical karst terrain. For. Ecol. Manag. 2006, 224, 81–94. [Google Scholar] [CrossRef]
- Van Dijk, A.I.J.M.; Keenan, R.J. Planted forests and water in perspective. For. Ecol. Manag. 2007, 251, 1–9. [Google Scholar] [CrossRef]
- Carvalho-Santos, C.; Nunes, J.; Monteiro, A.; Hein, L.; Honrado, J. Assessing the effects of land cover and future climate conditions on the provision of hydrological services in a medium-sized watershed of Portugal. Hydrol. Process. 2016, 30, 720–738. [Google Scholar] [CrossRef]
- Scott, D.; Prinsloo, F. Longer-term effects of pine and eucalypt plantations on streamflow. Water Resour. Res. 2008, 44, W00A08. [Google Scholar] [CrossRef]
- Costa, M.; Botta, A.; Cardille, J. Effects of large-scale changes in land cover on the discharge of the Tocantins River, Southeastern Amazonia. J. Hydrol. 2003, 283, 206–217. [Google Scholar] [CrossRef]
- Tuteja, N.; Vaze, J.; Teng, J.; Mutendeudzi, M. Partitioning the effects of pine plantations and climate variability on runoff from a large catchment in southeastern Australia. Water Resour. Res. 2007, 43, W08415. [Google Scholar] [CrossRef]
- Rodionov, S. A brief overview of the regime shift detection methods. In Large-Scale Disturbances (Regime Shifts) and Recovery in Aquatic Ecosystems: Challenges for Management toward Sustainability; Joint Institute for the Study of the Atmosphere and Ocean, University of Washington: Seattle, WA, USA, 2005. [Google Scholar]
- Amatya, D.M.; Sun, G.; Rossi, C.G.; Segane, H.S.; Nettles, J.E.; Panda, S. Forests, Land Use Change, and Water, Impact of Climate Change on Water Resources in Agriculture; Rodrigues, R., Ed.; CRC Press/Taylor & Francis: Boca Raton, FL, USA, 2015. [Google Scholar]
- Sun, G.; Amatya, D.; McNulty, S. Forest hydrology. In Systems Hydrology, Handbook of Applied Hydrology; Sing, V.V., Ed.; Southern Research Station: Asheville, NC, USA, 2016. [Google Scholar]
- Putz, G.; Burke, J.; Smith, D.W.; Chanasyk, D.S.; Prepas, E.E.; Mapfumo, E. Modelling the effects of boreal forest landscape management upon streamflow and water quality: Basic concepts and considerations. J. Environ. Eng. Sci. 2003, S2, 87–101. [Google Scholar] [CrossRef]
- Wei, X.; Liu, W.; Zhou, P. Quantifying the relative contributions of forest change and climatic variability to hydrology in large watersheds: A critical review of research methods. Water 2013, 5, 728–746. [Google Scholar] [CrossRef]
- Kirchner, J.W. Getting the right answers for the right reasons: Linking measurements, analyses, and models to advance the science of hydrology. Water Resour. Res. 2006, 42, W03S04. [Google Scholar] [CrossRef]
- Beven, K. The future of distributed models: Model calibration and uncertainty prediction. Hydrol. Process. 1992, 6, 279–298. [Google Scholar] [CrossRef]
- Dooge, J.C.I.; Bruen, M.; Parmentier, B. A simple model for estimating the sensitivity of runoff to long–term changes in precipitation without a change in vegetation. Adv. Water Resour. 1999, 23, 153–163. [Google Scholar] [CrossRef]
- Wei, X.; Zhang, M. Quantifying streamflow change caused by forest disturbance at a large spatial scale: A single watershed study. Water Resour. Res. 2010, 46, W12525. [Google Scholar] [CrossRef]
- Zhang, M.; Wei, X. The effects of cumulative forest disturbance on streamflow in a large watershed in the central interior of British Columbia, Canada. Hydrol. Earth Syst. Sci. 2012, 16, 2021–2034. [Google Scholar] [CrossRef] [Green Version]
- Zhang, M.; Wei, X.; Sun, P.; Liu, S. The effect of forest harvesting and climatic variability on runoff in a large watershed: The case study in the Upper Minjiang River of Yangtze River basin. J. Hydrol. 2012, 464–465, 1–11. [Google Scholar] [CrossRef]
- Zhang, M.; Wei, X.; Li, Q. Do the hydrological responses to forest disturbances in large watersheds vary along climatic gradients in the interior of British Columbia, Canada? Ecohydrology 2017, 10. [Google Scholar] [CrossRef]
- Yao, Y.F.; Cai, T.J.; Wei, X.H.; Zhang, M.F.; Ju, C.Y. Effect of forest recovery on summer streamflow in small forested watersheds, Northeastern China. Hydrol. Process. 2011, 26, 1208–1214. [Google Scholar] [CrossRef]
- Liu, W.; Wei, X.; Liu, S.; Liu, Y.; Fan, H.; Zhang, M.; Yin, J.; Zhan, M. How do climate and forest changes affect long-term streamflow dynamics? A case study in the upper reach of Poyang River basin. Ecohydrology 2014, 8, 46–57. [Google Scholar] [CrossRef]
- Zhang, X.; Zhang, L.; Zhao, J.; Rustomji, P.; Hairsine, P. Responses of streamflow to changes in climate and land use/cover in the Loess Plateau, China. Water Resour. Res. 2008, 44, W00A07. [Google Scholar] [CrossRef]
- Spearman, C. Demonstration of formulae for true measurement of correlation. Am. J. Psychol. 1907, 33, 55–62. [Google Scholar] [CrossRef]
- Mann, H. Non-parametric tests against trend. Econometrica 1945, 13, 245–259. [Google Scholar] [CrossRef]
- Kendall, M. Rank Correlation Measures; Charles Griffin: London, UK, 1975; p. 202. [Google Scholar]
- Siriwardena, L.; Finlayson, B.L.; McMahon, T.A. The impact of land use change on catchment hydrology in large catchments: The Comet River, Central Queensland, Australia. J. Hydrol. 2006, 326, 199–214. [Google Scholar] [CrossRef]
- Wigbout, M. Limitations in the use of double mass curves. J. Hydrol. 1973, 12, 132–138. [Google Scholar]
- Zhang, L.; Dawes, W.; Walker, G. Response of mean annual evapotranspiration to vegetation changes at catchment scale. Water Resour. Res. 2010, 37, 701–708. [Google Scholar] [CrossRef]
- Hargreaves, G.; Samani, Z. Reference crop evapotranspiration from temperature. Appl. Eng. Agric. 1985, 1, 96–99. [Google Scholar] [CrossRef]
- Box, G.E.P.; Cox, D.R. An analysis of transformations. J. R. Stat. Soc. B 1964, 26, 211–252. [Google Scholar]
- Box, G.E.P.; Jenkins, G.M. Time Series Analysis: Forecasting and Control; Holden Day: San Francisco, CA, USA, 1976. [Google Scholar]
- Engle, R.; Watson, M. A one-factor multivariate time series model of metropolitan wage rates. J. Am. Stat. Assoc. 1981, 76, 774–781. [Google Scholar] [CrossRef]
- Brocklebank, J.; Dickey, D. SAS for Forecasting Time Series, 2nd ed.; John Wiley: New York, NY, USA, 2003. [Google Scholar]
- Law, T.H.; Umar, R.S.R.; Zulkaurnain, S.; Kulanthayan, S. Impact of the effect of economic crisis and the targeted motorcycle safety programme on motorcycle-related accidents, injuries and fatalities in Malaysia. Int. J. Inj. Control Saf. Promot. 2005, 12, 9–21. [Google Scholar] [CrossRef] [PubMed] [Green Version]
- Ma, X. The impacts of forest harvesting on stream discharge and sediment in the upper Minjiang River Basin. Nat. Res. J. 1980, 5, 78–87. [Google Scholar]
- Löf, M.; Paulsson, R.; Dan, R.; Welander, N.T. The influence of different overstory removal on planted spruce and several broadleaved tree species: Survival, growth and pine weevil damage during three years. Ann. For. Sci. 2005, 62, 237–244. [Google Scholar] [CrossRef]
- Liu, S.; Sun, P.; Wang, J.; Chen, L. Hydrological Functions of Forest Vegetation in Upper Reaches of the Yangtze River. J. Nat. Res. 2001, 16, 451–456. [Google Scholar]
- Chen, C.; Zhang, J.; Zhou, C.; Zheng, H. Researches on improving the quality of forest land and the productivity of artificial Cunninghamia lanceolata stands. J. Appl. Ecol. 1990, 1, 97–106. [Google Scholar]
- Amiro, B.D.; Barr, A.G.; Black, T.A.; Iwashita, H.; Kljun, N.; McCaughey, J.H.; Morgenstern, K.; Murayama, S.; Nesic, S.; Orchansky, A.L.; et al. Carbon, energy and water fluxes at mature and disturbed forest sites, Saskatchewan, Canada. Agric. For. Meteorol. 2006, 136, 237–251. [Google Scholar] [CrossRef]
- Li, Z.; Liu, W.; Zhang, X.; Zheng, F. Impacts of land use change and climate variability on hydrology in an agriculture catchment on the Loess Plateau of China. J. Hydrol. 2009, 377, 35–42. [Google Scholar] [CrossRef]
- Ma, Z.; Kang, S.; Zhang, L.; Tong, L. Analysis of impacts of climate variability and human activity on stream flow for a river basin in arid region of northwest China. J. Hydrol. 2008, 352, 239–249. [Google Scholar] [CrossRef]
- Zheng, H.; Zhang, L.; Zhu, C.; Liu, C.; Sato, Y.; Fukushima, Y. Responses of streamflow to climate and land surface change in the headwaters of the Yellow River Basin. Water Resour. Res. 2009, 45, W00A19. [Google Scholar] [CrossRef]
- Harr, D.R. Potential for augmenting water yield through forest practices in western Washington and western Oregon. Water Resour. Bull. 1983, 19, 383–393. [Google Scholar] [CrossRef]
- Van der Weert, R. Hydrological conditions in Indonesia; Delft Hydraulics: Jakarta, Indonesia, 1994; p. 72. [Google Scholar]


| Metrics | Zagunao | Meijiang |
|---|---|---|
| Drainage area | 2441.77 km² | 6310.13 km² |
| Climate type | Alpine climate | Subtropical monsoon climate |
| Hydrological year | November–October | March–February |
| Dry season | November–April | September–February |
| T (°C) | 11.2 | 18.4 |
| Td (°C) | 5.5 | 14.0 |
| P (mm) | 999.7 | 1735.5 |
| Pd (mm) | 184.4 | 447.8 |
| Q (mm) | 773.4 | 857.7 |
| Qd (mm) | 160.4 | 233.0 |
| Land Use Types | % of Total Watershed Area | |
|---|---|---|
| Zagunao | Meijiang | |
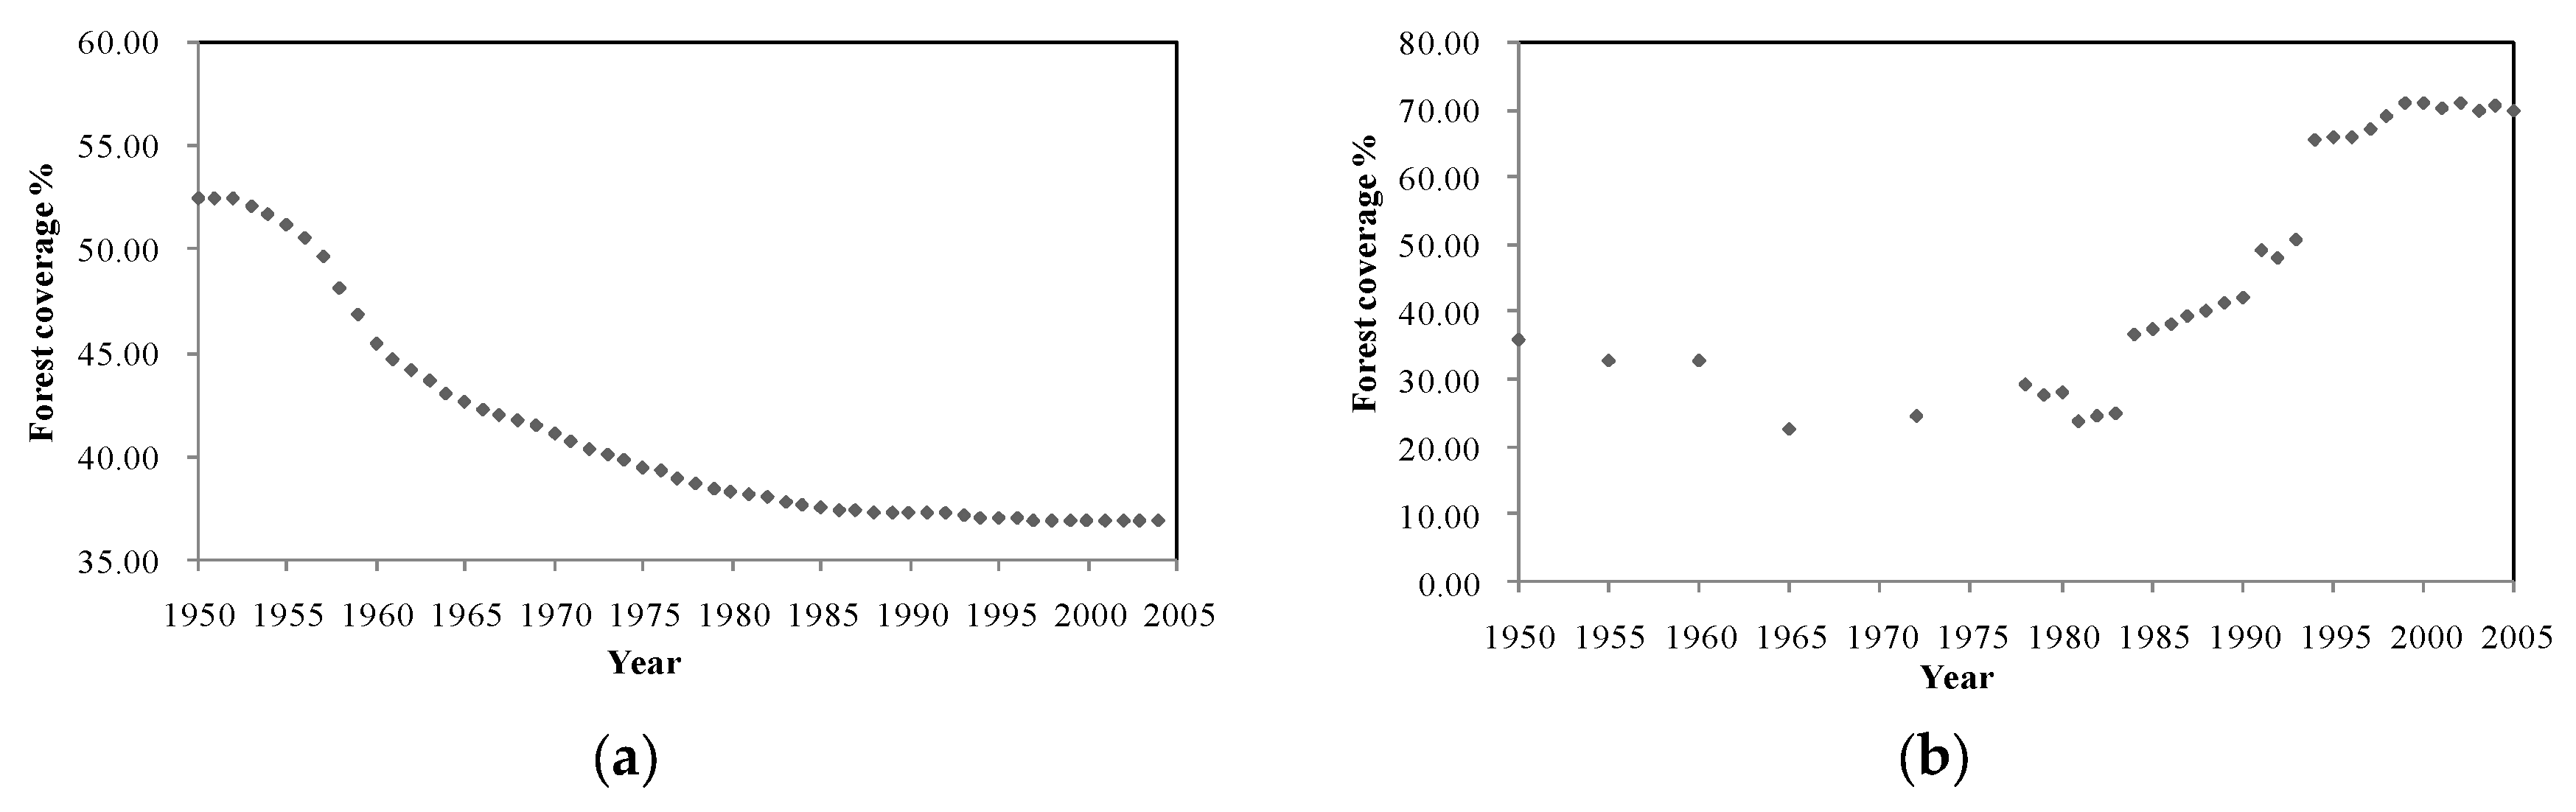
| Forest land | 37.00 | 68.75 |
| Orchard | 12.00 | 8.48 |
| Farmland | 0.49 | 20.39 |
| Urban or built-up land | 0.01 | 1.01 |
| Grassland | 47.00 | 1.37 |
| Snow and Ice | 3.50 | 0.00 |
| Variables | Zagunao | Meijiang | ||
|---|---|---|---|---|
| Kendall Tau | Spearman Rho | Kendall Tau | Spearman Rho | |
| Annual runoff | 0.32 * | 0.46 * | 0.01 | 0.00 |
| Dry season runoff | 0.40 * | 0.57 * | −0.03 | −0.06 |
| Annual precipitation | 0.14 | 0.23 | 0.10 | 0.10 |
| Dry season precipitation | −0.13 | −0.14 | −0.15 | −0.25 |
| Annual mean temperature | 0.09 | 0.15 | 0.47 * | 0.65 * |
| Annual maximum temperature | 0.22 | 0.32 | 0.54 * | 0.71 * |
| Annual minimum temperature | −0.15 | −0.22 | 0.44 * | 0.61 * |
| Dry season mean temperature | 0.07 | 0.09 | 0.39 * | 0.53 * |
| Annual evapotranspiration | 0.10 | −0.12 | 0.12 | 0.16 |
| Dry season evapotranspiration | −0.17 | −0.23 | −0.07 | −0.13 |
| Forest coverage | 0.77 * | 0.92 * | −0.98 * | −0.99 * |
| Watershed | AP Part | Int Part | MA Part | Intervention Part | Change Type | Model Structure | MS | ||||
|---|---|---|---|---|---|---|---|---|---|---|---|
| CP1 | CP2 | ||||||||||
| p(1) | p(2) | d(1) | q(1) | Ω(1) | △(1) | Ω(2) | △(2) | ||||
| Zagunao | 0 | 0 | 0 | −0.98 (p = 0.00) | 1.90 (p = 0.00) | −0.33 (p = 0.03) | 0 | 0 | GP | Ln(x) (0,0,1) | 0.69 |
| Meijiang | −0.95 (p = 0.00) | −0.68 (p = 0.00) | 1 | 0 | −0.78 (p = 0.03) | −0.95 (p = 0.00) | −0.94 (p = 0.03) | −0.98 (p = 0.00) | GP | Ln(x) (2,1,0) | 0.16 |
| Watershed | Period | Wilcoxon Test | Sign Test |
|---|---|---|---|
| Zagunao | Reference period (1959–1975) | 0.31 (p = 0.758) | 0.22 (p = 0.737) |
| Disturbed period (1976–2004) | 4.00 * (p = 0.000) | 2.97 * (p = 0.003) | |
| Meijiang | Reference period (1961–1986) | 0.65 (p = 0.517) | 0.59 (p = 0.556) |
| Disturbed period (1987–1994) | 2.52 * (p = 0.011) | 2.47 * (p = 0.013) | |
| Disturbed period (1995–2005) | 2.93 * (p = 0.003) | 3.02 * (p = 0.003) |
| Watershed | Model Structure | Parameter Estimation | |||
|---|---|---|---|---|---|
| p(1) | q(1) | c | Forest Coverage | ||
| Zagunao | Accumulation of forest coverage: ARIMA(1,1,1) | 0.59 (p < 0.001) | 0.78 (p < 0.001) | / | / |
| ∆Qanc0: ARIMAX(0,0,1) | / | 1.24 (p < 0.001) | −190.5 (p < 0.005) | −112.4 (p < 0.001) | |
| Meijiang | Accumulation of forest coverage: ARIMA(1,1,1) | 0.626 (p < 0.000) | 0.795 (p < 0.001) | / | / |
| ∆Qanc0: ARIMAX(1,0,0) | 0.601 (p < 0.001) | / | −1283.136 (p < 0.001) | 509.451 (p < 0.001) | |
| Watershed | Phase | ∆Q (mm) | ∆Qc (mm) | ∆Qf (mm) | ∆Qo (mm) | ∆Qc (%) | ∆Qf (%) | ∆Qo (%) | ∆Q (%) | Rc (%) | Rf (%) | Ro (%) | F (%) | Reference F (%) |
|---|---|---|---|---|---|---|---|---|---|---|---|---|---|---|
| Zagunao | 1976–1994 | −4.8 ± 5.2 | 22.0 ± 19.5 | −25.0 ± 22.1 | −1.8 ± 17.3 | 13.7 ± 12.2 | −15.6 ± 13.8 | −1.1 ± 10.8 | −3.0 ± 3.2 | 38.2 ± 3.2 | 38.8 ± 4.3 | 23.1 ± 4.9 | 37.7 | 45.4 |
| 1995–2004 | 21.3 ± 7.0 | 25.4 ± 42.4 | 2.6 ± 52.9 | −6.7 ± 46.1 | 15.8 ± 26.4 | 1.6 ± 33.0 | −4.2 ± 28.8 | 13.3 ± 4.3 | 26.4 ± 5.2 | 38.4 ± 5.0 | 35.2 ± 5.0 | 37.5 | ||
| 1976–2004 | 4.2 ± 4.7 | 23.2 ± 19.0 | −15.5 ± 22.8 | −3.5 ± 19.0 | 14.5 ± 11.8 | −9.7 ± 14.2 | −2.2 ± 11.9 | 2.6 ± 2.9 | 34.1 ± 2.9 | 38.7 ± 3.3 | 27.2 ± 3.7 | 37.5 | ||
| Meijiang | 1987–1994 | 27.1 ± 24.9 | 121.2 ± 68.2 | −76.1 ± 60.6 | −18.0 ± 46.3 | 52.0 ± 29.3 | −32.7 ± 26.0 | −7.7 ± 19.9 | 11.6 ± 10.7 | 35.8 ± 7.7 | 35.1 ± 8.8 | 29.0 ± 9.2 | 47.1 | 30.0 |
| 1995–2005 | 77.6 ± 56.5 | 12.1 ± 61.8 | 44.5 ± 11.7 | 21.0 ± 25.6 | 5.2 ± 26.5 | 19.1 ± 5.0 | 9.0 ± 11.0 | 33.3 ± 24.2 | 53.0 ± 6.3 | 18.9 ± 4.6 | 28.1 ± 6.7 | 69.2 | ||
| 1987–2005 | 56.3 ± 34.1 | 58.0 ± 46.4 | −6.3 ± 29.0 | 4.6 ± 24.1 | 24.9 ± 19.9 | −2.7 ± 12.5 | 2.0 ± 10.4 | 24.2 ± 14.6 | 45.8 ± 5.2 | 25.7 ± 4.8 | 28.5 ± 5.3 | 59.9 |
© 2018 by the authors. Licensee MDPI, Basel, Switzerland. This article is an open access article distributed under the terms and conditions of the Creative Commons Attribution (CC BY) license (http://creativecommons.org/licenses/by/4.0/).
Share and Cite
Hou, Y.; Zhang, M.; Meng, Z.; Liu, S.; Sun, P.; Yang, T. Assessing the Impact of Forest Change and Climate Variability on Dry Season Runoff by an Improved Single Watershed Approach: A Comparative Study in Two Large Watersheds, China. Forests 2018, 9, 46. https://doi.org/10.3390/f9010046
Hou Y, Zhang M, Meng Z, Liu S, Sun P, Yang T. Assessing the Impact of Forest Change and Climate Variability on Dry Season Runoff by an Improved Single Watershed Approach: A Comparative Study in Two Large Watersheds, China. Forests. 2018; 9(1):46. https://doi.org/10.3390/f9010046
Chicago/Turabian StyleHou, Yiping, Mingfang Zhang, Zuozhu Meng, Shirong Liu, Pengsen Sun, and Taoli Yang. 2018. "Assessing the Impact of Forest Change and Climate Variability on Dry Season Runoff by an Improved Single Watershed Approach: A Comparative Study in Two Large Watersheds, China" Forests 9, no. 1: 46. https://doi.org/10.3390/f9010046