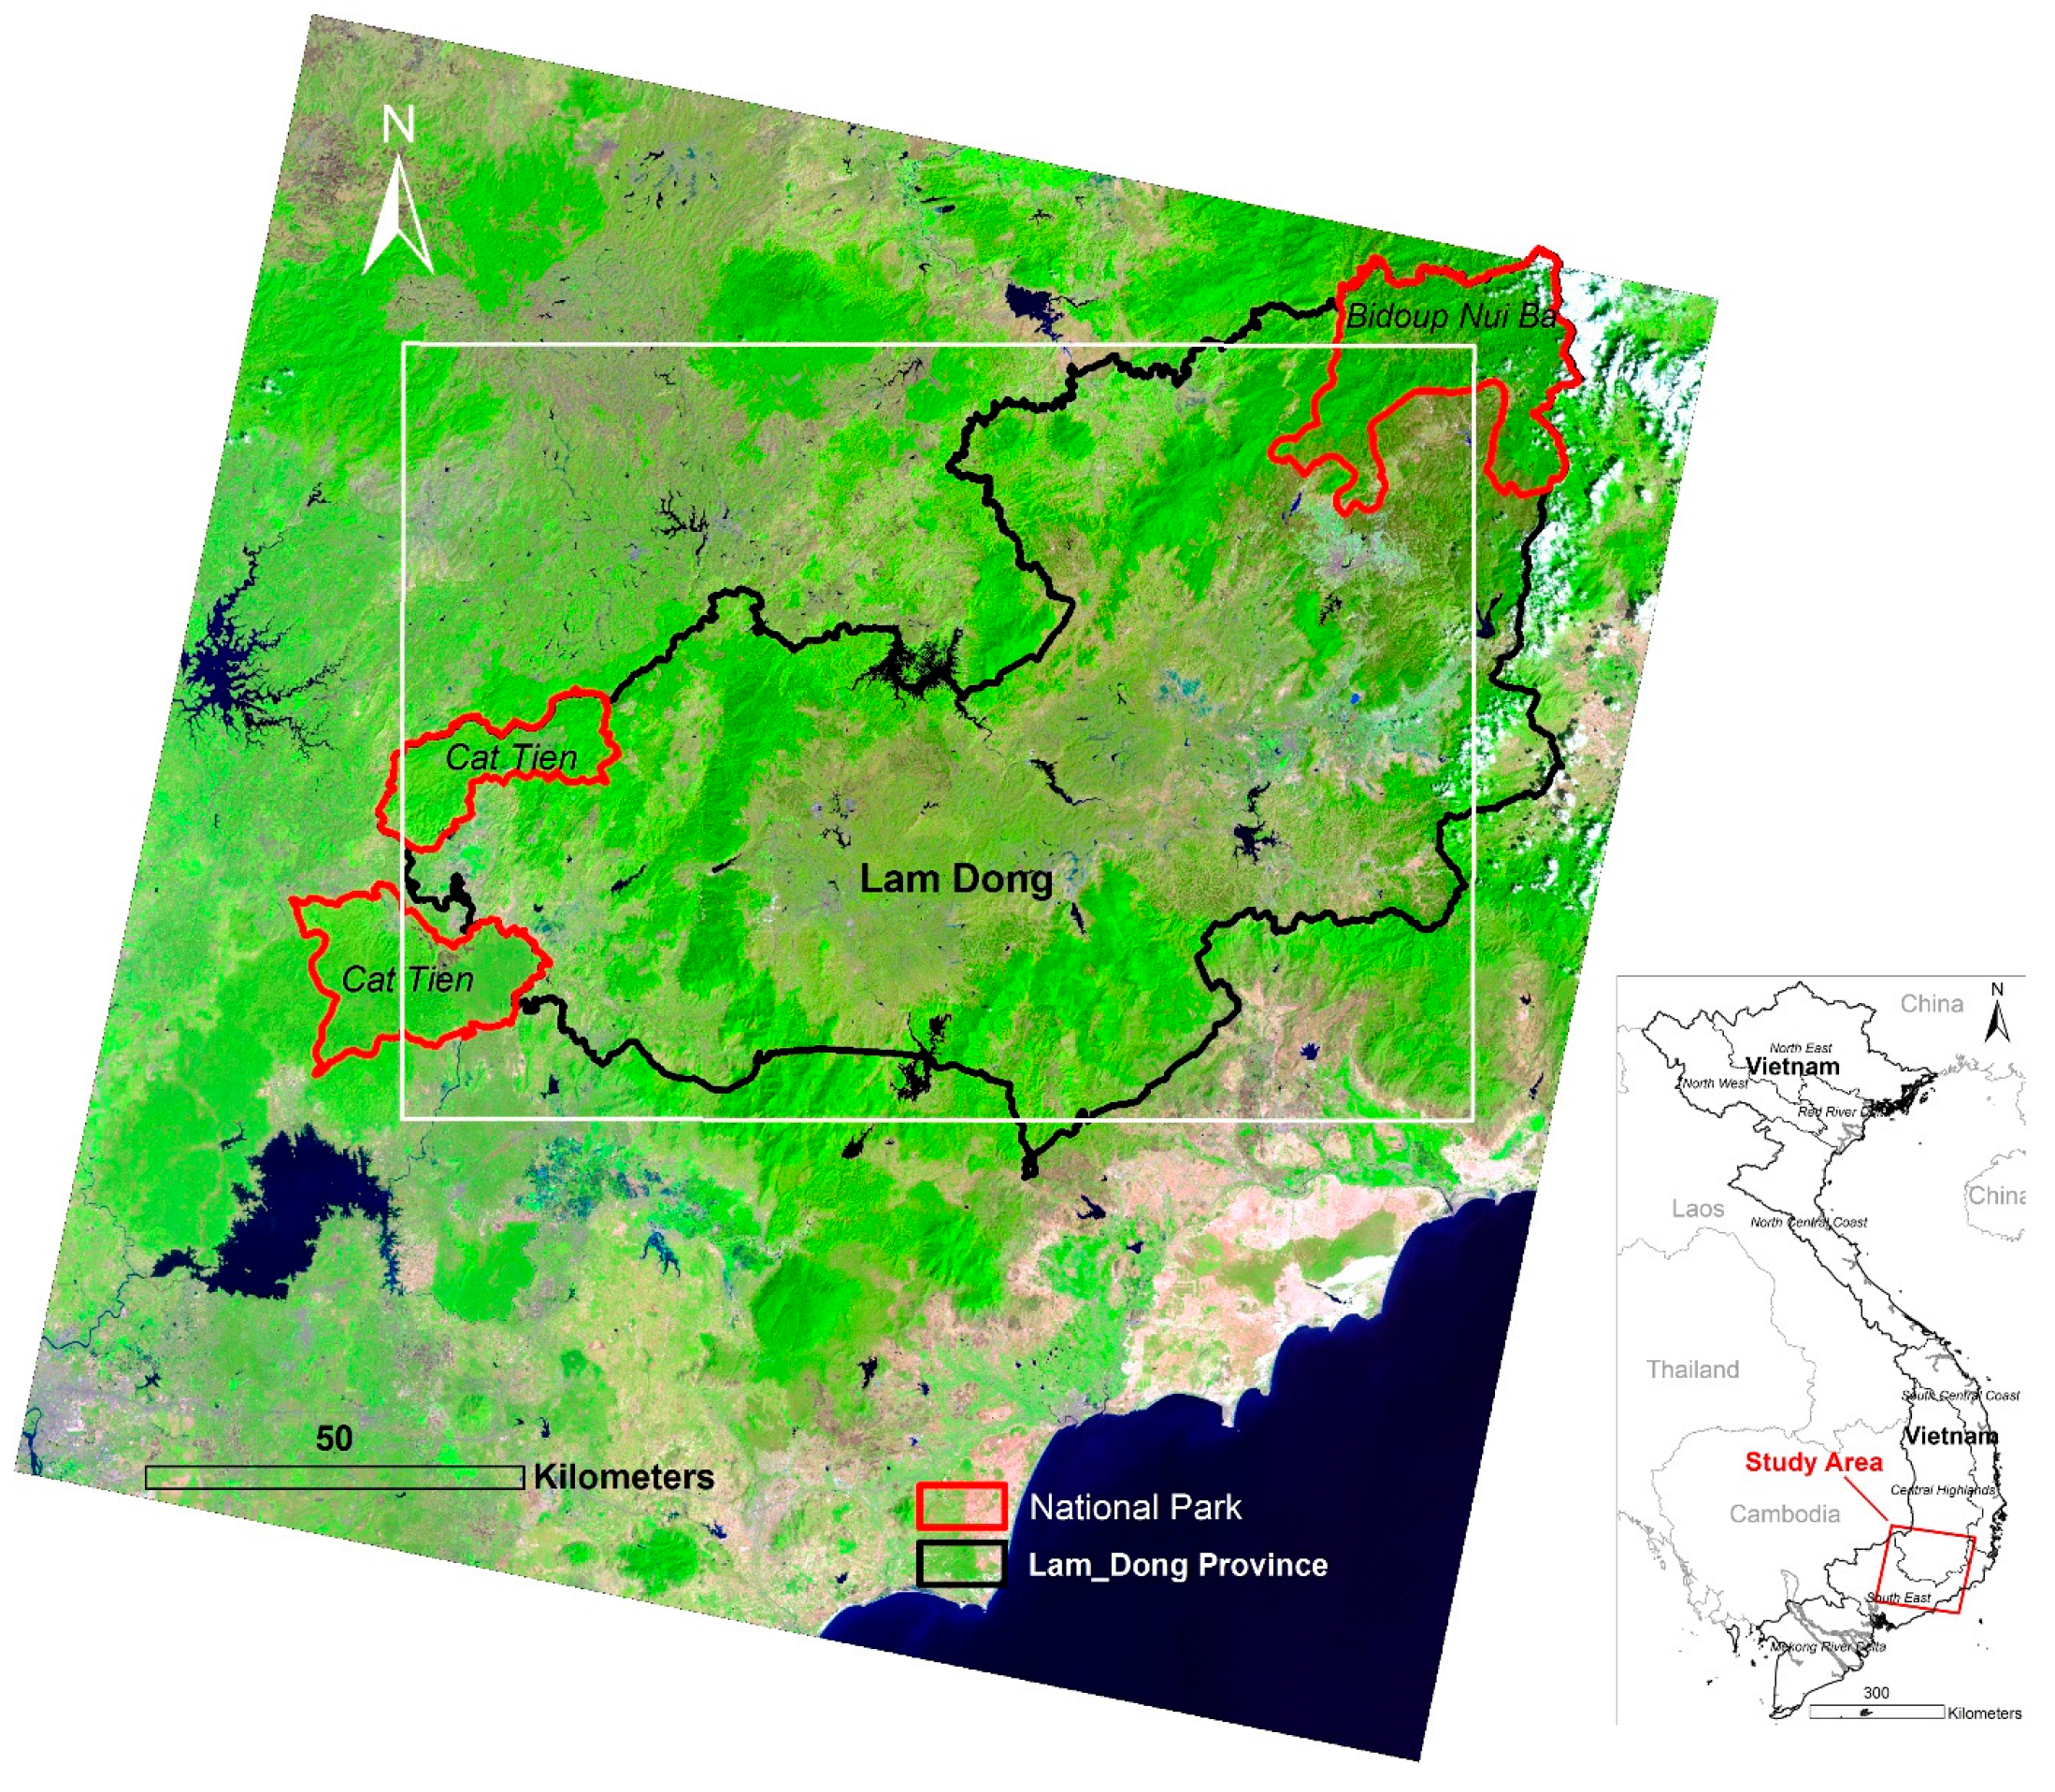
Figure 1.
Boundary of Lam Dong Province superimposed on Landsat imagery. The boundary locations of two national parks within the region are also shown on the image in red. The white box indicates the area shown for many of the following figures. This image, as well as the following “green” images, were produced using a red green blue (RGB) composite of Landsat’s shortwave infrared 1, red, and green bands in the order of red, green and blue.
Figure 2.
Location of a few key features of interest in the study region.
Figure 2.
Location of a few key features of interest in the study region.
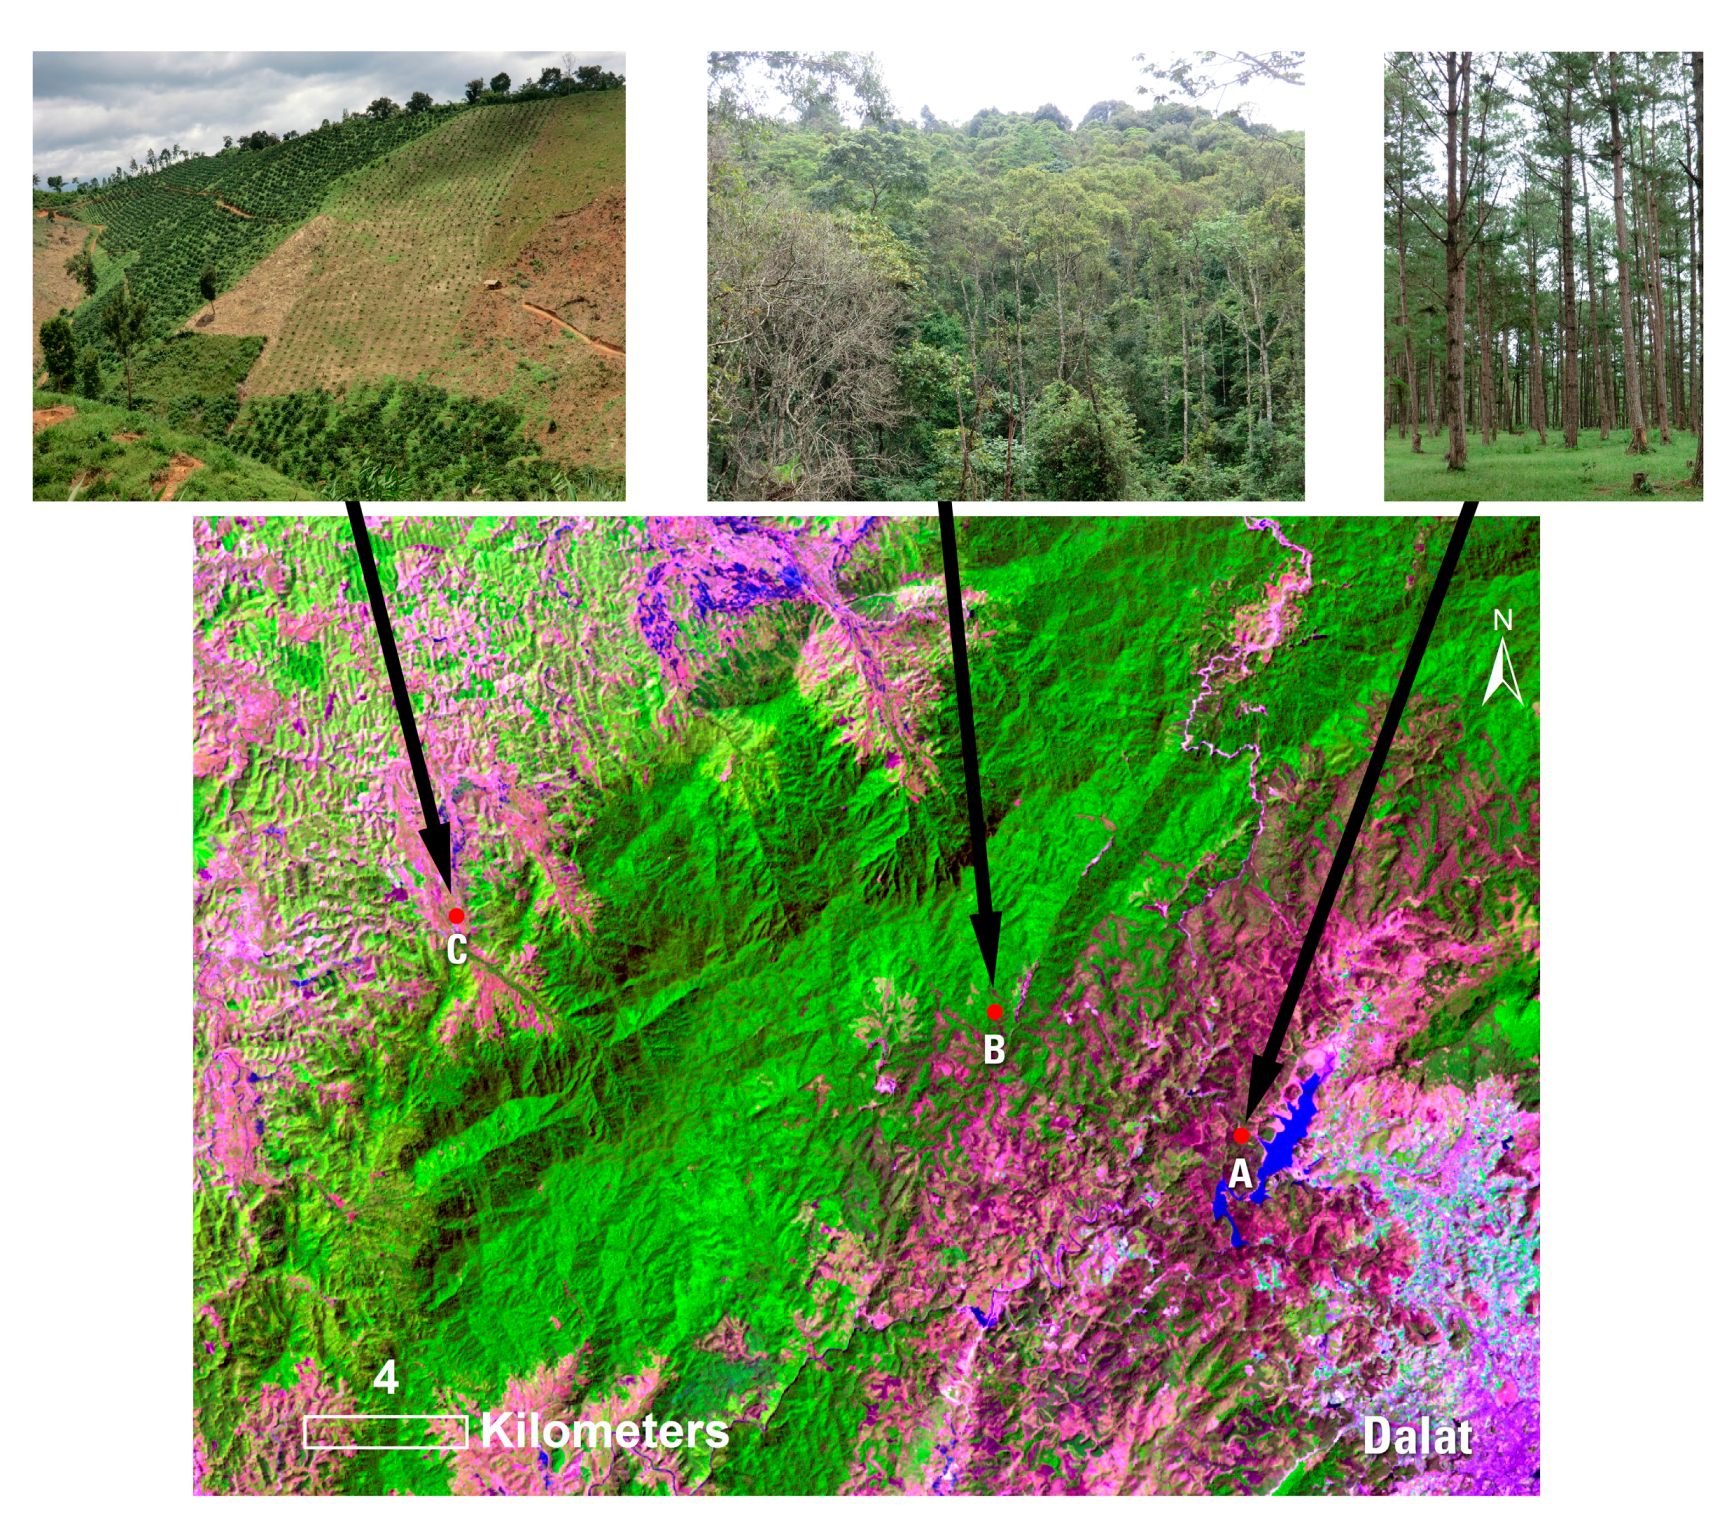
Figure 3.
Field photos showing several representative land cover types in study area, and their location on Landsat imagery. A = Conifer (pine) forest; B = Mature broadleaf forest; C = Coffee plantation.
Figure 3.
Field photos showing several representative land cover types in study area, and their location on Landsat imagery. A = Conifer (pine) forest; B = Mature broadleaf forest; C = Coffee plantation.
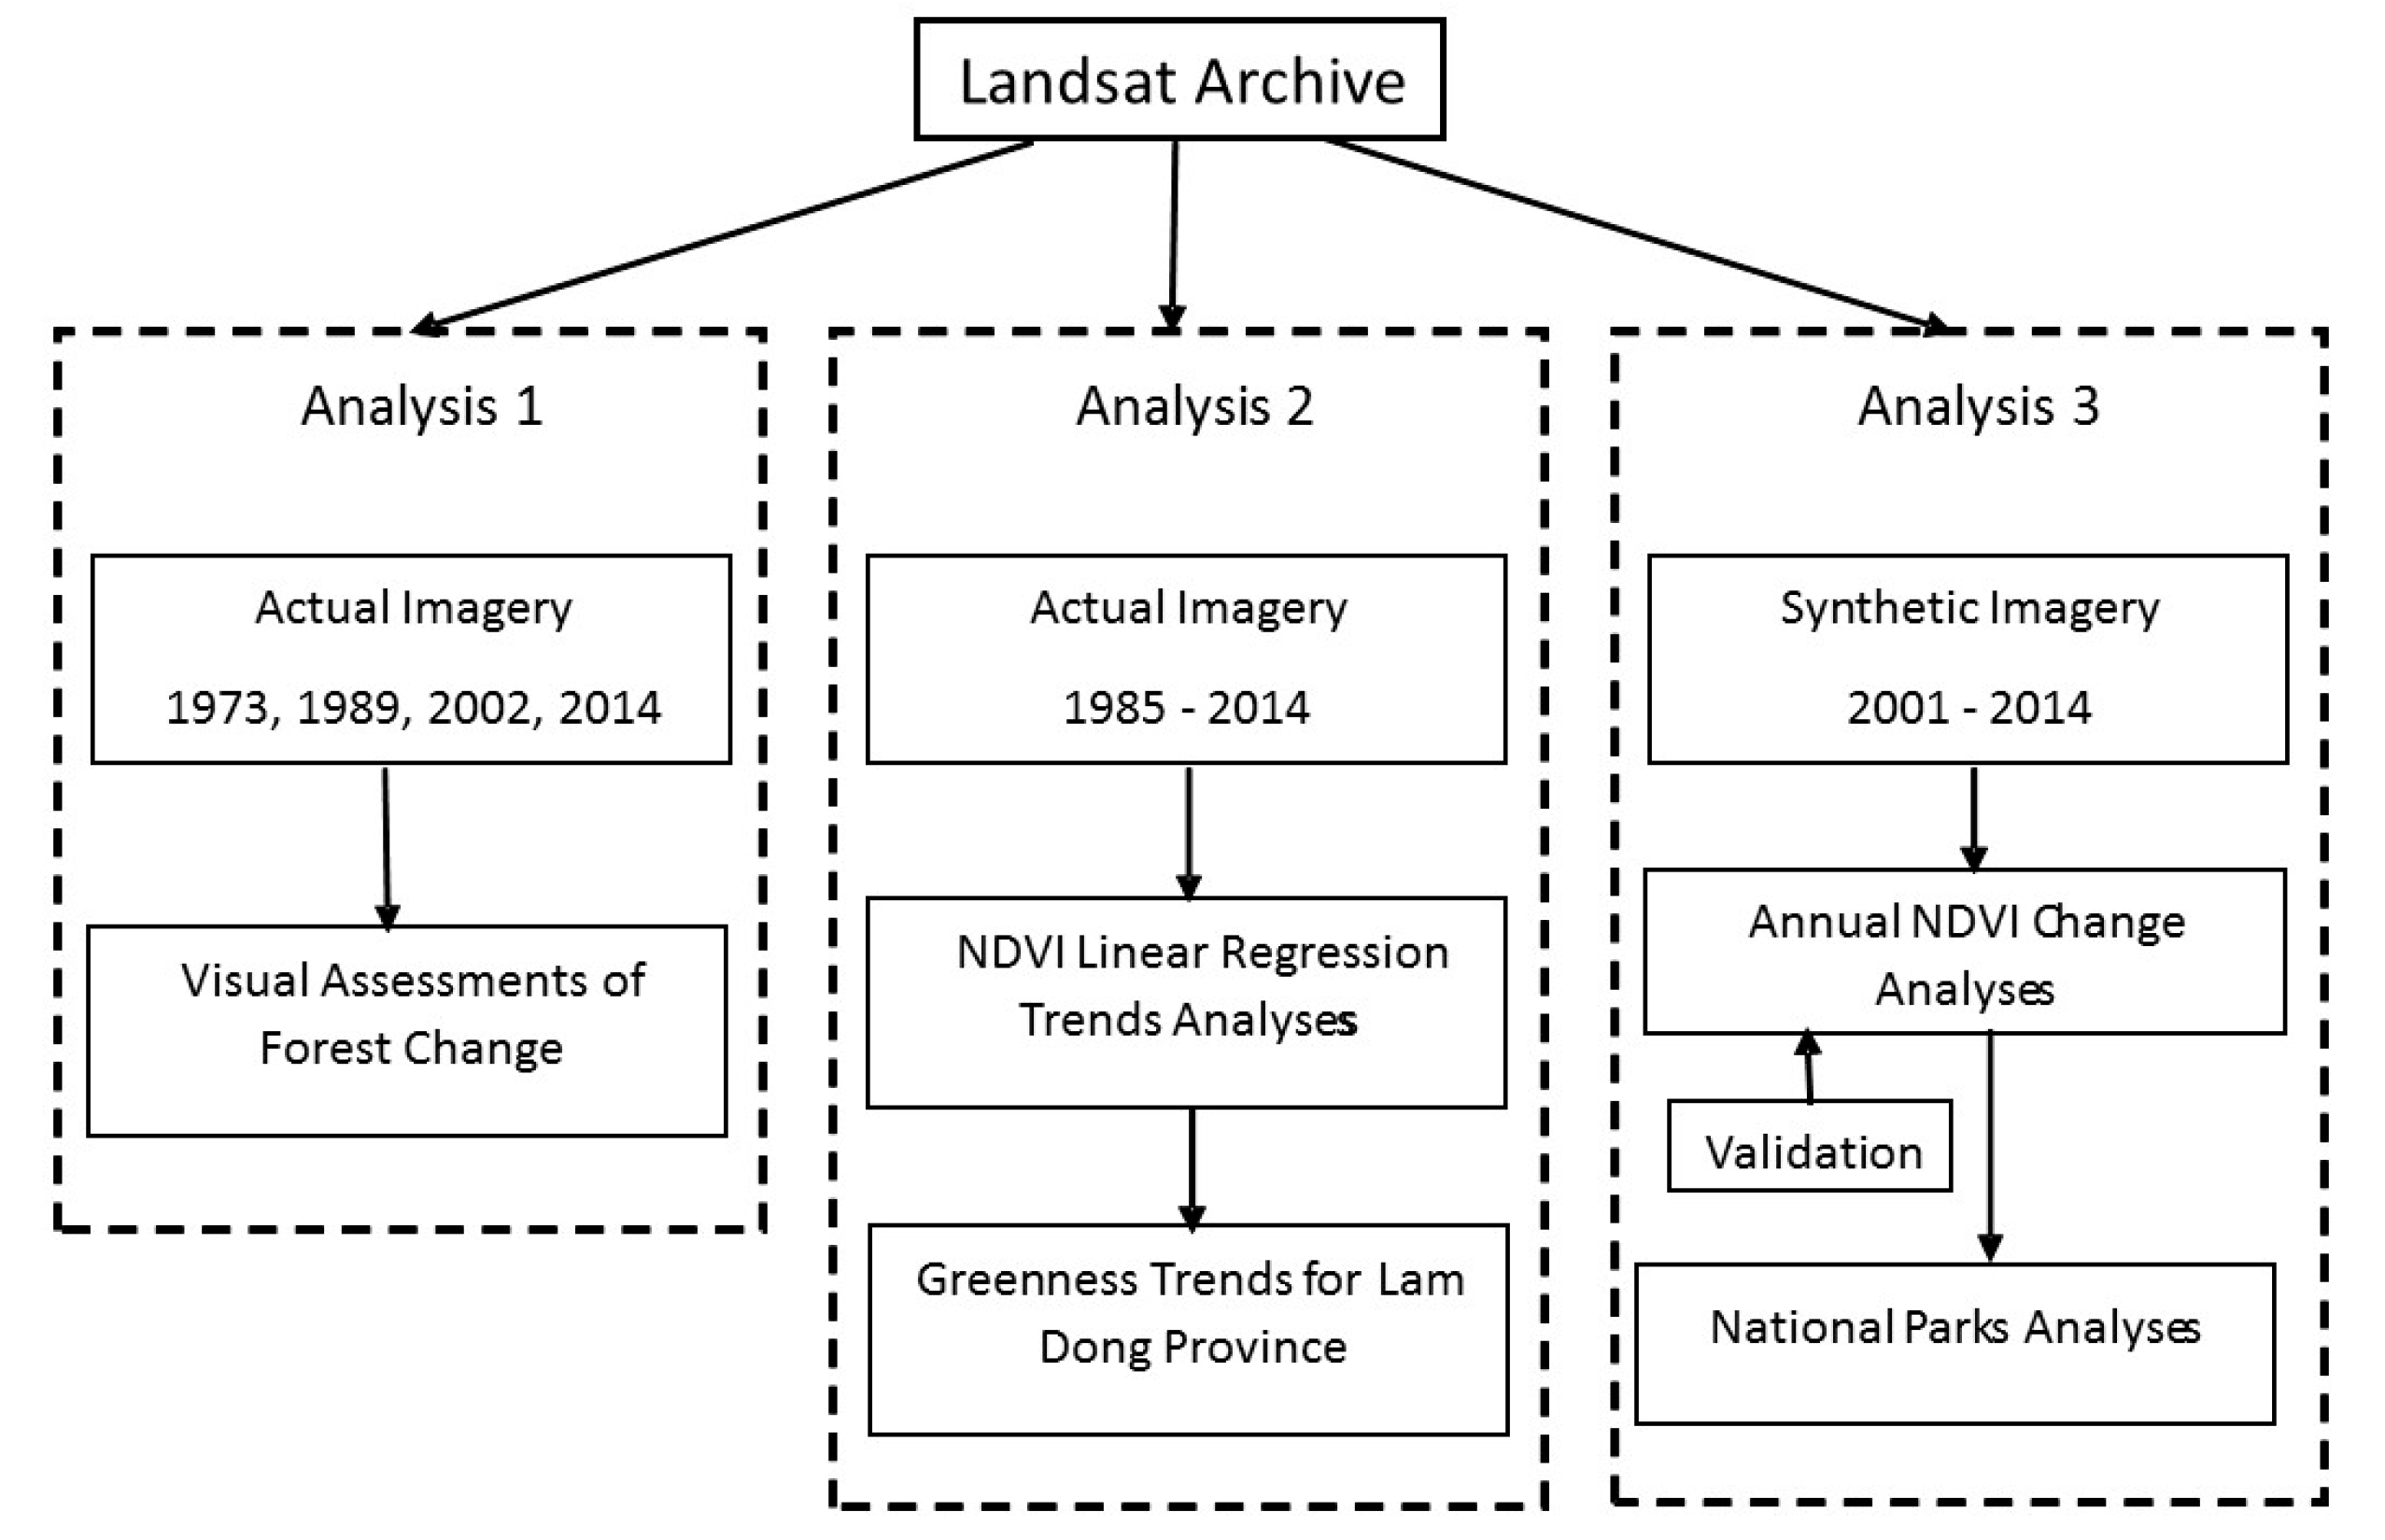
Figure 4.
Flow chart summarizing the major steps taken during the investigation. NDVI: Normalized Difference Vegetation Index.
Figure 4.
Flow chart summarizing the major steps taken during the investigation. NDVI: Normalized Difference Vegetation Index.
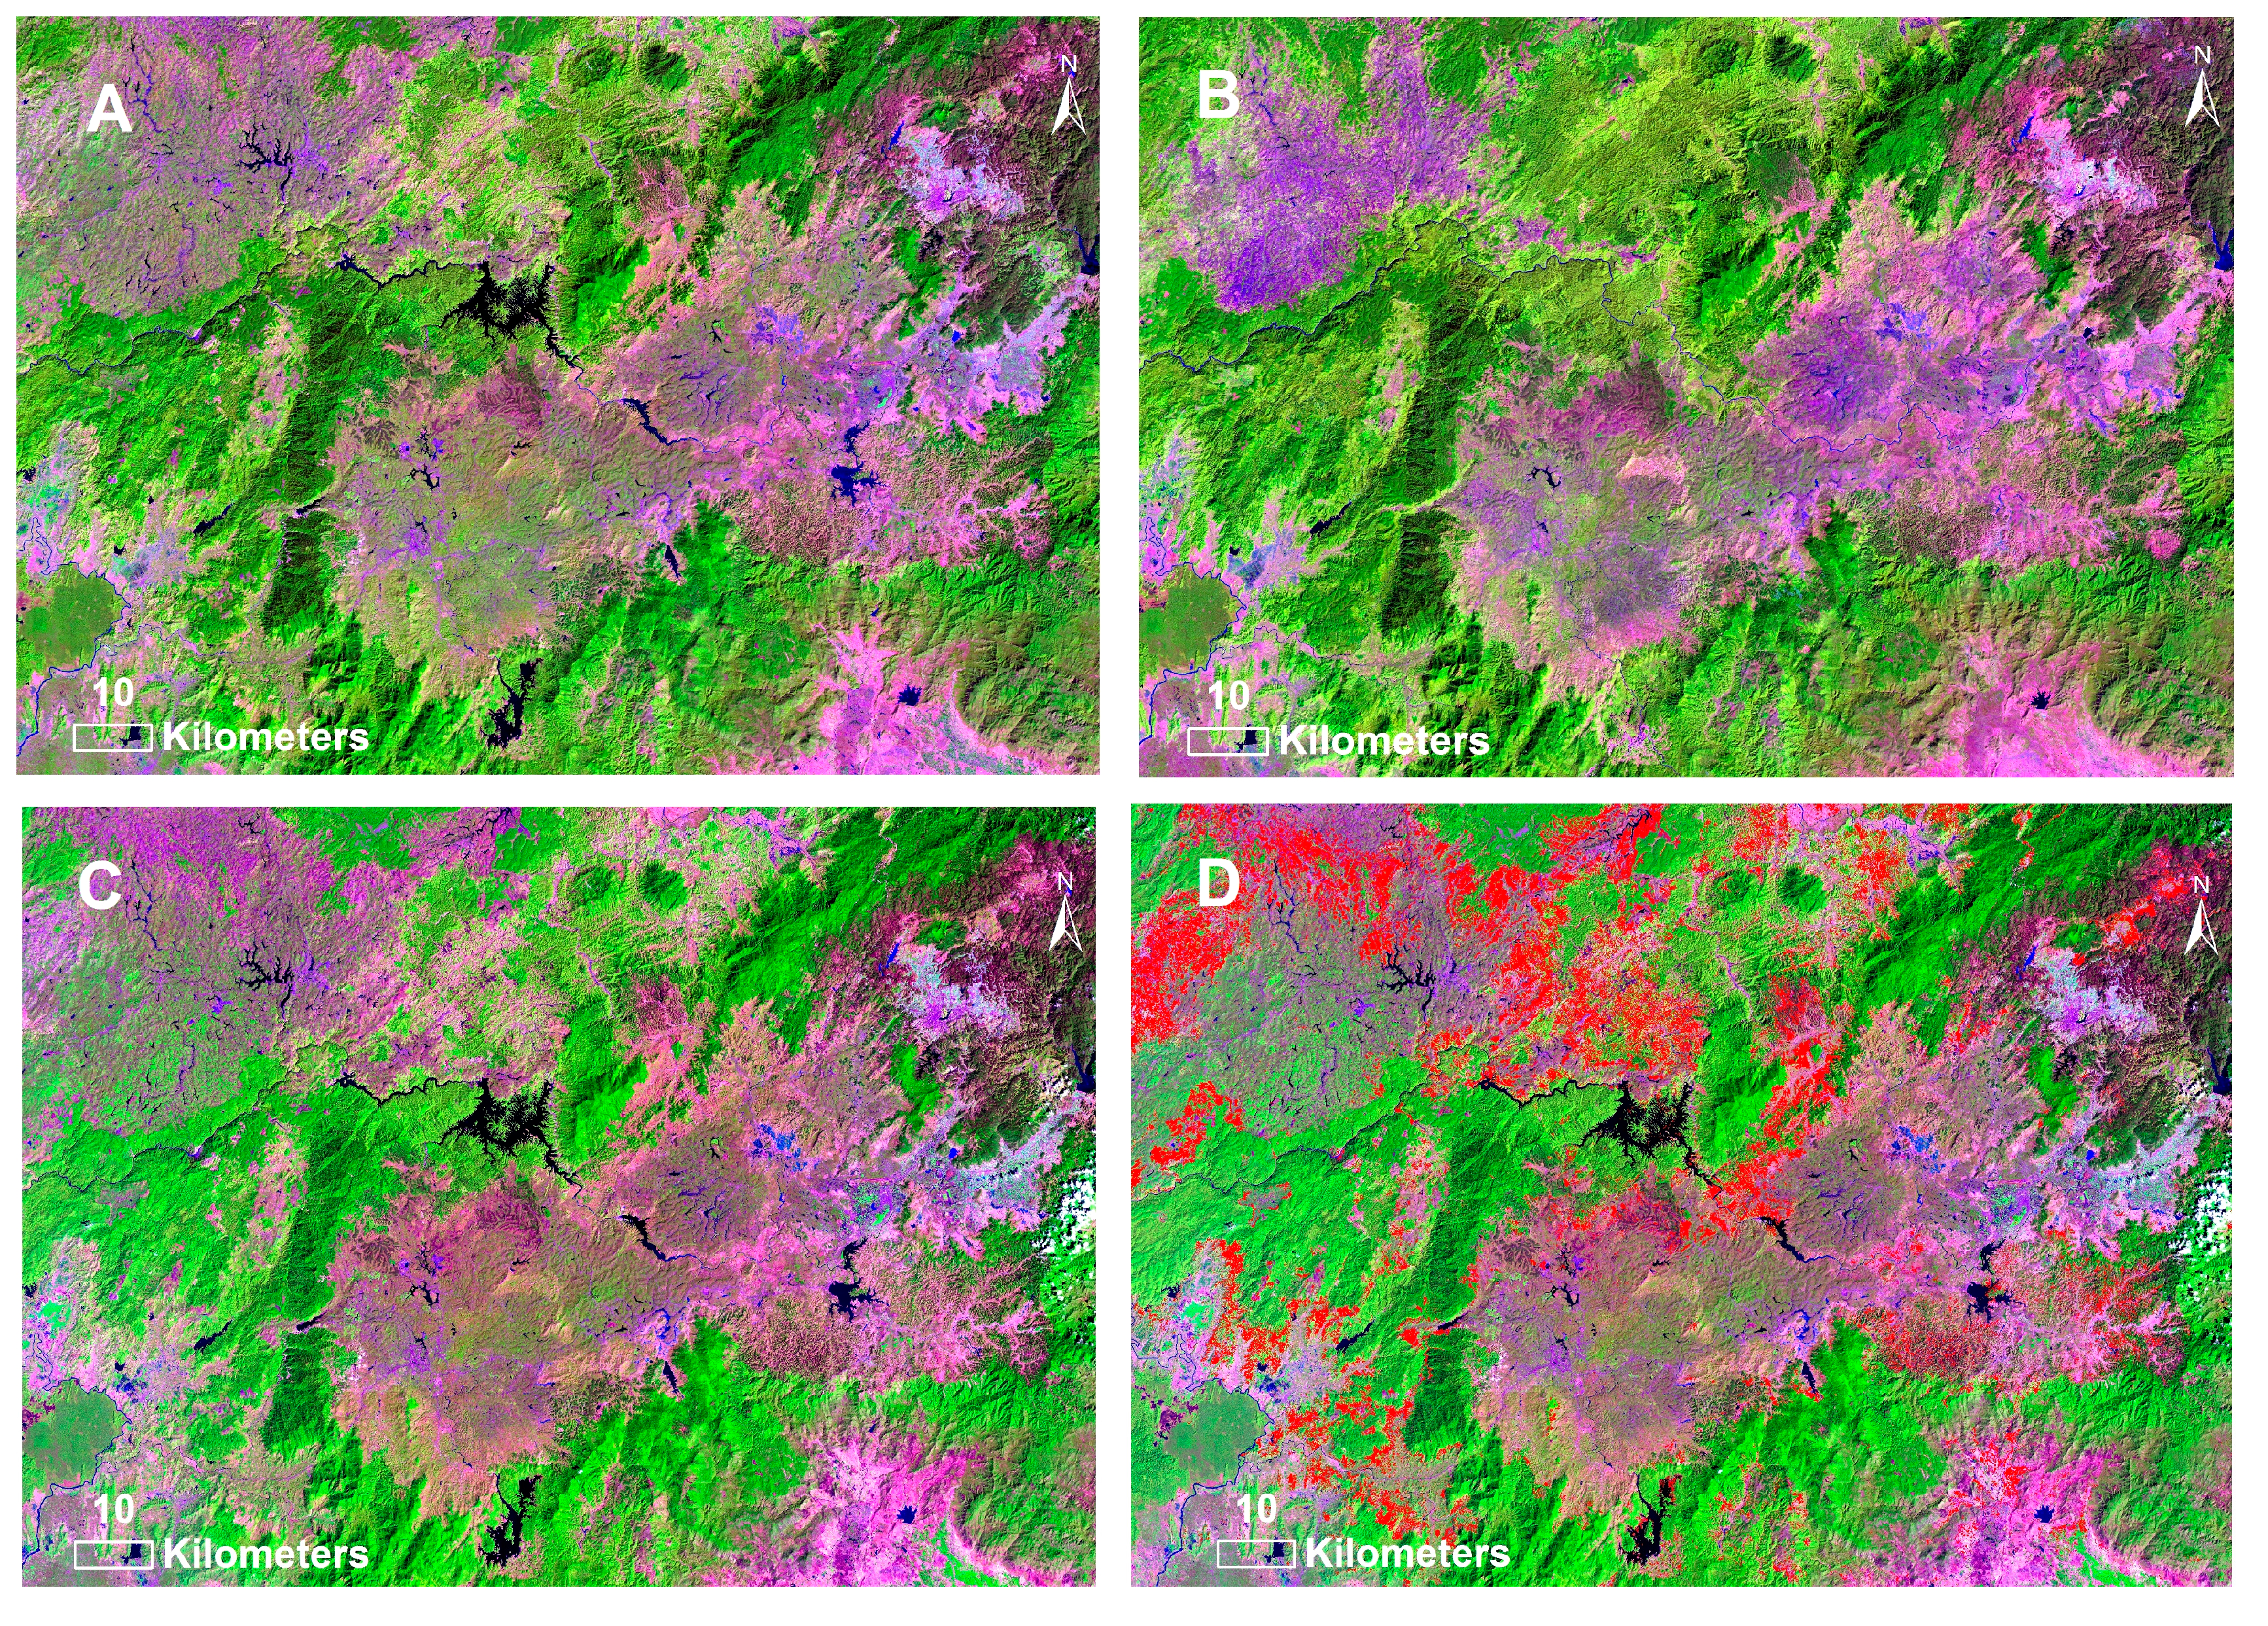
Figure 5.
Landsat imagery showing a portion of Lam Dong Province (same area as shown in
Figure 2). (
A) = Synthetic image, January 2014; (
B) = Synthetic image, January 2000; (
C) = Actual image, 15 February 2014; (
D) = Global forest change product showing forest loss from 2000 through 2014 in red [
35] overlain onto 15 February 2014 image.
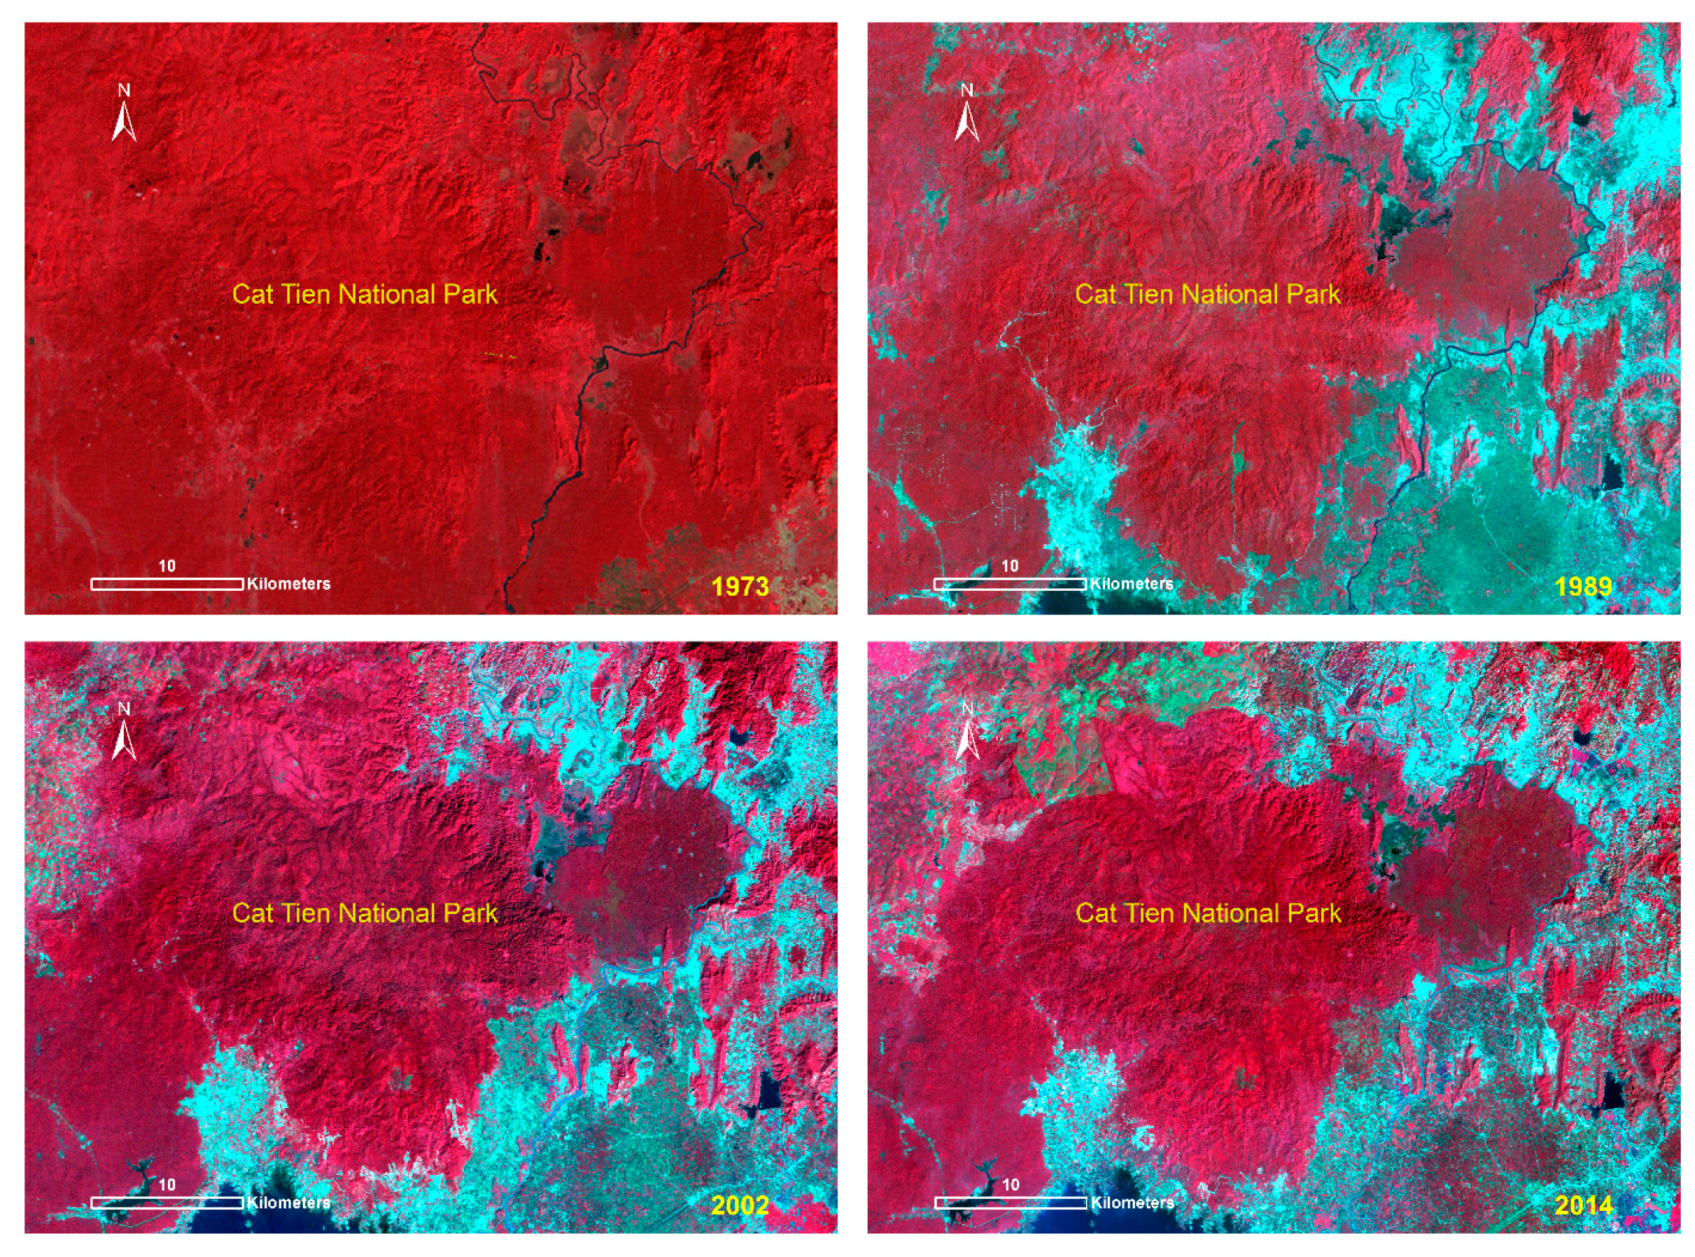
Figure 6.
Landsat false color composites from different epochs. All images were produced using near-infrared, red, and green bands in the order of red, green, and blue. The 1973 image is from Landsat 1 Multispectral Scanner System (bands 4-2-1), 1989 imagery is from Landsat 5 (bands 4-3-2), 2002 imagery is from Landsat 7 (bands 4-3-2), and the 2014 image is from Landsat 8 (bands 5-4-3).
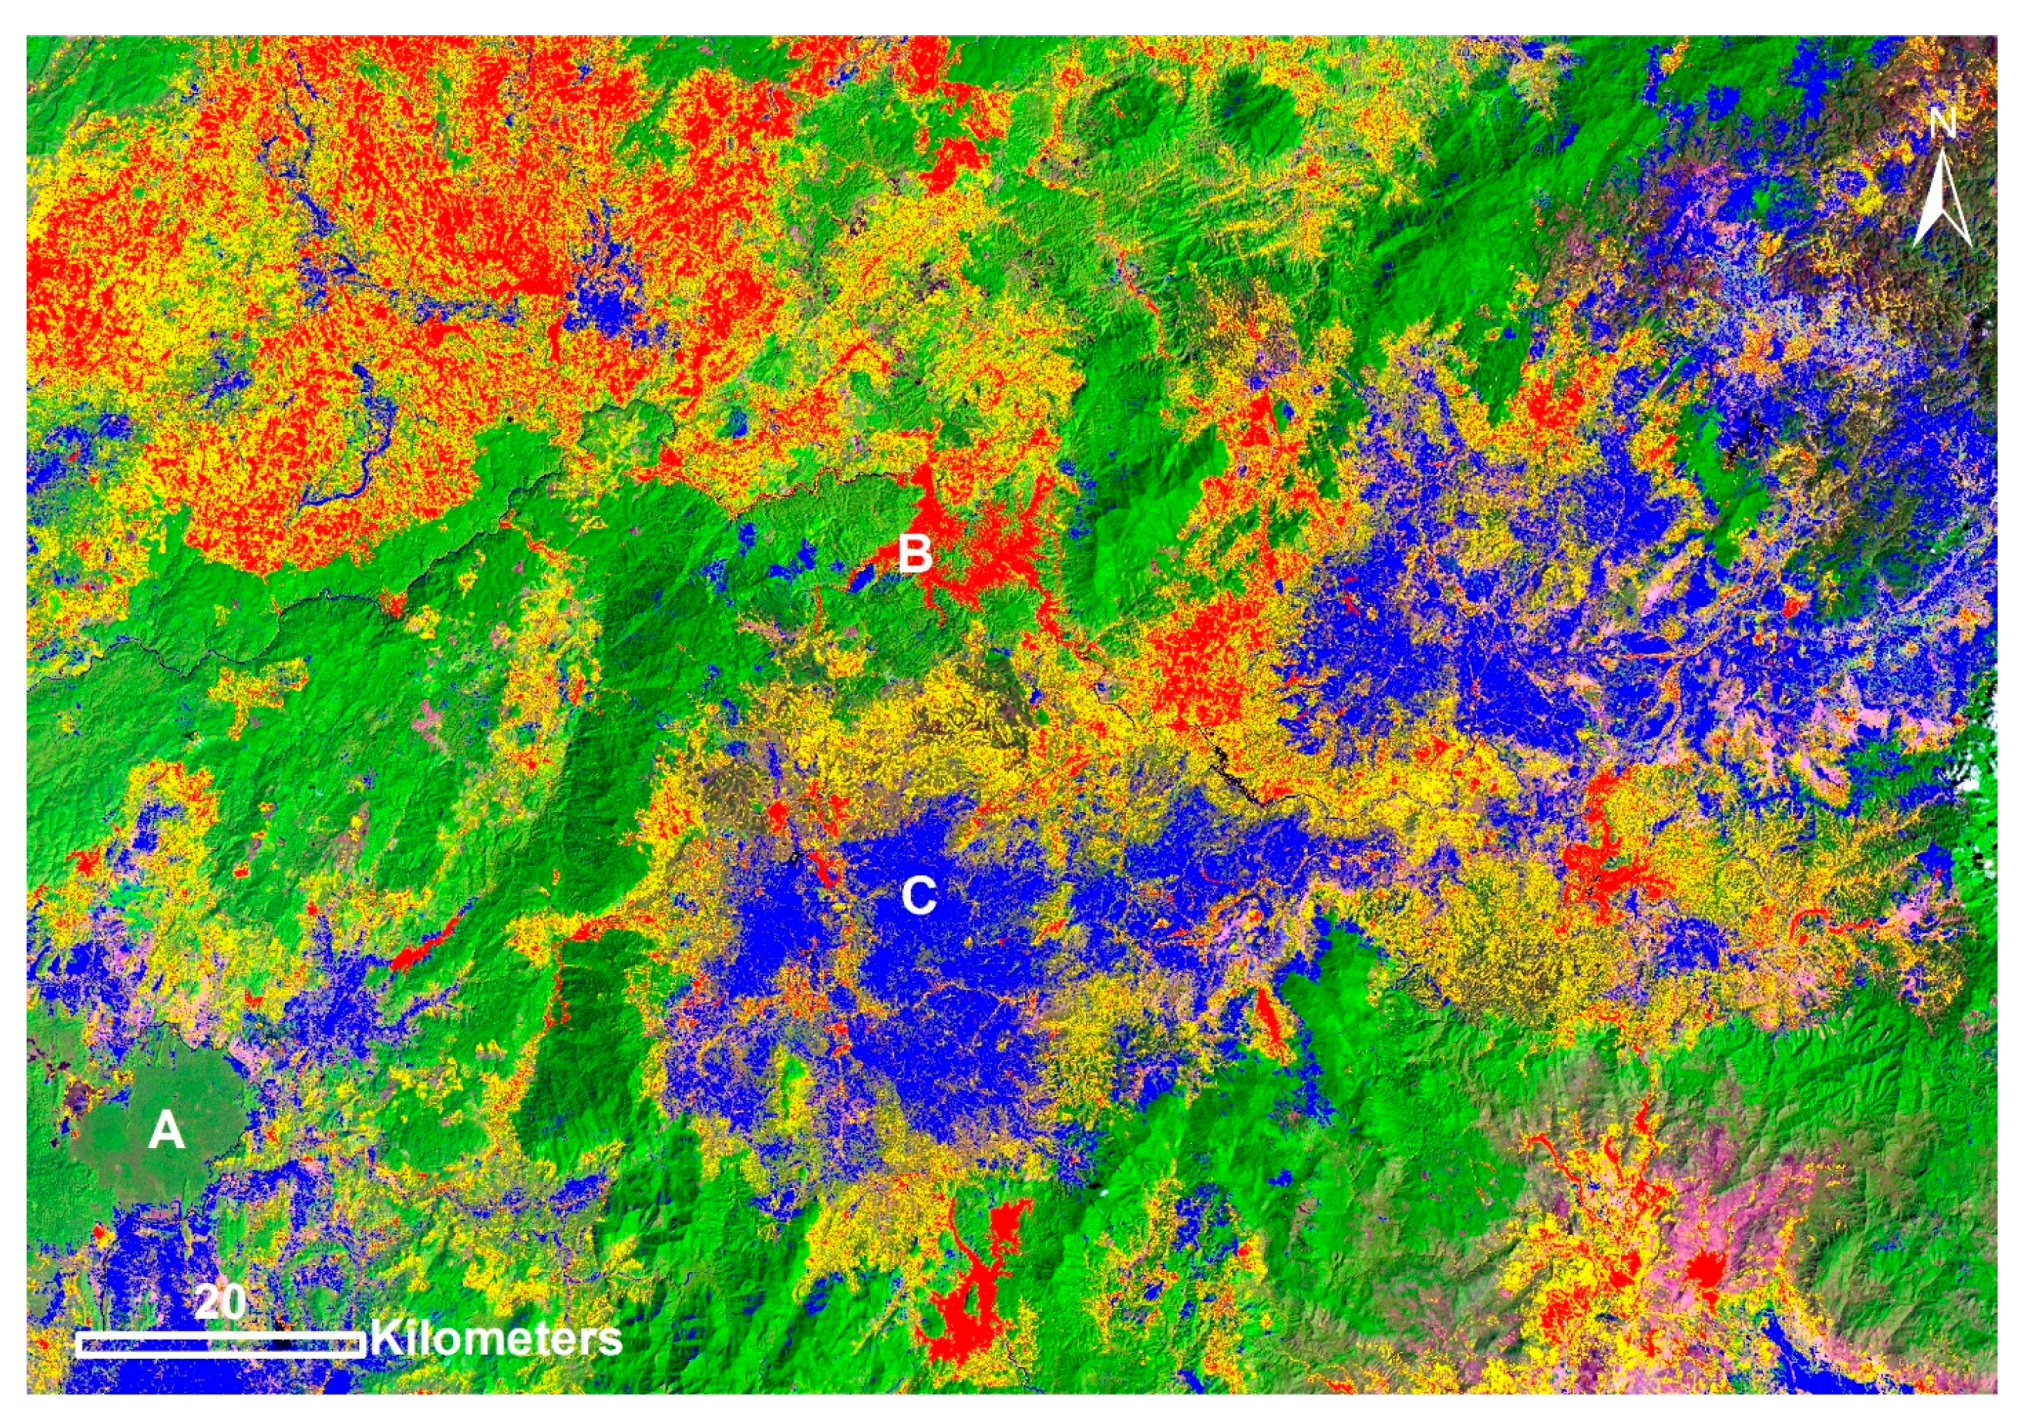
Figure 7.
Normalized Difference Vegetation Index (NDVI) trend image based on regression analysis generated using 1985–2014 time series data. Red indicates where NDVI shows major decrease in greenness, whereas yellow shows moderate decrease in greenness. Blue indicates where greenness increased. A = Mature forest (no increases or decreases in NDVI) associated with Cat Tien National Park. B = Area transformed from forest to reservoir. C = Area of greening related to agroforestry.
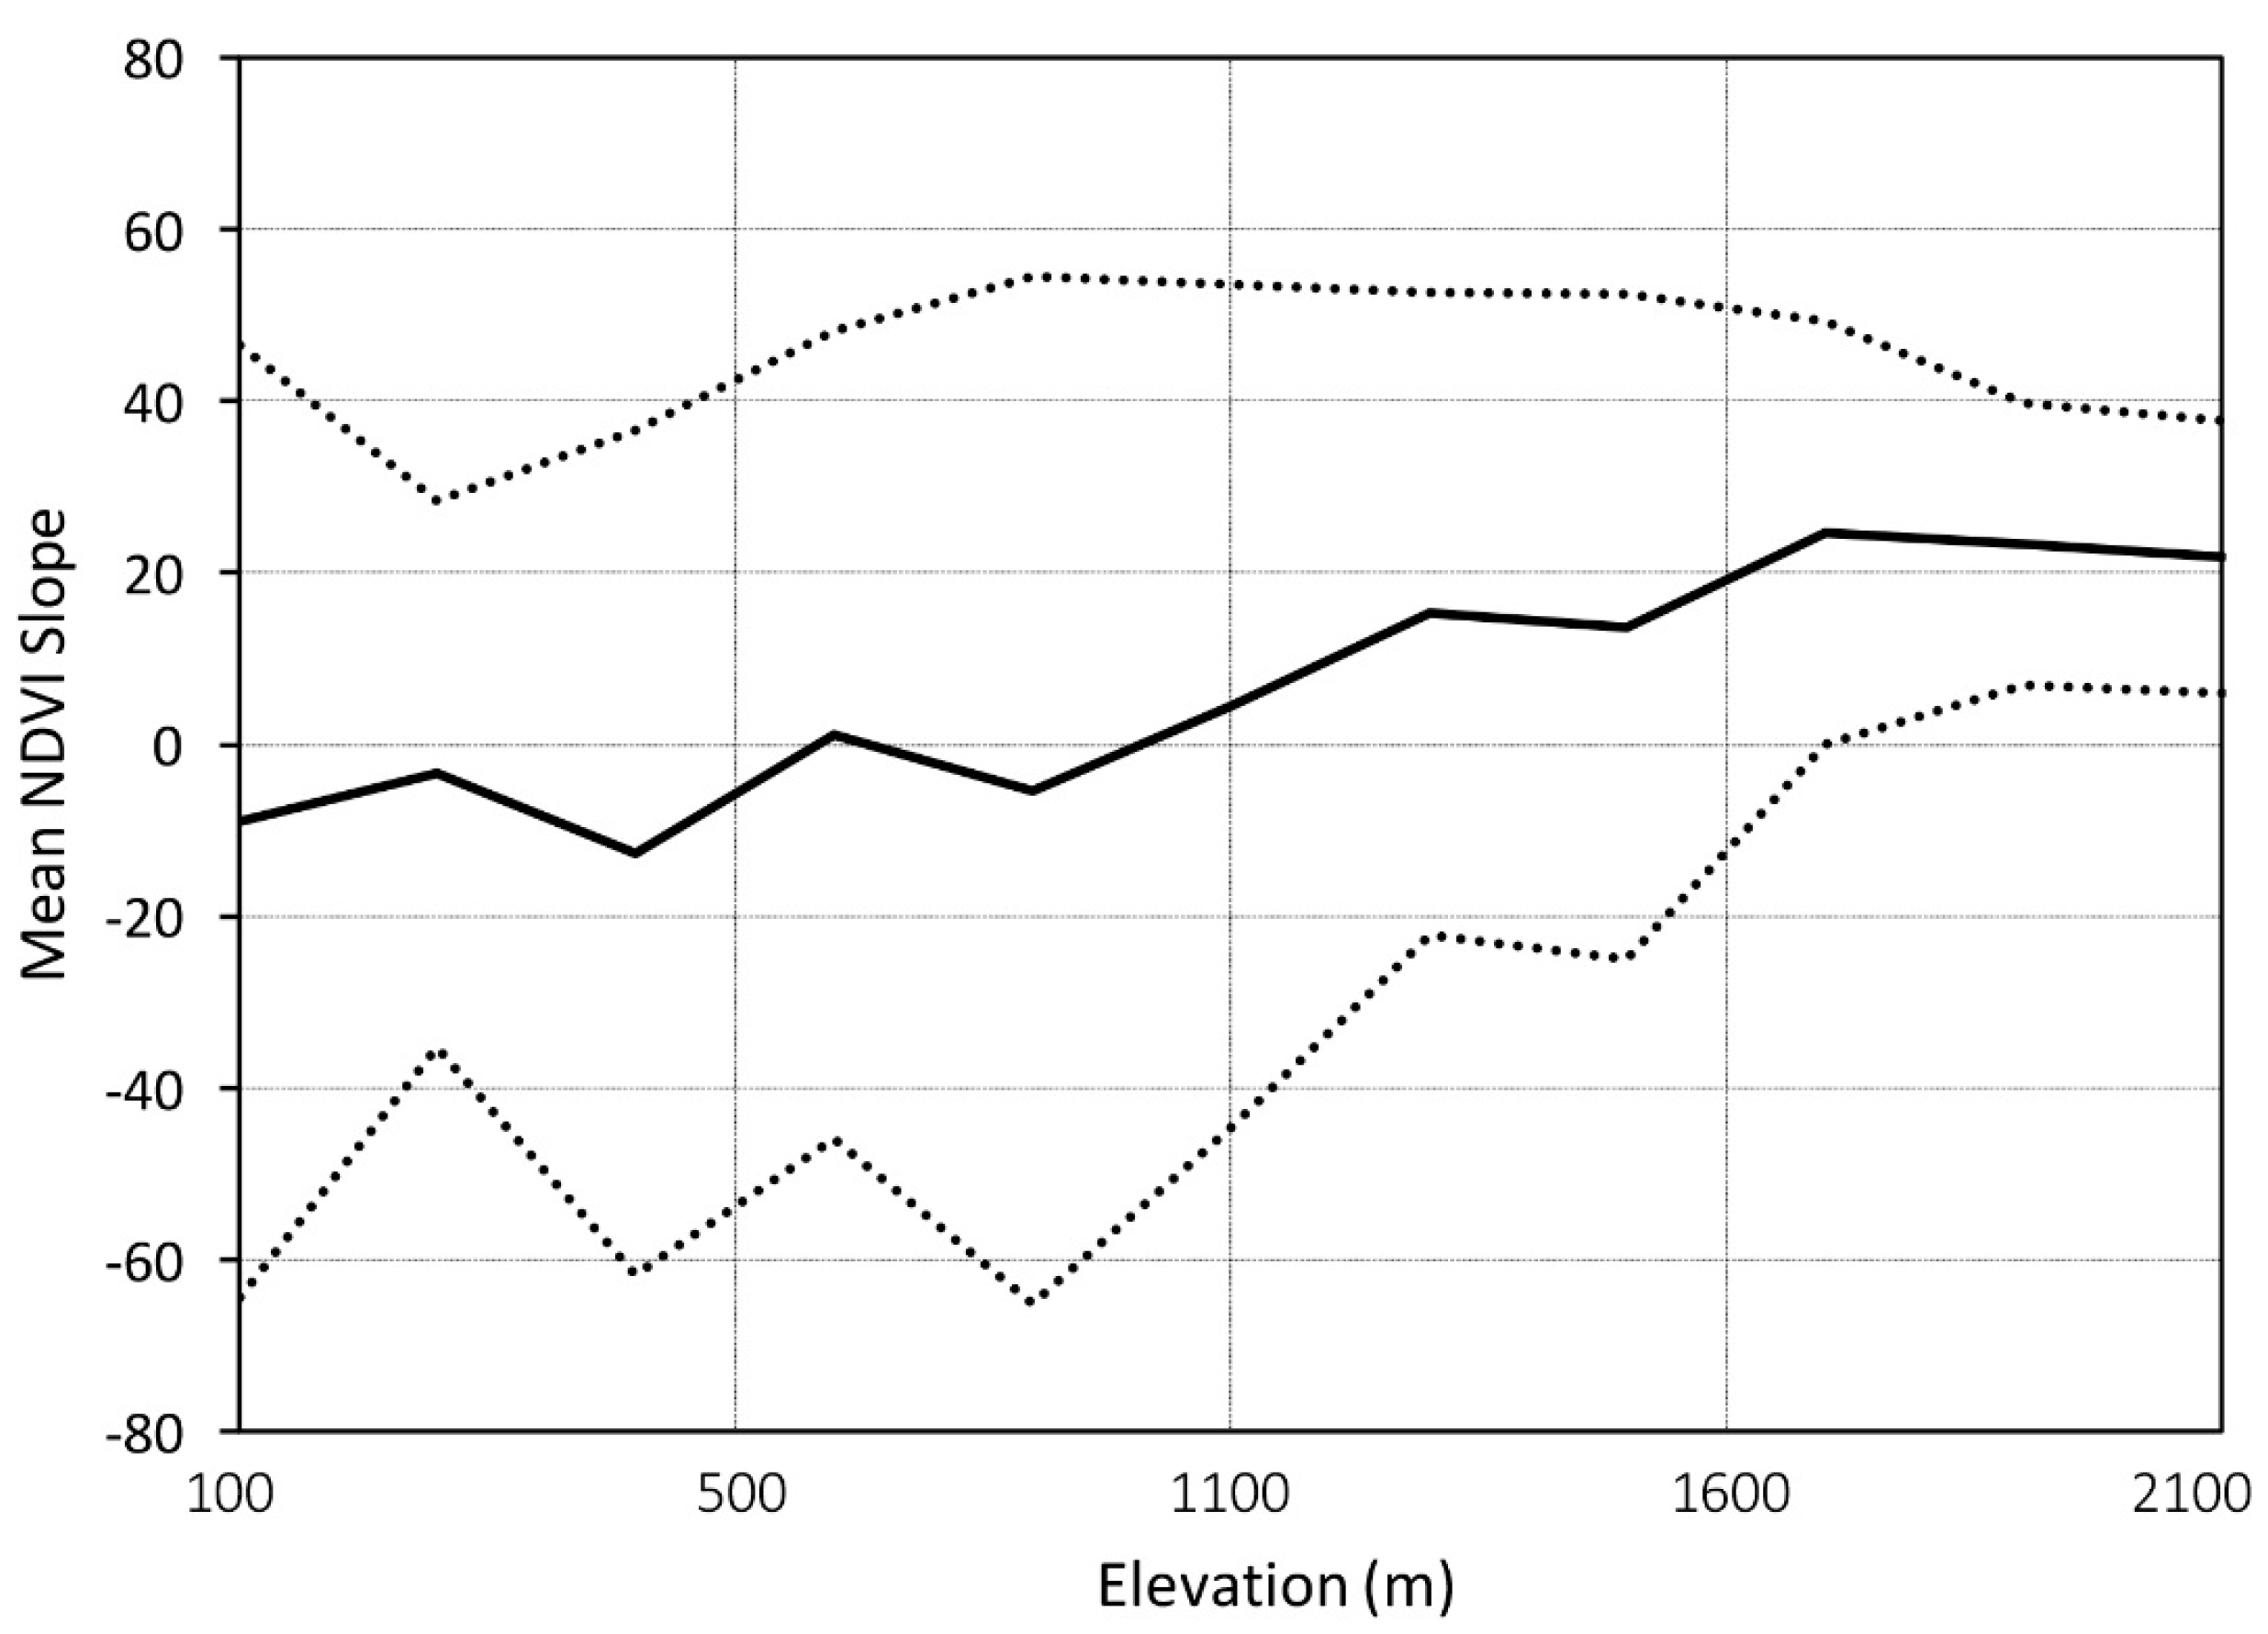
Figure 8.
Mean Normalized Difference Vegetation Index (NDVI) slope (plus and minus one standard deviation) versus elevation. Mean NDVI slope values were calculated for each of 11 elevation classes (0–200 m, 201–400 m, etc.), with the exception of a small percentage of pixels in the northern and western portion of the Lam Dong Province where imagery was lacking to conduct the regression analysis, all pixels in the province were used. NDVI slope values are ×10,000 per annum.
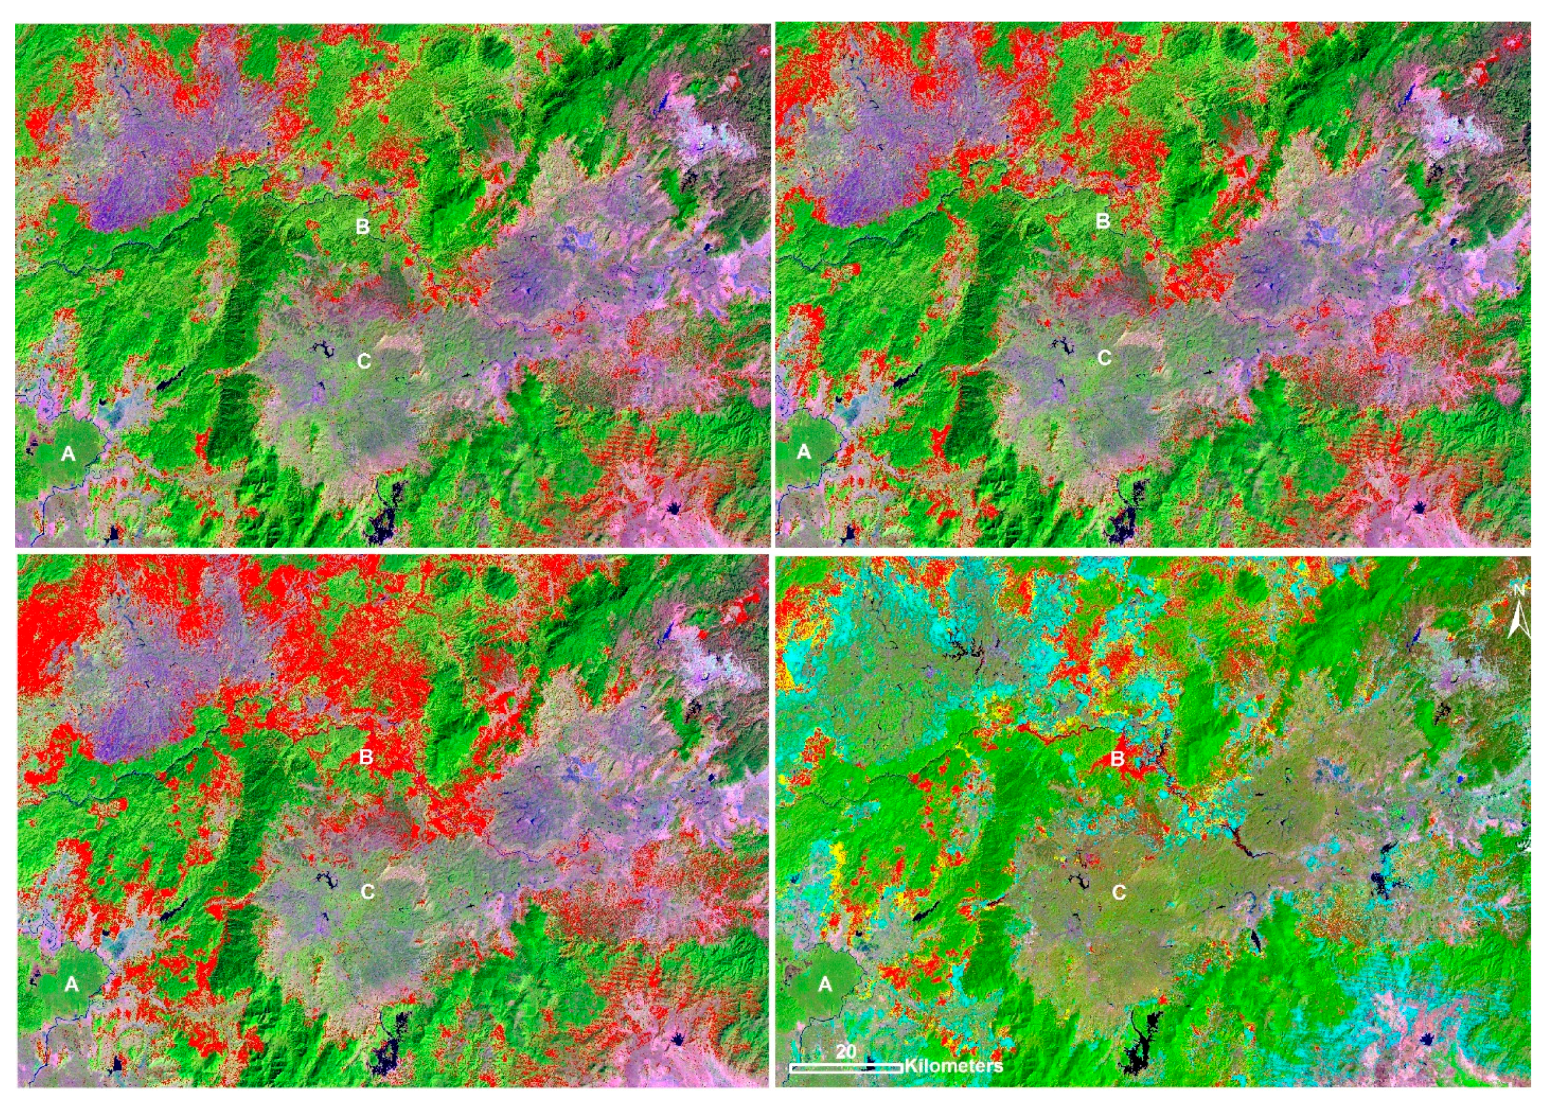
Figure 9.
Images depicting forest degradation occurring over different time periods. Upper left image = Degradation changes from 2001 to 2006 (in red); Upper right image = Degradation changes from 2001 to 2010 (in red); Lower left image = Degradation changes from 2001 to 2014 (in red); Lower right image = Degradation changes by epoch, with turquoise representing changes from 2001 to 2006, yellow representing changes from 2006 to 2010, and red being changes occurring from 2010 to 2014. Areas denoted by letters A, B and C are described in the
Figure 7 caption.
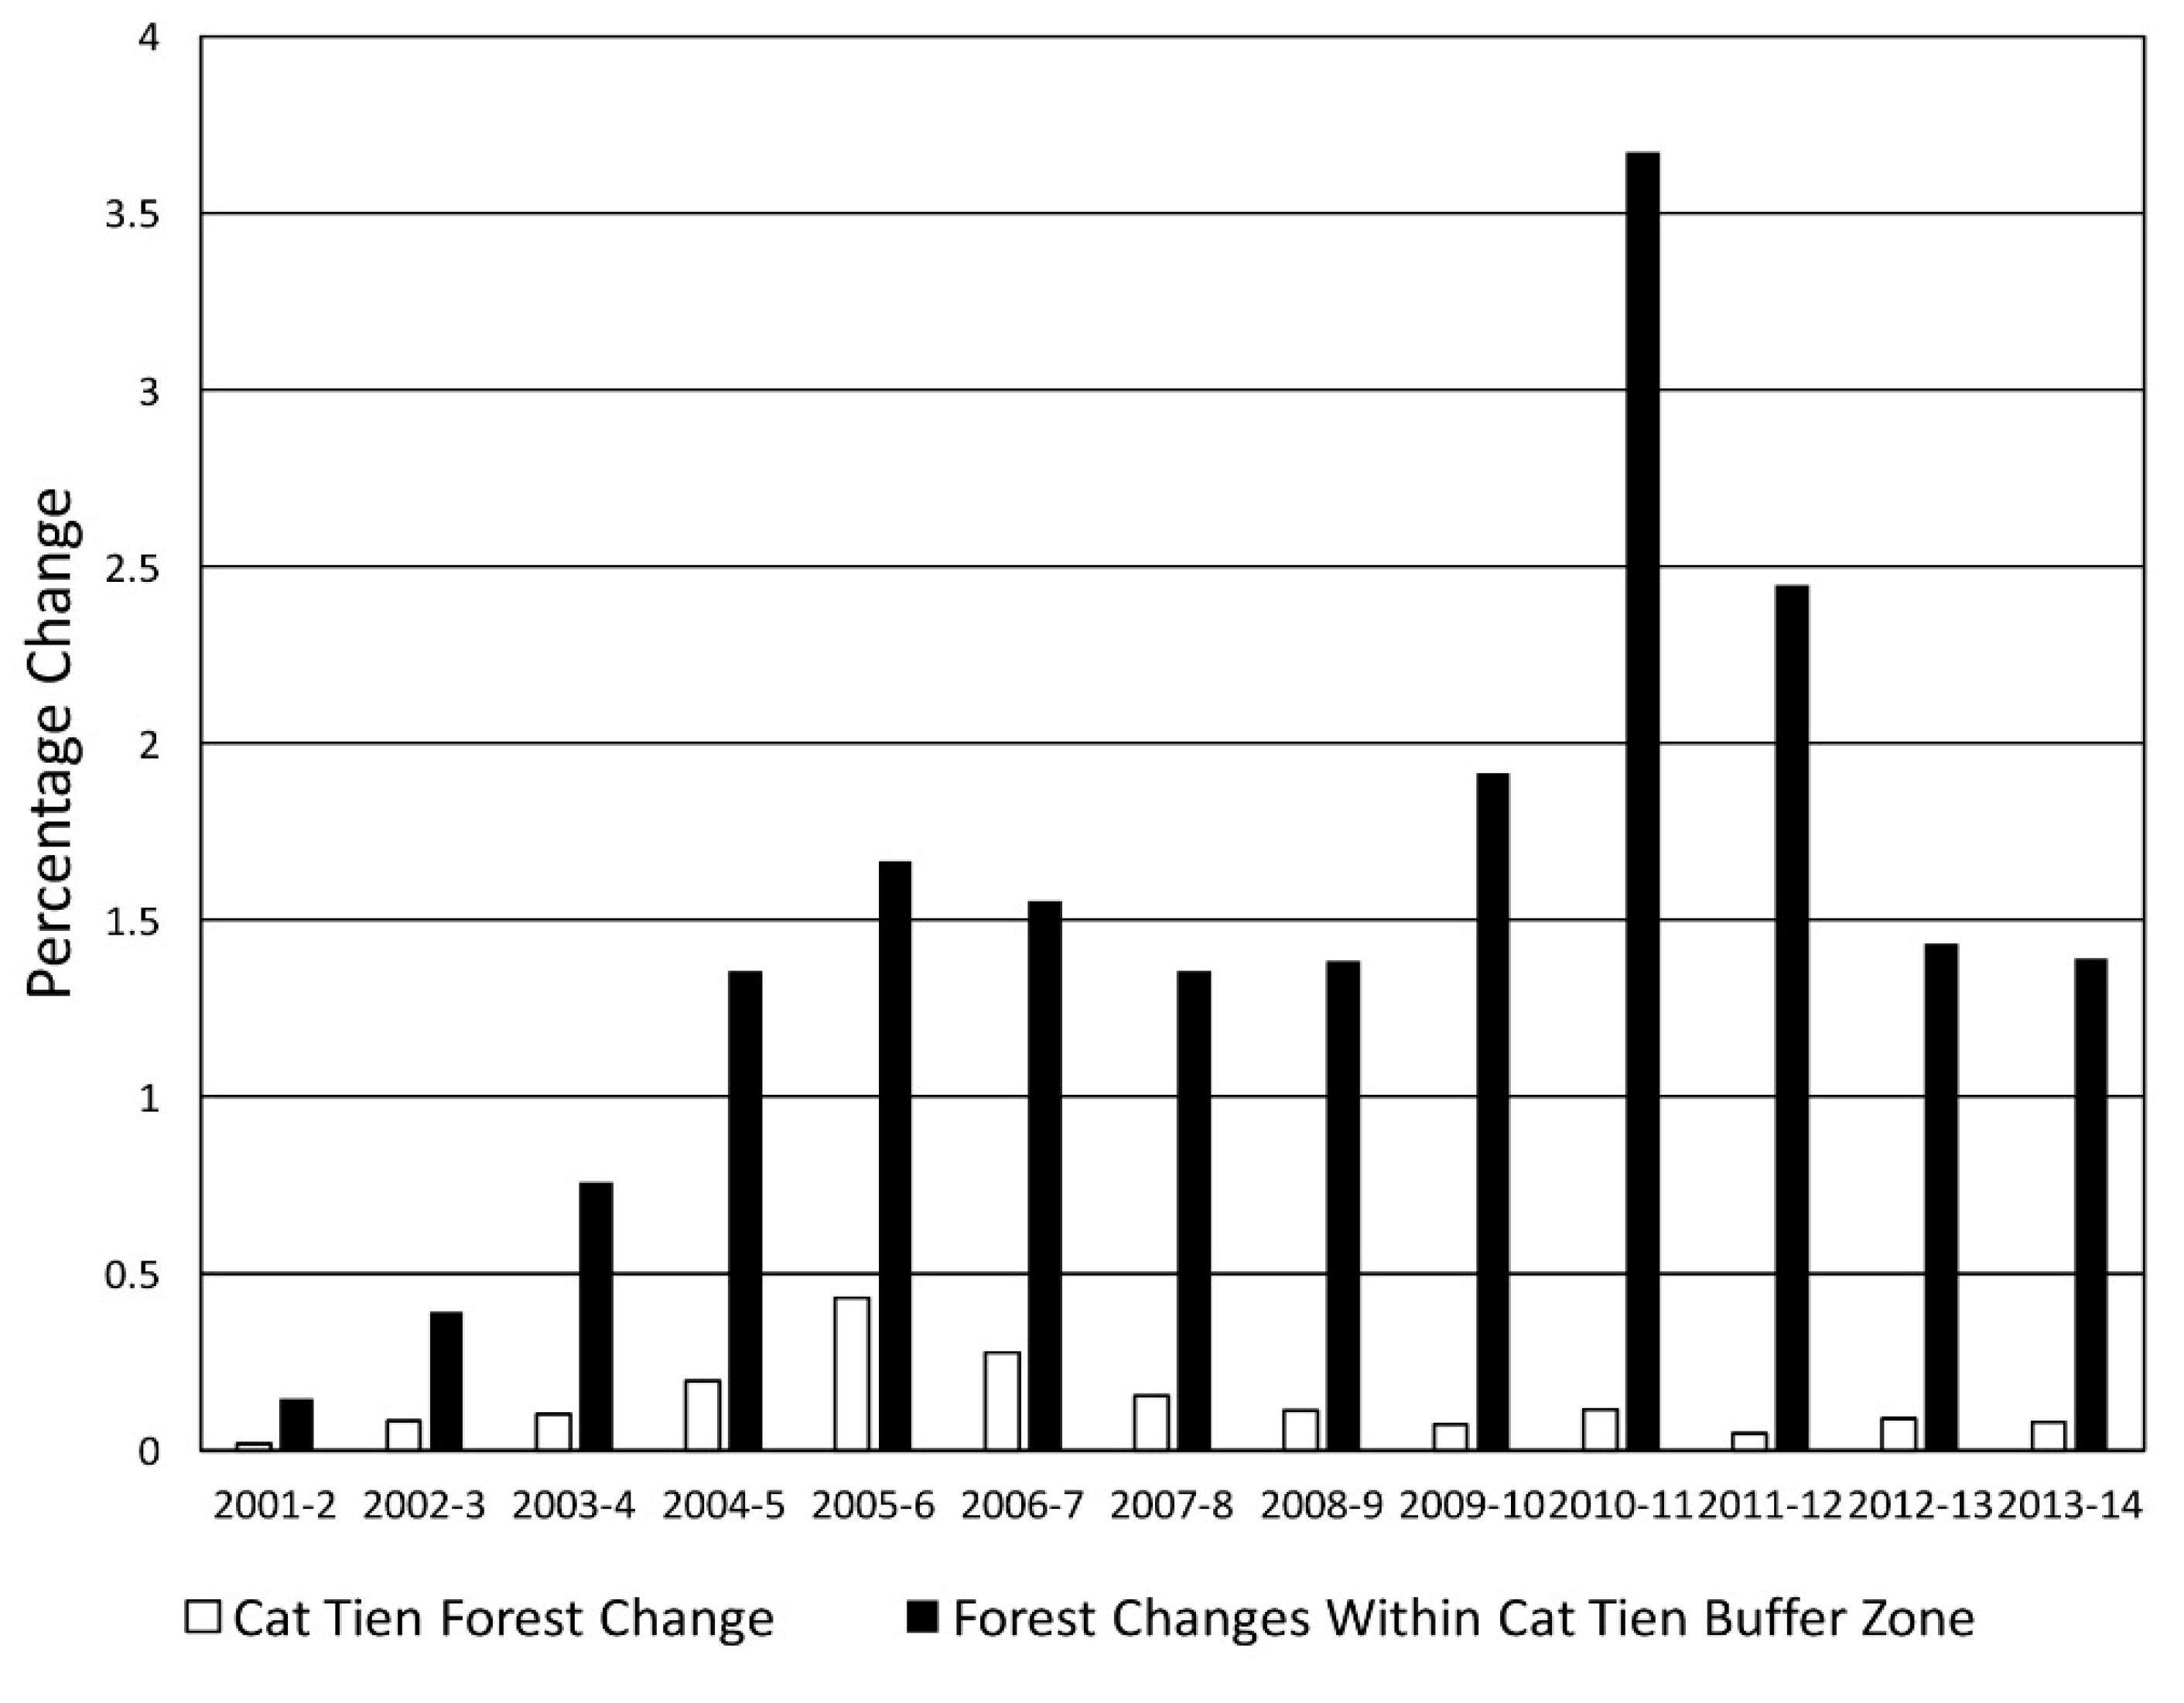
Figure 10.
Comparison between forest change due to disturbance in Cat Tien National Park and buffer zone regions. Disturbance changes represent loss of greenness as determined using NDVI difference threshold values between adjacent years.
Figure 10.
Comparison between forest change due to disturbance in Cat Tien National Park and buffer zone regions. Disturbance changes represent loss of greenness as determined using NDVI difference threshold values between adjacent years.
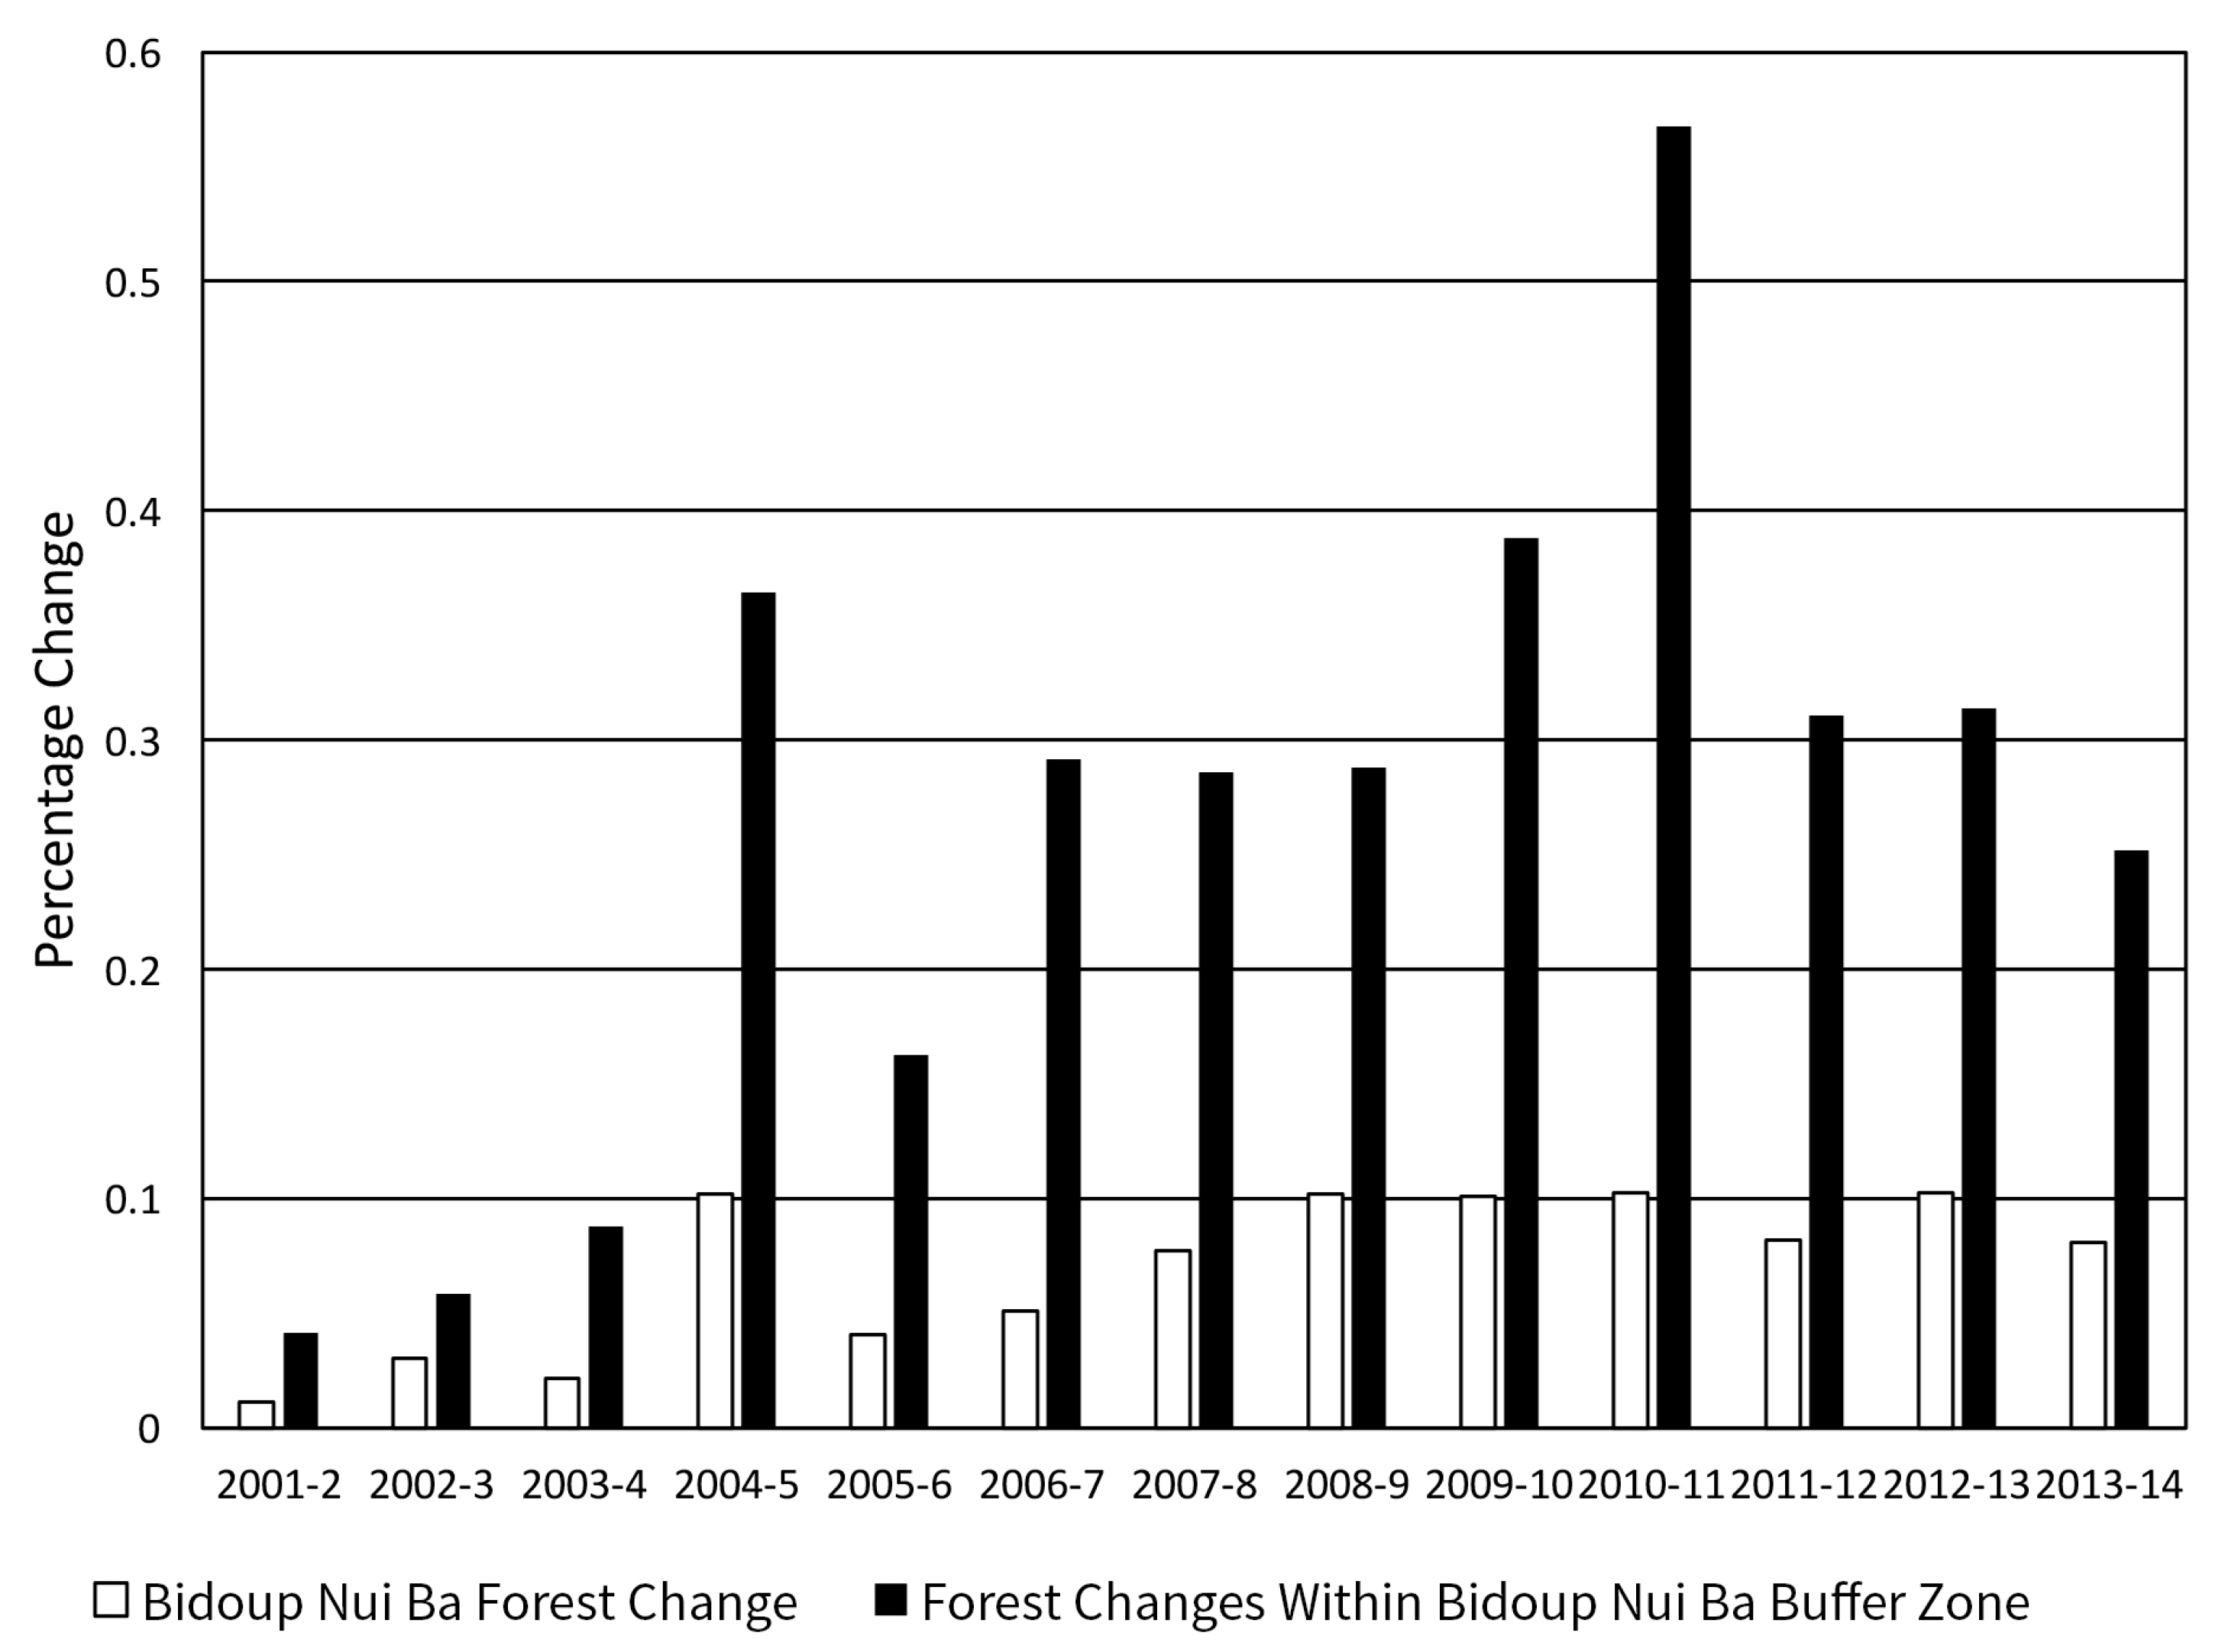
Figure 11.
Comparison between forest change due to disturbance in Bidoup Nui Ba National Park and buffer zone regions. Disturbance changes represent loss of greenness as determined using NDVI difference threshold values between adjacent years.
Figure 11.
Comparison between forest change due to disturbance in Bidoup Nui Ba National Park and buffer zone regions. Disturbance changes represent loss of greenness as determined using NDVI difference threshold values between adjacent years.
Table 1.
Vietnam forest statistics [
3,
4]. Area values are in millions ha.
Table 1.
Vietnam forest statistics [
3,
4]. Area values are in millions ha.
| Total Area (Vietnam) | 32.9 |
|---|
| Forest area (1990) | 9.4 |
| Forest area (2000) | 11.7 |
| Forest area (2005) | 13.1 |
| Forest area (2010) | 14.1 |
| Forest area (2015) | 14.8 |
| Primary forest (2010) | 1% |
| Secondary forest (2010) | 76% |
| Planted forest (2010) | 25% |
Table 2.
Forest map validation. Validation was done with points visually interpreted using Landsat imagery from the 2000, 2007, and 2014 NDVI-derived forest maps. Areas are classified as forest or non-forest. Overall accuracy using this approach was 93.0%.
Table 2.
Forest map validation. Validation was done with points visually interpreted using Landsat imagery from the 2000, 2007, and 2014 NDVI-derived forest maps. Areas are classified as forest or non-forest. Overall accuracy using this approach was 93.0%.
| Year | Class | Reference Total | Classified Total | Number Agreement | Producer’s Accuracy | User’s Accuracy |
|---|
| 2000 | Forest | 161 | 165 | 155 | 96.3% | 93.9% |
| 2000 | Non-forest | 67 | 63 | 57 | 85.1% | 90.5% |
| 2007 | Forest | 123 | 130 | 112 | 91.1% | 86.2% |
| 2007 | Non-forest | 94 | 87 | 76 | 80.9% | 87.4% |
| 2014 | Forest | 76 | 80 | 63 | 82.9% | 78.8% |
| 2014 | Non-forest | 100 | 96 | 83 | 83.0% | 86.5% |
Table 3.
Forest change validation; 2000–2007. Validation was done using annual NDVI forest change dataset derived from points visually interpreted using Landsat and high-resolution imagery. If areas classified as forest in 2000 showed decreases in NDVI values during adjacent year periods afterwards (e.g., between 2001 and 2002, 2003 and 2004, and so on through 2007), then the change areas were classed as forest loss. Areas that did not show changes in the forested or non-forested areas were classed as persistent forest or persistent non-forest. Overall accuracy using this approach was 84.4%.
| | Persistent Forest | Persistent Non-Forest | Loss | User’s Accuracy |
|---|
| Persistent forest | 108 | 7 | 10 | 86.4% |
| Persistent non-forest | 1 | 44 | 3 | 91.7% |
| Loss | 7 | 3 | 16 | 61.5% |
| Producer’s accuracy | 93.1% | 81.5% | 55.2% | |
Table 4.
Forest change validation; 2007–2014. Validation was done using annual NDVI forest change dataset derived from points visually interpreted using Landsat and high-resolution imagery. If areas classified as forest in 2007 showed decreases in NDVI values during adjacent year periods afterwards (e.g., between 2008 and 2009, 2010 and 2011, and so on through 2014), then the change areas were classed as forest loss. Areas that did not show changes in the forested or non-forested areas were classed as persistent forest or persistent non-forest. Overall accuracy using this approach was 84.7%.
| | Persistent Forest | Persistent Non-Forest | Loss | User’s Accuracy |
|---|
| Persistent forest | 59 | 6 | 4 | 85.5% |
| Persistent non-forest | 7 | 49 | 4 | 81.7% |
| Loss | 2 | 1 | 25 | 89.3% |
| Producer’s accuracy | 86.8% | 87.5% | 75.8% | |
Table 5.
Forest change validation; 2000–2014. Validation was done using 2000–2014 annual NDVI forest change dataset derived from points visually interpreted using Landsat and high-resolution imagery. If areas classified as forest in 2000 showed decreases in NDVI values during adjacent year periods afterwards (e.g., between 2001 and 2002, 2003 and 2004, and so on through 2014), then the change areas were classed as forest loss. Areas that did not show changes in the forested or non-forested areas were classed as persistent forest or persistent non-forest. Overall accuracy using this approach was 84.2%.
| | Persistent Forest | Persistent Non-Forest | Loss | User’s Accuracy |
|---|
| Persistent forest | 61 | 3 | 11 | 81.3% |
| Persistent non-forest | 1 | 37 | 2 | 92.5% |
| Loss | 8 | 0 | 35 | 81.4% |
| Producer’s accuracy | 87.1% | 92.5% | 72.9% | |
Table 6.
Average forest map accuracy. Validation of the 2000–2014 annual NDVI forest change dataset was derived from all points from 2000 to 2014 visually interpreted using Landsat and high-resolution imagery. Areas are classified as forest or non-forest for each year of study. Overall accuracy using this approach was 86.6%.
| Class | Reference Total | Classified Total | Number Agreement | Producer’s Accuracy | User’s Accuracy |
|---|
| Forest | 582 | 611 | 518 | 89.0% | 84.8% |
| Non-forest | 587 | 558 | 494 | 84.2% | 88.5% |


 ,
, 


