1. Introduction
Accurate measurement and mapping of forest timber volume by affordable means is one of the primary objectives when designing forest inventories as an aid to forest management and operational harvesting activities. For a forest inventory, information on tree volume is vital. Given the fact that in large forest estates it is not practical to measure all the trees, the traditional approach in forest mensuration is the stand- or compartment-level inventory. In this approach, depending on the characteristics of a forest stand, full assessment, sampling inventory, stand-wise expert estimation, or a combination of different methods supported by the interpretation of aerial photography, are applied [
1,
2].
The concept of sample-based forest inventory for entire forest estates using statistical theory for parameter estimation was developed between 1960 and 1980 and is nowadays a widely-established system in forest management inventory practice, along with the traditional stand-wise approach which is still in use [
3,
4,
5,
6]. For forest estates that apply a sample-based forest inventory covering the entire forest area, e.g., several federal state forest enterprises in Germany, the combination of remote sensing with sample-based measurements offers a solution for wall-to-wall estimation.
With advances in the field of remote sensing in terms of availability and the quality of datasets, new methods integrating field reference data and remote sensing-based parameters have been developed and described, permitting the generation of forest timber volume maps [
7,
8,
9]. These methods employ both parametric and non-parametric approaches where field information from forest inventories are combined with remote sensing information for the prediction and regionalization of forest timber volume estimates [
7].
Many studies have highlighted the effectiveness of data from airborne laser scanning (ALS) for the estimation of above ground biomass and forest timber volume [
8,
9,
10,
11,
12]. ALS has been used to derive precise and accurate information on forest structural characteristics [
13] and in many Nordic countries, such as Norway, Finland, and Sweden, these data have been used operationally for forest inventory purposes [
14,
15,
16]. However, given the relatively high cost of carrying out ALS surveys, the periodic update of data is limited as is its use in practice [
17]. In contrast, stereo aerial photographs are acquired on a regular basis in a large number of countries. In many parts of Germany, for example, the survey administrations acquire stereo digital aerial photography on a three-year cycle [
18].
The use of the spectral information from digital aerial photography is standard practice in forest resource surveys for mapping of forest types, structural attributes, etc. [
19]. Further to recent developments in automatic image matching techniques, data derived from stereo aerial photographs, like ALS data, can now also be used for generation of three-dimensional point clouds which can then be applied using different approaches to estimate forest timber volume. The objective of this study is to explore how these ALS and aerial image point cloud data can be used in conjunction with sample-based forest inventory data to provide spatially-explicit timber volume maps.
The pixel resolution of stereo aerial images from administration surveys is usually relatively high (10-cm pixel size in our study where we use standard images from the survey agency of the federal state of Baden-Württemberg) and offers a good potential for extracting dense three-dimensional image-based point clouds [
20]. On the other hand, ALS point clouds obtained from laser pulses are more uniformly distributed than image-based point clouds [
21].
For the extraction of canopy height information from image-based point clouds, a high-quality digital terrain model, based on ALS data is required [
20,
21]. For all German federal states in general, and at our study site in particular, highly accurate digital terrain models from earlier ALS campaigns are available.
Over the last few years, different image-matching point cloud-generating algorithms have been developed and tested for the estimation of different forest attributes. For instance, Bohlin et al. [
22] used Match-T DSM software to generate point clouds for estimation of forest attributes. Similarly, White et al. [
23] used the Semi-Global Matching (SGM) algorithm as implemented in the Remote Sensing Software Package Graz [
24] to generate point clouds for estimating plot-level forest attributes. Järnstedt et al. [
25] used the Next-Generation Automatic Terrain Extraction module from the software SOCET SET, and Straub et al. [
21] used enhanced Automatic Terrain Extraction (eATE) algorithm from the IMAGINE Photogrammetry software of ERDAS IMAGINE, for the estimation of forest attributes.
For our study, two of the most widely-used image-matching point cloud-generating algorithms, namely the eATE and SGM have been selected. The eATE algorithm is an area-based method and uses a normalized cross correlation strategy [
26] while SGM, which is also an area-based method, considers semi-global cost functions during the matching process [
27]. While many studies have opted to use SGM among the various image-matching algorithms [
28,
29,
30], so far no study has specifically focused on comparing the ability of image-matching algorithms to produce accurate point clouds over forests and to compare those point clouds generated with point clouds obtained using high-quality ALS.
Although height, obtained from ALS or image-based point clouds, is an important variable used to model forest timber volumes, other parameters derived from point clouds (density and height metrics) have been observed to further improve the performance of such models. While many studies exist where the relationship between forest timber volume and different remote sensing parameters has been statistically modelled using parametric and non-parametric modelling approaches, a comprehensive evaluation of forest timber volume modelling approaches for different image-matching point clouds and their performance against approaches using ALS point clouds, is missing. Existing modelling examples include the approaches of Latifi et al. [
8], who used non-parametric methods for estimating forest timber volume and biomass in a temperate forest using ALS data, and Rahlf et al. [
31], who adopted parametric multiple linear regression for estimating forest timber volume.
In addition to comparing the ALS and image-based point clouds in this study, we also test the relative performance of models based on parametric multiple linear regression, and non-parametric k-Nearest Neighbour (k-NN) and Support Vector Machine (SVM) for the assessment and mapping of forest timber volume using the height and density metrics. To summarise, the specific objectives of the present study are to (i) assess the use and potential of image-matching SGM and eATE image-based point clouds for wall-to-wall mapping of forest timber volume in comparision to wall-to-wall mapping of timber volume using ALS data, and (ii) compare the performance of parametric multiple linear regression, non-parametric k-NN and SVM for the assessment of forest timber volume using ALS and image-matching point clouds.
3. Results
The comparison of multiple linear regression models for ALS-based and image-based point clouds (
Table 5) shows that the performance of ALS for modelling forest timber volume was the highest. However, the coefficient of determination (
R2) and adjusted
R2 values for SGM were marginally lower than those from ALS at 1%. The eATE-based point clouds were found to be the dataset which showed the lowest performance in terms of
R2 and adjusted
R2 among the three datasets in this comparison.
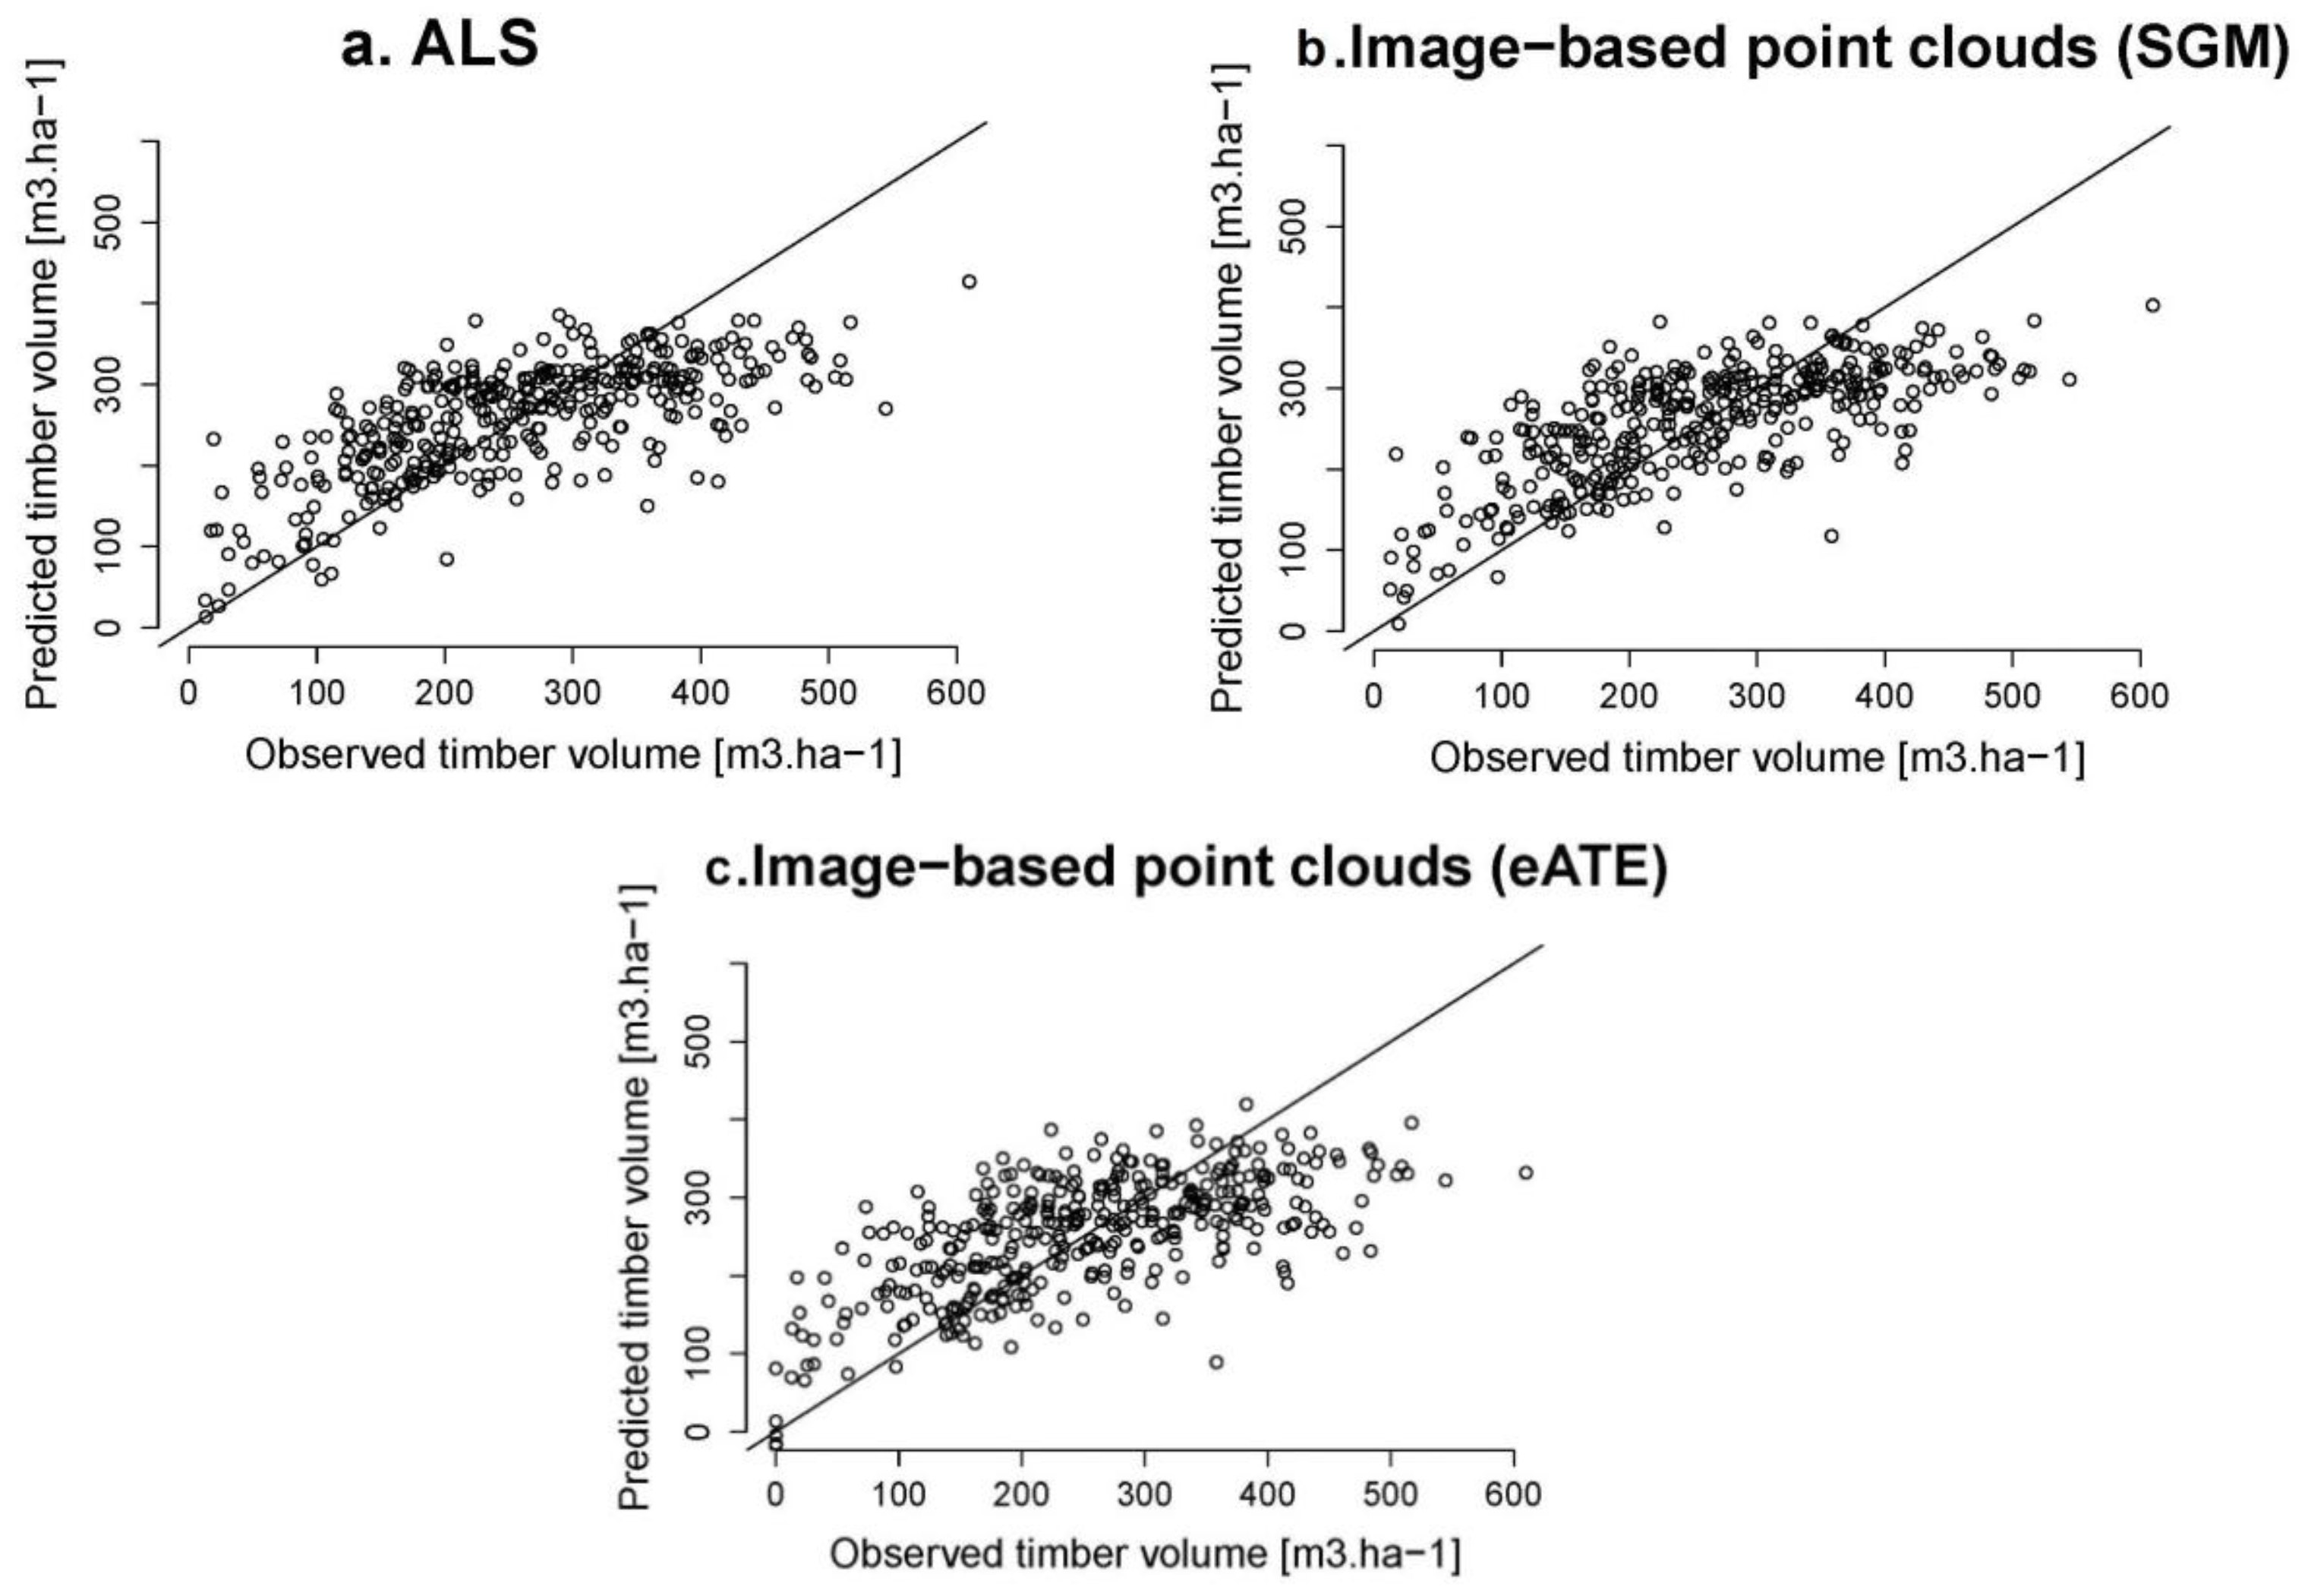
The results of the comparison of methods for estimating the forest timber volume show that, irrespective of the origin of point clouds, multiple linear regression models showed slightly higher accuracies compared to
k-NN and SVM, which can also be observed in the RMSE and RMSE% in
Table 6. The bias% for multiple linear regression models for all three types of point clouds was minuscule, while with
k-NN and SVM small positive and negative biases were observed respectively. There is also a tendency to overestimate forest timber volume for the lower ranges and underestimate at the higher ranges as shown in
Figure 3 where the goodness of fit between predicted and measured forest timber volumes has been plotted.
Table 6 further shows that for all the three forest timber volume estimation approaches, the best results, i.e., the lowest RMSE, RMSE% and bias% were obtained by using the ALS-based point clouds. Among the image-matching point clouds, the SGM point clouds produced better results for all the three approaches while eATE point clouds showed the overall least performance which is consistent with the earlier observations, whereas the best fit using the eATE point clouds was still significantly lower than those obtained using SGM and ALS point clouds (
Table 5).
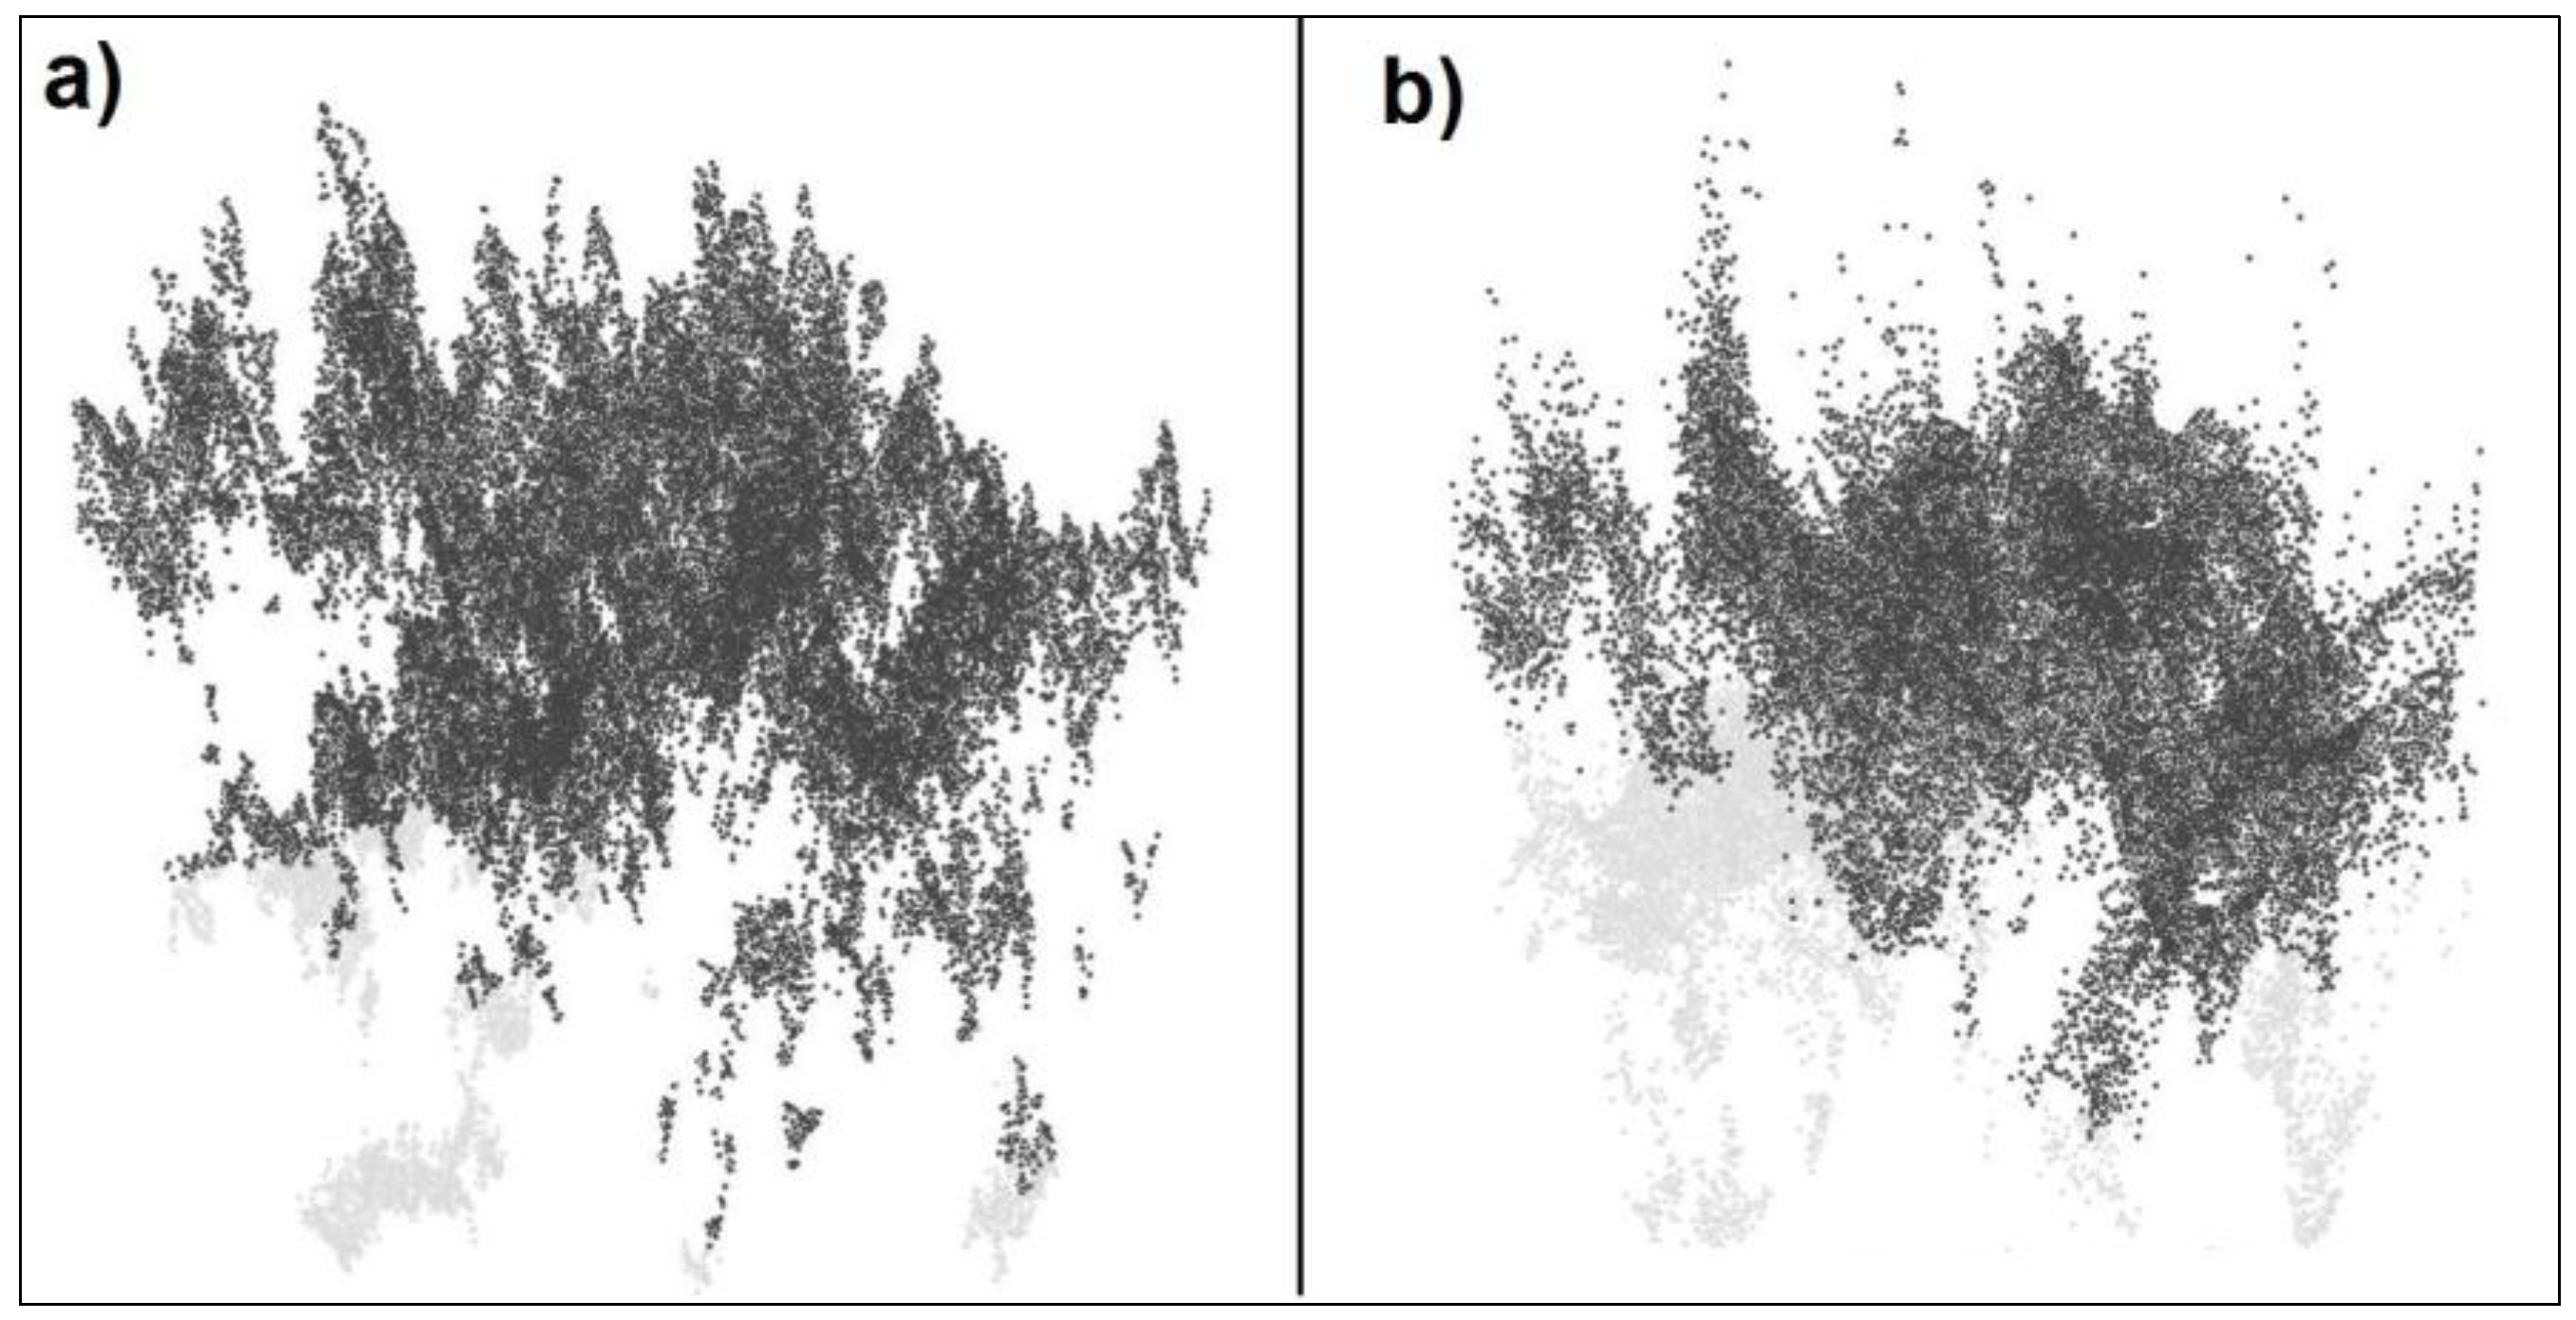
The higher performance of SGM-based point clouds compared to eATE, is an indication of the method’s ability to capture the three-dimensional structure of trees better than those from eATE. This feature of SGM is also represented in
Figure 4 where a visual comparison of the vertical profile of point clouds for the small subset area is shown. These show that image-based points obtained using SGM are denser and have better coverage of the trees tops and the surrounding crowns than eATE image-based point clouds.
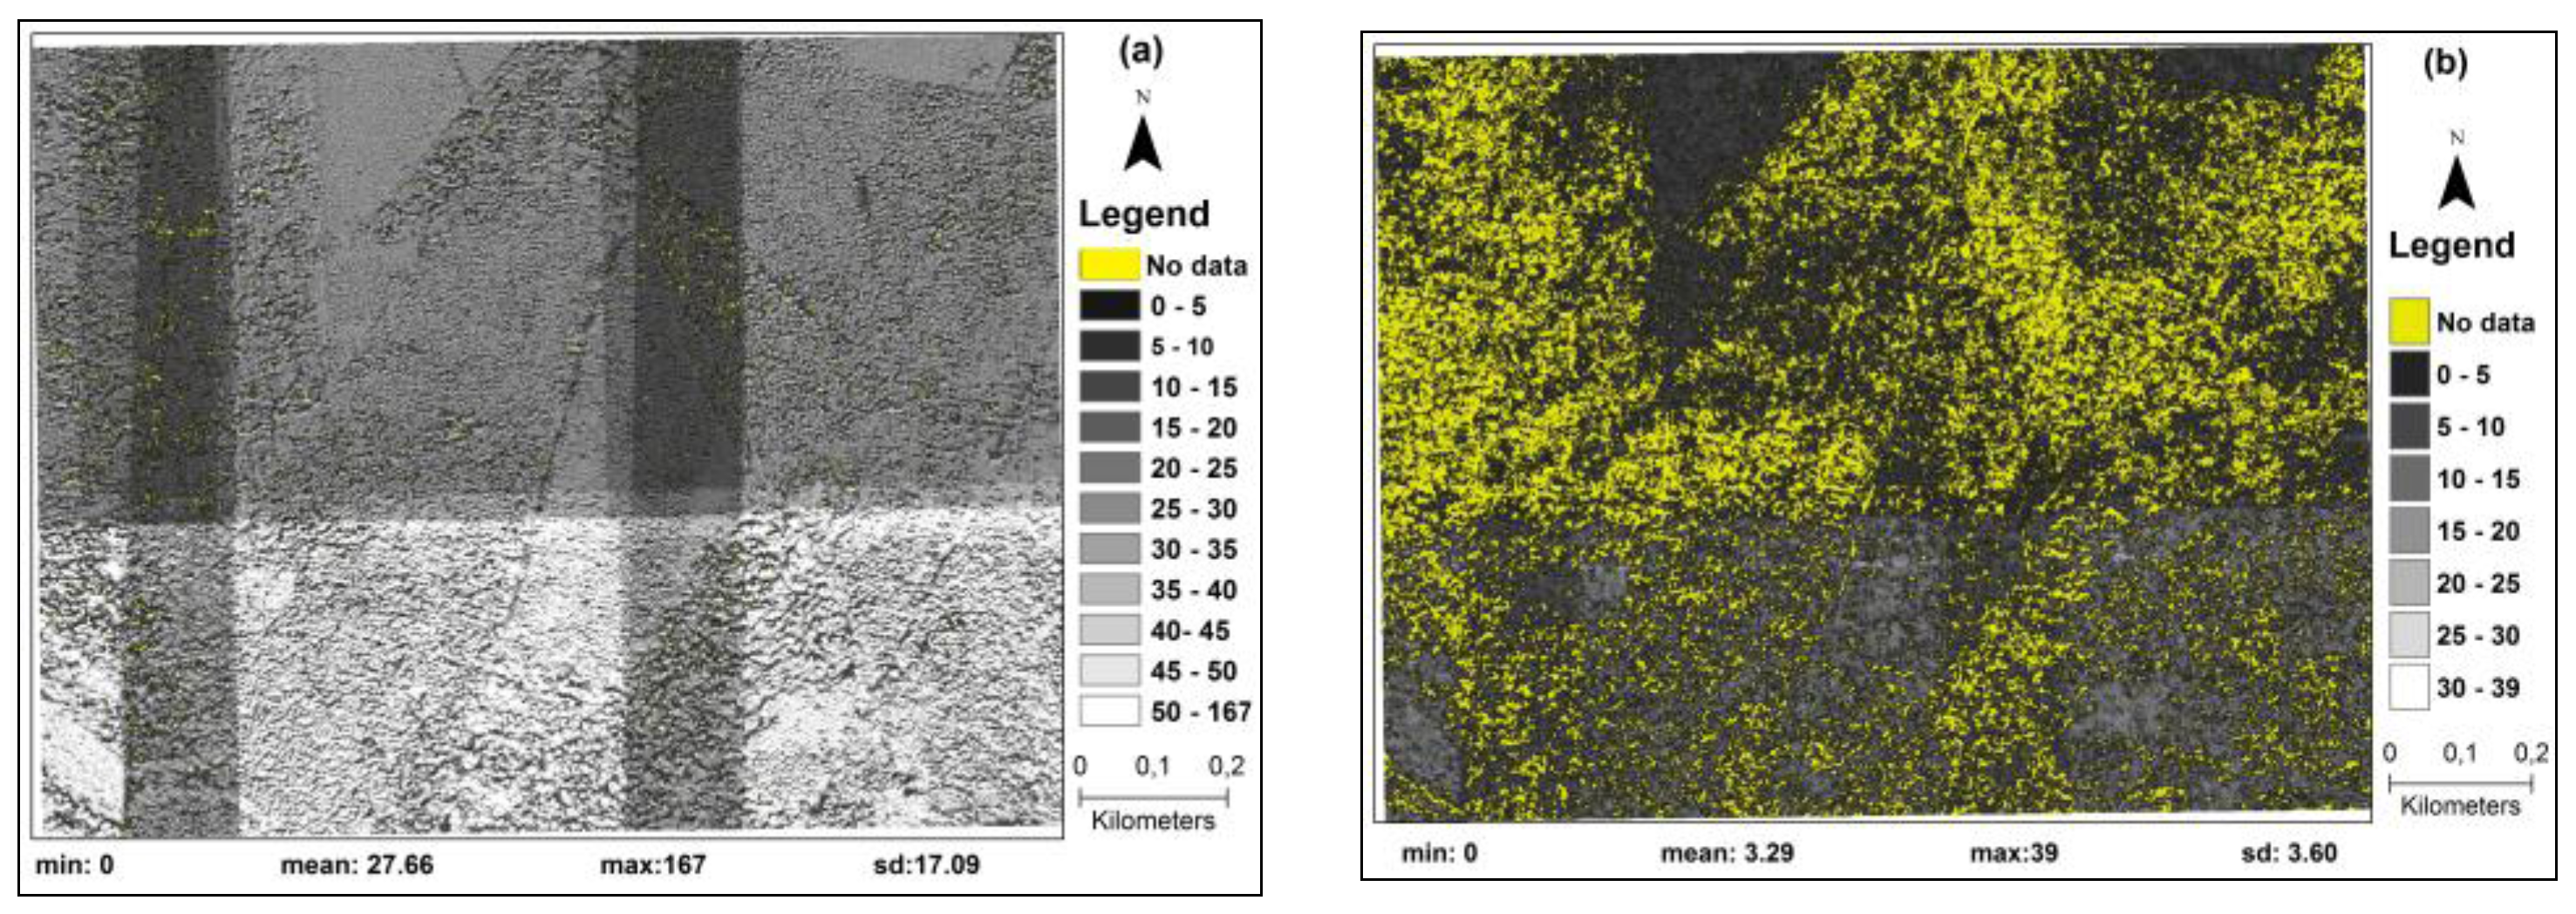
The relative performance of the two image-matching algorithms, in terms of density of point clouds (points per m
2) and their ability to obtain true matches for existing trees, is further highlighted in
Figure 5 where image-based point cloud densities from SGM and eATE algorithms for a subset of the study area are compared. For SGM, a mean point density of 27.66 m
2 was calculated. This value is significantly higher when compared to a mean density of 3.29 m
2 for eATE point clouds. Similarly, it was observed that eATE produced considerably higher numbers of no data pixels, thereby suggesting a higher rate of failure in obtaining valid data points during the image matching procedure. Conversely, for SGM, very few pixels with no data in the point clouds were observed.
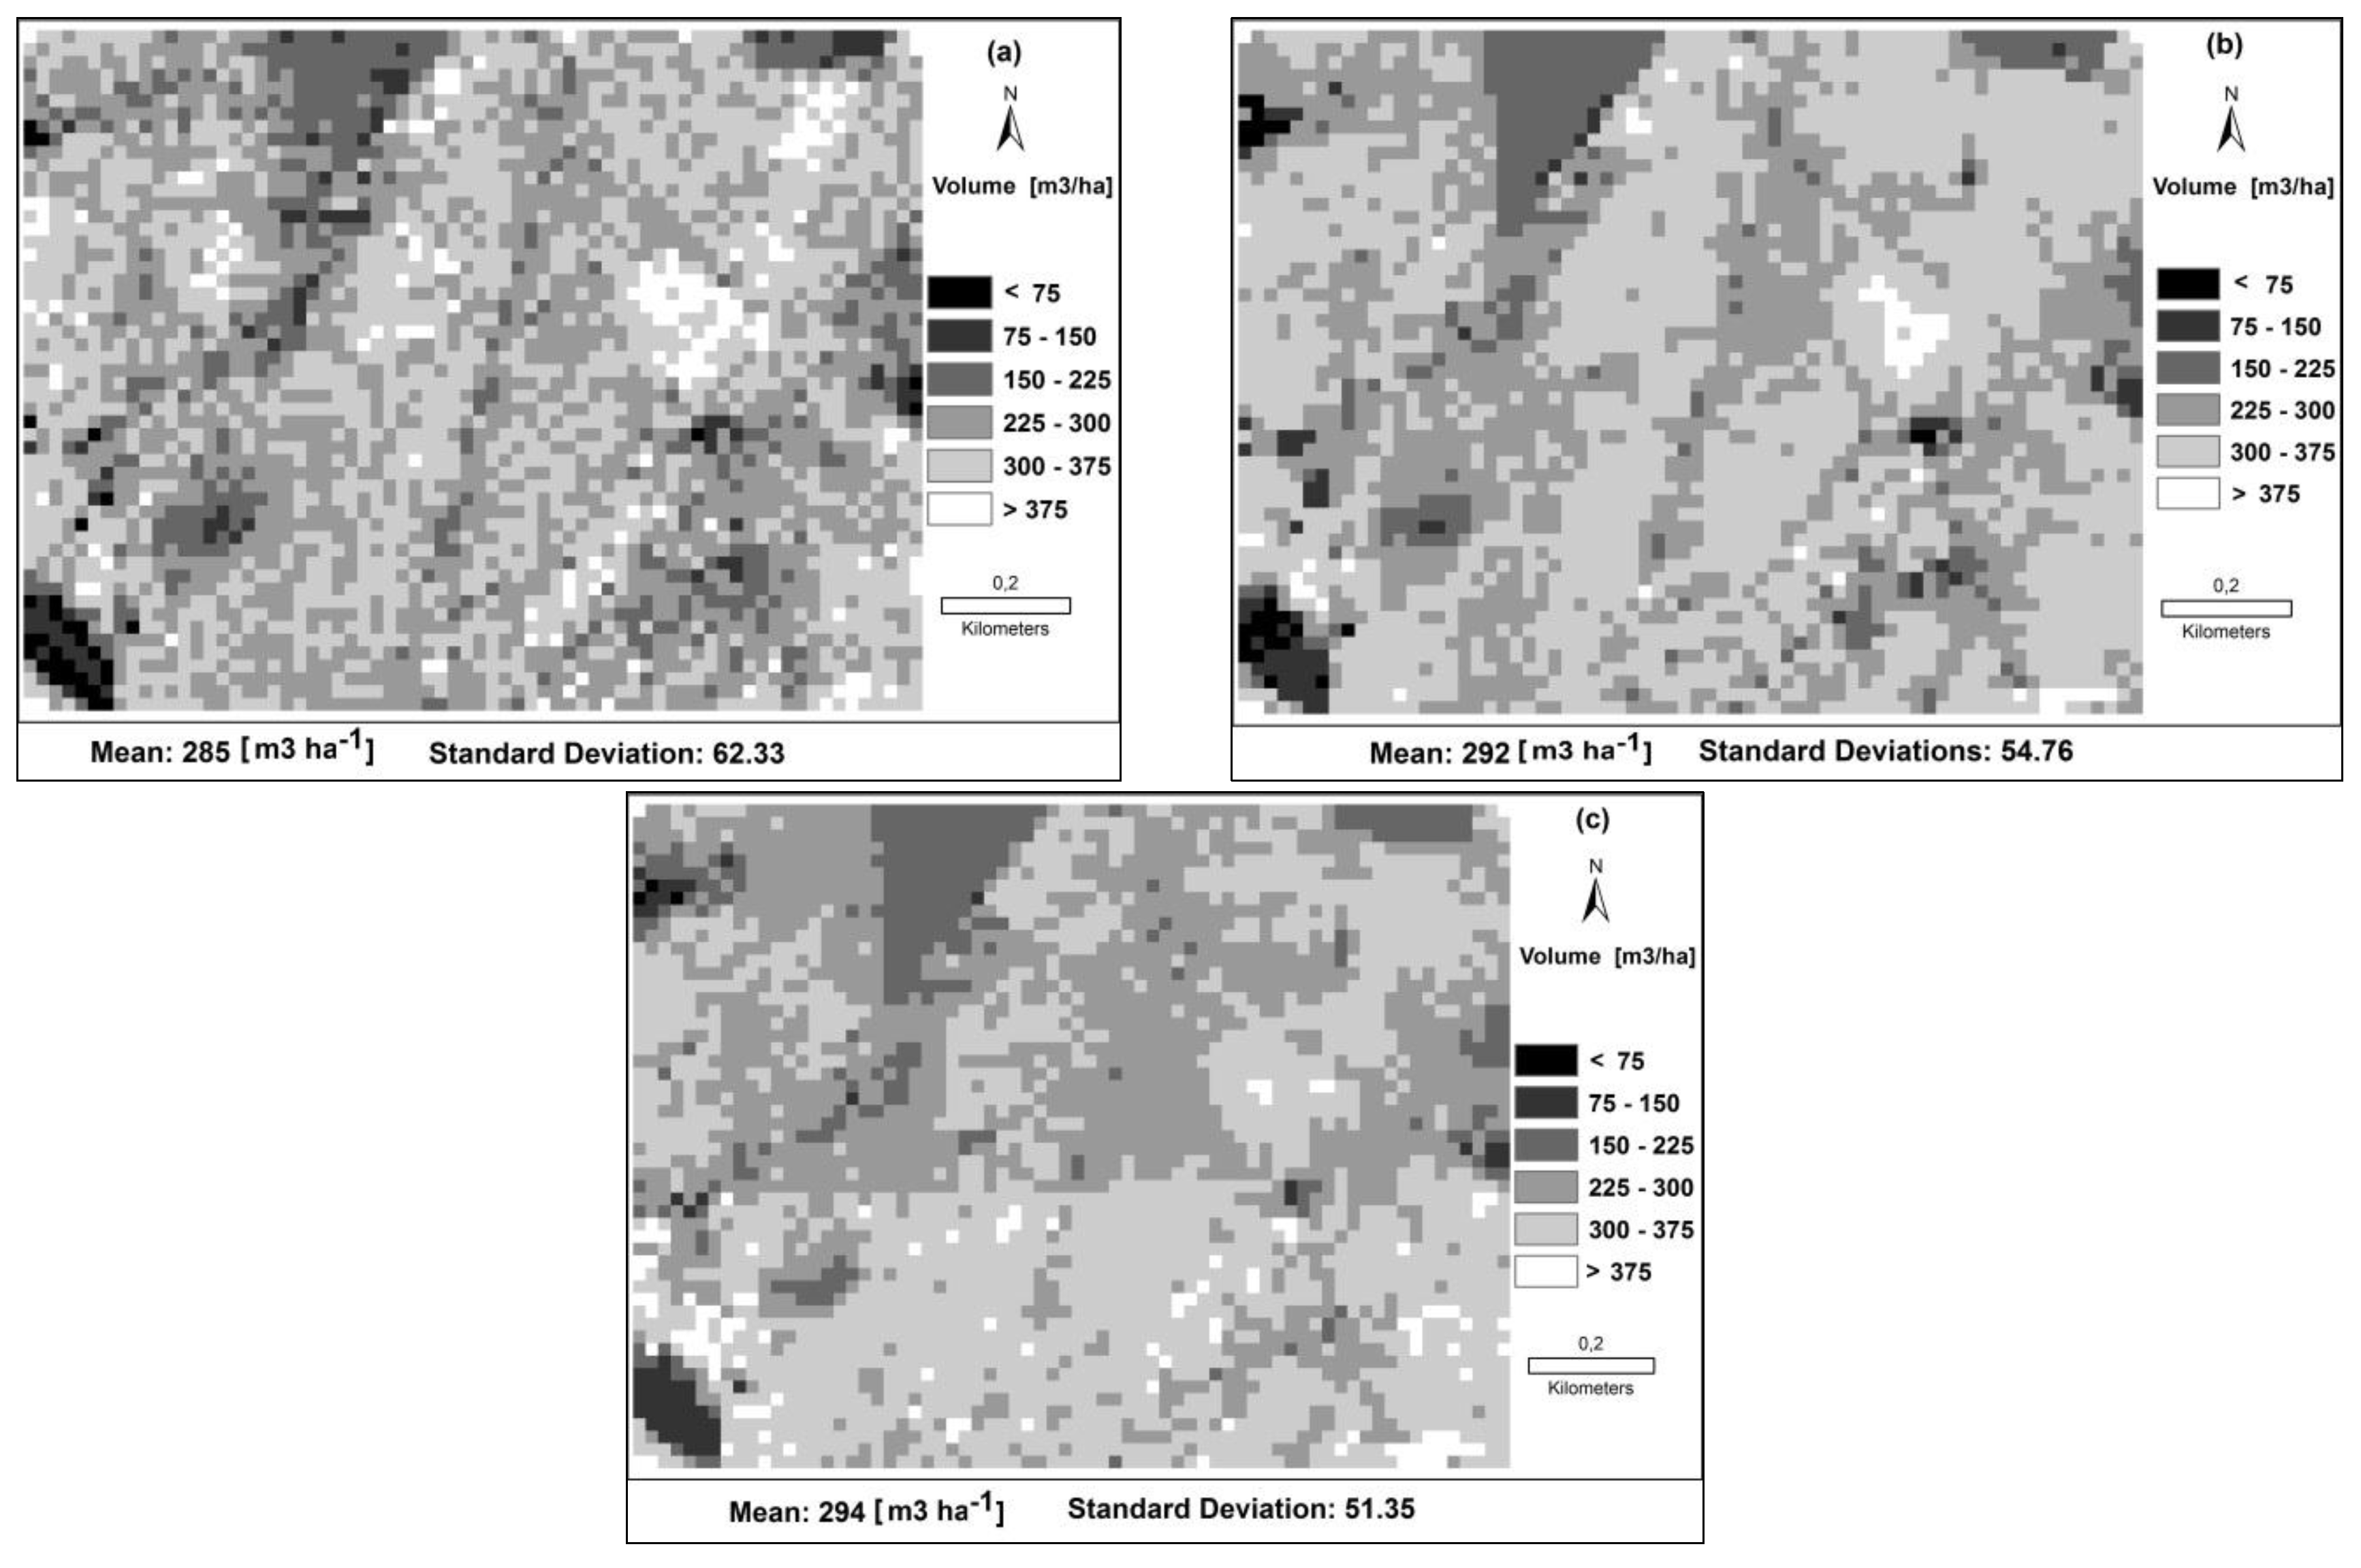
Finally,
Figure 6 shows the thematic maps generated for forest timber volume focused on a small subset of the total study area. The estimations shown here are based on the models developed using multiple linear regression approaches. For this subset study area, we observed a mean forest timber volume of 285 (m
3 ha
−1) for ALS point clouds, a volume which is slightly lower than image-based point clouds based on SGM (292 m
3 ha
−1) and eATE (294 m
3 ha
−1) respectively.
4. Discussion
The first objective of our study was to assess the accuracy of image-matching SGM and eATE image-based point clouds in comparsion with ALS for wall-to-wall mapping of forest timber volume. For our test site, we obtained a RMSE% of 28.3 using SGM image matching, 29.0 when using eATE image matching and 26.3 for ALS. A review of comparable studies in the literature shows the results can vary based on stand structure, species and site quality. For example, Rahlf et al. [
31] analyzed the potential of ALS versus image-based point clouds for estimating forest timber volume, but used the Next-Generation Automatic Terrain Extraction image-matching algorithm as implemented in SOCET SET (version 5.5) at a spruce-dominated test site in southern Norway. They found a higher RMSE% difference between ALS and image-based point clouds and the ALS performing much better, with a RMSE% of 19.0, compared to 31.0, when using an image-based point cloud. White et al. [
23] also tested ALS in comparison with image-based point clouds, and used SGM implemented in the Remote Sensing Software Package Graz (Version 7.46.11) for plot-level estimation of Lorey’s height, basal area, and forest timber volume in a complex coastal forest environment in Canada. They obtained a RMSE% of 33.2 for ALS and a relatively closer result of 36.9% RMSE for SGM. Järnstedt et al. [
25] compared ALS with image-based point clouds by using the Next-Generation Automatic Terrain Extraction module from the software SOCET SET for estimation of mean diameter, basal area, mean and dominant height and forest timber volume for a test site in Southern Finland. Like Rahlf et al. [
31], they also found a higher RMSE% difference between ALS and image-based point clouds and the ALS performed much better with a RMSE% of 31.3 compared to 40.4 when using the image-based point cloud.
Summarizing our results and looking at the findings of above studies, we can conclude that in general, image-based point clouds using SGM show, in most but not in all cases, comparable results to ALS. Furthermore, in all cases, the achievable RMSE% variation from the test site to test site is relatively close and small, demonstrating the operational potential of image-based point clouds for wall-to-wall mapping of forest volume.
When comparing the performance of SGM and eATE in our study, we obtained poorer results using eATE. The observed differences are due to the entirely different matching and filtering algorithms. They also differ in the sensitivity of the surface direction and the contrast changes within objects. Additionally, SGM has been developed to produce a closed surface, while eATE concentrates on matching processes without producing regular gridded closed surfaces. As discussed earlier, SGM uses a semi-global cost function, which considers an approximation of the global cost and explicit smoothness constraints. On the other hand, eATE uses an area-based approach without taking into account cost functions. Unlike ALS, SGM produces a more evenly distributed point cloud corresponding to the ground sample distance of the imagery, which is spread over the entire forest area when compared to eATE (
Figure 4 and
Figure 5). However, eATE produces an unevenly distributed point cloud when compared to SGM, which is in some areas successful but fails in other regions completely, due to the inadequate texture or occlusion in parts in the images (
Figure 5). For this reason, we found a large number of pixels with no data values for eATE, as compared to SGM (
Figure 5). For SGM, we obtained a mean point cloud density of 27.7 m
2, which is much higher as compared to 3.3 m
2 obtained from eATE (
Figure 5). In terms of computational power requirements, SGM needs less processing time compared to eATE for the generation of image-based point clouds. SGM needs very few parameters settings (
Table 3), while eATE needs many parameters to be set by the operator and therefore needs more user input and model iterations to identify the appropriate parameter set for a specific image dataset. Hence, there are many reasons for obtaining a higher accuracy by using SGM as compared to eATE. Straub et al. [
21] also highlighted the problem of the no data points when using eATE for estimating forest timber volume and basal area and they have suggested exploring SGM as a potential solution. The results of our comparison of SGM and eATE for forest timber volume estimation are also supported by our previous findings on the comparison of these two methods for forest height estimation [
34].
When comparing the performance of parametric multiple linear regression and non-parametric
k-NN and SVM for estimating forest timber volume, we achieved slightly more accurate results using a parametric multiple linear regression, specifically when considering the bias. However, multiple linear regressions did not substantially outperform the other two non-parametric
k-NN and SVM approaches. Penner et al. [
52] worked on the comparison of parametric versus non-parametric ALS models for operational forest inventory in boreal Ontario. They implemented and compared seemingly unrelated regression models (parametric),
k-NN and randomForest (non-parametric) predictions of forest inventory attributes. They found, similar to the results presented in this study, that no single method produces the best results consistently, and that the prediction accuracy varied markedly with the forest type.
We observed an overestimation of forest timber volume at the lower ranges and underestimation at the higher ranges (
Figure 3). This could be due to the presence of older trees which show increased height increment relative to diameter increment when compared to younger trees [
53], and due to the fact that tree height was used as one of the explanatory variables for forest timber volume estimation. The overestimation could also be due to overlapping tree crowns located outside of the borders of the sample plots. This would appear to be one of the limitations when integrating forest inventory field survey data with remote sensing datasets, using an area-based approach. However, this phenomenon also works in reverse, as some crowns on the edge of the plot are only partially included. Therefore statistically, these phenomena should neutralize each other.
Our maps showed a mean forest timber volume of 285 [m
3 ha
−1] for ALS for the small subset area, which is slightly lower than image-based point clouds using SGM [i.e., 292 m
3 ha
−1] and eATE [i.e., 294 m
3 ha
−1] (see
Figure 6). We found that all three datasets produce more or less comparable results. There is a slight overestimation in forest timber volume maps from image-based point clouds compared to ALS. This could be attributed to the penetrating power of the ALS point clouds as compared to the image-based point clouds. For the eATE-based point clouds, there is a clear difference between the forest timber volume maps in areas where highest and lowest point densities are present. The standard deviation of each of the maps also highlights the ability of ALS to capture the structural diversity of the forests compared to the image-based point clouds.
5. Conclusions
In this study we assessed the use and potential of image-matching SGM and eATE image-based point clouds to aid wall-to-wall mapping of forest timber volume in comparison to wall-to-wall mapping of forest timber volume using ALS data. The performance of a parametric multiple linear regression model and the non-parametric k-NN and SVM methods were evaluated for the estimation of forest timber volume.
ALS data, independent of the parameter estimation method used, provided slightly more accurate volume estimates than image-based point clouds from SGM and eATE. Nevertheless, image-based point clouds provide maps of comparable quality to ALS and can thus be used in a forest management planning context where ALS data are absent but where recent aerial images and sample field plot data are readily available. With respect to the methods applied in this study for image matching, SGM slightly outperformed eATE while the timber volume predictions generated using multiple linear regression showed slightly better results compared to k-NN and SVM.
The results from this study show how remotely-sensed data from aerial imagery and ALS can be combined with plot-based data to improve estimates of the most meaningful forest inventory parameters and to generate information layers or thematic map products to aid forest management. Besides using such maps as a general information layer for decision support, there is also a significant potential to combine these data with sample plot information through small area estimation to provide improved estimation accuracy at the stand, compartment and forest enterprise level scales.


