Article

On the Effect of Thinning on Tree Growth and Stand Structure of White Birch (Betula platyphylla Sukaczev) and Siberian Larch (Larix sibirica Ledeb.) in Mongolia

1
Department of Silviculture and Forest Ecology of the Temperate Zones, Universität Göttingen, Büsgenweg 1, 37077 Göttingen, Germany
2
Institute of Geography-Geoecology, Mongolian Academy of Sciences, Post Box-81, Baruun Selbe 15, Ulaanbaatar 15170, Mongolia
3
School of Agroecology and Business, Institute of Plant and Agricultural Sciences, Mongolian University of Life Sciences, P.O. Box 904, University St., Darkhan, 45047 Darkhan-Uul, Mongolia
4
Chair of Silviculture, Technische Universität Dresden, Pienner Strasse 8, 01735 Tharandt, Germany
*
Author to whom correspondence should be addressed.
Forests 2017, 8(4), 105; https://doi.org/10.3390/f8040105
Submission received: 13 February 2017 / Revised: 15 March 2017 / Accepted: 23 March 2017 / Published: 31 March 2017

Abstract

:
The forests of North Mongolia are largely dominated either by larch (Larix sibirica Ledeb.) or birch (Betula platyphylla Sukaczev). The increasing demand for timber and firewood is currently met by removal of wood from these forest stands. Therefore, silvicultural approaches that account for both utilization and protection are needed. Thinning trials were established in the research area Altansumber, in the mountain forest steppe west of the town of Darkhan. We analyzed the response of non-spatial and spatial structure and growth of birch and larch stands on thinning. Before thinning, spatial tree distribution was largely clumped. Thinning promoted regular tree distribution. Ingrowth of new stems after thinning tended to redirect stand structure towards clumping. Both relative and absolute tree growth and competition were evaluated before, directly after, and three years after the thinning. Competition played a significant role in tree growth before thinning. A reduction in competition after thinning triggered significantly increased growth of both birch and larch. The observed positive growth response was valid in absolute and relative terms. A methodically based forest management strategy, including thinning operations and selective cuttings, could be established, even under the harsh Mongolian conditions. Our findings could initiate the development of broader forest management guidelines for the light-taiga dominated stands.

1. Introduction

After the political reversal and breakdown of support from the former USSR and other Comecon-states at the end of the 20th century, the forest sector of Mongolia declined. Forest degradation increased due to frequent fires, irregular logging and climate change [1,2,3]. Thus, management approaches and silvicultural strategies that provide both a sustainable supply of resources and simultaneous protection of the forests are needed.
The dominant species of the mountain forest steppe zone in Mongolia [4,5] are shade-intolerant pioneers—so-called light taiga tree species [6]: Siberian larch (Larix sibirica Ledeb.), Scots pine (Pinus sylvestris L.), Aspen (Populus tremula L.) and white birch (Betula platyphylla Sukaczev). Larix and Betula comprise the largest area of Mongolian forests today. According to a recent forest inventory, larch and birch forests (basal area threshold 75% of either birch or larch) cover more than 70% of the northern Mongolian forests [7]. Siberian larch is by far the most common tree species in the country [8]. Its core distribution is in Siberia and it is known for its tolerance of very low temperatures [9]. Management of larch species generally requires early and intensive thinning during the first 50 years of the rotation period [10]. White birch, also known as Siberian silver birch, Asian or Japanese white birch, or Manchurian birch [11] is the second most common tree species in Mongolia. It grows well under a variety of environmental conditions, is frost-resistant, but it is drought-sensitive [12]. Betula platyphylla is very closely related to Betula pendula Roth [13]. Silvicultural management of birch usually requires intensive and early thinning in order to ensure good crown development, which is needed for good yield and good timber quality [14]. Its silvicultural treatment is similar to that of larch [10].
Thinning regimes are usually defined by some key characteristics [15,16,17]. Common criteria for the selection of trees favored by modern thinning regimes are vitality, quality as evaluated by potential production objectives (e.g., stem shape), as well as spatial distribution relative to the neighboring trees [18]. It is well known that thinnings have the potential to increase tree growth [19,20,21,22]. However, planned silvicultural interventions that focus not only on timber harvest but also reduce competition for target trees, improve their growth and quality [15,16] or experimental thinning trials [23], are basically unknown in Mongolia. We do not know of any scientific study that has tested the impact of thinning on forest structure and growth of the tree species that dominate Mongolia’s mountain forest steppe zone. Therefore, the response of trees after cutting under these particular regional conditions is unknown; the expected impact of the suggested management activities is based, therefore, on assumptions rather than on empirical data. We hypothesized that, as in less continental climatic regions, the intensity of competition between trees is the dominant factor influencing the growth of birch and larch trees in the arid mountain forest steppe and that these two light demanding tree species can still respond with significant growth to competition relief even in relatively late stages of stand development. Therefore, a reduction of competition should trigger a growth response by the remaining trees.
Specifically, we were interested (i) in the response of stand structure on thinning and (ii) in the growth response of the remaining trees.

2. Materials and Methods

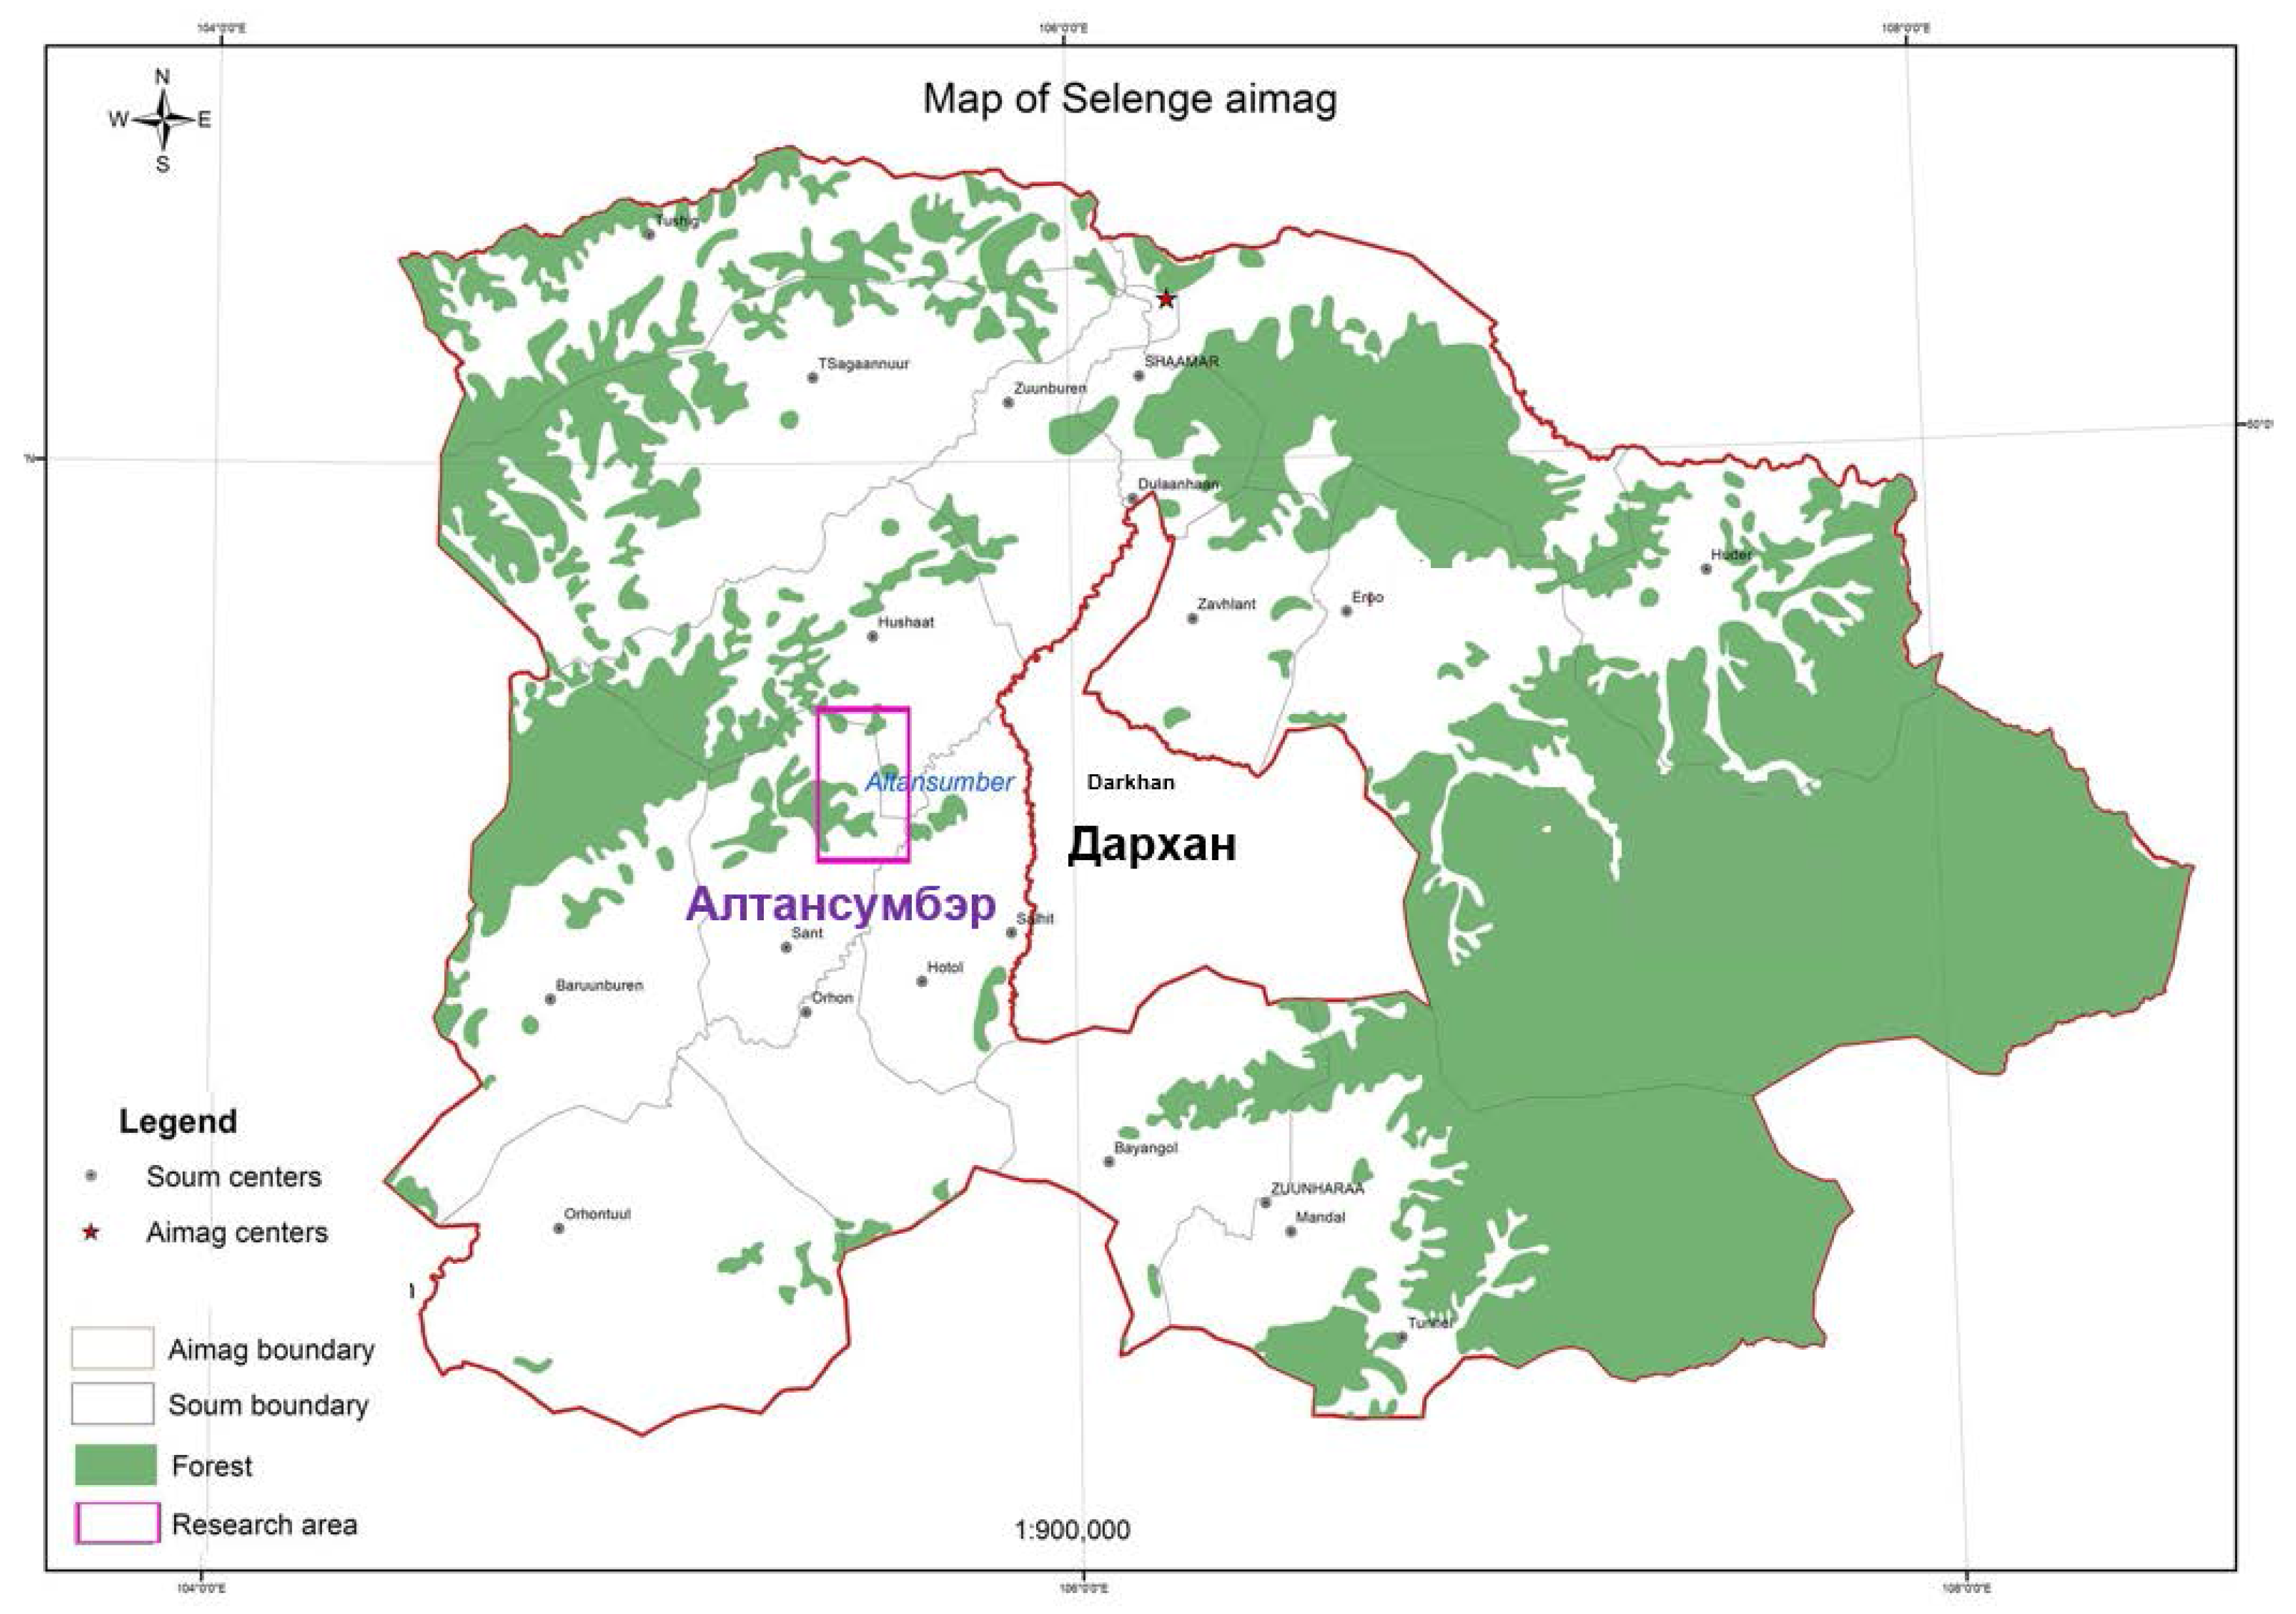
2.1. Participatory Establishment of the Thinning Trials in the research area (RA) Altansumber

In 2009, research plots were established by the Mongolian University of Life Sciences (MULS; formerly University of Agriculture) in Darkhan and the forest user group (FUG) Altansumber (Mongolian: Golden peak) [24,25] in the framework of a joint project between the Food and Agriculture Organization of the United Nations (FAO) and the Mongolian government [24,26]. The RA Altansumber is situated west of the town of Darkhan (Figure 1; 49°29′07.29′′ N; 105°31′30.36′′ E), in the foothills of the Buren Nuruu ridge, and belongs to the northeastern Khangairagion [27]. The recent national forest inventory listed the area as part of the eastern Khuvsgul region [7]. The northern slopes of the mountain forest steppe at Altansumber are dominated by naturally regenerated larch and birch forests (Figure 1). The forest stands are affected by fire and many of them also show signs of previous small-scale logging activities [24].
For this study, two birch stands and two larch stands were selected according to the following criteria [24]: they are typical forest stands in North Mongolia (topography, tree species, stand quality); have relatively good accessibility, harvest potential, and intention for wood utilization by the local population (Table 1). In each stand, three plots were established on representative sites based on expert judgement. All plots exceed the minimum plot area size of 900 m2, recommended for the assessment of taiga forests in Mongolia [28]. This included one plot of medium intensity treatment (removal of up to 50% of stem number depending on stand structure), one with low intensity treatment (removal of up to 25% of stem number depending on stand structure), and one without any treatment. On each plot, the following data were collected prior to thinning (autumn 2009) and in autumn 2012 [24]: species, diameter size, and stem coordinates of every living tree with a minimum diameter at breast height (DBH) of 7 cm. Height was measured on a subsample of at least 30 trees of each main tree species in each stand. After the initial inventory, thinning was carried out on the respective plots. Table 1 provides an overview of the basic data of the study stands. Table 2 provides an overview of tree density, mean diameter (Dg: quadratic mean diameter; D: arithmetic mean diameter) and stand age of each forest stand. See also appendix (Figure A1, Figure A2, Figure A3 and Figure A4).

2.2. Methods

2.2.1. Characterisation of Thinning Type and Intensity—Non-Spatial Harvest Event Analysis

We characterised the thinnings by thinning weight (rG ratio; [29]) and thinning type (NG ratio) [17]. Thinning weight reflects thinning intensity. The NG ratio indicates the thinning type, e.g., thinning from below or above. Values below one indicate thinning from above, values higher than one indicate thinning from below. A value near one indicates indifferent thinning [30], meaning that the proportion of removed stems was proportional to the removed basal area:
r G = G r e m o v e d ( m ² / h a ) G t o t a l ( m ² / h a )
N G = ( N r e m o v e d / N t o t a l ) G r e m o v e d / G t o t a l
where, N = stem number; G = basal area.

2.2.2. Evaluation of Spatial Tree Distribution on the Plots during the Observation Period

Assessment of spatial tree distribution pattern was done by testing the hypothesis of complete spatial randomness (CSR), [31]. The cumulative K-function [32] indicates the spatial tree distribution; it can be regular, irregular (clumped), or random. To better interpret K(r) visually, we used the square-root transformation of the univariate K-function [33], the univariate L-function L(r) [32,34]. Usually, L(r) is plotted using a diagonal or horizontal view (the latter is sometimes also denoted as L*(r); [35]). Here, we applied the horizontal view. L(r)>0 indicates aggregation of the pattern up to distance r, and L(r) < 0 indicates regularity up to distance r [33]. See Formula (3):
L ( r ) = K ( r ) π r   with   L ( r ) = 0   f o r   r 0
where, K(r) = first derivative of the Ripley´s K-function; r = distance in meters.
We also applied the non-cumulative pair correlation function [31,33,35]; g(r) >1 indicates aggregation of the pattern at the distance r, g(r) <1 indicates regularity of the pattern at the distance r. See Formula (4) [33,36]:
g ( r ) = d K ( r ) d r / ( 2 π r )   with   g ( r ) = 1   f o r   r 0
where, dr = λ (density); dK = density function of K(r); r = distance in meters.
The two-sided 95% confidence envelope of both functions was constructed using the Monte Carlo method [31]. Simulations (999) were computed to derive critical values for alpha = 0.05 for each data set. We constructed graphs for the data sets of the plots for the end of the observation period (2012) and directly after the thinning 2009 with r.max. (L(r)) = 14 m and for the small-scale analysis r.max. (g(r)) = 7 m. The analyses were conducted using Excel 2007 (Microsoft Corp., Redmond, WA, USA) and the Programita software [33,37,38].

2.2.3. Evaluation of Single Tree Growth Response

We collected cores in autumn 2012 from dominant and co-dominant trees of the respective species on each plot, when possible on the side facing the sun [39] by expert sampling [40]. Cores of 5 mm in diameter were taken with an increment corer at a height of 1 m above the ground, according to Dulamsuren et al. [41]. The cores were dried and mounted. Data were recorded and evaluated using the Time Series Analysis and Presentation (TSAP)-Win software (RinnTech). The birch cores required special treatment, i.e., cores were cut with a core-microtome [42] and coloured with Basic blue 140 at the Chair of Forest Utilization, Technische Universität Dresden.
We defined absolute growth (abs.gr) as the sum of the annual basal area growth of tree i after the thinning event (2010–2012). In order to quantify the relative change in basal growth of tree i (rel.gr), we divided abs.gr by the mean annual growth of basal area (derived from the stem cores and initial DBH-measurements) of the three years preceding the thinning event (2007–2009):
r e l . g r = w ¯ ( p e r i o d   2 ) w ¯ ( p e r i o d   1 )
where, w ¯ ( p e r i o d   1 ) = mean annual growth of basal area of tree i (2007–2009); w ¯ ( p e r i o d   2 ) = mean annual growth of basal area of tree i (2010–2012).
We quantified competition from tree neighbors for each sample tree before and after thinning based on a distance weighted DBH-relation according to [43]. For selection of the competitors, we used two different approaches. First, we multiplied the average nearest neighbor distance (NND) on each plot after thinning by 2 and rounded this to classes of meters. We used the resulting values as competitor search radii (NNDSR) which ranged, depending on stem density, between 3 and 7 m. The search radius (NNDSR) for each plot was also used as the buffer zone/guard distance of each plot. Second, we applied the cone-method suggested by Pretzsch [44] using an inverted cone with an opening angle of 60° at 60% tree height. All neighboring trees that entered the cone of tree i were considered as competitors. For this approach, we used maximum height of the stand to determine the buffer/guard distances to potential competitors outside the plot.
We used the software Croсom Version 2.2 [45,46], for calculations of the competitors on each plot and the calculation of the Hegyi-index before and after thinning:
H g C I i = j = 1 n d j d i . 1 d i s t i j
where, d i = diameter of tree i; d j = diameter of competitor tree j; d i s t i j = distance between tree i and tree j.
We quantified the relative effect of a reduction in competition by calculating CIdiff (absolute competition difference: the difference between the Hegyi-index before and after thinning) and dividing the result by the Heygi-index before thinning (CIrel, Equation (7)).
C I r e l = H g C I 1 H g C I 2 H g C I 1
where, H g C I 1 = Hegyi index of tree i before the thinning; H g C I 2 = Hegyi index of tree i after the thinning.
CIrel (relative competition relief) can reach values between 0 and 1. The higher the value, the greater the reduction in competition. We tested the performance of this method of determining competition with Spearman’s rank correlation [47]. We hypothesized that the rel.gr of larch and birch positively correlate to CIrel. Each tree i in plot j of stand k represents a sample unit. To avoid pseudoreplication, we used a linear mixed model approach (LMM), which includes fixed effects (competition quantified by CI, DBH) and random effects (stand, plot) [48,49]. All models were optimized based on the restricted maximum likelihood method (REML) [49]. We also tested for interactions between initial DBH and CIrel. Criteria for selecting the best model were Akaike‘s Information Criterion (AIC), BIC and the value of the log likelihood, the plausibility of the intercept, the distribution of residuals and the plausibility of the respective model from an ecological point of view. The validity of each approach was evaluated by a standard procedure of regression diagnostics. Outliers were detected and eliminated based on the distribution of internally studentised residuals in QQplots [50] with a 95% confidence envelope. We accounted for spatial autocorrelation within stands in the mixed model procedure [49]. However, in no case was it necessary to incorporate a spatial dependence structure in the model. We then described abs.gr by initial DBH and the difference between the competition effect before and directly after thinning CIdiff of tree i. The following models were finally selected:
a b s . g r i   j k = ( β 0 ) I n t e r c e p t + ( β 1 , i ) D B H + ( β 2 , i ) C I d i f f + ( b 2 , j ) p l o t + ( b 3 , k ) s t a + ε i j k
where β 0 , β 1 , i , β 2 , i , b 2 , j , b 3 , k are the parameter estimates of the intercept, the DBH, the CIdiff of the tree, the plot and the stand (sta) respectively; ε i j k = error term of tree i in plot j of stand k.
The LMM for the description of rel.gr of tree i in plot j of stand k consisted of the following elements:
r e l . g r i   j k = ( β 0 ) I n t e r c e p t + ( β 1 , i ) C I r e l + ( b 2 , j ) p l o t + ( b 3 , k ) s t a + ε i j k
where β 0 , β 1 , i , b 2 , j , b 3 , k are the parameter estimates of the intercept, the CIrel of the tree, the plot and the stand (sta) respectively; ε i j k = error term of tree i in plot j of the stand.
We used the following software packages/routines: Crocom version 2.2 (2001–2006) [45], R-statistics [51] with the packages nls2 [52], nlme [53], ncf [54], car [55], lattice [56], and SAS Version 9.3 (proc nlin).

3. Results

3.1. Characterisation of the Thinning Impact—Non-Spatial Harvest Event Analysis

Thinning weight (rG) ranged from heavy (BII-medium intensity treatment) to very weak (LII-low intensity treatment). Removals on the thinned plots varied between 50.8% (BII-medium intensity treatment) and 9.6% (LII-low intensity treatment) in terms of stem number, and between 52.4% (BI-medium intensity treatment) and 5.4% (LII-low intensity treatment) in terms of basal area. Overall, removals on the plots with smaller mean diameters (I-series) tended to be heavier than on the plots with larger mean diameters and less stem density (II-series) (Table 3). The stem number–basal area ratio (NG-ratio) and quadratic mean diameter (Dg) showed a positive relationship: NG-ratio above 1 led to a higher Dg, indicating thinning from below; NG-ratio below 1 led to a lower Dg, indicating thinning from above. The NG-values and changes in the Dg indicated predominantly thinnings from below (Figure 2 and Table 2). The plots with the smaller diameters (I-series) showed the strongest relative growth with regard to basal area after thinning (Table 3). Stem number and Dg on some plots indicated that the increase in basal area in the years after thinning was due only to the growth response of the remaining trees (LII medium intensity treatment, BII low intensity treatment), whereas on other plots the increase was also due to ingrowth of young trees (e.g., BI medium intensity treatment, LII low intensity treatment). Over the course of the observations, the Dg changed more strongly on the thinned plots than on the unthinned plots. The actual thinning effect becomes clearer when focusing on the strongest trees only. The mean diameters of the top 200 larch trees per ha remained nearly unchanged after the tree removals. In contrast, for birch, a slight reduction in mean diameter of the top 200 trees was observed indicating that some of the larger trees were harvested (Table 4). The diameter coefficient of variation (CV or DBH-differentiation according to von Gadow and Hui [57], respectively) on the plots did change only little (Table 3). However, on all plots of the II-series, the CV decreased slightly in response to thinning. The dominant height of the main species was only slightly affected by thinning.

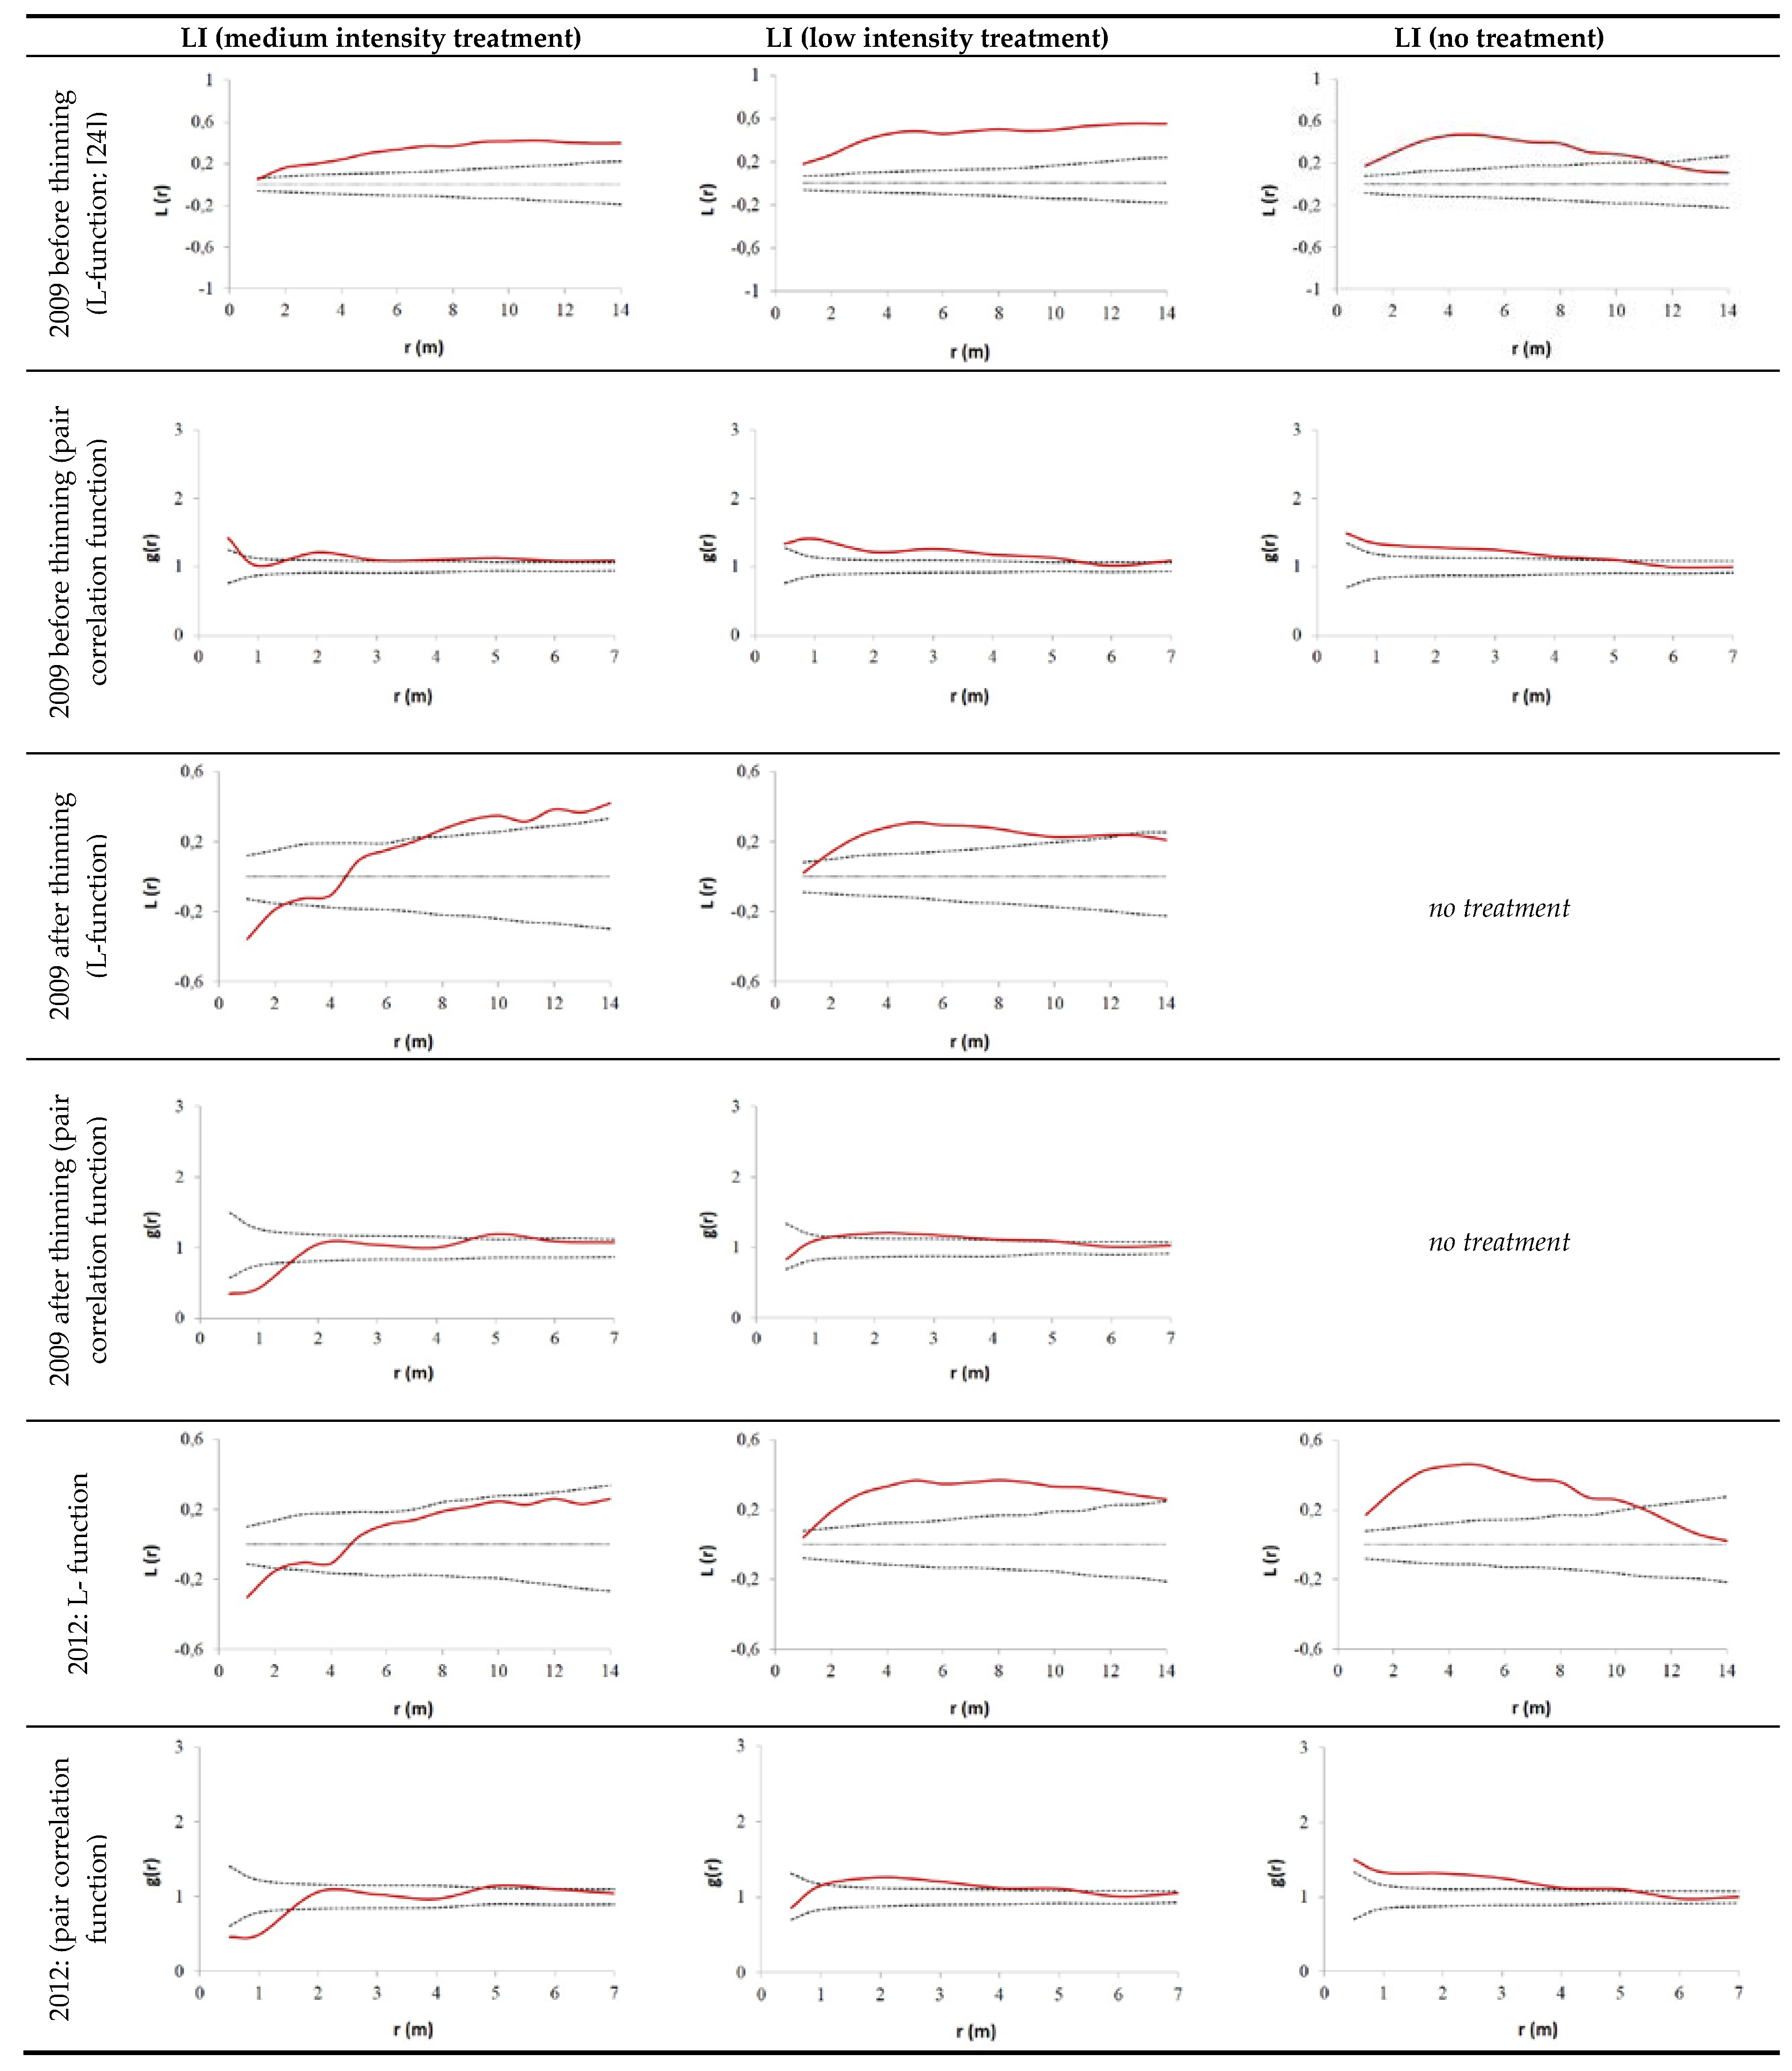
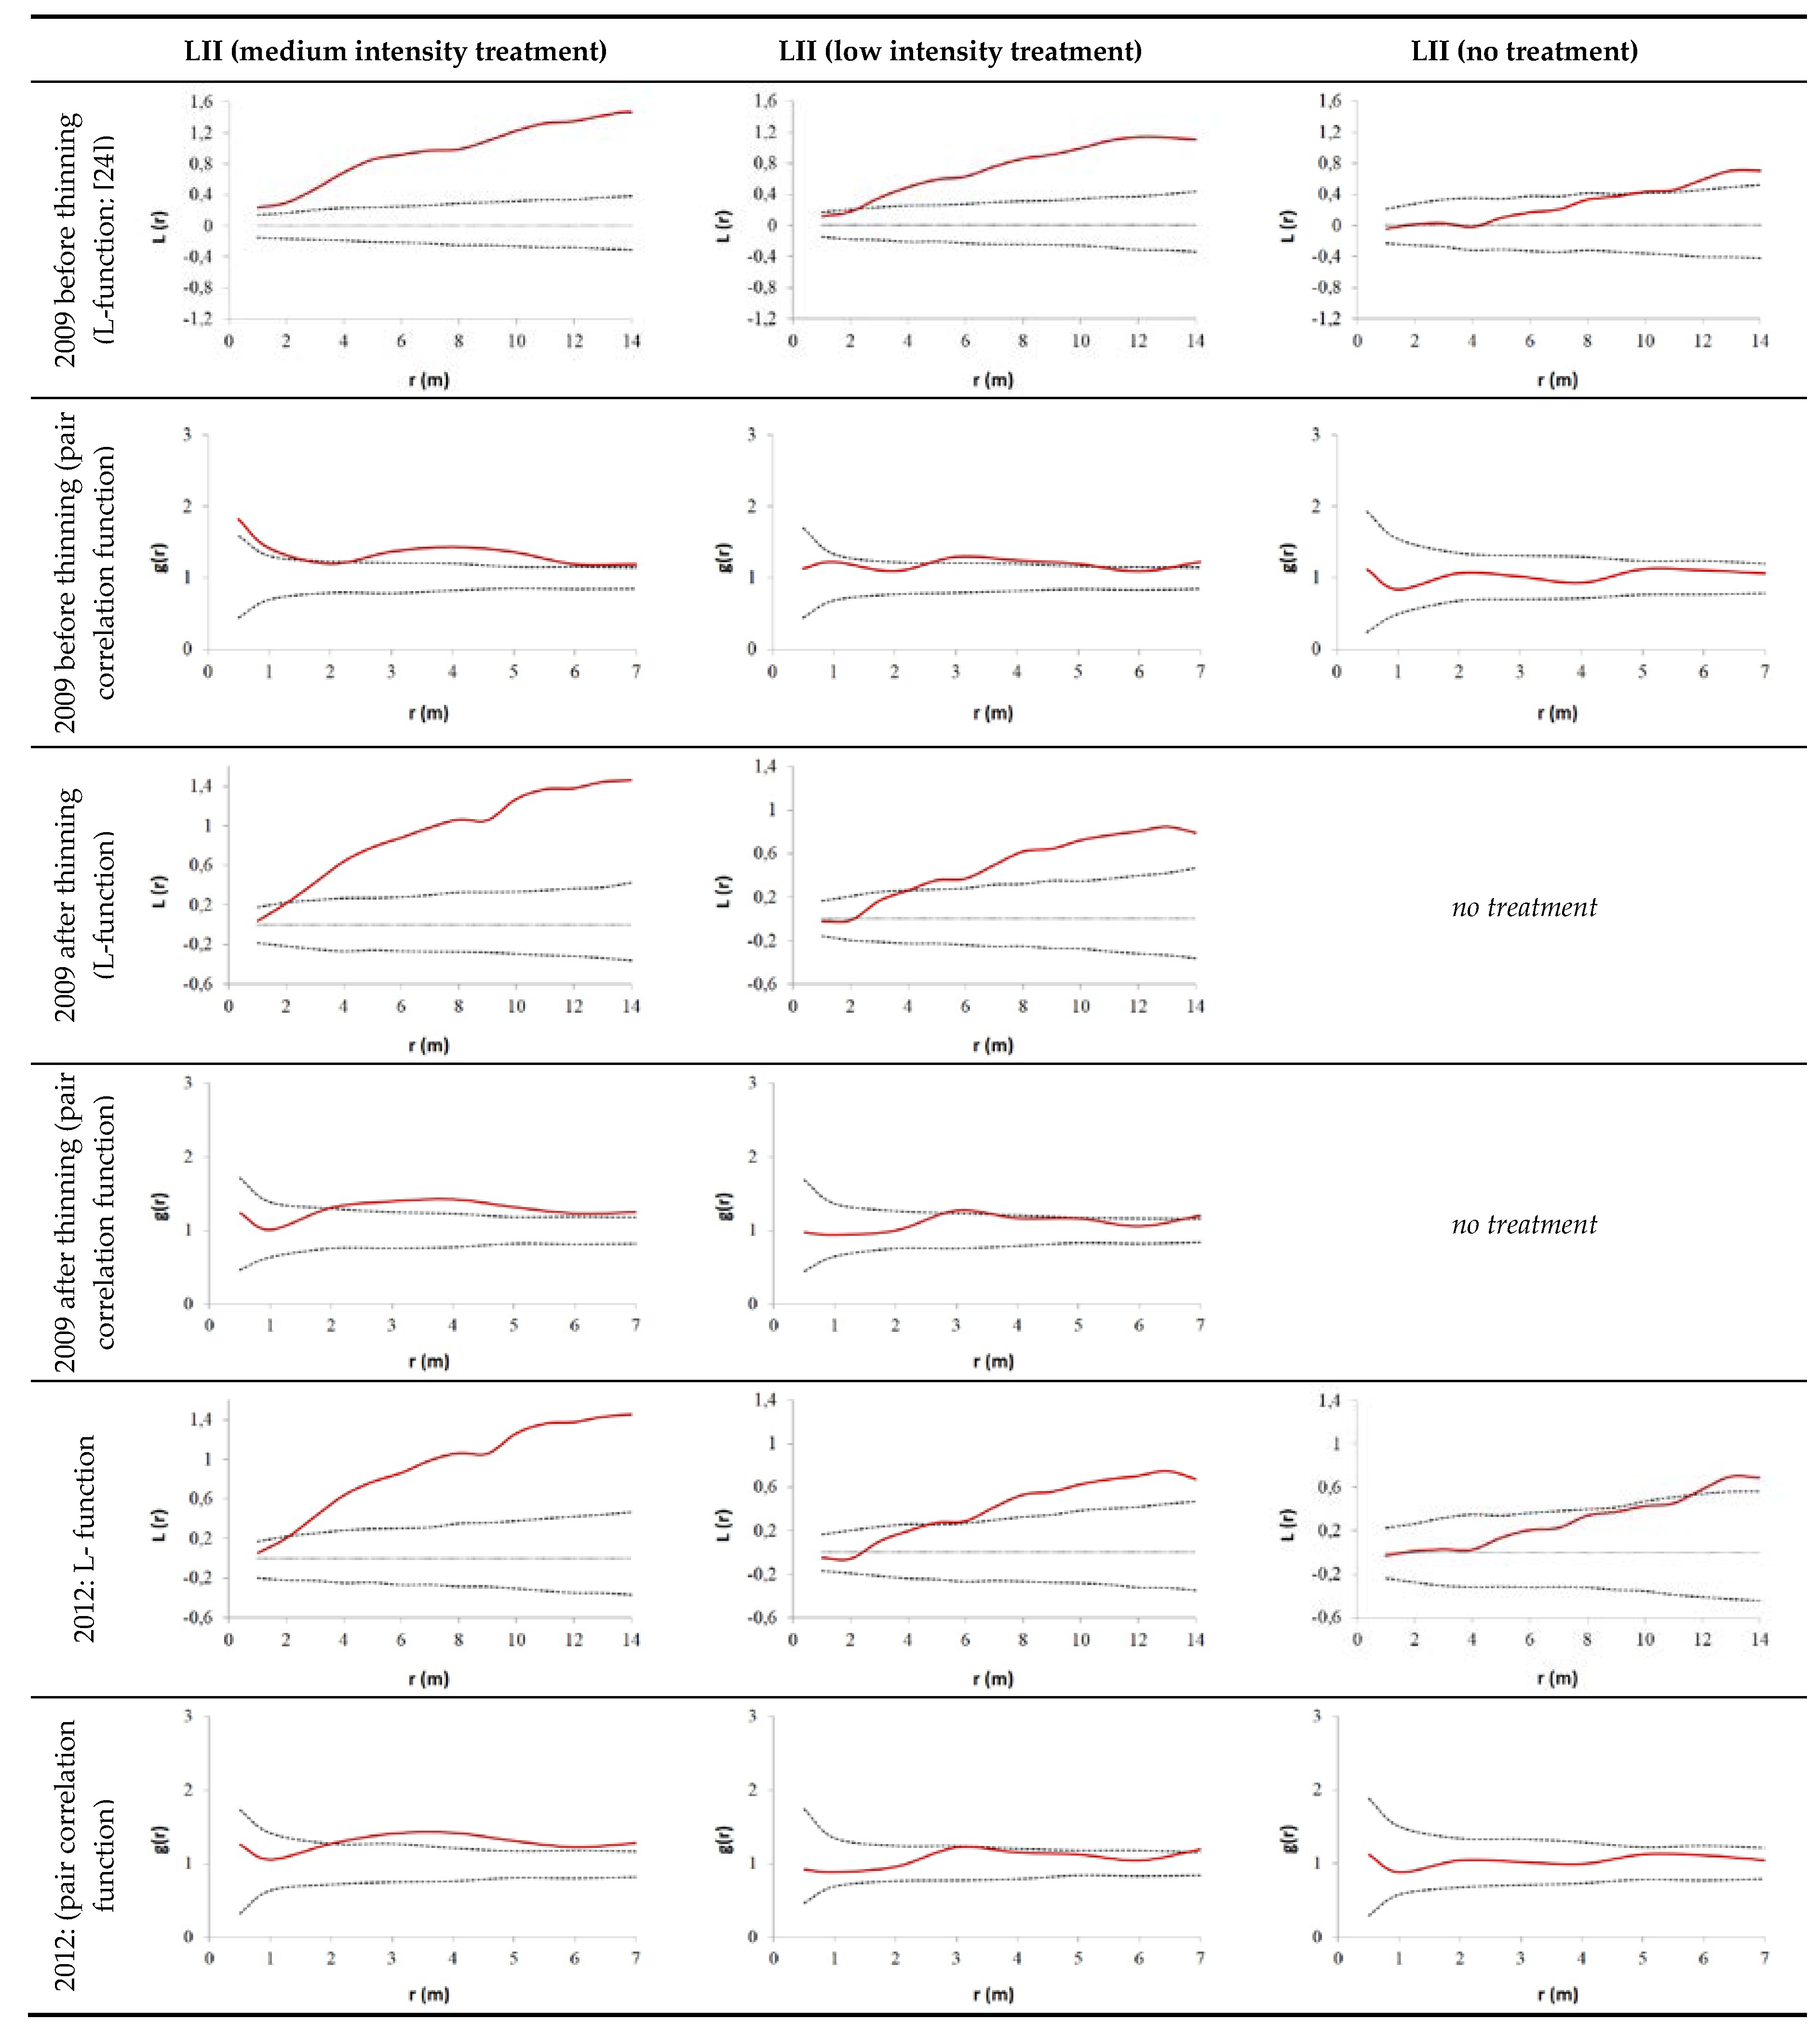
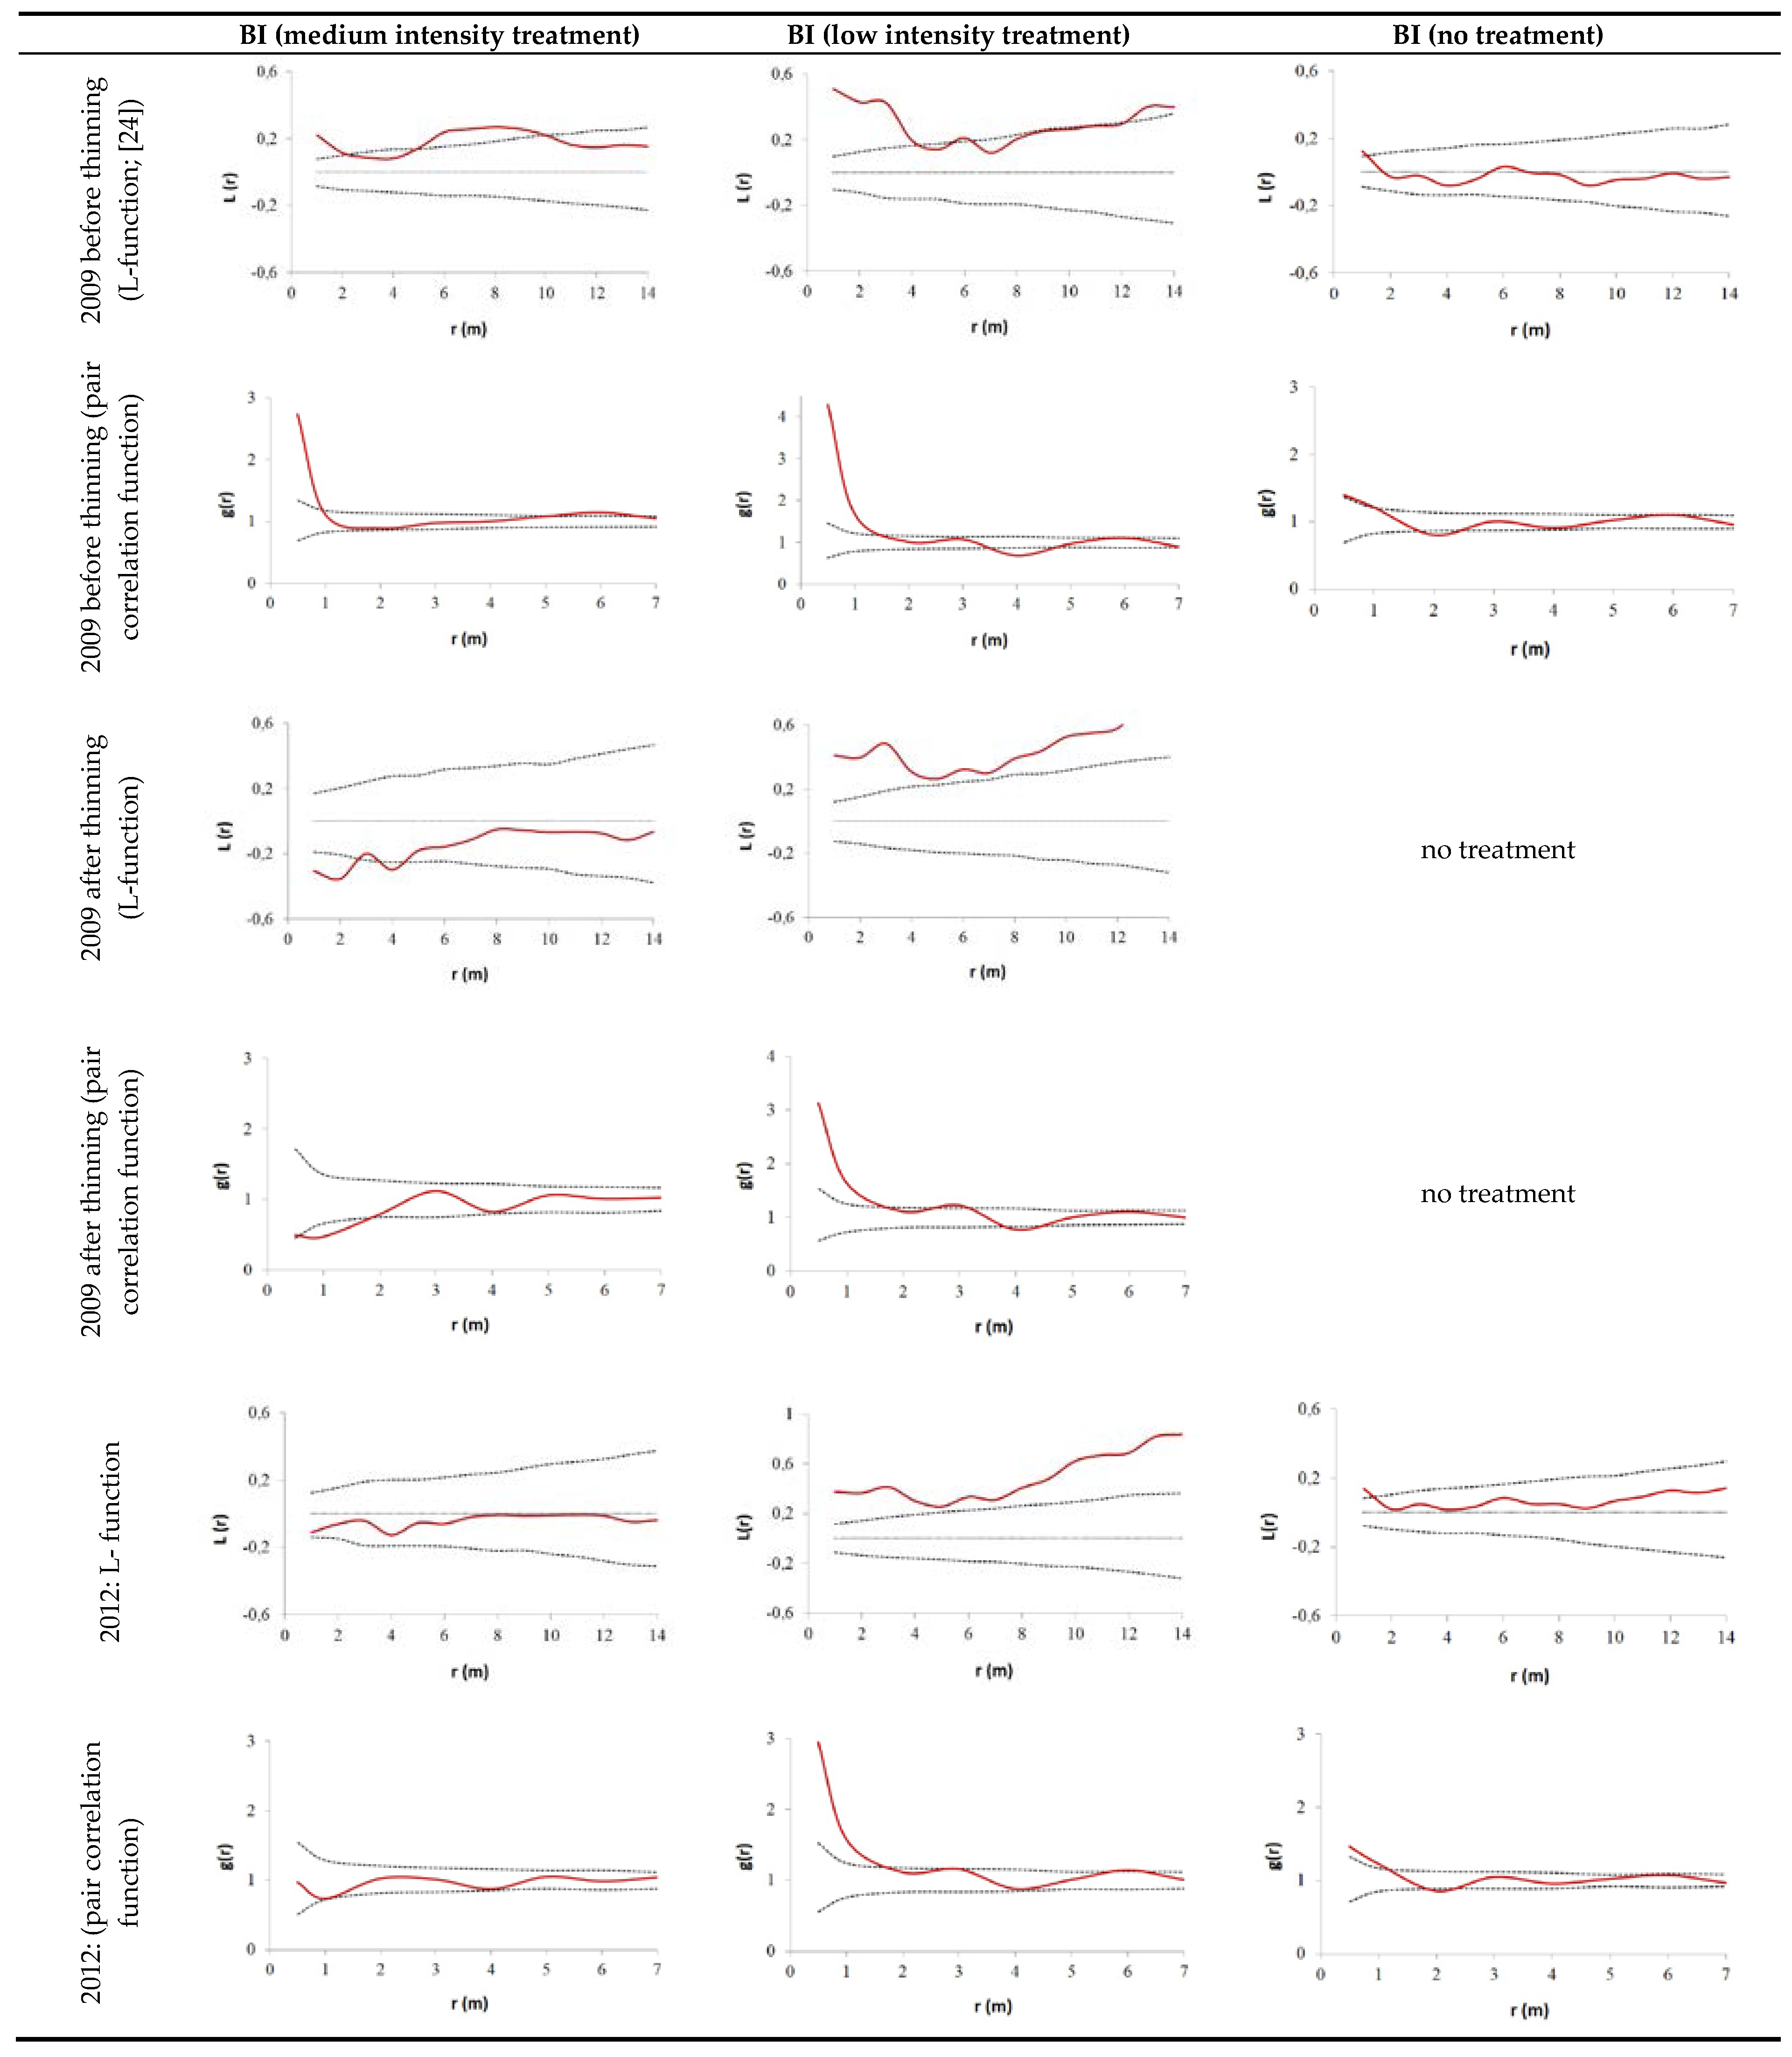
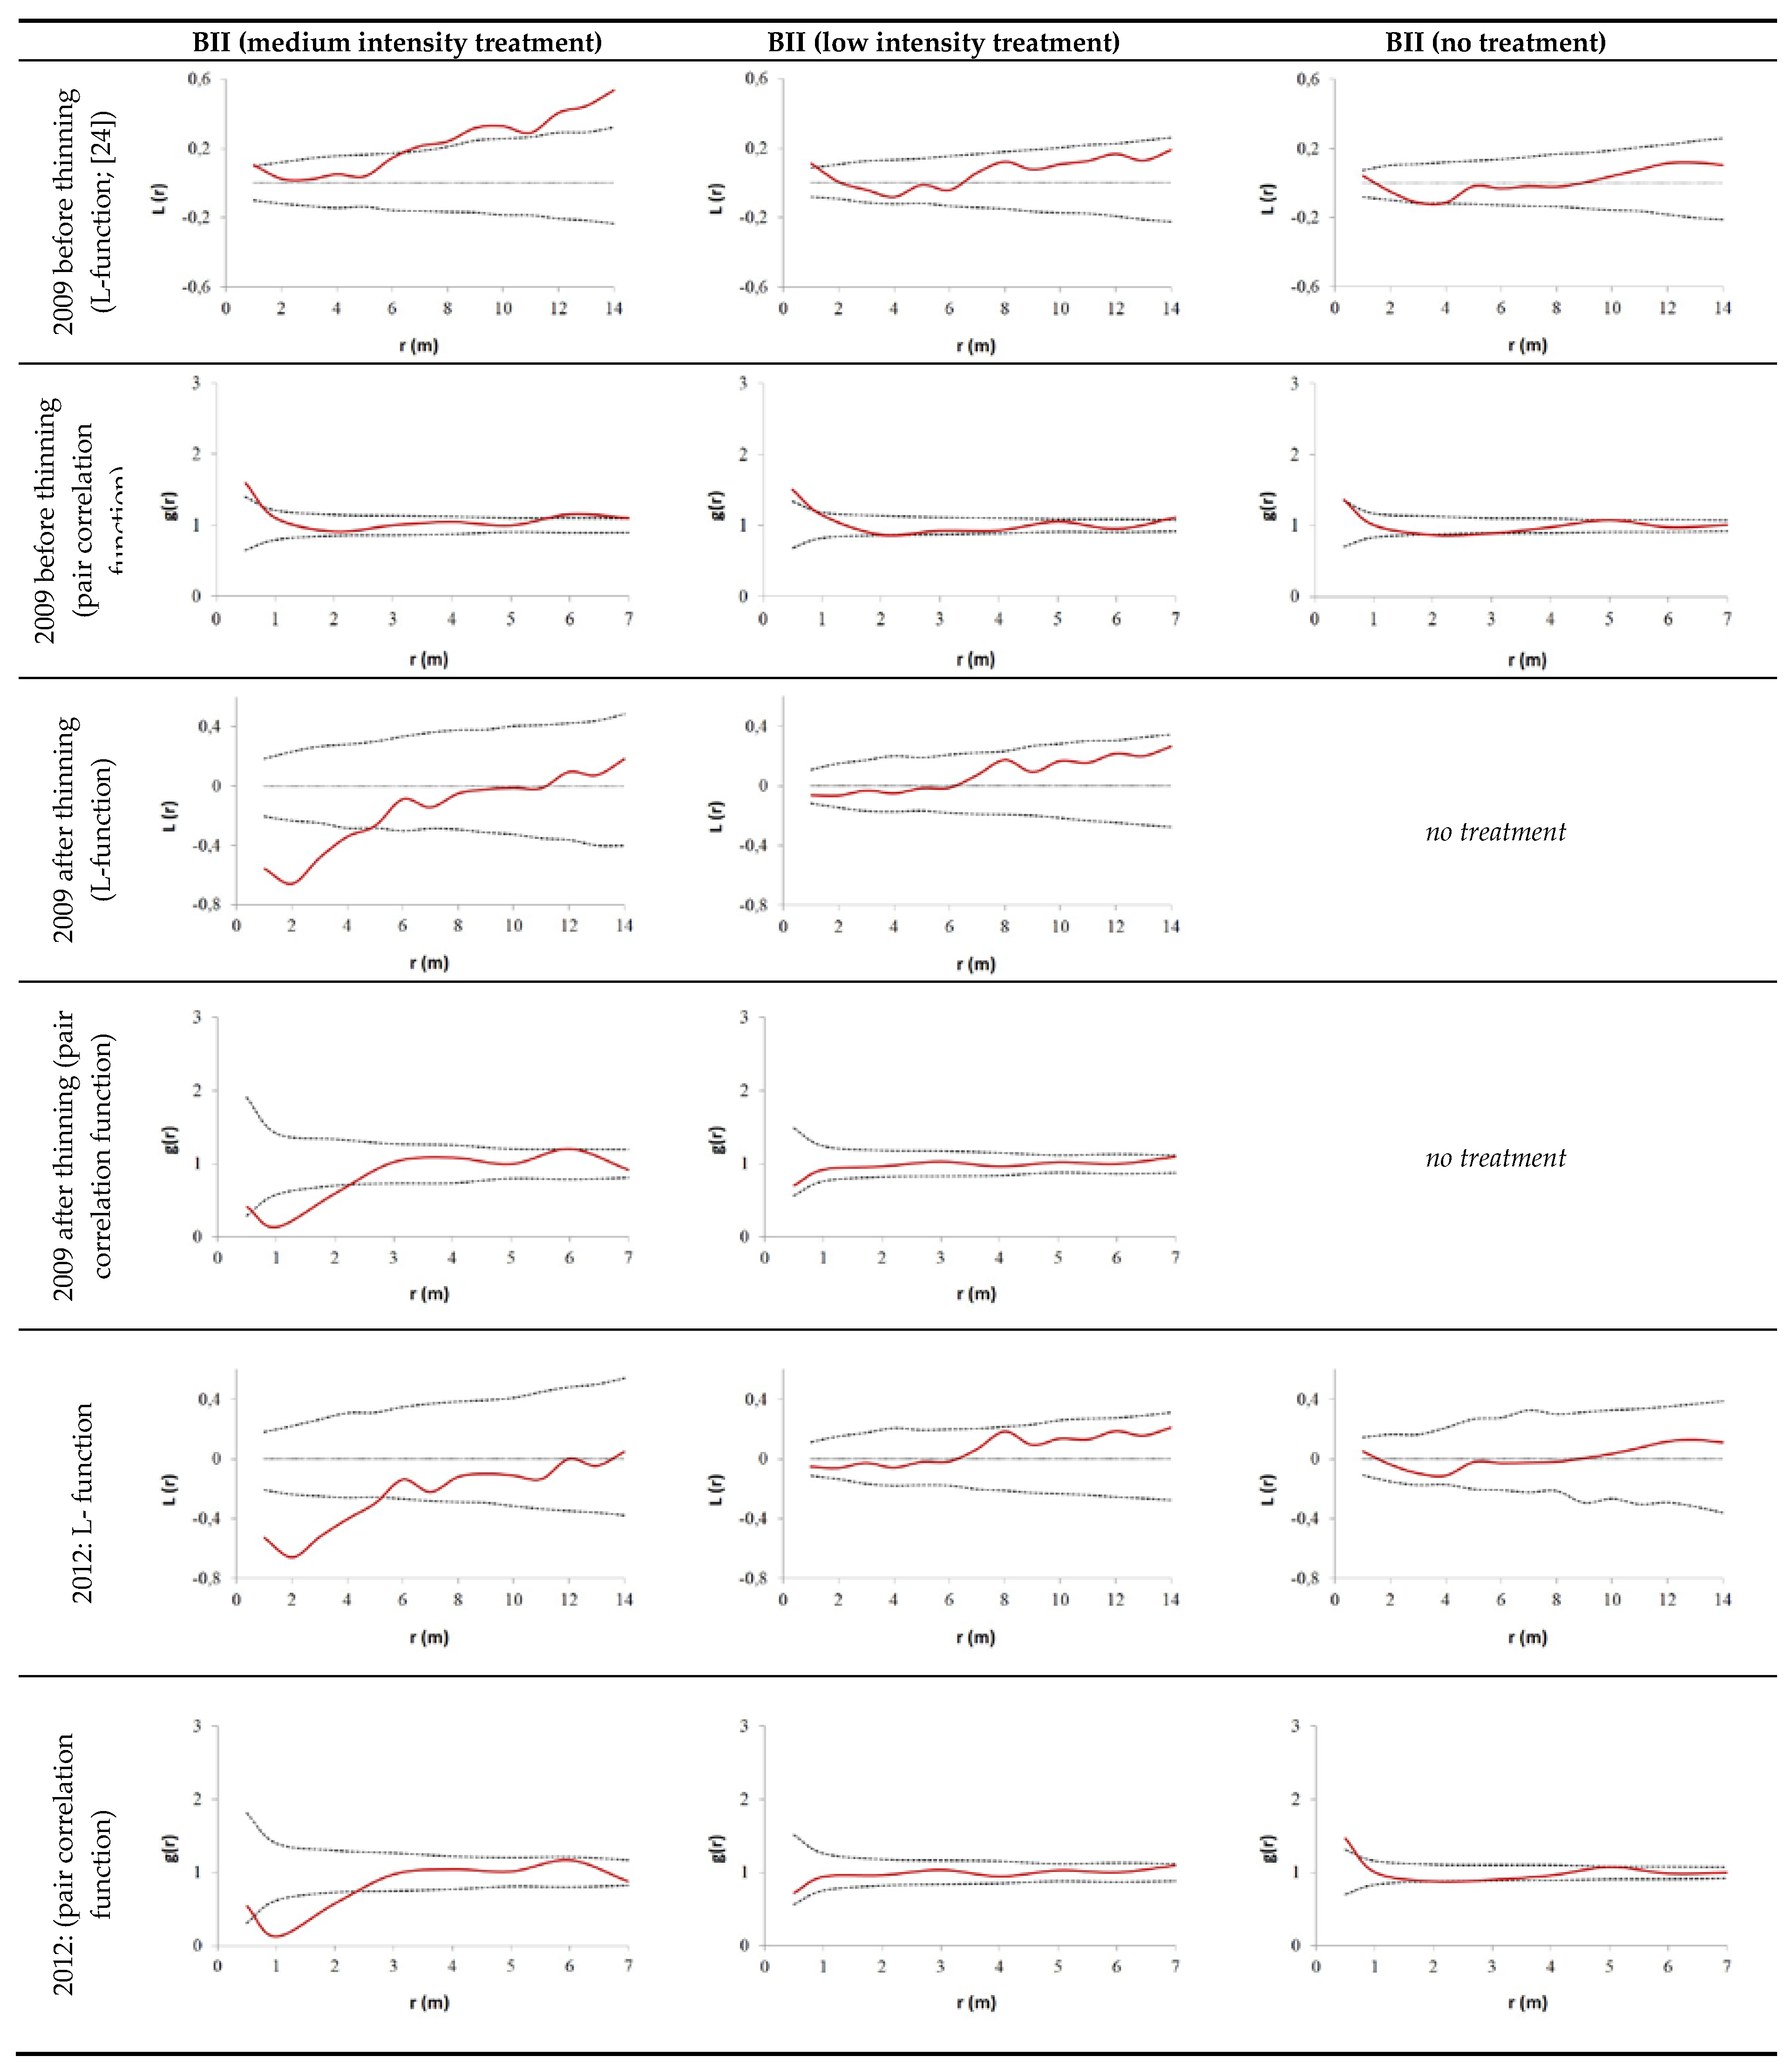
3.2. Thinning Impact on Spatial Tree Distribution Pattern

Both pair-correlation and L-function analyses before thinning indicated initially clumped to random tree distributions on the birch plots of the BI-series (Figure 3) and largely random spatial tree distributions on the plots of the BII-series (Figure 4). Pair correlation functions indicated clumping especially over very short distances (less than 2 m). The larch plots of the LI-series exhibited clumped tree distributions (Figure 5) and the LII-series exhibited clumped to random spatial tree distributions before harvest (Figure 6). The pair correlation functions of the larch plots (Figure 5 and Figure 6) indicated that clumping was less pronounced, but occurred over a greater distance when compared with the birch plots (Figure 3 and Figure 4). On most plots, the spatial distribution was strongly affected by thinning. The thinning intervention reduced clumping and resulted in a more uniform distribution. Some patterns shifted toward a significant regular distribution pattern even at lower distances; see especially medium intensity treatments in BI, BII, LI (Figure 3, Figure 4 and Figure 5). Three years after thinning, some of the plots had buffered some of the thinning effects by ingrowth of stems (see e.g., BI-medium intensity treatment; Figure 3), developing away from the observed thinning event-induced regularity. On the plot BI-low intensity treatment, thinning even appeared to result in a significantly clumped spatial tree distribution (Figure 3).

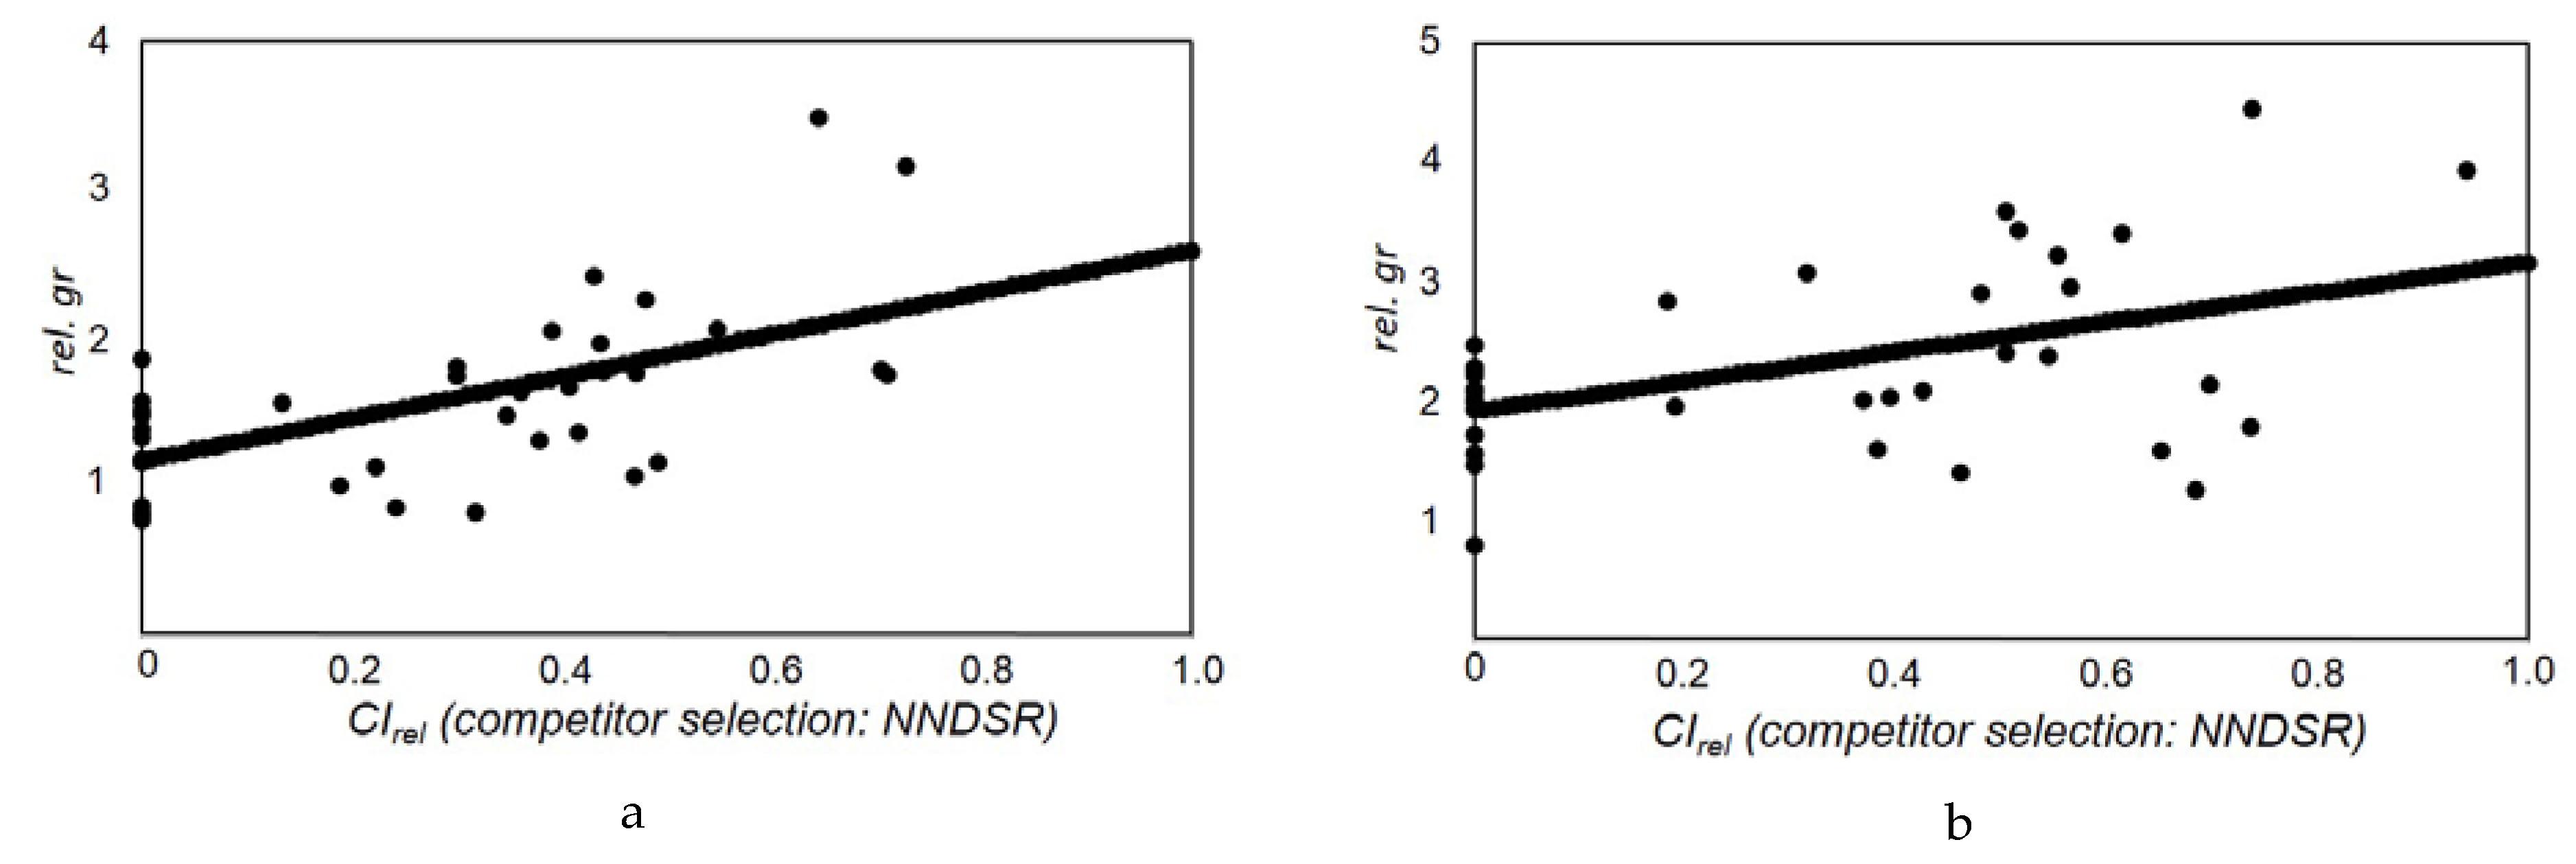
3.3. Quantification of Thinning Impact on Growth of Birch and Larch Trees

Competition significantly affected growth of both tree species. However, both growth and the correlation between competition and absolute growth before thinning was higher for larch (Figure 7) than for birch. Both explanatory approaches (abs.gr and rel.gr) for growth after thinning resulted in significant p-values for the exploratory variables. The absolute competition difference (CIdiff) and initial DBH and the relative competition relief (CIrel) significantly influenced both absolute basal area growth and the relative change in basal area growth (Table 5). Though the lowest AIC values were achieved with the abs.gr-model approach, results of the rel.gr-model are noteworthy. They confirm that the relative change in growth of both larch and birch could be explained, in part, by CIrel, indicating a positive effect of a reduction in competition on the relative increase of tree growth in our study plots three years after the intervention (Table 5). The p-values of the intercept were also highly significant for all rel.gr-models. The values for each species, however, differed (Table 5). Figure 8 provides a graphical representation of the relation between CIrel and rel.gr.

4. Discussion

4.1. Stand Level: Non-Spatial Forest Structure

Our short-term observation/monitoring of the non-spatial structure showed (i) that diameter distribution and diameter CV were not greatly changed by thinning, that (ii) on all plots BA growth, and that (iii) on most plots the ingrowth of young trees was promoted by thinning. An increase in stem number and basal area in the short period after the harvest events was noticeable. It was strongest for birch-series I and demonstrated that, in the studied forest type, thinning led to growth release of the remaining trees and promoted the ingrowth of smaller trees. Both responses are in line with findings from many other forest types [58,59,60]. The ratio between removed stem number and removed basal area (NG-ratio) indicated that, on most plots, smaller trees were preferentially removed, indicating thinning from below. This was also indicated by measured changes in the quadratic mean diameter (Dg). The shape of the diameter distributions and the diameter CV before the harvest event were largely retained, although the lower diameter classes decreased proportionally more than the larger diameter classes. Results confirmed earlier findings that thinning can have positive effects on total yield [22,61,62].

4.2. Stand Level: Spatial Forest Structure

Our results showed that two of the birch I plots in particular exhibited a special clumping structure with strong clumping at very short distances before thinning, indicated by the pair-correlation functions in our study (Figure 3). This was due to sprouting, common among many birch species. Clumping in the larch was often less pronounced and occurred at the medium and larger distances, indicating both larger sized and relatively less closely packed groups of single trees. Clumping seems to be a characteristic feature of the disturbance prone birch and larch forests in Mongolia [24,63]. However, one reason for the observed differences in the structure and clumping ranges between the two species is that larch is not able to sprout. Different clumping tendencies are common for unthinned stands, and can occur even where trees were planted [64]. The observation that the spatial tree distribution pattern tended towards regularity after thinning is common for many selective harvest regimes, as described for thinned larch plots in Northern China [64]. On our plots, thinning mostly promoted “de-clumping” and a tendency towards regular or random distribution. The same was found in other studies, e.g., in Norway spruce stands [65]. In the RA Altansumber, this thinning effect was, however, counterbalanced by the ingrowth of new trees, which on some plots reversed the thinning effect. These observations demonstrated that forest stands have the potential to “buffer” thinning effects; the spatial structure showed a certain degree of resilience. In a recent profit optimization study, Pukkula et al. [66] concluded that for forest stands with irregular (clumped) tree distribution, the most profitable option is to remove the smaller trees in densely stocked areas and leave larger trees in sparsely stocked places. This recommendation is similar to the thinning approach in Altansumber.

4.3. Single Tree Level

Our results showed that the basal area growth response of both pioneer species was significantly positively influenced by a reduction in competition within a relatively short time period. However, the intercept values (growth at CIrel = 0) of the rel.gr model (Table 5) indicated that, independent of the significant impact of competition reduction, the growth conditions for both species had already improved in the period after thinning compared to the period prior to thinning. A comparison of the annual course of the main climate factors (precipitation and temperature; Sukhbaatar station) between the period before and after the thinning showed low indication of better climate conditions in the period after the thinning: in the period after the thinning, the monthly precipitation was, on average, higher and the monthly temperature slightly lower up to beginning of June (see diagram in supplementary; Sukhbaatar station). It was shown that in the RA Altansumber growth is positively correlated with higher precipitation in late winter and early spring (young birches [67] and larch [68]) and negatively correlated with temperature (young and old birches [67]). However, across-years competition reduction triggered absolute and relative tree growth in both birch and larch stands (see p-values for CIdiff and CIrel in Table 5). This was also significant in the years before the thinning (Figure 7). This finding, which is in line with numerous studies in other forest types [21,69,70,71,72,73], is important for the current discussion on regional forest management in Mongolia. The ability of the remaining trees to positively respond to competition relief was significant despite the fact that some trees had already reached a considerable age. Most studies from Mongolia concluded that water availability is the most decisive factor affecting vegetation and tree growth in the region [5,41]. It is well known that thinning improves the water availability of the remaining trees [21,22]. However, as competition reduction permits better utilization of light for photosynthesis as well, our results showed that light is a key resource even in in the rather open forest stands of the Mongolian mountain forest steppe. The less clear relationship between competition and BA-growth for birch (Figure 7) may be due to the disturbance sensitivity and stem shape of this tree species. Birch is more sensitive to low intensity surface fires, which are very common in the region, than trees with thicker bark such as larch [10]. It also may be that the competition index used in this study may be better suited to larch trees than to birch individuals. Larch grows straight and the crown competition is more or less represented by the stem position. In contrast, birch often grows in a curved shape, partly due to coppice regeneration. Crown competition may therefore be less accurately reflected by stem position.

4.4. Management Issues: Development of a Mongolian Silviculture

In Mongolia, larch is the preferred tree species for various products, whereas birch has played a very small role in forest economic terms to date. In terms of wood production, it is therefore important to know if larch wood quality is negatively affected by thinning. A study on different larch species from plots in Sweden [74] found that ring widths greater than 3 mm were associated with a marked reduction in wood density. However, the average annual ring width of the target trees of our study were, even in the years after thinning, below this threshold. The nomads in Selenge aimag and other Mongolian regions rarely use birch, even for firewood, but continue to rely on larch, despite the fact that, due to over-utilization, larch is increasingly being replaced on a largescale by birch in some accessible areas [3].
Due to the increase in birch distribution over the last decades, it would be useful to support and develop new products and markets for this tree species in Mongolia (e.g., charcoal production). This could also help to avert overharvesting of the remaining larch trees close to the settlements. In Fennoscandia, pure and mixed birch stands are managed to produce high quality saw timber or plywood [14], which may be, in the long term, an option for Mongolia as well. Thinnings and cleanings could provide energy wood for local markets and simultaneously increase stand quality and shorten rotation periods. Studies on silver birch suggest that density and wood quality, for example, are not reduced by its more rapid growth [75,76]. In Finland, the first commercial thinning for planted silver birch stands is recommended at 13–15 m stand height to a density of about 700–800 trees/ha. It is suggested that the second commercial thinning be done about 15 years after the first thinning [14]. In general, high thinning intensities, from 30–40 percent, are applied to birch stands [14,77,78]. However, Mongolian forests differ from the intensively managed forest stands in Finland in density, age, spatial structure, and dead wood [6]. Environmental conditions also differ. The soils of the larch plots in the RA Altansumber exhibit neutral to alkaline ph-values and experience permafrost at depths below approximately one m [79]. Insular permafrost is typical for this region and is important for supplying sufficient water throughout the vegetation period, especially in dry summers [80]. Exposition and sunblocking forest cover result in the disjunctive occurrence of permafrost [81,82]. This is one reason why continuous cover forestry systems [17,30,83] are considered a preferred option. Shelterwood systems are, for example, proposed for natural regeneration in birch stands in northern Europe [84,85]. Our results indicate that even under the harsh conditions of the Mongolian mountain forest steppe, more methodical and scientifically based forest management, comprising, among other strategies, repeated thinnings, could be established.

5. Conclusions

Forests close to the settlements are likely to experience more, not less, utilization pressure in the future. It is therefore necessary to identify and enact sustainable management approaches (regional silvicultural treatments) and appropriate control measures to ensure ecologically sound management and to provide direction for forest utilization. The results of our study indicate that birch and larch trees respond to thinning with significant increases in absolute and relative growth. This finding could be a starting point for developing comprehensive forest management guidelines for both the larch and birch dominated stands. Reference plots and thinning trials, as shown in the example of the plots in Altansumber, can serve as a basis for analysis of silvicultural measures, training of prospective forest managers and creation of specific thinning models as well as providing a cooperation instrument for stakeholders with widely varying needs.

Supplementary Materials

The following are available online at https://www.mdpi.com/1999-4907/8/4/105/s1, Figure S1: Comparison of the climate factors precipitation and temperature for the period before the thinning (2007-2009) and the period after the thinning (2010-2012), Figure S2: Non-spatial harvest event analysis of the Altansumber birch and larch thinning trials; grey: trees remaining after thinning; black: trees removed during the thinning, Figure S3: L-function and pair correlation function of the plots in stand BI before and after the thinning in 2009 and at the end of the observation period in 2012, Figure S4: L-function and pair correlation function of the plots in stand BII before and after thinning in 2009 and at the end of the observation period in 2012, Figure S5: L-function and pair correlation function of the plots in stand LI before and after thinning in 2009 and at the end of the observation period in 2012, Figure S6: L-function and pair correlation function of the plots in stand LII before and after thinning in 2009 and at the end of the observation period.

Acknowledgments

The plots in Altansumber were established during the UNFAO-project „Capacity Building and Institutional Development for Participatory Natural Resources Management and Conservation in Forest Areas of Mongolia” (GCP/MON/002/NET), financed by the government of the Netherlands. Field work was carried out with the School of Agroecology and Business, Institute of Plant and Agricultural Sciences of the Mongolian University of Life Sciences in Darkhan. The authors thank numerous students from the Mongolian University of Life Sciences in Darkhan for their assistance during the reassessment of the plots and collection of wood cores in 2012 and for financial support provided by DAAD (research grant D/12/41577). Increment borers were provided by the Department of Wood Biology and Wood products (Göttingen). We are thankful to Stefan Teusan, Albrecht Bemmann, Björn Günther, Claus-Thomas Bues, Jamsran Tsogtbaatar, Heinz Röhle and Michael Mühlenberg for their support. Additional thanks go to Kathleen Regan for linguistic corrections.

Author Contributions

A.G. and O.N. conceived and coordinated the research project. A.G., B.G., O.N. and B.D. designed data collection. A.G. and O.N. did the field work with support of B.G. and B.D. A.G. under supervision of S.W. and C.A. analyzed the field data. A.G. wrote the paper and all co-authors commented on it. C.A. and S.W. revised it.

Conflicts of Interest

The authors declare no conflict of interest. The founding sponsors had no role in the design of the study; in the collection, analyses, or interpretation of data; in the writing of the manuscript; and in the decision to publish the results.

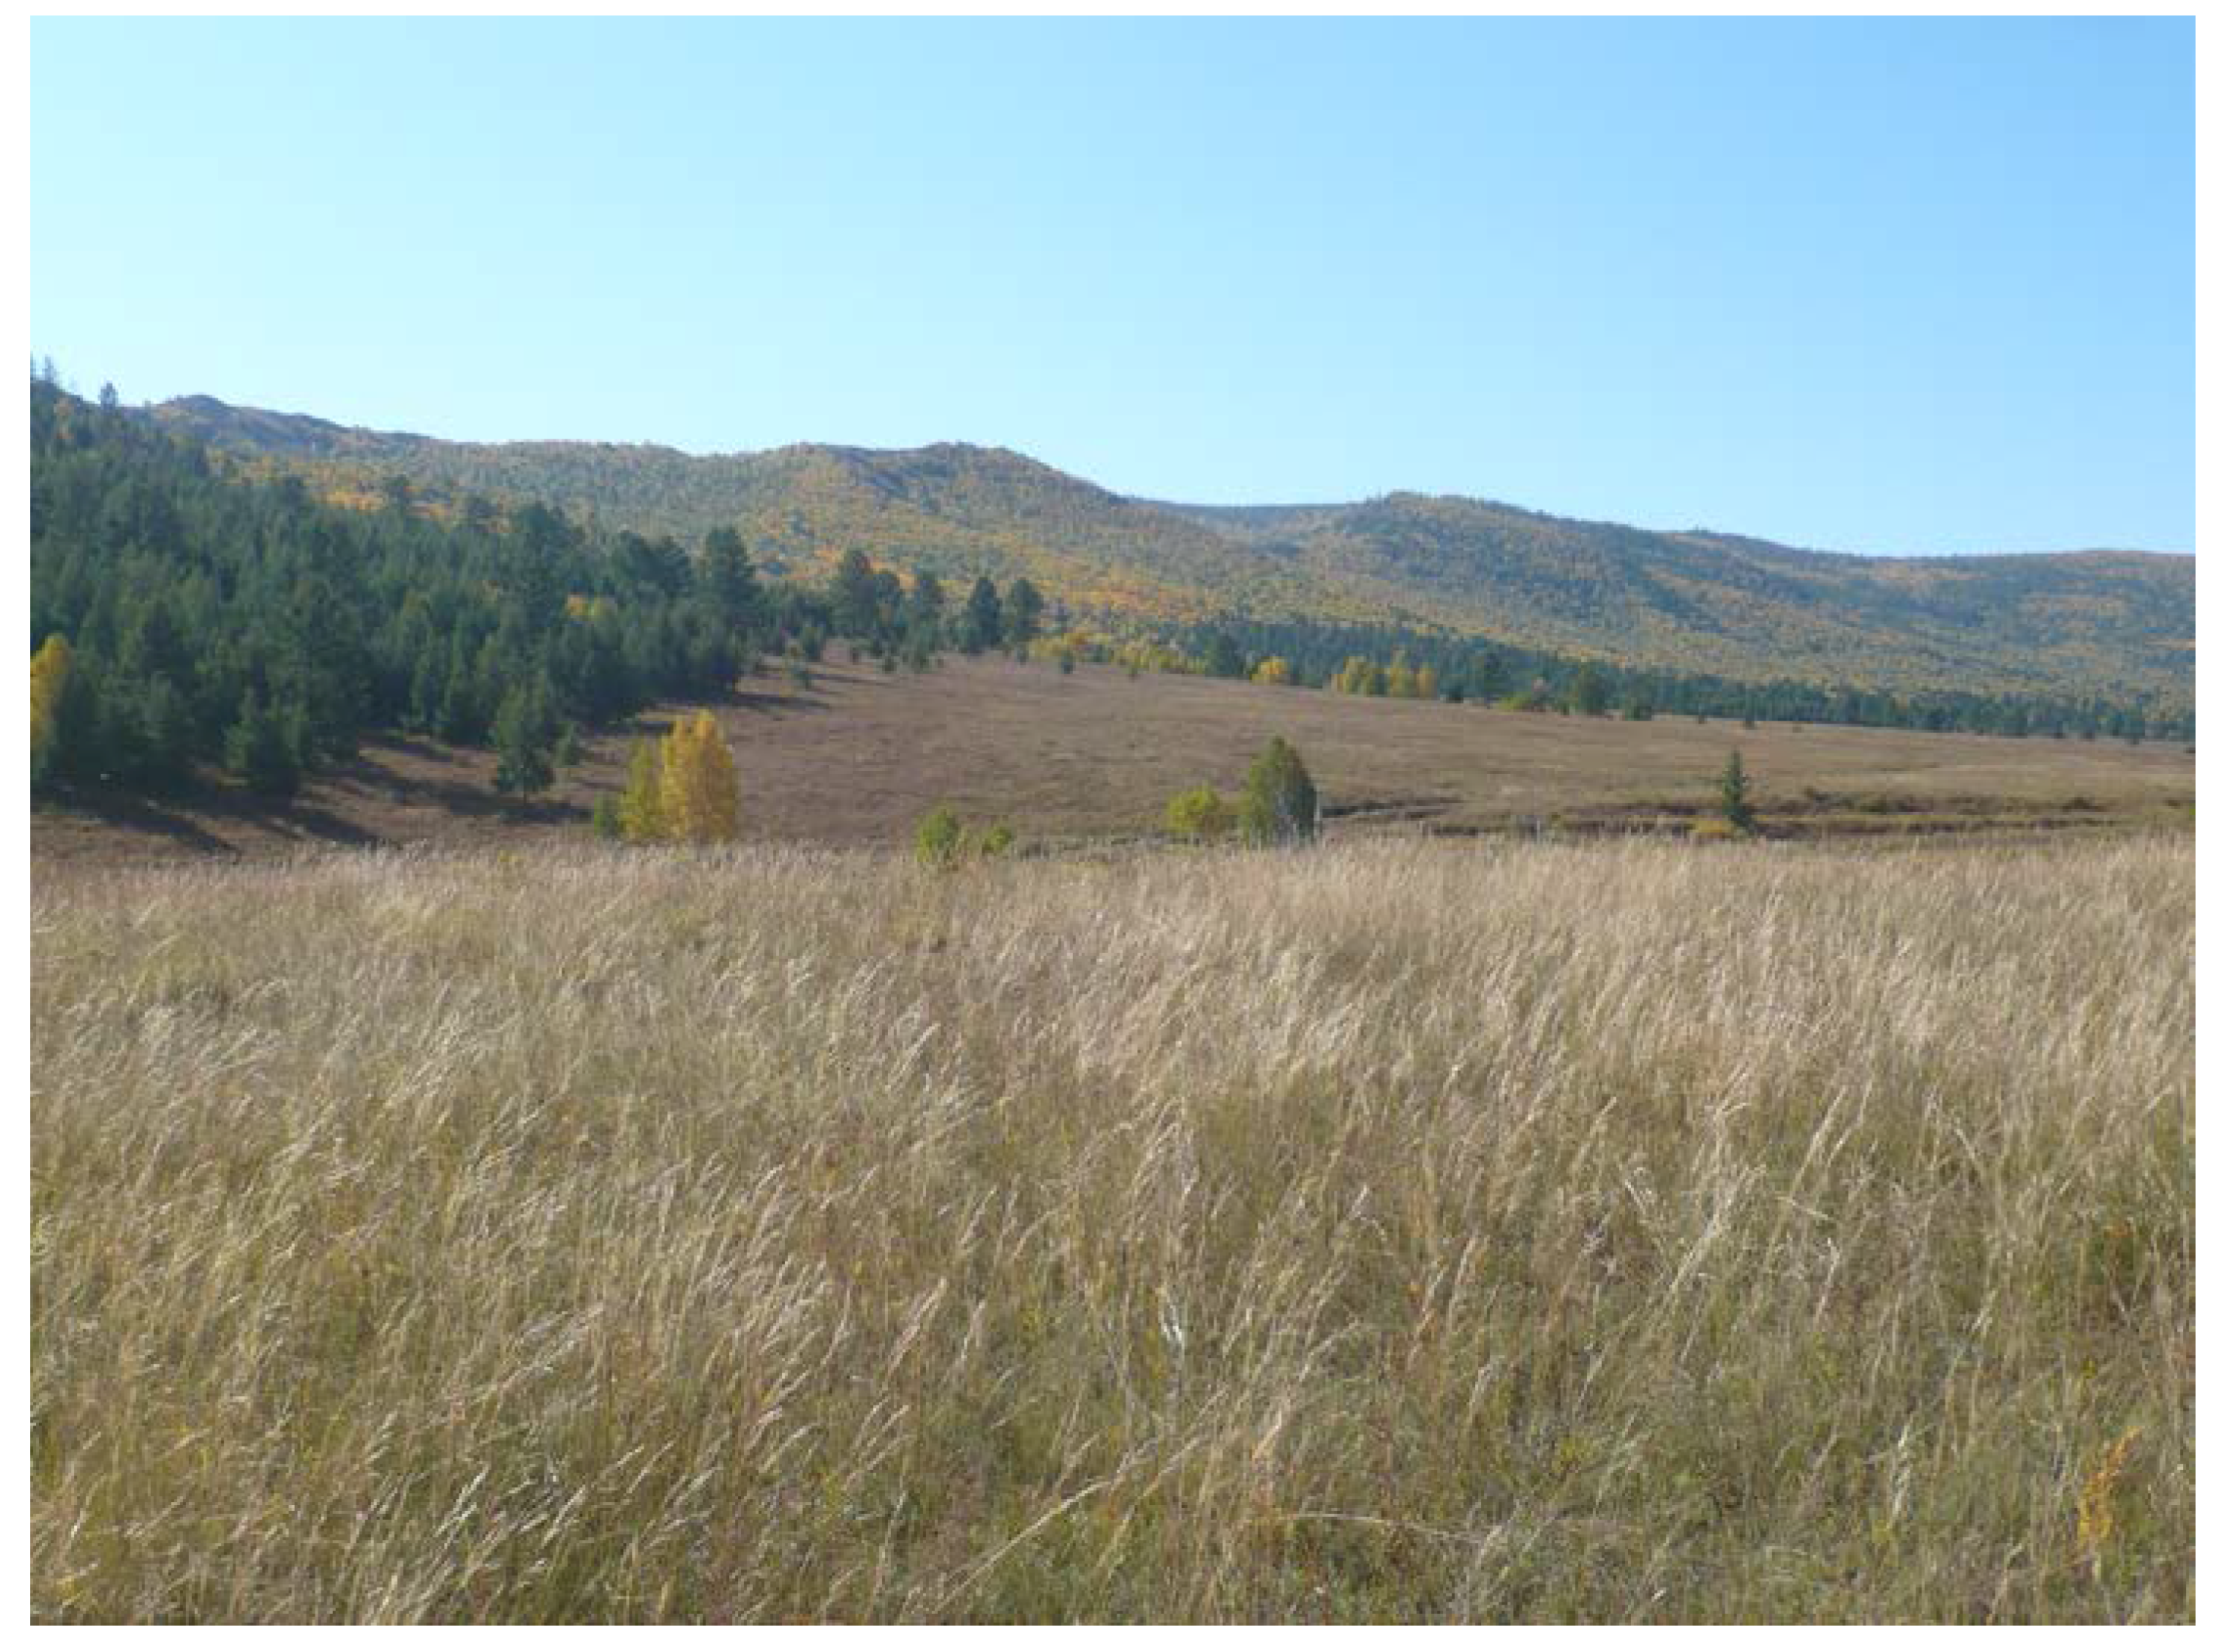
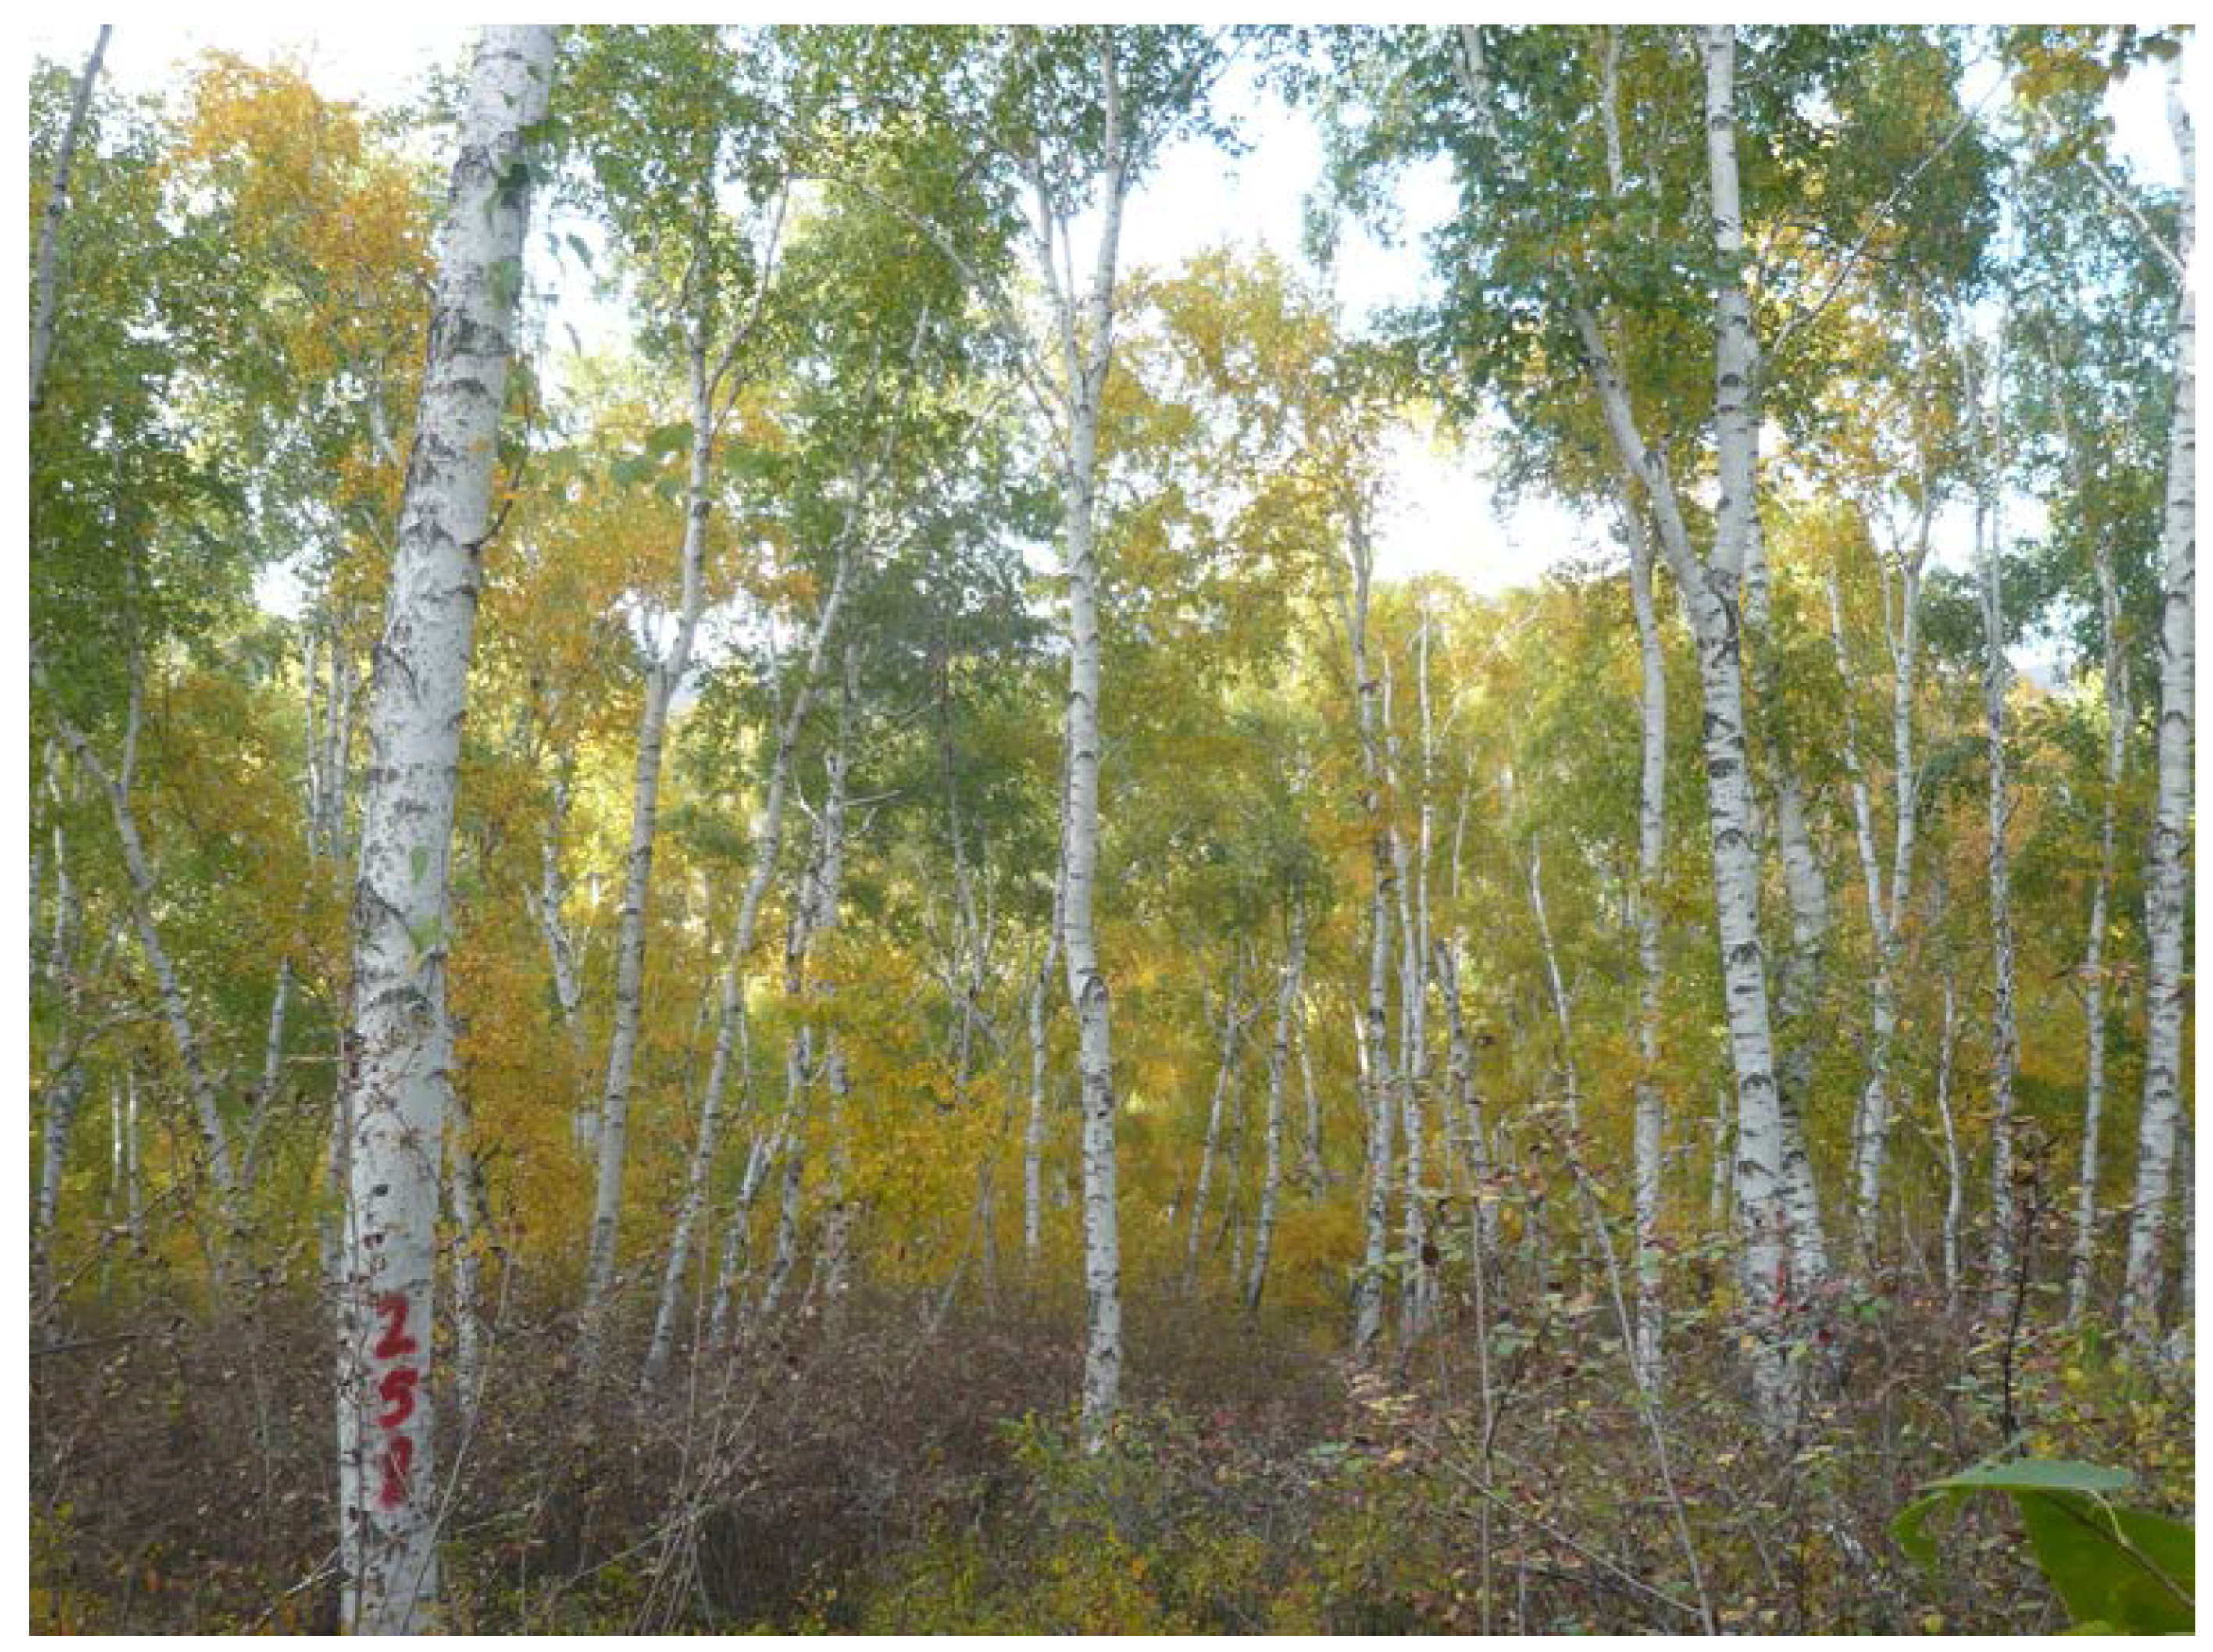
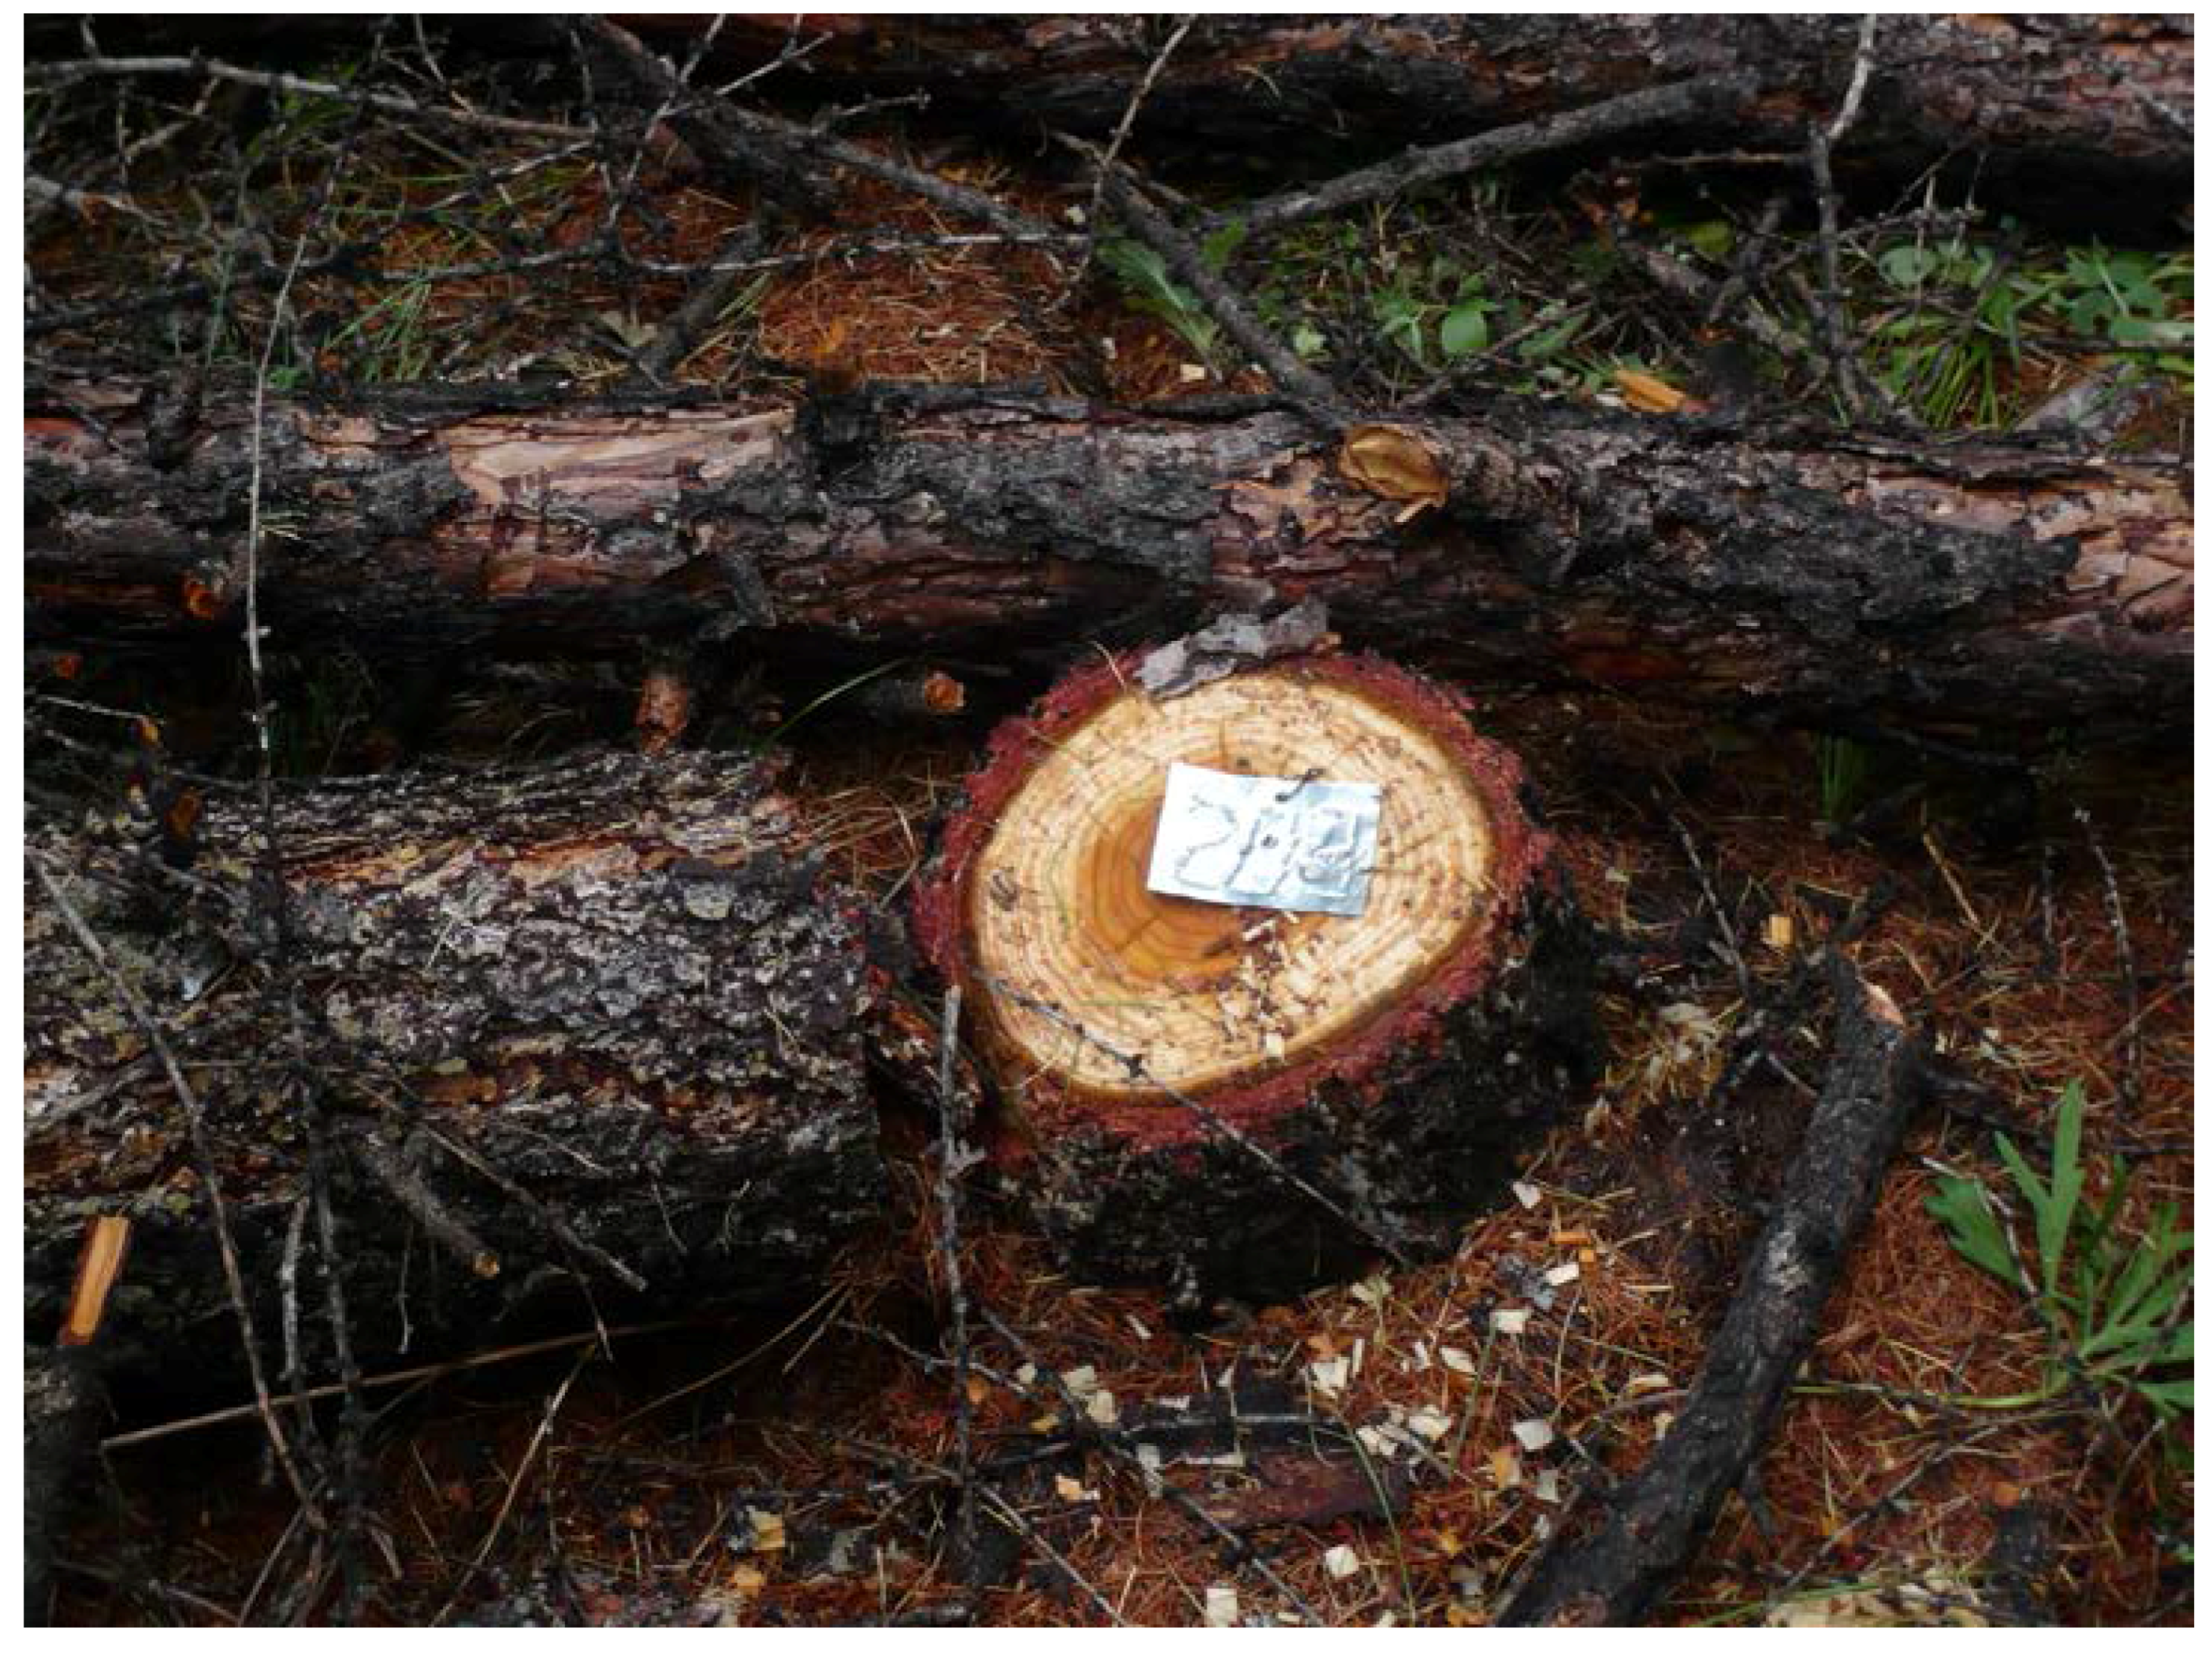
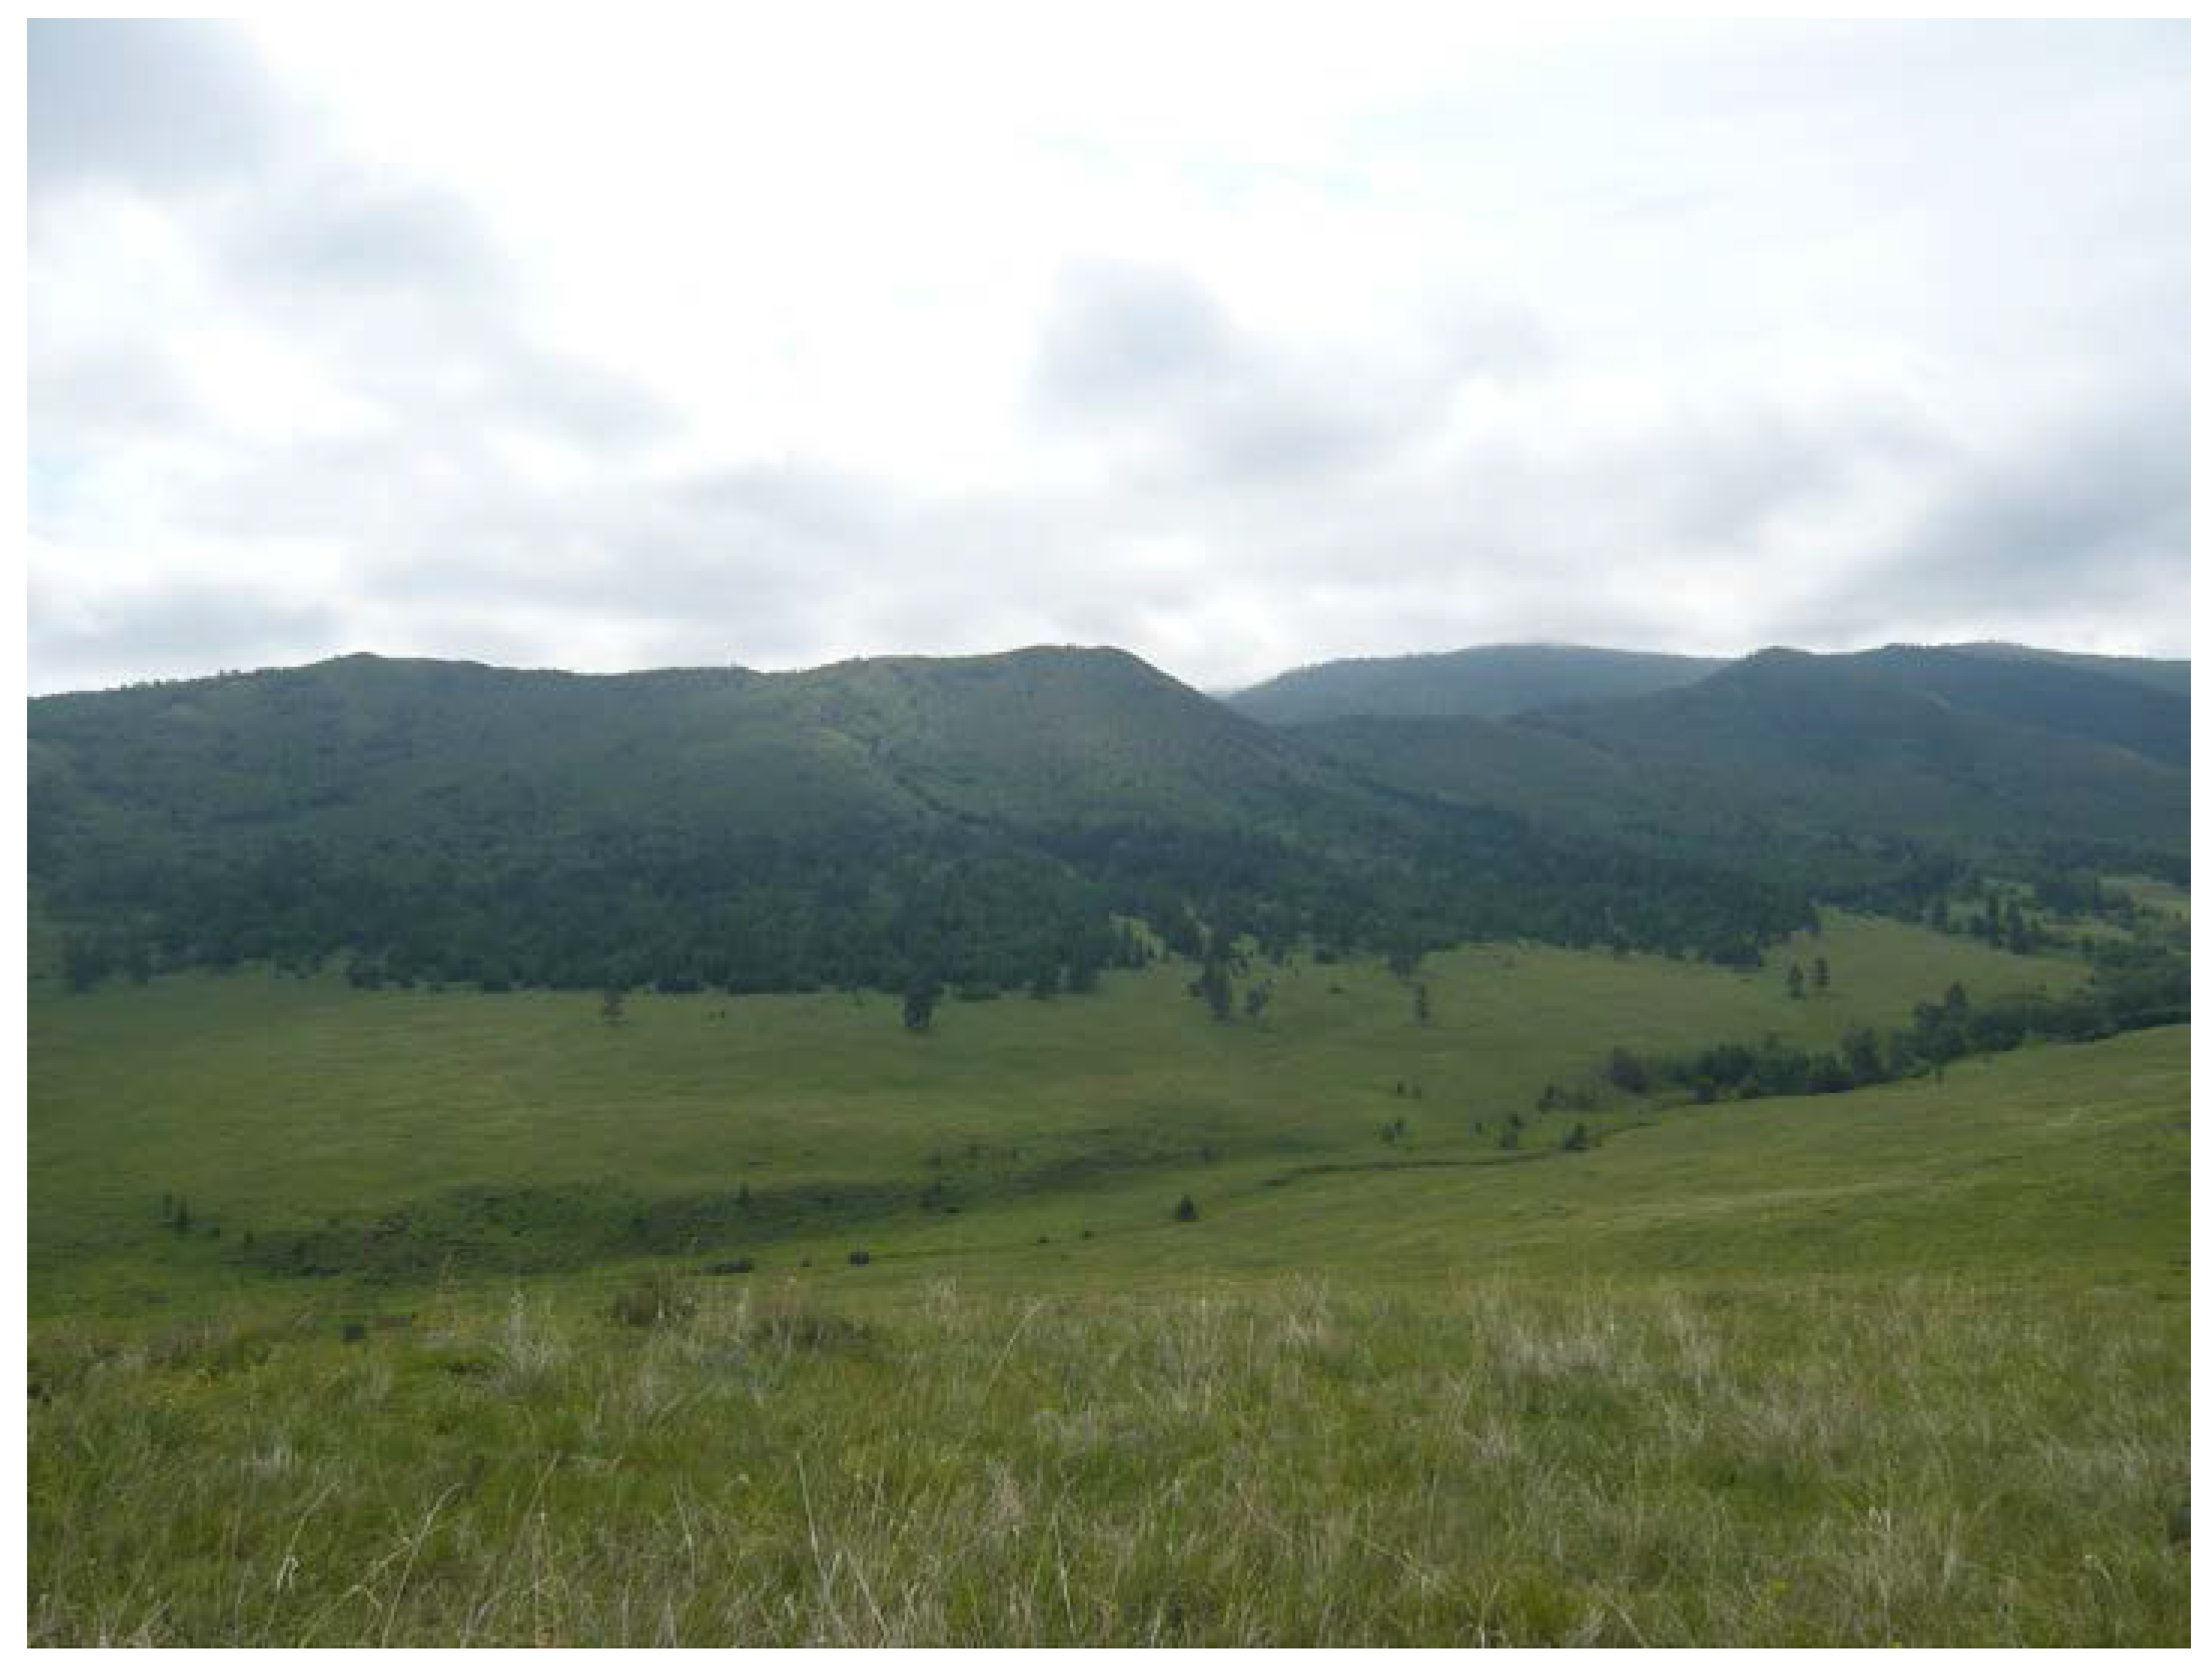
Appendix A. Pictures from the RA Altansumber

Figure A1. The research area Altansumber.
Forests 08 00105 g009
Figure A2. Birch stand BII during the data collection in 2012.
Forests 08 00105 g010
Figure A3. View of the larch stand LI.
Forests 08 00105 g011
Figure A4. After the thinning 2009: larch stump with the respective tree number.
Forests 08 00105 g012

References

  1. Tsogtbaatar, J. Forest Policy Development in Mongolia. IUFRO Task Force Science/Policy Interface. p. 11. 2008. Available online: http://iufro-archive.boku.ac.at/iufro/taskforce/tfscipol/chennai-papers/ftsogtbaatar.pdf (accessed on 15 March 2016).
  2. Ykhanbai, H. Mongolian Forestry Outlook Study; Asia-Pacific Forestry Sector Outlook Study II; Working Paper Series; FAO: Bangkok, Thailand, 2010; p. 49. [Google Scholar]
  3. Gradel, A.; Petrow, W. Forstpolitische Entwicklungen im Transformationsland Mongolei. AFZ-DerWald. 2014, 17, 36–39. (In German) [Google Scholar]
  4. Yunatov, A.A. The Main Features of the Vegetation Cover of the Mongolian People’s Republic; Proceedings of the Mongolian Commission of the Academy of Sciences of the USSR: Moscow, Russia, 1950; p. 223. (In Russian) [Google Scholar]
  5. Dulamsuren, Ch. Floristische Diversität, Vegetation und Standortbedingungen in der Gebirgstaiga des Westkhentej, Nordmongolei; Universität Göttingen: Göttingen, Germany, 2004; p. 290. (In German) [Google Scholar]
  6. Mühlenberg, M.; Appelfelder, J.; Hoffmann, H.; Ayush, E.; Wilson, K.J. Structure of the montane taiga forests of West Khentii, Northern Mongolia. J. For. Sci. 2012, 58, 45–56. [Google Scholar]
  7. Ministry of Environment and Tourism. Multipurpose National Forest Inventory 2014–2016, 1st ed.; Ministry of Environment and Tourism: Ulaanbaatar, Mongolia, 2016. [Google Scholar]
  8. Dorjsuren, C. Forest Ecosystems (in Climate change impact and exposure). In Mongolia Second Assessment Report on Climate Change—MARCC 2014; Damdin, D., Zamba, B., Luvsan, N., Eds.; Ministry of Environment and Green Development: Ulaanbaatar, Mongolia, 2014; pp. 94–100. [Google Scholar]
  9. Antropov, V.F.; Seredkin, A.D.; Shhepin, A.A. Forestry in Buryatia; EKOS: Ulan-Ude, Russian Federation, 2013; p. 184. (In Russian) [Google Scholar]
  10. Martinsson, O.; Lesinski, J. Siberian Larch—Forestry and Timber in a Scandinavian Perspective; Jämtlands County Council Institute of Rural Development: Östersund, Sweden, 2007; p. 91. [Google Scholar]
  11. EIC, Environmental Information Centre Ulaanbaatar (Oin nociin medeellin san. Oin modny torol.). Available online: http://www.eic.mn/forestresource/forestresource.php?id=10 (accessed on 15 June 2016). (In Mongolian).
  12. Puhua, H. Betula platyphylla SUK. In Enzyklopädie der Holzgewächse—Handbuch und Atlas der Dendrologie; Schütt, P., Weisgerber, H., Schuck, H., Lang, U.M., Roloff, A., Eds.; Schütt, P., Translator; Ecomed: Landsberg am Lech, Germany, 2013; p. 6. (In German) [Google Scholar]
  13. Zyryanova, O.A.; Terazawa, M.; Koike, T.; Zyryanov, V.I. White birch trees as resource species of Russia: Their distribution, ecophysiological features, multiple utilizations. Eurasian J. For. Res. 2010, 13, 25–40. [Google Scholar]
  14. Hynynen, J.; Niemistö, P.; Viherä-Aarno, A.; Brunner, A.; Hein, S.; Velling, P. Silviculture of birch (Betula pendula Roth and Betula pubescens Ehrh.) in northern Europe. Forestry 2010, 83, 103–119. [Google Scholar] [CrossRef]
  15. Von Gadow, K. Forsteinrichtung. Analyse und Entwurf der Waldentwicklung; Universitätsverlag Göttingen, Reihe Universitätsdrucke: Göttingen, Germany, 2005; p. 342. (In German) [Google Scholar]
  16. Pretzsch, H. Forest Dynamics, Growth and Yield. From Measurement to Model; Springer: Berlin/Heidelberg, Germany, 2009; p. 664. [Google Scholar]
  17. Von Gadow, K.; Zhang, Y.C.; Wehenkel, C.; Pommerening, A.; Corral-Rivas, J.; Korol, M.; Myklush, S.; Hui, G.Y.; Kiviste, A.; Zhao, X.H. Forest Structure and Diversity. In Continuous Cover Forestry; Pukkala, T., von Gadow, K., Eds.; Springer: Dordrecht, The Netherlands, 2012; pp. 29–83. [Google Scholar]
  18. Röhrig, E.; Bartsch, N.; Lüpke, B.V. Waldbau auf ökologischer Grundlage, 7th ed.; Eugen Ulmer: Stuttgart, Germany, 2006; p. 479. (In German) [Google Scholar]
  19. Assmann, E. Grundflächenhaltung und Zuwachsleistung Bayerischer Fichten-Durchforstungsreihen. Forstwiss. Cent. 1954, 73, 257–271. (In German) [Google Scholar] [CrossRef]
  20. Mäkinen, H.; Isomäki, A. Thinning intensity and growth of Norway spruce stands in Finland. Forestry 2004, 77, 349–364. [Google Scholar] [CrossRef]
  21. Gebhardt, T.; Häberle, K.H.; Matyssek, R.; Ammer, C. The more, the better? Water relations of Norway spruce stands after progressive thinning. Agric. For. Meteorol. 2014, 197, 235–243. [Google Scholar] [CrossRef]
  22. Olivar, J.; Bogino, S.; Rathgeber, C.; Bonnesoeur, V.; Bravo, F. Thinning has a positive effect on growth dynamics and growth-climate relationships in Aleppo pine (Pinus halepensis L.) trees of different crown classes. Ann. For. Sci. 2014, 71, 395–404. [Google Scholar] [CrossRef]
  23. Von Gadow, K. Messung und Modellforschung—Grundlagen der Forsteinrichtung. Allg. Forst Jagdztg. 2012, 184, 143–158. (In German) [Google Scholar]
  24. Gradel, A.; Ochirragchaa, N.; Altaev, A.A.; Voinkov, A.A.; Enkhtuya, B. Spatial distribution of trees on light taiga plots before selective thinning. Mong. J. Agric. Sci. 2015, 15, 91–99. [Google Scholar] [CrossRef]
  25. Gradel, A.; Ochirragchaa, N.; Altaev, A.A.; Voinkov, A.A.; Enkhtuya, B. Capacity development and forest research on the light taiga plots of the School of Agroecology and Business of the Mongolian University of Life Sciences in Darkhan. In Current Environmental Issues—Approaches to Solutions, Proceedings of the 20th Anniversary of the Professional Environmental Studies Program, Mongolian University of Life Sciences, Darkhan, Mongolia, 29 May 2015; pp. 44–51.
  26. Food and Agriculture Organization (FAO). Capacity Building and Institutional Development for Participatory Natural Resources Management and Conservation in Forest Areas of Mongolia (GCP/MON/002/NET); Financed by the Government of the Netherlands; FAO: Rome, Italy, 2006; p. 47. Available online: http://www.mne.mn/files/page792/Oi-4%20en.pdf (accessed on 30 June 2016).
  27. Kraznoshekov, Y.N. Soil Cover and Soils of Mountain forests of Northern Mongolia; Nauka: Novosibirsk, Russian Federation, 2013; p. 196. (In Russian) [Google Scholar]
  28. Von Gadow, K.; Hui, G.Y. Can the species-area relationship be derived from prior knowledge of the tree species richness? For. Stud./Metsanduslikud Uurim. 2007, 46, 13–22. [Google Scholar]
  29. Murray, D.M.; von Gadow, K. A flexible yield model for regional timber forecasting. South. J. Appl. For. 1993, 17, 112–115. [Google Scholar]
  30. Vitikova, L.; Dhubhain, A.N.; Pommerening, A. Agreement in Tree Marking: What is the uncertainty of human tree selection in selective forest management? For. Sci. 2016, 62, 288–296. [Google Scholar]
  31. Stoyan, D.; Stoyan, H. Fractals, Random Shapes, and Point Fields: Methods of Geometrical Statistics; Wiley: Chichester, UK, 1994; p. 406. [Google Scholar]
  32. Ripley, B.D. Spatial Statistics; Wiley: New York, NY, USA, 1981; p. 252. [Google Scholar]
  33. Wiegand, T. Introduction to Point Pattern Analysis with Ripley’s L and the O-Ring Statistic Using the Programita Software, 2nd ed.; UFZ-Centre for Environmental Research: Leipzig, Germany, 2004; p. 166. [Google Scholar]
  34. Besag, J. Contribution to the discussion of Dr. Ripley’s paper. J. R. Stat. Soc. B Met. 1977, 39, 193–195. [Google Scholar]
  35. Illian, J.; Penttinen, A.; Stoyan, H.; Stoyan, D. Statistical Analysis and Modelling of Spatial Point Patterns; Wiley: New York, NY, USA, 2008; p. 534. [Google Scholar]
  36. Zhang, C.; Zhao, X.; Gadow, K. Spatial distributions and spatial associations of dominant tree species in Korean pine broadleaved old-growth forests in Changbai Mountains. Balt. For. 2010, 16, 66–75. [Google Scholar]
  37. Wiegand, T.; Moloney, K.A. Rings, circles, and null-models for point pattern analysis in ecology. Oikos 2004, 104, 209–229. [Google Scholar] [CrossRef]
  38. Wiegand, T.; Moloney, K.A. A Handbook of Spatial Point Pattern Analysis in Ecology; Chapman and Hall/CRC Press: Boca Raton, FL, USA, 2014; p. 538. [Google Scholar]
  39. Mäkinen, H.; Vanninen, P. Effect of sample selection on the environmental signal derived from tree-ring series. For. Ecol. Manag. 1999, 113, 83–89. [Google Scholar] [CrossRef]
  40. Riemer, T. Über die Varianz von Jahrringbreiten—Statistische Methoden für die Auswertung der jährlichen Dickenzuwächse von Bäumen unter sich ändernden Lebensbedingungen; Forschungszentrum Waldökosysteme der Universität Göttingen: Göttingen, Germany, 1994; p. 375. (In German) [Google Scholar]
  41. Dulamsuren, C.; Hauck, M.; Leuschner, H.H.; Leuschner, C. Climate response of tree ring width in Larix sibirica growing in the drought-stressed forest-steppe ecotone of northern Mongolia. Ann. For. Sci. 2011, 68, 275–282. [Google Scholar] [CrossRef]
  42. Gärtner, H.; Nievergelt, D. The core-microtome: A new tool for surface preparation on cores and time series analysis of varying cell parameters. Dendrochronologia 2010, 28, 85–92. [Google Scholar] [CrossRef]
  43. Hegyi, F. A simulation model for managing jack-pine stands. In Growth Models for Tree and Stand Simulation; Royal College of Forestry: Stockholm, Sweden, 1974; pp. 74–90. [Google Scholar]
  44. Pretzsch, H. Zum Einfluß des Baumverteilungsmusters auf den Bestandeszuwachs. Jahrestagung Deutscher Verband Forstlicher Forschungsanstalten—Sektion Ertragskunde, Joachimsthal. Allg. Forst Jagdztg. 1995, 160, 190–200. (In German) [Google Scholar]
  45. Croсom, 3.0, Software Erstellt unter Delphi V (Münder, Schildbach und Schröder). Institut für Waldwachstum und Forstliche Informatik, Professur für Waldwachstums- und Holzmesskunde der TU Dresden: Tharandt, Germany, 2007. (In German)
  46. Münder, K. Konkurrenzuntersuchungen und Wachstumsmodellierung in Waldumbaubeständen des Mittleren Erzgebirges. Ph.D. Thesis, Technische Universität Dresden, Dresden, Germany, 2005; p. 160. (In German). [Google Scholar]
  47. Bachmann, M. Indizes zur Erfassung der Konkurrenz von Einzelbäumen. Methodische Untersuchungen in Bergmischwäldern; Forstliche Forschungsberichte München Nr. 171; Technische Universität München Wissenschaftszentrum Weihenstephan: München, Germany, 1998; p. 245. (In German) [Google Scholar]
  48. Crawley, M.J. The R-Book; Wiley: New York, NY, USA, 2007; p. 942. [Google Scholar]
  49. Zuur, A.F.; Ieno, E.N.; Walker, N.J.; Saveliev, A.A.; Smith, G.M. Mixed Effects Models and Extensions in Ecology with R; Springer: New York, NY, USA, 2009; p. 574. [Google Scholar]
  50. Robinson, A.P.; Hamann, J.D. Forest Analytics with R—An Introduction; Springer: New York, NY, USA, 2011; p. 354. [Google Scholar]
  51. R Development Core Team. R: A Language and Environment for Statistical Computing; Version 3.0.2; R Foundation for Statistical Computing: Vienna, Austria, 2013; Available online: http://www.R-project.org/ (accessed on 20 July 2016).
  52. Grothendieck, G. nls2: Non-Linear Regression with Brute Force. R Package Version 0.2. Available online: http://CRAN.R-project.org/package=nls2 (accessed on 30 May 2016).
  53. Pinheiro, J.; Bates, D.; DebRoy, S.; Sarkar, D.; R Development Core Team. nlme: Linear and Nonlinear Mixed Effects Models. R Package Version 3.1-113. Available online: http://packages.renjin.org/package/org.renjin.cran/nlme/3.1-113 (accessed on 29 March 2017).
  54. Bjornstad, O.N. ncf: Spatial Nonparametric Covariance Functions. R Package Version 1.1-5. Available online: http://CRAN.R-project.org/package=ncf (accessed on 29 May 2016).
  55. Fox, J.; Weisberg, S. An R Companion to Applied Regression, 2nd ed.; Sage: Thousand Oaks, CA, USA; Available online: http://socserv.socsci.mcmaster.ca/jfox/Books/Companion (accessed on 30 April 2016).
  56. Sarkar, D. Lattice: Multivariate Data Visualization with R; Springer: New York, NY, USA, 2008; p. 268. [Google Scholar]
  57. Von Gadow, K.; Hui, G.Y. Characterizing forest spatial structure and diversity. In Sustainable Forestry in Temperate Regions; Björk, L., Ed.; SUFOR, University of Lund: Lund, Sweden, 2002; pp. 20–30. [Google Scholar]
  58. Huss, J. Zur Durchforstung engbegründeter Fichtenjungbestände. Forstwiss. Cent. 1990, 109, 101–118. (In German) [Google Scholar] [CrossRef]
  59. Juodvalkis, A.; Kairiukstis, L.; Vasiliauskas, R. Effects of thinning on growth of six tree species in north-temperate forests of Lithuania. Eur. J. For. Res. 2005, 124, 187–192. [Google Scholar] [CrossRef]
  60. Štefančík, I. Development of target (crop) trees in beech (Fagus sylvatica L.) stand with delayed initial tending and managed by different thinning methods. J. For. Sci. 2013, 59, 253–259. [Google Scholar]
  61. Pretzsch, H. Stand density and growth of Norway spruce (Picea abies (L.) Karst.) and European beech (Fagus sylvatica L.): Evidence from long-term experimental plots. Eur. J. For. Res. 2005, 124, 193–205. [Google Scholar] [CrossRef]
  62. Gizachew, B.; Brunner, A. Density–growth relationships in thinned and unthinned Norway spruce and Scots pine stands in Norway. Scand. J. For. Res. 2011, 26, 543–554. [Google Scholar] [CrossRef]
  63. Gradel, A.; Mühlenberg, M. Spatial characteristics of near-natural Mongolian forests at the southern edge of the taiga. Allg. Forst Jagdztg. 2011, 182, 40–52. [Google Scholar]
  64. Lei, X.; Lu, Y.; Peng, C.; Zhang, X.; Cnag, J.; Hong, L. Growth and structure of semi-natural larch-spruce-fir (Larix olgensis-Picea jezoensis-Abies nephrolepis) forests in northeast-China: 12-year result after thinning. For. Ecol. Manag. 2012, 240, 165–177. [Google Scholar] [CrossRef]
  65. Bachofen, H.; Zingg, A. Effectiveness of structure improvement thinning on stand structure in subalpine Norway spruce (Picea abies (L.) Karst.) stands. For. Ecol. Manag. 2001, 145, 137–149. [Google Scholar] [CrossRef]
  66. Pukkula, T.; Lähde, E.; Laiho, O. Which trees should be removed in thinning treatments? For. Ecosyst. 2015, 2. [Google Scholar] [CrossRef]
  67. Gradel, A.; Haensch, C.; Batsaikhan, G.; Batdorj, D.; Ochirragchaa, N.; Günther, B. Response of white birch (Betula platyphylla Sukaczev) to temperature and precipitation in the mountain forest steppe and taiga of northern Mongolia. Dendrochronologia 2017, 41, 24–33. [Google Scholar] [CrossRef]
  68. Gradel, A.; Batsaikhan, G.; Ochirragchaa, N.; Batdorj, D.; Kusbach, A. Climate-growth relationships and pointer year analysis of a Siberian larch (Larix sibirica Ledeb.) chronology in the Mongolian mountain forest steppe. For. Ecosyst. Submitted.
  69. Abetz, P. Reaktionen auf Standraumerweiterung und Folgerungen fuer die Auslesedurchforstung bei Fichte. Allg. Forst Jagdztg. 1976, 147, 72–75. (In German) [Google Scholar]
  70. Zhang, S.; Burkhart, H.E.; Amateis, R.L. The influence of thinning on tree height and diameter relationships in loblolly pine plantations. South. J. Appl. For. 1997, 21, 199–205. [Google Scholar]
  71. Ammer, C.; Ziegler, C.; Knoke, T. Zur Beurteilung von intra- und interspezifischer Konkurrenz von Laubbaumbeständen im Dickungsstadium. Allg. Forst Jagdztg. 2005, 176, 85–94. (In German) [Google Scholar]
  72. Roberts, S.D.; Harrington, C.A. Individual tree growth response to variable-density thinning in coastal Pacific Northwest forests. For. Ecol. Manag. 2008, 255, 2771–2781. [Google Scholar] [CrossRef]
  73. Klädtke, J.; Kohnle, U.; Kublin, E.; Ehring, A.; Pretzsch, H.; Uhl, E.; Spellmann, H.; Weller, A. Wachstum und Wertleistung der Douglasie in Abhängigkeit von der Standraumgestaltung. Schweiz. Z. Forstwes. 2012, 163, 96–104. (In German) [Google Scholar] [CrossRef]
  74. Karlman, L.; Mörling, T.; Martinsson, O. Wood density, annual ring width and latewood content in Larch and Scots pine. Eurasian J. For. Res. 2005, 8, 91–96. [Google Scholar]
  75. Heräjärvi, H. Technical properties of mature birch (Betula pendula and B. pubescens) for saw milling in Finland. Silva Fenn. 2001, 35, 469–485. [Google Scholar] [CrossRef]
  76. Cameron, A.D.; Dunham, R.A.; Petty, J.A. The effects of heavy thinning on stem quality and timber properties of silver birch (Betula pendula Roth). Forestry 1995, 68, 275–285. [Google Scholar] [CrossRef]
  77. Oikarinen, M. Growth and yield models for silver birch (Betula pendula) plantations in southern Finland. In Communicationes Instituti Forestalis Fenniae 113; Finnish Forest Research Institute (Luke): Helsinki, Finland, 1983; pp. 1–75. (In Finnish) [Google Scholar]
  78. Rytter, L.; Karlsson, A.; Karlsson, M.; Stener, L.G. Skötsel av björk, al och asp. In Skogsskötselserien nr 9, 1st ed.; Swedish Forest Agency (Skogsstyrelsen): Helsinki, Sweden, 2008; pp. 1–122. (In Swedish) [Google Scholar]
  79. Khutakova, S.V.; Ubugunova, V.I.; Gradel, A.; Enkhtuya, B. Morphogenetic features of soils of larch forests of terrain Altan Sumber Orkhon-Selenga Middle Mountain. In Central Asian Environmental and Agricultural Problems, Potential Solutions; Institute of Plant and Agricultural Sciences, School of Agroecology and Business of the MULS in Darkhan: Darkhan, Mongolia, 2016; pp. 127–130. (In Russian) [Google Scholar]
  80. Sugimoto, A.; Yanagisawa, N.; Naito, D.; Fujita, N.; Maximov, T.C. Importance of permafrost as a source of water for plants in east Siberian taiga. Ecol. Res. 2002, 17, 493–503. [Google Scholar] [CrossRef]
  81. Savin, E.N.; Milyutin, L.I.; Krasnoshhekov, Ju.N.; Korotkov, I.A.; Suncov, A.V.; Dugarzhav, Ch.; Cogoo, Z.; Dorzhsuren, Ch.; Zhamjansurjen, S.; Gombosuren, N. Forests of the Mongolian People’s Republic (Larch forests of the Eastern Khentey), Soviet-Mongolian Expedition; Nauka, Siberian Department: Novosibirsk, Russia, 1988; p. 176. (In Russian) [Google Scholar]
  82. Kopp, B.J.; Minderlein, S.; Menzel, L. Soil moisture dynamics in a mountainous headwater area in the discontinuous permafrost zone of northern Mongolia. Arct. Alp. Res. 2014, 46, 459–470. [Google Scholar] [CrossRef]
  83. Vitikova, L. Transformation to Continuous Cover Forestry in Ireland. Ph.D. Thesis, University College Dublin, Dublin, Ireland, 2014; p. 159. [Google Scholar]
  84. Cameron, A.D. Managing birch woodlands for the production of quality timber. Forestry 1996, 69, 357–371. [Google Scholar] [CrossRef]
  85. Karlsson, M. Natural Regeneration of broadleaved tree Species in Southern Sweden. Ph.D. Thesis, Swedish University of Agricultural Sciences, Southern Swedish Forest Research Centre, Alnarp. Acta Universitatis Agriculturae Sueciae, Silvestria, Sweden, 2001; p. 44. [Google Scholar]
Figure 1. Map of the Selenge aimag with the research area Altansumber (Institute of Geography-Geoecology, Mongolian Academy of Sciences; [24]).
Forests 08 00105 g001
Figure 2. Non-spatial harvest event analysis of the Altansumber birch and larch thinning trials; grey: trees remaining after thinning; black: trees removed during the thinning.
Forests 08 00105 g002
Figure 3. L-function and pair correlation function of the plots in stand BI before and after the thinning in 2009 and at the end of the observation period in 2012.
Forests 08 00105 g003
Figure 4. L-function and pair correlation function of the plots in stand BII before and after thinning in 2009 and at the end of the observation period in 2012.
Forests 08 00105 g004
Figure 5. L-function and pair correlation function of the plots in stand LI before and after thinning in 2009 and at the end of the observation period in 2012.
Forests 08 00105 g005
Figure 6. L-function and pair correlation function of the plots in stand LII before and after thinning in 2009 and at the end of the observation period.
Forests 08 00105 g006
Figure 7. (a) Relationship between competition index (CI_before) and basal area growth (2007 to 2009) of larch prior to thinning: R2 = 0.3257, p < 0.05. (b) Relationship between competition index (CI_before) and basal area growth (2007 to 2009) of birch prior to thinning:: R2 = 0.1695, p < 0.05.
Forests 08 00105 g007
Figure 8. (a) Graph of the relationship between the relative competition relief (CIrel) and relative change in basal area growth (rel.gr) of larch. (b) Graph of the relationship between the relative competition relief (CIrel) and relative change in basal area growth (rel.gr) of birch.
Forests 08 00105 g008
Table 1. Background information on the light taiga study stands in the mountain forest steppe of Altansumber [24]. *. Two out of the three plots in stand BI were 1550 m2 in size.
Reference StandMain Tree SpeciesHeight above Sea LevelExpositionN (Plots)Plot Size (m2) 2009Indication of DisturbancesYear of First Assessment
BI *birch934N32500 (1550)s.f.2009
BIIbirch966N32500s.f.2009
LIlarch911NW32500s.f.2009
LIIlarch976NW32500s.f., s.p.l.2009
L: larch stands (larch: 94–100%); B: birch stands (birch: 92.5–100%); I: forest stand with predominantly small diameters; II: forest stand with predominantly medium diameters; s.f.: signs of fire impact; s.p.l.: signs of previous logging (stumps).
Table 2. Density measures and average dimensions and age of the light taiga study stands. Dg_200: quadratic mean diameter of the 200 strongest trees; D_200: arithmetic mean diameter of the 200 strongest trees; stand age = average age of trees based on wood cores + 5 years; SD = standard deviation; age (N): number of cores initially sampled in each stand of the main tree species.
Forest StandN/haDgDDg_200SDD_200SDStand AgeSDAge (N )
BI122911.210.418.83.65018.41.4364418.82038
BII110314.213.620.12.91319.91.4786813.31434
LI138911.911.019.46.89118.23.987222.39222
LII56522.821.829.24.25728.82.999613.29636
Table 3. Stand measures of the plots before (2009before), after the thinning (2009after) and at the end of the observation period in 2012. N/ha = stem number per hectare; BA/ha=basal area per hectare; dom. height (m) = dominant height; CV: diameter coefficient of variation; m. int. = medium intensity treatment; low int. = low intensity treatment; unth. = no treatment (unthinned).
StandPlot2009before2009after2012StandPlot2009before2009after2012
N/haN/ha
BIm. int.1144568736LIm. int.1528776868
low int.11749611045low int.150411481268
unth.1368unth.1510unth.1136unth.1200
BIIm. int.984484500LIIm. int.656524524
low int.1136808796low int.624564624
unth.1188unth.1192unth.416unth.420
BA (m2)/haBA/ha
BIm. int.14.6596.9748.567LIm. int.16.70711.03914.404
low int.8.6906.9888.746low int.13.51311.32015.165
unth.10.841unth.12.223unth.15.657unth.18.749
BIIm. int.17.28910.79111.366LIIm. int.24.87822.02623.692
low int.17.38713.35914.310low int.23.02521.78623.025
unth.17.895unth.19.249unth.21.635unth.23.154
dom. height (m)dom. height (m)
BIm. int.12.311.811.9LIm. int.12.112.012.6
low int.10.210.310.7low int.11.411.412.0
unth.11.0unth.11.6unth.12.8unth.13.1
BIIm. int.14.914.815.0LIIm. int.16.416.416.5
low int.14.414.414.6low int.16.016.016.0
unth.14.5unth.14.7unth.16.5unth.16.7
CVCV
BIm. int.0.4240.4260.416LIm. int.0.3590.3730.364
low int.0.2510.2460.251low int.0.3110.3160.310
unth.0.352unth.0.329unth.0.473unth.0.449
BIIm. int.0.3330.2790.286LIIm. int.0.3620.3420.340
low int.0.2760.2630.263low int.0.2690.2600.267
unth.0.278unth.0.232unth.0.249unth.0.252
Table 4. Stand measures of the plots before (2009before), after the thinning (2009after) and at the end of the observation period in 2012. Dg: quadratic mean diameter of all trees: D: arithmetic mean diameter of all trees; Dg_200: quadratic mean diameter of the 200 strongest trees; D_200: arithmetic mean diameter of the 200 strongest trees; m. int. = medium intensity treatment; low int. = low intensity treatment; unth. = no treatment (unthinned).
StandPlot2009before2009after2012StandPlot2009before2009after2012
DD
BIm. int.11.811.511.2LIm. int.11.112.613.7
low int.9.49.310.0low int.10.210.711.8
unth.9.5unth.9.7unth.12.0unth.12.9
BIIm. int.14.016.016.4LIIm. int.20.721.922.7
low int.13.414.014.6low int.20.821.520.9
unth.13.3unth.13.8unth.24.9unth.30.9
DgDg
BIm. int.12.812.412.2LIm. int.11.813.514.5
low int.9.79.610.3low int.10.711.212.4
unth.10.0unth.10.2unth.13.2unth.14.1
BIIm. int.15.016.817.0LIIm. int.22.023.124.0
low int.13.914.515.1low int.21.722.222.0
unth.13.8unth.14.3unth.25.7unth.26.5
D_200D_200
BIm. int.21.116.817.7LIm. int.18.017.920.0
low int.13.412.714.0low int.15.615.617.5
unth.16.1unth.16.3unth.20.3unth.21.8
BIIm. int.21.020.321.0LIIm. int.28.928.729.8
low int.19.419.019.8low int.22.222.628.4
unth.19.4unth.20.2unth.30.0unth.30.9
Dg_200Dg_200
BIm. int.21.317.418.2LIm. int.19.018.920.8
low int.13.713.014.3low int.16.416.418.2
unth.16.6unth.16.8unth.22.1unth.23.4
BIIm. int.21.420.421.2LIIm. int.29.529.330.4
low int.19.519.119.9low int.27.527.528.6
unth.19.5unth.20.3unth.30.2unth.31.1
Table 5. Overview of the selected competition-growth models (fixed and mixed effect models). The different competitor selections are NNDSR = search radius class, based on the double NND; cone = cone method [45]. CIdiff = difference in absolute competition before and after thinning; CIrel = relative competition relief; DBH = diameter at breast height of tree i at the end of the vegetation period 2009; AIC= Akaike‘s Information Criterion.
ModelSpeciesVariableFixed EffectsCompetitor SelectionDegrees of FreedomModel Parameter (Fixed Effects)AIC of the Model
Interceptp-ValueCIrelp-ValueCIdiffp-ValueDBHp-Value
1Birchabs.grCIdiff + DBHcone31−0.00090.04850.00030.04870.00020.0000−400.95
Birchabs.grCIdiff + DBHNNDSR37−0.00080.16380.00030.02140.00020.0000−455.48
Larchabs.grCIdiff + DBHcone27−0.00130.51630.00080.04400.00020.0000−336.97
Larchabs.grCIdiff + DBHNNDSR31−0.00180.28360.00060.00440.00020.0000−388.26
2Birchrel.grCIrelcone292.10840.00000.71110.038796.48
Birchrel.grCIrelNNDSR291.91630.00001.24440.005287.82
Larchrel.grCIrelcone311.40200.00000.67760.015970.17
Larchrel.grCIrelNNDSR361.17560.00001.41560.000168.64

