Abstract
Although the soils in the Tibetan Plateau shrublands store large amounts of total nitrogen (N), the estimated values remain uncertain because of spatial heterogeneity and a lack of field observations. In this study, we quantified the regional soil N storage, spatial and vertical density distributions, and related climatic controls using 183 soil profiles sampled from 61 sites across the Northeast Tibetan Plateau shrublands during the period of 2011–2013. Our analysis revealed a soil N storage value of 132.40 Tg at a depth of 100 cm, with an average density of 1.21 kg m−2. Soil N density was distributed at greater levels in alpine shrublands, compared with desert shrublands. Spatially, soil N densities decreased from south to north and from east to west, and, vertically, the soil N in the upper 30 and 50 cm accounted for 42% and 64% of the total soil N stocks in the Tibetan Plateau. However, compared with desert shrublands, the surface layers in alpine shrublands exhibited a larger distribution of soil N stocks. Overall, the soil N density in the top 30 cm increased significantly with the mean annual precipitation (MAP) and tended to decrease with the mean annual temperature (MAT), although the dominant climatic controls differed among shrubland types. Specifically, MAP in alpine shrublands, and MAT in desert shrubland, had a weak effect on N density. Soil pH can significant affect soil N density in the Tibetan Plateau shrublands. In conclusion, changes in soil N density should be monitored over the long term to provide accurate information about the effects of climatic factors.
1. Introduction
Nitrogen (N) is a significant stimulant of plant growth [1,2] and an important limiting element in terrestrial ecosystems [3]. The levels of anthropogenic reactive nitrogen in the terrestrial ecosystem have increased in recent decades [4,5], and the accelerated industrialization and use of N fertilizer have significantly affected N cycles [1,6,7]. For example, the availability of inorganic N has increased [8], and the rate of N flux to the biosphere has doubled [9]. Currently, the increase in N deposition is expected to continue [7,10], and reports suggest that soil may function as an N sink in terrestrial ecosystems [11,12].
Soil—the largest N reservoir in the terrestrial ecosystem—contains a larger amount of N than vegetation [13]. Consequently, the dynamics of soil N not only determine whether the terrestrial ecosystem functions as a N sink or source [14], but can even alter the biogeochemical cycles of other elements [15,16]. Therefore, estimations of soil N stocks will facilitate assessments of the role of soil in the terrestrial N cycle.
In addition to the global scale [17,18], soil N storage has been estimated on a national scale in China [14,17]. However, these estimations remain largely uncertain because of the lack of available data and the amount of soil heterogeneity. Post et al. first determined a global soil N stock of 95 Pg from a global database of organic soil carbon and nitrogen, and Batjes later estimated this value to be 133–140 Pg, using data from a global soil emission inventory. In China, Tian et al. used data from 2840 soil profiles to estimate a soil N storage of 8.3 Pg at a depth of 100 cm. By contrast, Yang et al. estimated a comparatively lower value of 7.4 Pg from the data of 3283 soil profiles.
Spatial heterogeneity in climatic conditions can cause dramatic variations in soil properties such as the N density [2,19,20], which varies widely by vegetation category [14] and geographic region [9]. To our knowledge, most studies of soil N stocks estimated these values in desert [21], forest [22], wetland [14], grassland [20,23], and crop [13] regions, but few have addressed soil N stocks across the Tibetan Plateau shrublands. For example, Yang et al. researched the soil N stocks associated with different vegetation types, including meadow, forest, steppe, crop, and desert in China, but did not include shrublands. Though Tian et al. explored soil N density in the Northeast Tibetan Plateau shrublands, few sites were investigated in their study, and they did not further discuss the relationship between soil N density and its controlling factors. Therefore, an estimation of regional N stocks [14,24,25] in the Tibetan Plateau shrublands is necessary and would help to reduce uncertainties in the estimations of national and global soil N stocks.
Warmer and wetter climates enhance soil N mineralization [2,26] and, thus, inevitably affect soil N stocks. By contrast, colder and drier climatic conditions help to reduce the efficiency of plant N use and N mineralization consequent to reduced enzyme activity [26]. Therefore, climatic factors, such as the mean annual temperature (MAT) and mean annual precipitation (MAP) [27], could significantly affect soil N stocks, and an understanding of these climatic control factors would facilitate predictions of the potential effects of global warming.
Human activities, such as industrial development and the burning of fossil fuels, have greatly affected the N cycle [14], and increasing nitrogen deposition would reduce the pH [28]. Soil pH has been shown to have a positive relationship with the net nitrification rate in the forest floors [29], and with the university experimental farm at Arlington [30]. Consequently, this relationship will affect soil N density. However, compared with climate factors, the relationship between soil pH and soil N density in high-altitude regions has been largely unexplored. Accordingly, extensive field soil surveys and appropriate up-scaling approaches are expected to improve assessments of the effects of soil pH on soil N density, particularly in remote, high-altitude areas.
The Tibetan Plateau, or “third pole”, is the largest high-altitude ecosystem on Earth [31]. The mean elevation is about 4000 m and it covers an area of 2.0 × 10⁶ km2 [32], which accounts for 26.8% of the total area of China [33]. A low human presence, the unique vegetation types, and the climate conditions on this plateau provide an ideal field in which to explore regional-scale soil N density patterns and the associated controlling factors. In the present study, we aimed to estimate soil N stocks, spatial and vertical N distributions, and the related controlling factors across the Northeast Tibetan Plateau shrublands. Accordingly, we conducted a regional sampling investigation of 61 sites across the Northeast Tibetan Plateau during the period of 2011–2013, and used the resulting datasets to assess the relationships between soil N density and climatic factors. This study was conducted to address the following questions: (1) how much soil N is stored at a 100 cm depth in the Northeast Tibetan Plateau shrublands? (2) What are the spatial and vertical soil N distribution patterns? (3) How do MAP, MAT, and soil pH factors influence soil N density?
2. Materials and Methods
2.1. Study Area
The study was conducted in regions of distributed shrubland on the Northeast Tibetan Plateau (Figure 1). These shrubland biomes, which comprise one of the most important ecosystems, predominantly contain woody plants with an average height <5 m and a coverage level exceeding 30% [34]. The shrubland ecosystems in the study regions predominantly comprised both alpine and desert shrubland biomes [35]. Alpine shrublands mainly consist of mesophytes, are distributed throughout wet areas, and are dominated by Rhododendron capitatum, R. thymifolium, Potentilla fruticosa, and Sibiraea laevigata biomes, which can endure a cold, windy, dry, and snowy environment. A variety of mesophyte herbs is distributed in the alpine shrublands, whereas desert shrublands mainly consist of super-xerophytic and sparse vegetation, and are distributed throughout dry regions, such as Qaidam Basin, and contain Sympegma ragelii, Kalidium foliatum, Nitraria tangutorum, and Salsola abrotanoides biomes. In these regions, evaporation significantly exceeds precipitation, and there are few super-xerophytic herbs in the desert shrublands. Compared with the meadow soil in alpine shrublands, the desert soil in desert shrublands was very infertile and thin [35]. The less-distributed leguminous plants can fix atmospheric N, for wood plants, such as Caragana Fobr [36], species of C. jubata, and for herbs, such as Oxytropis, species of O. falcate, and Astragalus, species of A. hendersonii and A. polycladus. The MAP range, MAT range, and the mean elevation were 17.6–764.4 mm, −5.6–8.9 °C, and >3500 m, respectively [37].
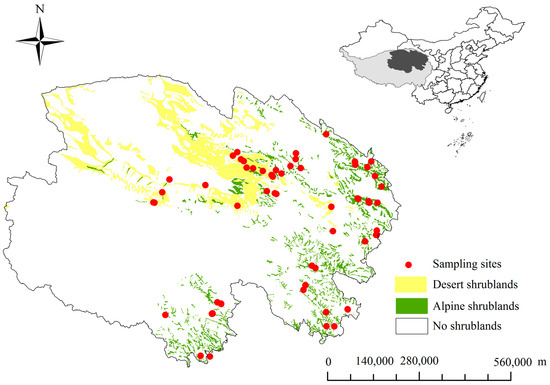
Figure 1.
The locations of 65 sampling sites across the Tibetan Plateau shrublands on the background map of China. The distribution is based on a vegetation map of China (1:1,000,000) [38].
2.2. Field Investigation and Laboratory Measurements
To estimate the soil N storage and density patterns, 183 soil profiles at 61 sites across the Northeast Tibetan Plateau were systematically surveyed during the summers (July–August) from 2011 to 2013. Firstly, a preliminary ascertainment of sites based on China’s vegetation atlas with a scale of 1:1,000,000 [38] (Figure 1) was conducted in the laboratory. Then, we confirmed whether these selected sites could represent an estimation in the field. The areas selected in the study should be larger than 1 hm2 to give a relatively evenly distribution of species composition, habitat, and community structure [39]. One plot was excavated in each site, the size of which was 1 m (length) × 1.5 m (width) × 1 m (height) (Figure 2). Then, descriptions about the soil profiles were noted, such as color and firmness [39]. Three soil profiles such as front profile, right profile, and left profile, as shown in Figure 2, were excavated per sampling plot, and soil was sampled at depths of 0–10, 10–20, 20–30, 30–50, 50–70, and 70–100 cm from the three profiles; three soil samples from the same depth were mixed into one. The bulk density of each soil layer was measured using a standard 100 cm3 container (diameter: 50.46 mm, height: 50 mm), and each sample was weighed gravimetrically after desiccation for 24 h at 105 °C to ensure a constant mass. The bulk density was calculated using the oven-dried soil mass and container volume. Soil samples were handpicked to remove fine roots and were subsequently ground on a ball mill for N analysis [39]. Total N was determined via dry combustion in an elemental analyzer (2400 II CHNS/O elemental analyzer, Perkin-Elmer, Waltham, MA, USA), and the respective combustion and reduction temperatures were 950 °C and 640 °C. Soil pH was determined in a 1:2.5 soil:water mixture (w/v) using a PHS-3C meter (Shanghai Dapu Instrument Company, Shanghai, China).
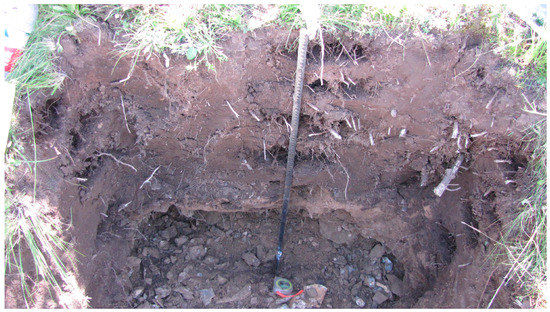
Figure 2.
Plot 1 m (length) × 1.5 m (width) × 1 m (height), for collecting soil samples used for soil nitrogen density and bulk density analysis measurement.
2.3. Climate Data
To investigate the potential effects of climatic factors on soil N, climatic data (MAP and MAT) for each site were derived from the Global Climate Data (http://www.worldclim.org/) at a spatial resolution of 1 km2.
2.4. Calculation of Soil N Storage
First, we calculated the soil N density for each soil profile using Equation (1).
where Ti is the soil thickness (cm); NDi is the soil N density at i (cm); and BDi, Ni, and Ci are the bulk density (g∙cm−3), total N (g∙kg−1), and volume percentage of the fraction >2 mm at layer i (cm), respectively.
In order to evaluate the relationship between soil N density and soil depth, we referred to the methods of Dintwe et al. Their relationship was expressed using the exponential function [40]. The relationship between soil N density and soil depth in this study was shown as , and a and b are statistical parameters [40].
To evaluate the spatial soil N density patterns in the Tibetan shrublands, Kriging interpolation was used to scale up from the site level to the entire study region [41,42]. This interpolation was performed using ArcGIS 10.2 (Environment Systems Research Institute, Inc., Redlands, CA, USA), which interpolated actual measurements from the 183 soil profiles across 61 sampling sites.
The total soil N storage (NS) was then computed using Equation (2) as follows:
where Areai and NDi are the surface area and total soil density of the different shrubland types, respectively.
2.5. Statistical Analysis
The Turkey test was used to evaluate whether the soil N densities of the alpine and desert shrublands differed significantly at a 5% level (p < 0.05). Ordinary least squares regressions were used to estimate relationships among soil N density, MAT, and MAP. All analyses were performed using the R software package (R Project for Statistical Computing, Vienna, Austria), and graphs were generated using SigmaPlot 12.5 (Systat Software, Inc., Point Richmond, CA, USA).
3. Results
3.1. Soil N Storage and Density
In the Northeast Tibetan Plateau shrublands, the total soil N storage within a 100 cm depth was estimated at 132.40 Tg. The estimated soil N storage in the alpine shrublands (102.96 Tg) was significantly higher than that in the desert shrublands (29.44 Tg) (p < 0.05), and the ranges of the soil N storage are shown in Table 1.

Table 1.
Mean and standard deviation of soil N density and storage at depths of 0–30, 0–50 and 0–100 cm in shrublands on the Tibetan Plateau.
The respective soil N densities in the desert and alpine shrublands ranged from 0.01 to 0.34 kg m−2 and 0.03 to 1.87 kg m−2 at a 30 cm depth, from 0.03 to 0.68 kg m−2 and 0.20 to 2.69 kg m−2 at a 50 cm depth, and from 0.06 to 1.32 kg m−2 and 0.25 to 4.72 kg m−2 at a 100 cm depth. The mean soil N densities among all desert and alpine shrubland sites at the three soil depths (30, 50, and 100 cm) were 0.14 and 1.08 kg m−2, 0.24 and 1.61 kg m−2, and 0.44 and 2.40 kg m−2, respectively (Table 1). The mean overall soil N densities in the Northeast Tibetan Plateau shrublands at the same depths were 0.51, 0.78, and 1.21, respectively.
3.2. Spatial and Vertical Distributions
Soil N densities varied markedly across the 61 sampling sites (Figure 3). Spatially, soil N densities in the top 30 cm decreased from south to north and from east to west, with the lowest distribution in the northwest, similar to the top 50 cm and 100 cm (Figure 3). Vertically, soil N storage in the 30 cm and 50 cm surface layers accounted for 42% and 64% of the total 100 cm in the Tibetan Plateau shrublands (Table 1). Compared with the desert shrublands, the alpine shrublands soil had higher distributions of N stocks (32% vs. 45% at 30 cm and 55% vs. 67% at 50 cm; Table 1). Soil N density decreased with depth in the exponential function (Table 2).
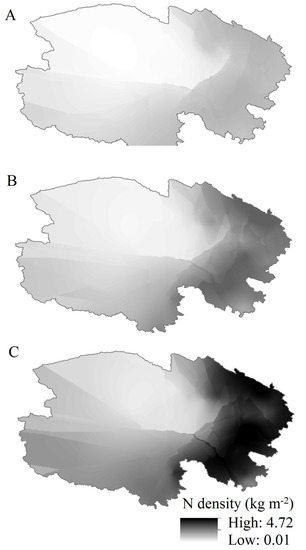
Figure 3.
Spatial distributions of soil N densities at different depths (A) 0–30 cm; (B) 0–50 cm; (C) 0–100 cm across the Northeast Tibetan Plateau.
Table 2.
Parameters a and b in the exponential equation for different shrublands types, which was described as .
3.3. Controlling Factors Affecting Soil N Patterns
Climatic factors can significantly affect soil N density in the top 30 cm. Overall, the soil N density in the Tibetan Plateau shrublands decreased significantly with the MAT and tended to significantly increase with the MAP (Figure 4A,B). Furthermore, the multiple regression showed that soil N density = −0.127 MAT + 0.002 MAP + 0.410 (p < 0.001, R2 = 0.57). However, different climate control factors were dominant in the different shrubland types. In the alpine shrublands, only MAT had a significant negative effect on N density (Figure 4D), whereas, in the desert shrublands, MAP tended to have a positive effect on N density (Figure 4H); MAP in the alpine shrublands and MAT in the desert shrublands had a weak effect on N density (Figure 4E–G). Soil pH has a negative relationship with N density (Figure 4C), both in alpine shrublands (Figure 4F) and desert shrublands (Figure 4I).
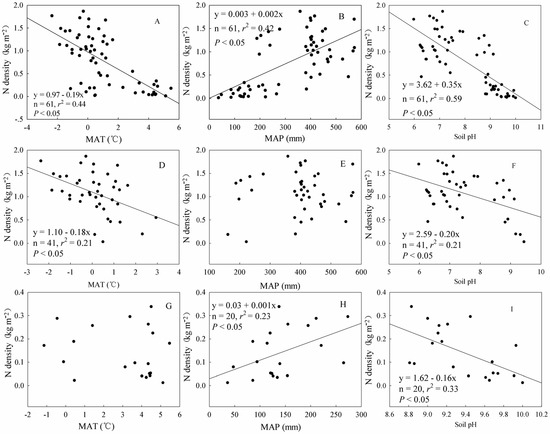
Figure 4.
Relationships between soil N density and the mean annual precipitation (MAP), mean annual temperature (MAT), and soil pH across the Tibetan Plateau. (A–C) All shrublands; (D–F) alpine shrublands; and (G–I) desert shrublands.
4. Discussion
4.1. Soil N Density
In our study, the soil N density at 100 cm was 1.21 kg m−2, consistent with values from an earlier study of Chinese shrublands (0.81–2.11 kg m−2) [14]. In another Chinese study, Yang et al. (2007), estimated mean soil N densities of 0.38, 0.56, and 0.84 kg m−2 at depths of 30, 50, and 100 cm, respectively, which were lower than our corresponding values of 0.51, 0.78, and 1.21 kg m−2. A previous study found that the densities of soil N stores potentially increase at high altitudes [22] as a result of both an increase in the organic matter input rate [43] and a decrease in the decomposition rate [22]. Therefore, the larger soil N stocks in high altitude ecosystems (such as Tibetan Plateau shrublands) relative to the mean soil N density in China are attributed to higher densities.
Soil N densities vary significantly among vegetation categories [19]. It has been demonstrated that vegetation has a N-fixing function in arctic tundra watershed ecosystems [44], and the N-fixing plants inevitably affect soil N density. In our study, soil N densities at depths of 30 cm, 50 cm, and 100 cm were significantly higher in alpine shrublands than those in desert shrublands (p < 0.05) (Table 1). N inputs from vegetation have significant effects on the soil N density [45]. There are three reasons to explain this difference. First of all, the MAP in most regions of alpine shrublands was between 400 and 600 mm, while it was 100–200 mm—sometimes even no more than 100 mm—in most regions of desert shrublands. The MAT in alpine shrublands was nearly 0 °C [35], while it was about 2 °C in sampling sites of desert shrublands. Compared with alpine shrublands, greater evaporation existed in desert shrublands [36]. Therefore, the climatic condition was that of extreme drought in the desert shrublands. Secondly, the growth season in alpine shrublands was from May to September [46], while in desert shrublands the growth season was shorter, from June to September [47]. Thirdly, soil types in desert shrublands were mainly infertile and thin desert soil, while, in alpine shrublands, it was meadow soil, which can provide more nutrition to plants [30]. Therefore, compared with alpine shrublands, extreme drought conditions, shorter growth season, and infertile soils result in less biomass in desert shrublands: 1988 g m−2 in alpine shrublands vs. 1798 g m−2 in desert shrublands [48]. Furthermore, compared with desert shrublands, there is greater litterfall from alpine shrubland input to the soil [36]. Therefore, compared with desert shrublands, alpine shrublands provide more fruitful conditions for plant growth, thus facilitating the accumulation of soil N density.
4.2. Spatial and Vertical Soil N Density Distribution
Estimations of soil N stock patterns can facilitate predictions of the potential effects of global environmental change [19]. In our study, soil N densities decreased spatially from south to north and from east to west. Higher soil N densities were observed in the south and northeast, with lower densities in the northwest (Figure 3). Climatic factors can significantly affect soil N densities [17]. Precipitation levels on the Tibetan Plateau, which range from humid to semi-humid and from semi-arid to arid [37], are roughly consistent with the observed decreasing trend in soil N density, and the temperatures ranging from alpine-temperate to alpine-cold zone [37] also exhibit a crude similarity to the increasing trend in soil N density.
Vertically, 42% and 64% of the total N stock were found at depths of 30 and 50 cm, respectively. These results were similar to those of Yang et al, who reported mean soil N proportions of 46% and 68% in the top 30 cm and 50 cm, respectively, in a Chinese study. Our results were also consistent with the reported mean global values (36–71% and 55–81% at 30 cm and 50 cm, respectively) [18]. Compared with desert shrublands, the surface soils of alpine shrublands contained more of the total soil N. Vegetation type significantly affects vertical soil N patterns [13], such that the lower organic content input to top soils in desert shrublands is partly responsible for the lower soil N accumulation relative to alpine shrublands.
4.3. Relationship between Soil N Density and MAT
In our study, the observation that soil N density decreased with increasing MAT (Figure 4A) was consistent with Yang et al., who indicated that, in humid eastern China, the soil N density increased from the tropical to cold-temperate zones. Those results were coupled with decreased microbial mineralization attributed to the colder temperatures [49]. However, soil N density remained stable with increasing temperature in the desert shrublands (Figure 4E), by contrast to the negative trend in the alpine shrublands (Figure 4C) as the stimulating effect of higher temperatures on microbial decomposition is more obvious in humid zones (e.g., alpine shrublands) than in arid regions (e.g., desert shrublands) [19].
If only the effects of global warming and the negative trend between soil N density and MAT are considered, one notices the potential for future decreases in soil N density in the alpine shrublands. It should be noted that anthropogenic nitrous pollutant emissions contribute to accelerate N deposition [50]. Therefore, changes in soil N should be subjected to additional monitoring and research in the future to accurately evaluate the relationships between MAT and soil N density under conditions of global warming.
4.4. Relationship between Soil N Density and MAP
We found that soil N density increased with increasing MAP across the Northeast Tibetan Plateau (Figure 4B). Similar findings were reported in the U.S. Great Plains, where decreases in soil N content from north to south were mainly attributed to decreased plant productivity, a consequence of decreasing precipitation [51]. Increased precipitation leads to an increase in vegetation productivity and, consequently, N densities increased in soil from arid to semi-arid and to humid zones ranging from west to east across Northern China [49].
Although precipitation can stimulate the accumulation of soil N in desert shrublands (Figure 4F), the soil N density in alpine shrublands did not increase with MAP (Figure 4D). Precipitation can significantly stimulate plant production in water-limiting regions [52,53], where plant production is a major determinant [51,52,54]. Compared with alpine shrublands, desert environments are drier, and plant growth is more sensitive to precipitation.
Although precipitation levels are increasing across the Tibetan Plateau, mainly in northern areas, a decreasing trend has been observed in southern regions [55]. Therefore, we conclude that, relative to those in southern areas, desert shrublands in northern regions of the Tibetan Plateau will exhibit a greater potential for increasing soil N density as a consequence of increased precipitation. By contrast, precipitation levels will not significantly affect soil N densities in alpine shrublands.
4.5. Relationship between Soil N Density, MAT, and MAP
The multiple regression result showed that climatic factors (MAT and MAP) could explain 57% of the total variation of soil N density in the Tibetan Plateau shrublands, which means that soil N density in the Tibetan Plateau shrublands is sensitive to climatic factors. However, the controlling climatic factor was different in both alpine shrubland (Figure 4D,E) and desert shrubland (Figure 4G,H).
Shrubland expansion is a global phenomenon and is occurring in many ecosystems, such as savannas and grasslands [56]. This expanding involves shrublands replacing herbaceous regions [57]. It has been demonstrated that climatic influences played a significant role in driving vegetation changes in the Arctic [56]. Increasing MAT was an important mediator of transitions from herb tundra to shrub tundra [58], and increased MAP also greatly contributed to Arctic vegetation changes [59]. Changing climatic conditions may also contribute to expansion of shrublands on the Tibetan Plateau. Soil N density differs in different vegetation categories [19]. Compared with herbaceous biomes, more litter comes not only from herbaceous lands, but also from shrublands in woody biomes. Thus, more litter input to the soil may contribute to soil N accumulation on the Tibetan Plateau in the future.
In the global climate change scenario, warming and increased precipitation not only have occurred [60], but also the increasing precipitation was uneven on the Tibetan Plateau [55]. Combining the contrary effects of MAT and MAP and uneven changes of climatic factors, long-term monitoring of soil N density was necessary to provide a more accurate assessment of climatic effects on soil N density for a given shrubland type.
4.6. Relationship between Soil N Density and Soil pH
In our study, soil pH significantly influenced soil N density such that the soil N density decreased as soil alkalization increased. In an alkaline soil environment, reduced solubility and consequent deficiencies of iron, manganese, and zinc [61] could limit plant growth. Therefore, litter input to the soil will be reduced, and accumulation of soil N will be limited.
Soil pH will reduce results from an increase in nitrogen deposition [28], which has been occurring on the Tibetan Plateau [50]. Therefore, soil pH has a trend of decreasing, which may promote an increase in soil N.
5. Conclusions
We investigated the soil total N storage, spatial and vertical density patterns, and related environmental factors using 183 soil profiles collected across the Northeast Tibetan Plateau shrublands. The estimated total N storage in the top 100 cm of soil was 132.40 Tg, and larger amounts of soil N were stored in alpine shrublands than in desert shrublands. Spatially, a decreasing trend in soil N density was observed from south to north and from east to west, whereas vertically, the top 30 and 50 cm of soil held 42% and 64% of the total N stores. Overall, climatic factors had significant effects on soil N density in the top 30 cm in the Tibetan Plateau shrublands, although these effects differed according to shrubland type. Soil N densities in alpine shrublands were more sensitive to temperature whereas in desert shrublands, only precipitation had a significant positive relationship on soil N density. Decreasing soil pH has the potential to promote an increase in soil N. Therefore, given the scenario of global climatic change, changes in soil N dynamics should be subjected to long-term monitoring, which will allow more accurate assessments of climatic effects on soil N density in the future.
Acknowledgments
We thank Yongheng Gao for positive and constructive advice in the revised manuscript. We also thank Zebing Zhong, Hechun Liu, and Yi Ning for facilitating our field surveys on the Tibetan Plateau and for their laboratory assistance. This study was funded by the National Science and Technology Support Project (2014BAC05B01), the National Program on Basic Work Project of China (2015FY11030001-5), and the Strategic Priority Research Program of CAS (XDA0505030304), the National Natural Science Foundation of China (40801076).
Author Contributions
Guoying Zhou conceived and designed the experiments; Guoying Zhou, Lucun Yang, Changbin Li, Xiuqing Nie, and Feng Xiong performed the experiments; Guoying Zhou, Xiuqing Nie and Feng Xiong, Lucun Yang analyzed the data; and Xiuqing Nie, Guoying Zhou and Feng Xiong, Lucun Yang wrote the paper.
Conflicts of Interest
The authors declare no conflict of interest. The founding sponsors had no role in the design of the study; in the collection, analyses, or interpretation of data; in the writing of the manuscript and in the decision to publish the results.
References
- Niu, S.; Wu, M.; Han, Y.I.; Xia, J.; Zhang, Z.H.E.; Yang, H.; Wan, S. Nitrogen effects on net ecosystem carbon exchange in a temperate steppe. Glob. Chang. Biol. 2010, 16, 144–155. [Google Scholar] [CrossRef]
- Liu, Y.; Wang, C.; He, N.; Wen, X.; Gao, Y.; Li, S.; Niu, S.; Butterbach-Bahl, K.; Luo, Y.; Yu, G. A global synthesis of the rate and temperature sensitivity of soil nitrogen mineralization: Latitudinal patterns and mechanisms. Glob. Chang. Biol. 2017, 23, 455–464. [Google Scholar] [CrossRef] [PubMed]
- Vitousek, P.M.; Howarth, R.W. Nitrogen limitation on land and in the sea: How can it occur? Biogeochemistry 1991, 13, 87–115. [Google Scholar] [CrossRef]
- Penuelas, J.; Poulter, B.; Sardans, J.; Ciais, P.; Van Der Velde, M.; Bopp, L.; Boucher, O.; Godderis, Y.; Hinsinger, P.; Llusia, J. Human-induced nitrogen–phosphorus imbalances alter natural and managed ecosystems across the globe. Nat. Commun. 2013, 4, 2934. [Google Scholar] [CrossRef] [PubMed]
- Tian, D.; Niu, S.; Pan, Q.; Ren, T.; Chen, S.; Bai, Y.; Han, X.; Whitehead, D. Nonlinear responses of ecosystem carbon fluxes and water-use efficiency to nitrogen addition in Inner Mongolia grassland. Funct. Ecol. 2016, 30, 490–499. [Google Scholar] [CrossRef]
- Galloway, J.N.; Townsend, A.R.; Erisman, J.W.; Bekunda, M.; Cai, Z.; Freney, J.R.; Martinelli, L.A.; Seitzinger, S.P.; Sutton, M.A. Transformation of the nitrogen cycle: Recent trends, questions, and potential solutions. Science 2008, 320, 889–892. [Google Scholar] [CrossRef] [PubMed]
- Chen, D.; Li, J.; Lan, Z.; Hu, S.; Bai, Y.; Niu, S. Soil acidification exerts a greater control on soil respiration than soil nitrogen availability in grasslands subjected to long-term nitrogen enrichment. Funct. Ecol. 2016, 30, 658–669. [Google Scholar] [CrossRef]
- Vitousek, P.M.; Aber, J.D.; Howarth, R.W.; Likens, G.E.; Matson, P.A.; Schindler, D.W.; Schlesinger, W.H.; Tilman, D.G. Human alteration of the global nitrogen cycle: Sources and consequences. Ecol. Appl. 1997, 7, 737–750. [Google Scholar] [CrossRef]
- LeBauer, D.S.; Treseder, K.K. Nitrogen limitation of net primary productivity in terrestrial ecosystems is globally distributed. Ecology 2008, 89, 371–379. [Google Scholar] [CrossRef] [PubMed]
- Bobbink, R.; Hicks, K.; Galloway, J.; Spranger, T.; Alkemade, R.; Ashmore, M.; Bustamante, M.; Cinderby, S.; Davidson, E.; Dentener, F. Global assessment of nitrogen deposition effects on terrestrial plant diversity: A synthesis. Ecol. Appl. 2010, 20, 30–59. [Google Scholar] [CrossRef] [PubMed]
- Nadelhoffer, K.J.; Emmett, B.A.; Gundersen, P.; Kjønaas, O.J.; Koopmans, C.J.; Schleppi, P.; Tietema, A.; Wright, R.F. Nitrogen deposition makes a minor contribution to carbon sequestration in temperate forests. Nature 1999, 398, 145–148. [Google Scholar] [CrossRef]
- Chapuis-Lardy, L.; Wrage, N.; Metay, A.; Chotte, J.L.; Bernoux, M. Soils, a sink for N2O? A review. Glob. Chang. Biol. 2007, 13, 1–17. [Google Scholar] [CrossRef]
- Schlesinger, W. (Ed.) Biogeochemistry: An Analysis of Global Change; Academic Press: San Diego, CA, USA, 1997. [Google Scholar]
- Tian, H.; Wang, S.; Liu, J.; Pan, S.; Chen, H.; Zhang, C.; Shi, X. Patterns of soil nitrogen storage in China. Glob. Biogeochem. Cycles 2006, 20. [Google Scholar] [CrossRef]
- Heimann, M.; Reichstein, M. Terrestrial ecosystem carbon dynamics and climate feedbacks. Nature 2008, 451, 289–292. [Google Scholar] [CrossRef] [PubMed]
- Luo, Y.; Su, B.; Currie, W.S.; Dukes, J.S.; Finzi, A.; Hartwig, U.; Hungate, B.; McMurtrie, R.E.; Oren, R.; Parton, W.J. Progressive nitrogen limitation of ecosystem responses to rising atmospheric carbon dioxide. Bioscience 2004, 54, 731–739. [Google Scholar] [CrossRef]
- Post, W.M.; Pastor, J.; Zinke, P.J.; Stangenberger, A.G. Global patterns of soil nitrogen storage. Nature 1985, 317, 613–616. [Google Scholar] [CrossRef]
- Batjes, N.H. Total carbon and nitrogen in the soils of the world. Eur. J. Soil Sci. 1996, 47, 151–163. [Google Scholar] [CrossRef]
- Yang, Y.; Ma, W.; A, M.; Fang, J. Storage, patterns and controls of soil nitrogen in China. Pedosphere 2007, 17, 776–785. [Google Scholar] [CrossRef]
- Xu, X.; Thornton, P.E.; Post, W.M. A global analysis of soil microbial biomass carbon, nitrogen and phosphorus in terrestrial ecosystems. Glob. Ecol. Biogeogr. 2013, 22, 737–749. [Google Scholar] [CrossRef]
- Liu, W.; Chen, S.; Qin, X.; Baumann, F.; Scholten, T.; Zhou, Z.; Sun, W.; Zhang, T.; Ren, J.; Qin, D. Storage, patterns, and control of soil organic carbon and nitrogen in the northeastern margin of the Qinghai–Tibetan plateau. Environ. Res. Lett. 2012, 7, 035401. [Google Scholar] [CrossRef]
- Tashi, S.; Singh, B.; Keitel, C.; Adams, M. Soil carbon and nitrogen stocks in forests along an altitudinal gradient in the eastern Himalayas and a meta-analysis of global data. Glob. Chang. Biol. 2016, 22, 2255–2268. [Google Scholar] [CrossRef] [PubMed]
- Ma, W.; Ding, K.; Li, Z. Comparison of soil carbon and nitrogen stocks at grazing-excluded and yak grazed alpine meadow sites in Qinghai–Tibetan plateau, China. Ecol. Eng. 2016, 87, 203–211. [Google Scholar] [CrossRef]
- Batjes, N.; Dijkshoorn, J. Carbon and nitrogen stocks in the soils of the Amazon region. Geoderma 1999, 89, 273–286. [Google Scholar] [CrossRef]
- Burke, I.C.; Lauenroth, W.K.; Cunfer, G.; Barrett, J.E.; Mosier, A.; Lowe, P. Nitrogen in the central grasslands region of the united states: Current anthropogenic additions of nitrogen to ecosystems of the US central grasslands far outweigh loss of nitrogen through crop removal, resulting in increased nitrogen fluxes with the potential to alter regional-scale biogeochemical cycling. BioScience 2002, 52, 813–823. [Google Scholar]
- Schlesinger, W.H.; Andrews, J.A. Soil respiration and the global carbon cycle. Biogeochemistry 2000, 48, 7–20. [Google Scholar] [CrossRef]
- Akpa, S.I.C.; Odeh, I.O.A.; Bishop, T.F.A.; Hartemink, A.E.; Amapu, I.Y. Total soil organic carbon and carbon sequestration potential in Nigeria. Geoderma 2016, 271, 202–215. [Google Scholar] [CrossRef]
- Yang, Y.; Li, P.; He, H.; Zhao, X.; Datta, A.; Ma, W.; Zhang, Y.; Liu, X.; Han, W.; Wilson, M.; et al. Long-term changes in soil pH across major forest ecosystems in China. Geophys. Res. Lett. 2015, 42, 933–940. [Google Scholar] [CrossRef]
- Ste-Marie, C.; Paré, D. Soil, pH and N availability effects on net nitrification in the forest floors of a range of boreal forest stands. Soil Biol. Biochem. 1999, 31, 1579–1589. [Google Scholar] [CrossRef]
- Dancer, W.S.; Peterson, L.A.; Chesters, G. Ammonification and nitrification of N as influenced by soil pH and previous N treatment. Soil Sci. Soc. Am. Proc. 1973, 37, 67–69. [Google Scholar] [CrossRef]
- Ding, J.; Chen, L.; Zhang, B.; Liu, L.; Yang, G.; Fang, K.; Chen, Y.; Li, F.; Kou, D.; Ji, C. Linking temperature sensitivity of soil CO2 release to substrate, environmental, and microbial properties across alpine ecosystems. Glob. Biogeochem. Cycles 2016, 30, 1310–1323. [Google Scholar] [CrossRef]
- Li, W.; Zhou, X. Ecosystem of Qinghai-Xizang (Tibetan) Plateau and Approach for Their Sustainable Management; Guangdong Science and Technology Press: Guangzhou, China, 1998. [Google Scholar]
- Zhang, Y.; Li, B.; Zheng, G.A. discussion on the boundary and area of the Tibetan Plateau in China. Geogr. Res. 2002, 2, 2–8. [Google Scholar]
- Wu, Z. Vegetation of China; Science Press: Beijing, China, 1980; p. 430. [Google Scholar]
- Zhou, X.; Wang, Z.B.; Du, Q. Vegetation of Qinghai; Qinghai People’s Publishing House: Xining, China, 1987; pp. 53–72. [Google Scholar]
- Wu, B.; Ruan, W.; Zhang, X.; Li, L.; Guo, H.; Li, J.; Gao, Y. Diversity of soil nematode community in roots of Caragana Fabr. In the Inner Mongolia Plateau, China. Chin. J. Appl. Environ. Biol. 2008, 14, 624–629. [Google Scholar]
- Zhang, Z. Geography of Qinghai Plateau; Science Press: Beijing, China, 2009; pp. 25–26. [Google Scholar]
- Hou, X. Vegetation Altas of China; Science Press: Beijing, China, 2001. [Google Scholar]
- Technical Manual Writing Group of Ecosystem Carbon Sequestration Project. Observation and Investigation for Carbon Sequestration in Terrestrial Ecosystems; Science Press: Beijing, China, 2015; pp. 153–155. [Google Scholar]
- Dintwe, K.; Okin, G.S.; D’Odorico, P.; Hrast, T.; Mladenov, N.; Handorean, A.; Bhattachan, A.; Caylor, K.K. Soil organic C and total N pools in the Kalahari: Potential impacts of climate change on C sequestration in Savannas. Plant Soil 2014, 396, 27–44. [Google Scholar]
- Yang, Y.; Fang, J.; Ji, C.; Ma, W.; Su, S.; Tang, Z. Soil inorganic carbon stock in the Tibetan alpine grasslands. Glob. Biogeochem. Cycles 2010, 24. [Google Scholar] [CrossRef]
- Deng, X.; Zhan, Y.; Wang, F.; Ma, W.; Ren, Z.; Chen, X.; Qin, F.; Long, W.; Zhu, Z.; Lv, X. Soil organic carbon of an intensively reclaimed region in China: Current status and carbon sequestration potential. Sci. Total. Environ. 2016, 565, 539–546. [Google Scholar] [CrossRef] [PubMed]
- Parfitt, R.; Giltrap, D.; Whitton, J. Contribution of organic matter and clay minerals to the cation exchange capacity of soils. Commun. Soil Sci. Plant Anal. 1995, 26, 1343–1355. [Google Scholar] [CrossRef]
- Hobara, S.; McCalley, C.; Koba, K.; Giblin, A.E.; Weiss, M.S.; Gettle, G.M.; Shaver, G.R. Nitrogen fixation in surface soils and vegetation in an Arctic tundra watershed: A key source of atmospheric nitrogen. Arct. Antaractic Alp. Res. 2006, 38, 363–372. [Google Scholar] [CrossRef]
- Weil, R.R.; Brady, N.C.; Weil, R.R. The Nature and Properties of Soil; Prentice-Hall Press: New York, NY, USA, 2004; pp. 526–529. [Google Scholar]
- Xu, S.; Zhao, L.; Zhao, X.; Li, Y.; Gu, S. Carbon dioxide flux characteristics of alpine shrubs in Qinghai–Tibet plateau beyond the growing season. Acta Bot. Boreali Occident. Sin. 2005, 26, 2528–2532. [Google Scholar]
- Zhu, J.; Chen, H.; Xing, X.; Chen, T. Quantification analysis of water sources of desert plants in Qaidam Basin: A case study of Golmud plot. Geograph. Res. 2015, 34, 285–292. [Google Scholar]
- Nie, X.; Yang, Y.; Yang, L.; Zhou, G. Above- and belowground biomass allocation in shrub biomes across the northeast Tibetan plateau. PLoS ONE 2016, 11, e0154251. [Google Scholar] [CrossRef] [PubMed]
- Wu, H.; Guo, Z.; Peng, C. Distribution and storage of soil organic carbon in China. Glob. Biogeochem. Cycles 2003, 17. [Google Scholar] [CrossRef]
- Lü, C.; Tian, H. Spatial and temporal patterns of nitrogen deposition in China: Synthesis of observational data. J. Geophys. Res. 2007, 112. [Google Scholar] [CrossRef]
- Epstein, H.E.; Burke, I.C.; Lauenroth, W.K. Regional patterns of decomposition and primary production rates in the US great plains. Ecology 2002, 83, 320–327. [Google Scholar]
- Jobbágy, E.G.; Jackson, R.B. The vertical distribution of soil organic carbon and its relation to climate and vegetation. Ecol. Appl. 2000, 10, 423–436. [Google Scholar] [CrossRef]
- Wynn, J.G.; Bird, M.I.; Vellen, L.; Grand-Clement, E.; Carter, J.; Berry, S.L. Continental-scale measurement of the soil organic carbon pool with climatic, edaphic, and biotic controls. Global Biogeochem. Cycles 2006, 20. [Google Scholar] [CrossRef]
- Austin, A.T. Differential effects of precipitation on production and decomposition along a rainfall gradient in Hawaii. Ecology 2002, 83, 328–338. [Google Scholar]
- Duan, K.; Yao, T.; Wang, K.; Tian, L.; Xu, B. The difference in precipitation variability between the north and south Tibetan plateaus. J. Glaciol Geocryol. 2008, 30, 726–732. [Google Scholar]
- Naito, A.T.; Cairns, D.M. Patterns of process of global shrub expansion. Prog. Phys. Geog. 2011, 35, 423–442. [Google Scholar] [CrossRef]
- Lunt, I.D.; Winsemius, L.M.; McDonald, S.P.; Morgan, J.W.; Dehaan, R.L. How widespread is woody plant encroachment in temperate Australia? Changes in woody vegetation cover in lowland woodland and coastal ecosystems in Victoria from 1989 to 2005. J. Biogeogr. 2010, 37, 722–732. [Google Scholar] [CrossRef]
- Anderson, P.M.; Brubaker, L.B. Vegetation history of northcentral Alaska: A mapped summary of late-quaternary pollen data. Quatern. Sci Rev. 1994, 13, 71–92. [Google Scholar] [CrossRef]
- Mann, D.H.; Peteet, D.M.; Reanier, R.E.; Kunz, M.L. Responses of an arctic landscape to Lateglacial and early Holocene climatic changes: The importance of moisture. Quatern. Sci. Rev. 2002, 21, 997–1021. [Google Scholar] [CrossRef]
- Yang, Y. Carbon and Nitrogen Storage in Alpine Grasslands on the Tibetan Plateau. Ph.D. Dissertation, Peking University, Beijing, China, 2008. [Google Scholar]
- Sims, J.T. Soil pH effects on the distribution and plant availability of manganese, copper, and zinc. Soil. Sci. Soc. Am. J. 1986, 50, 367–373. [Google Scholar] [CrossRef]
© 2017 by the authors. Licensee MDPI, Basel, Switzerland. This article is an open access article distributed under the terms and conditions of the Creative Commons Attribution (CC BY) license (http://creativecommons.org/licenses/by/4.0/).