Projecting Land Use Changes by Integrating Site Suitability Analysis with Historic Land Use Change Dynamics in the Context of Increasing Demand for Wood Pellets in the Southern United States

Abstract
:1. Introduction
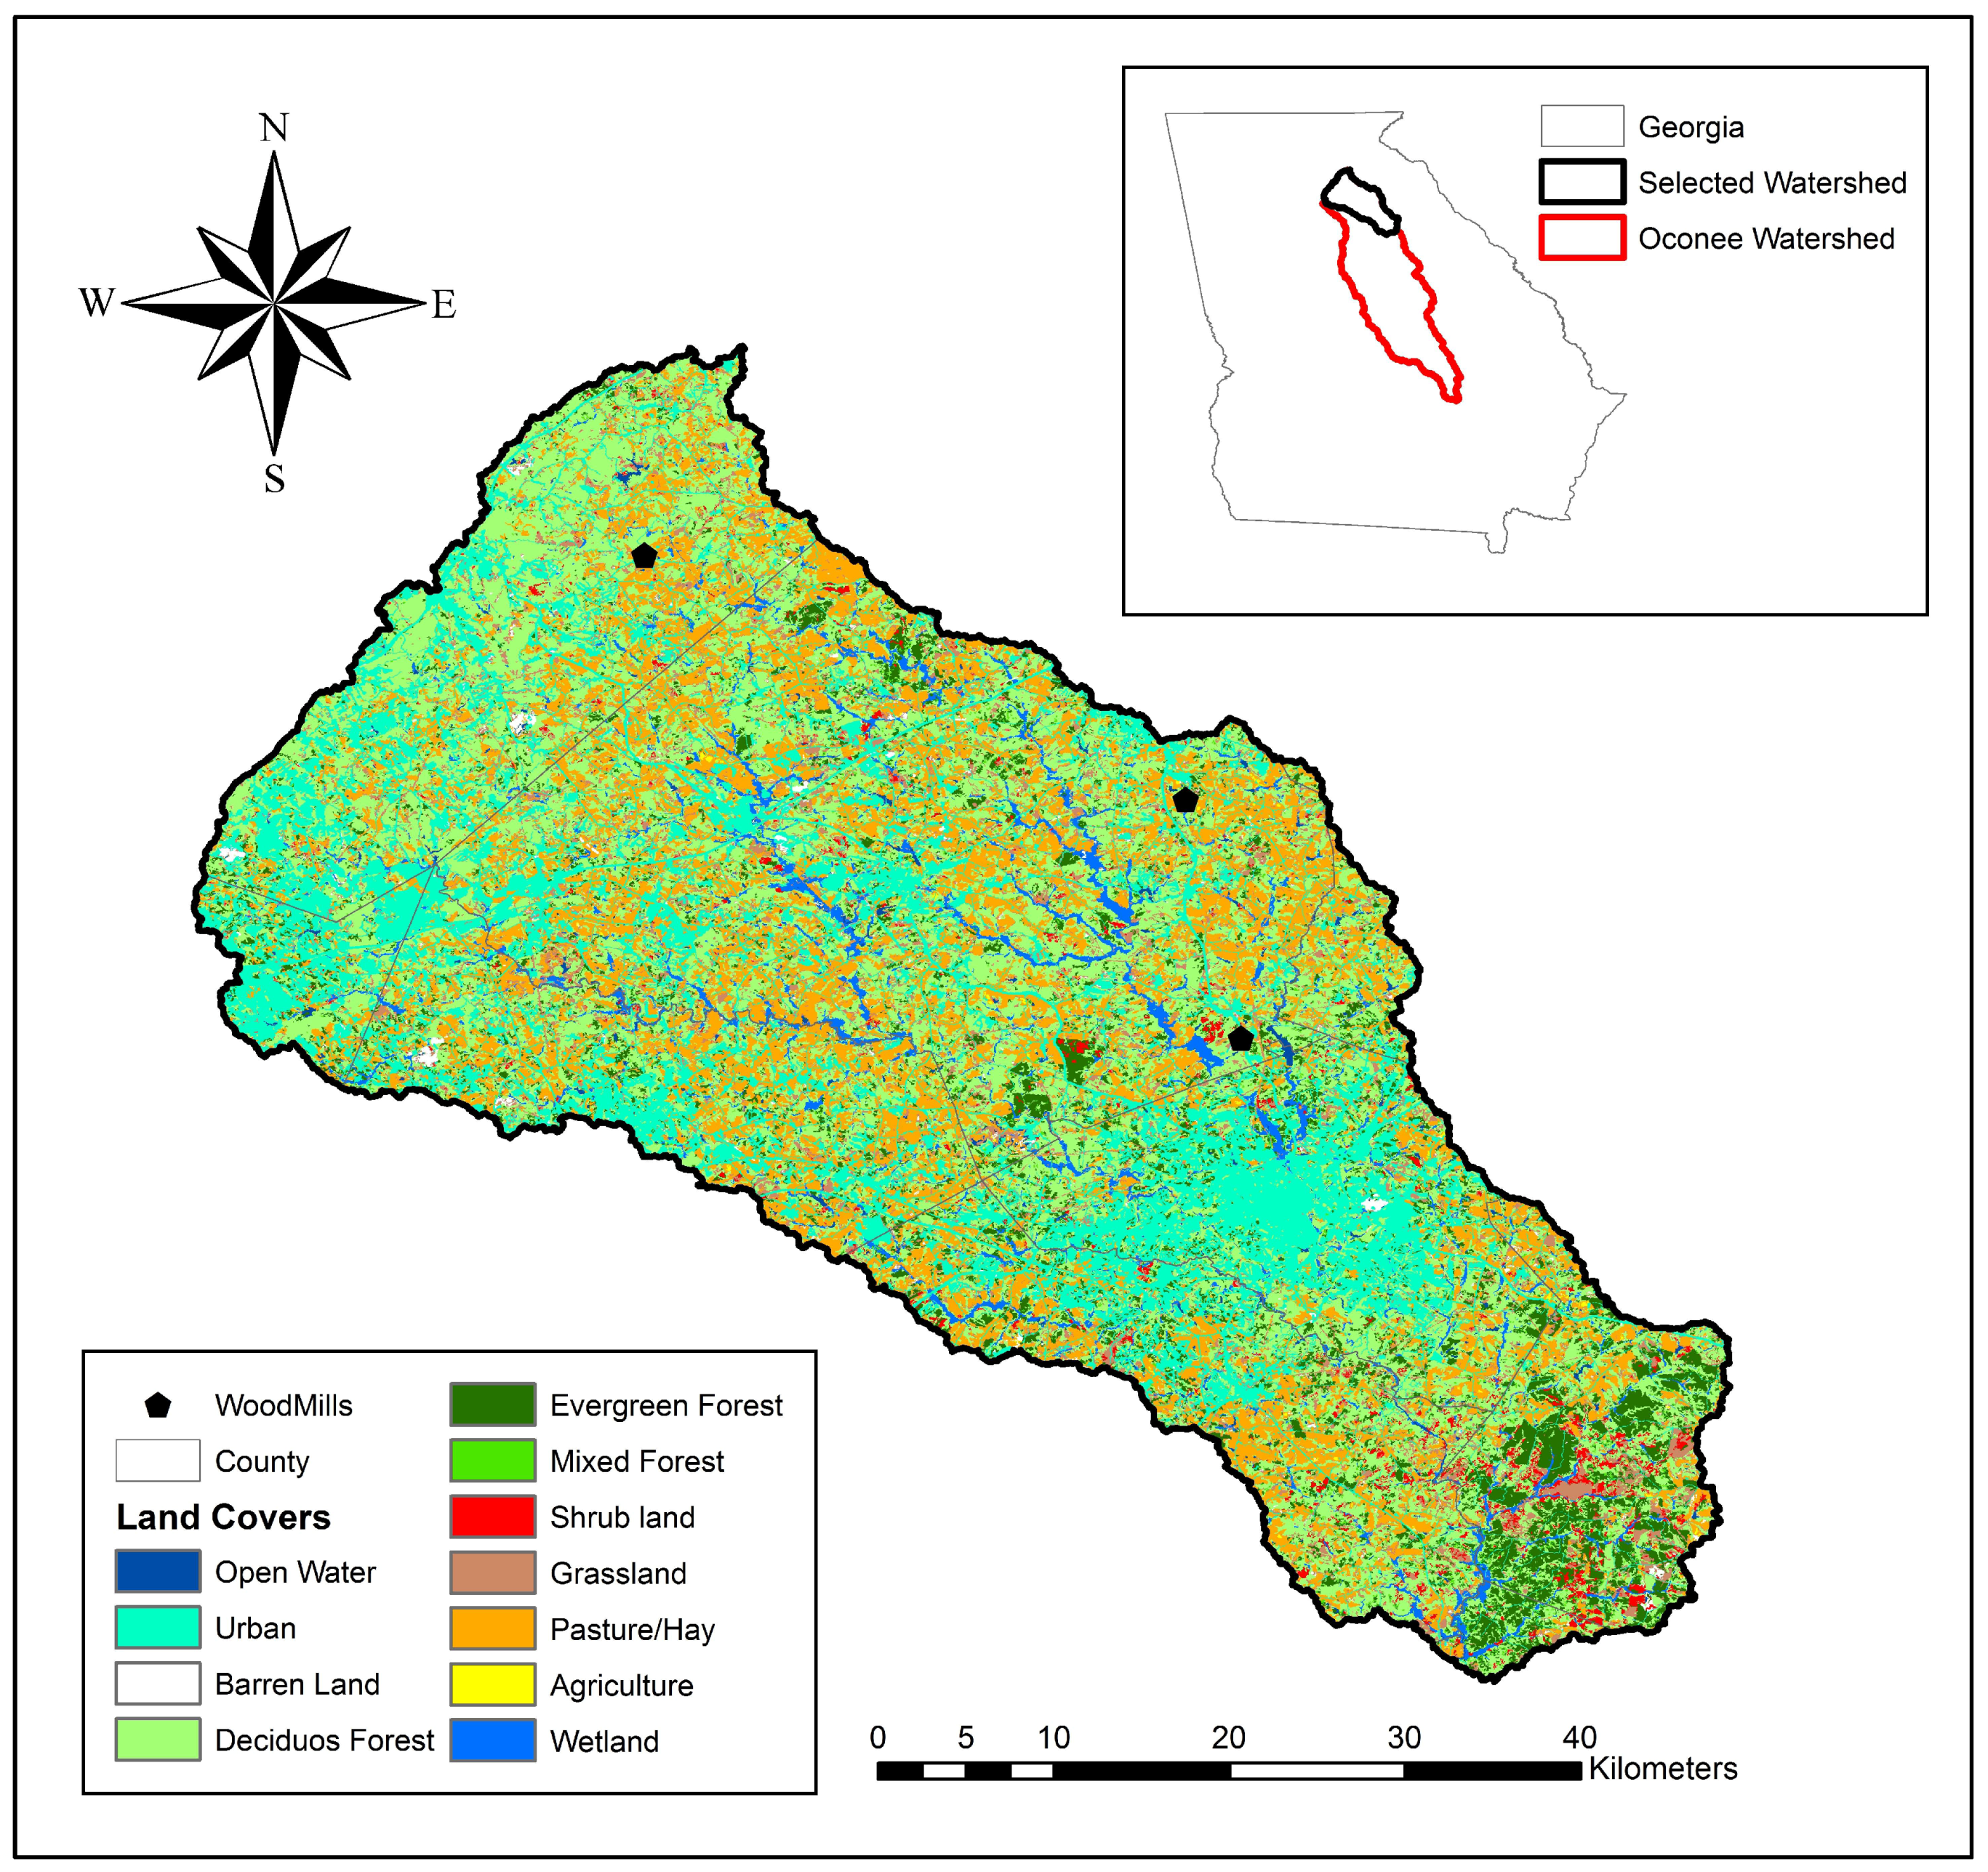
2. Study Area
3. Materials and Methods
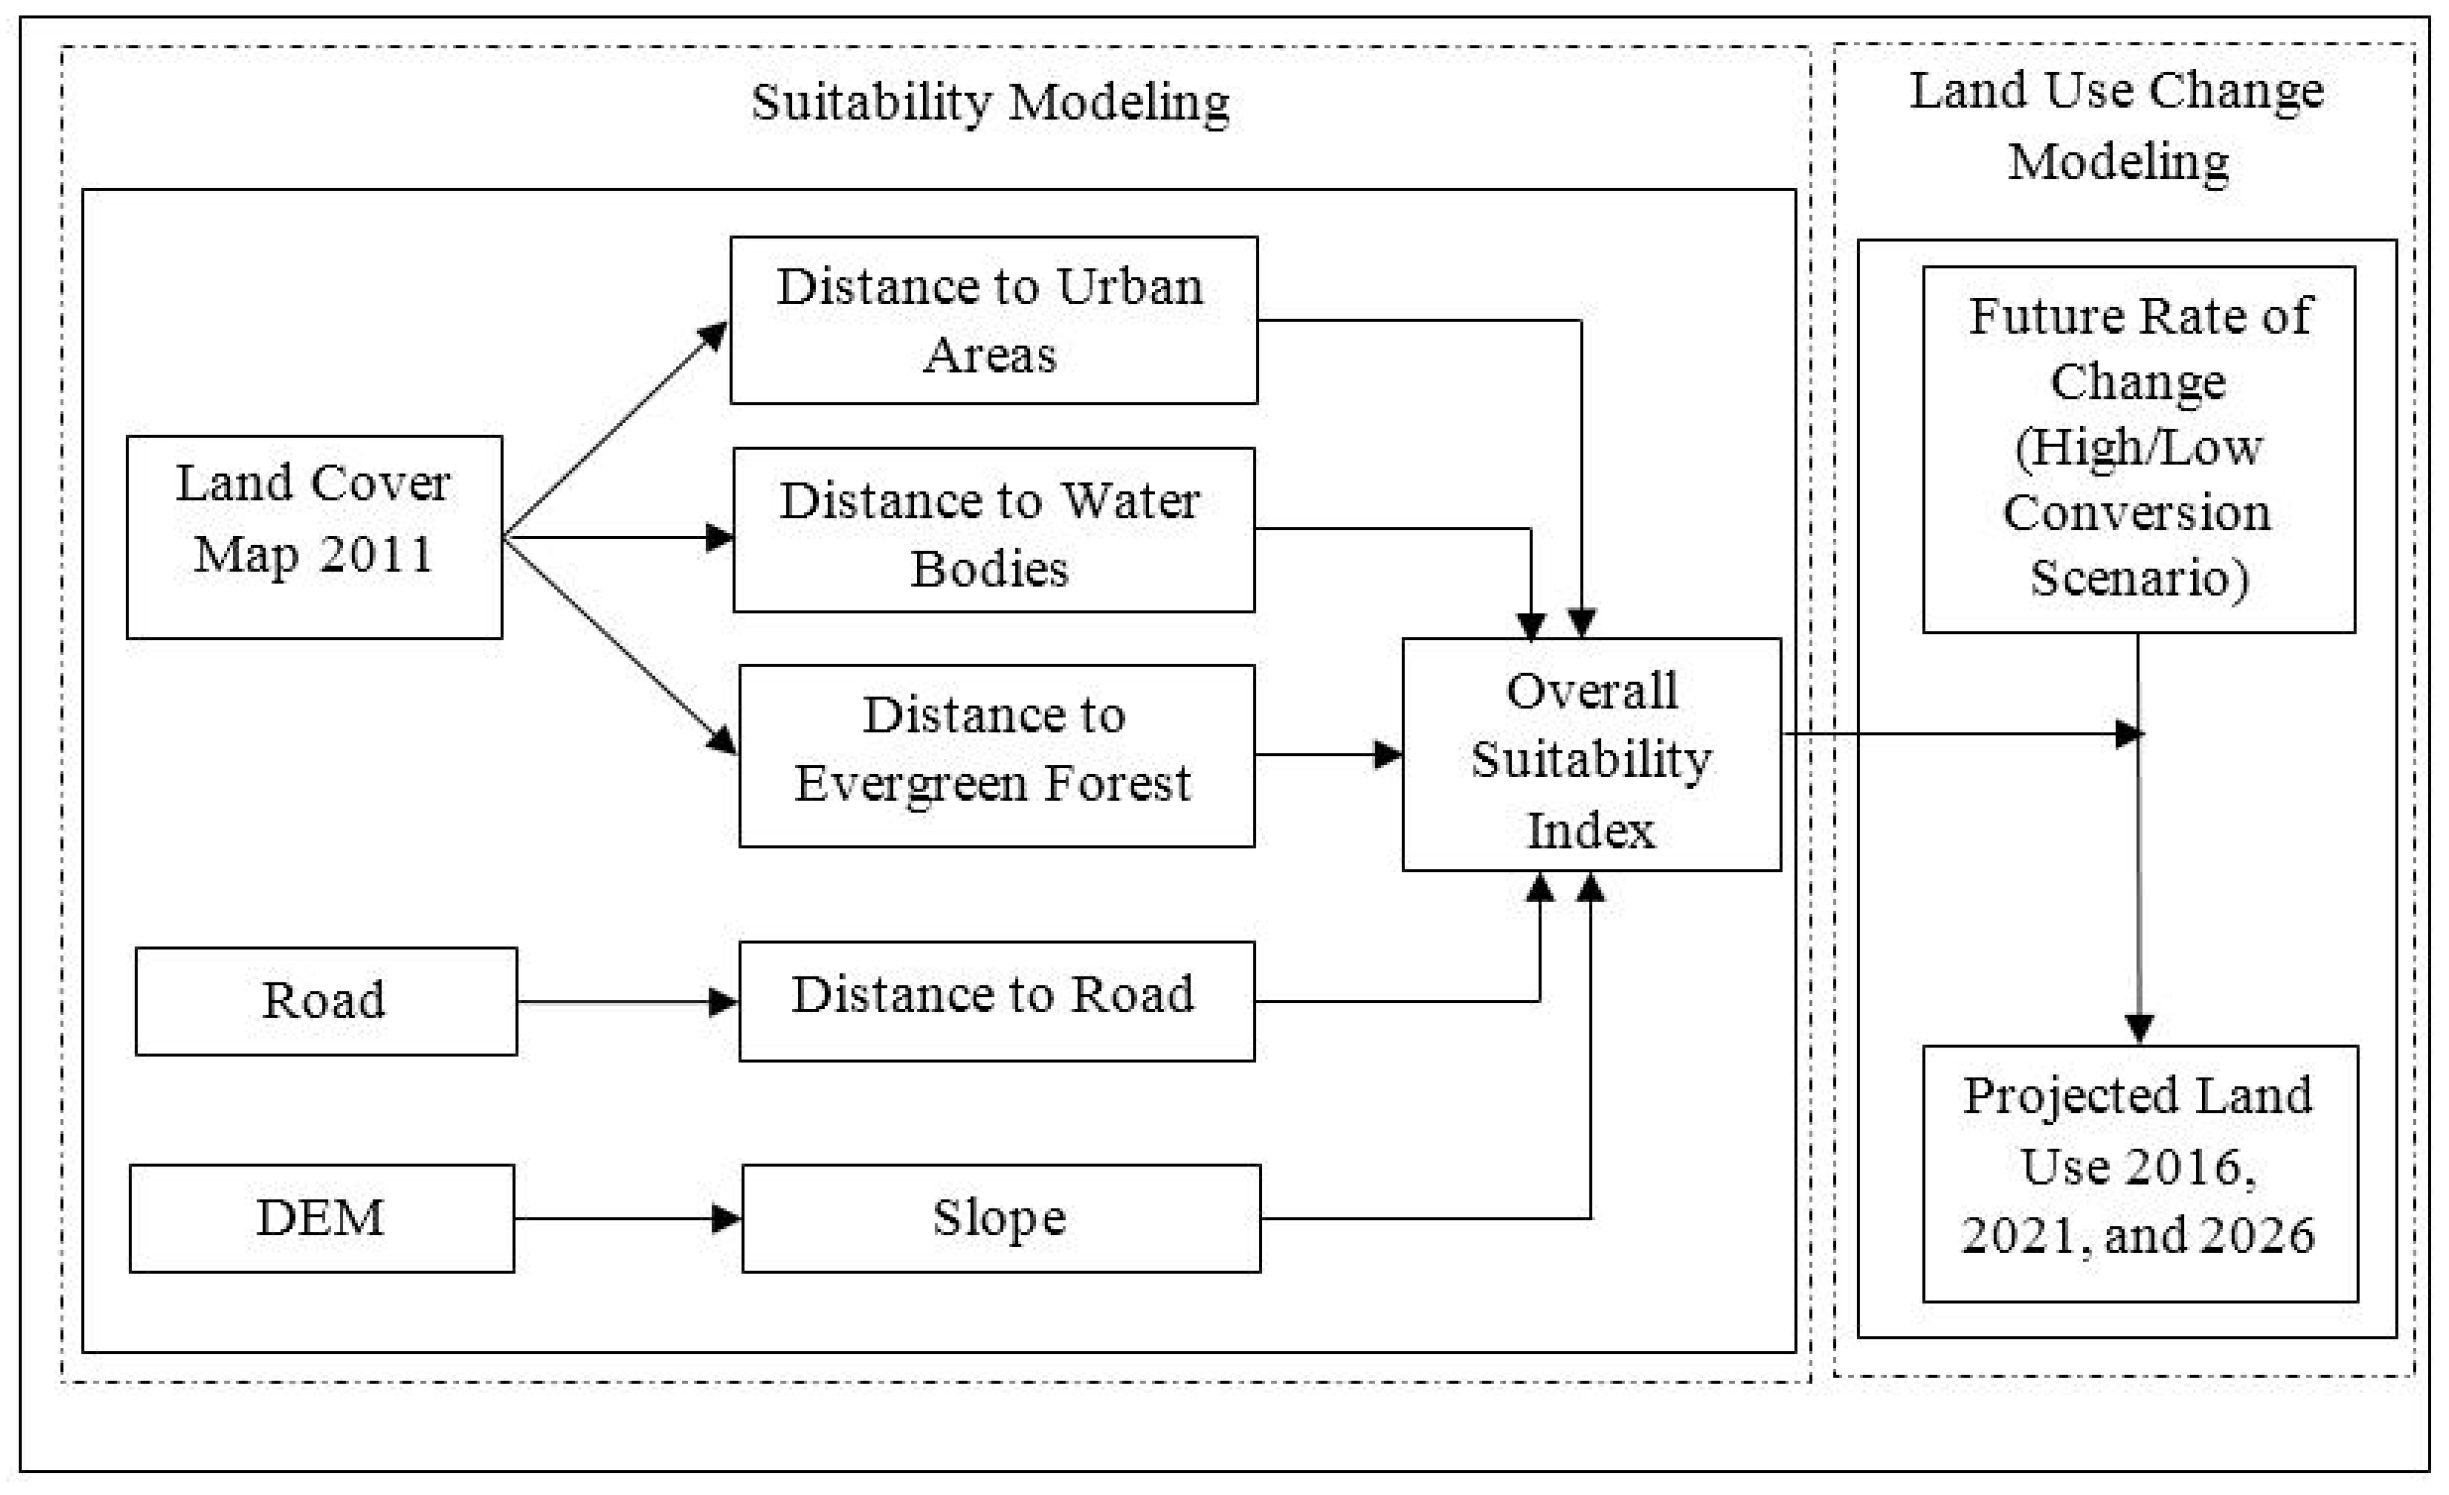
3.1. Suitability Modeling
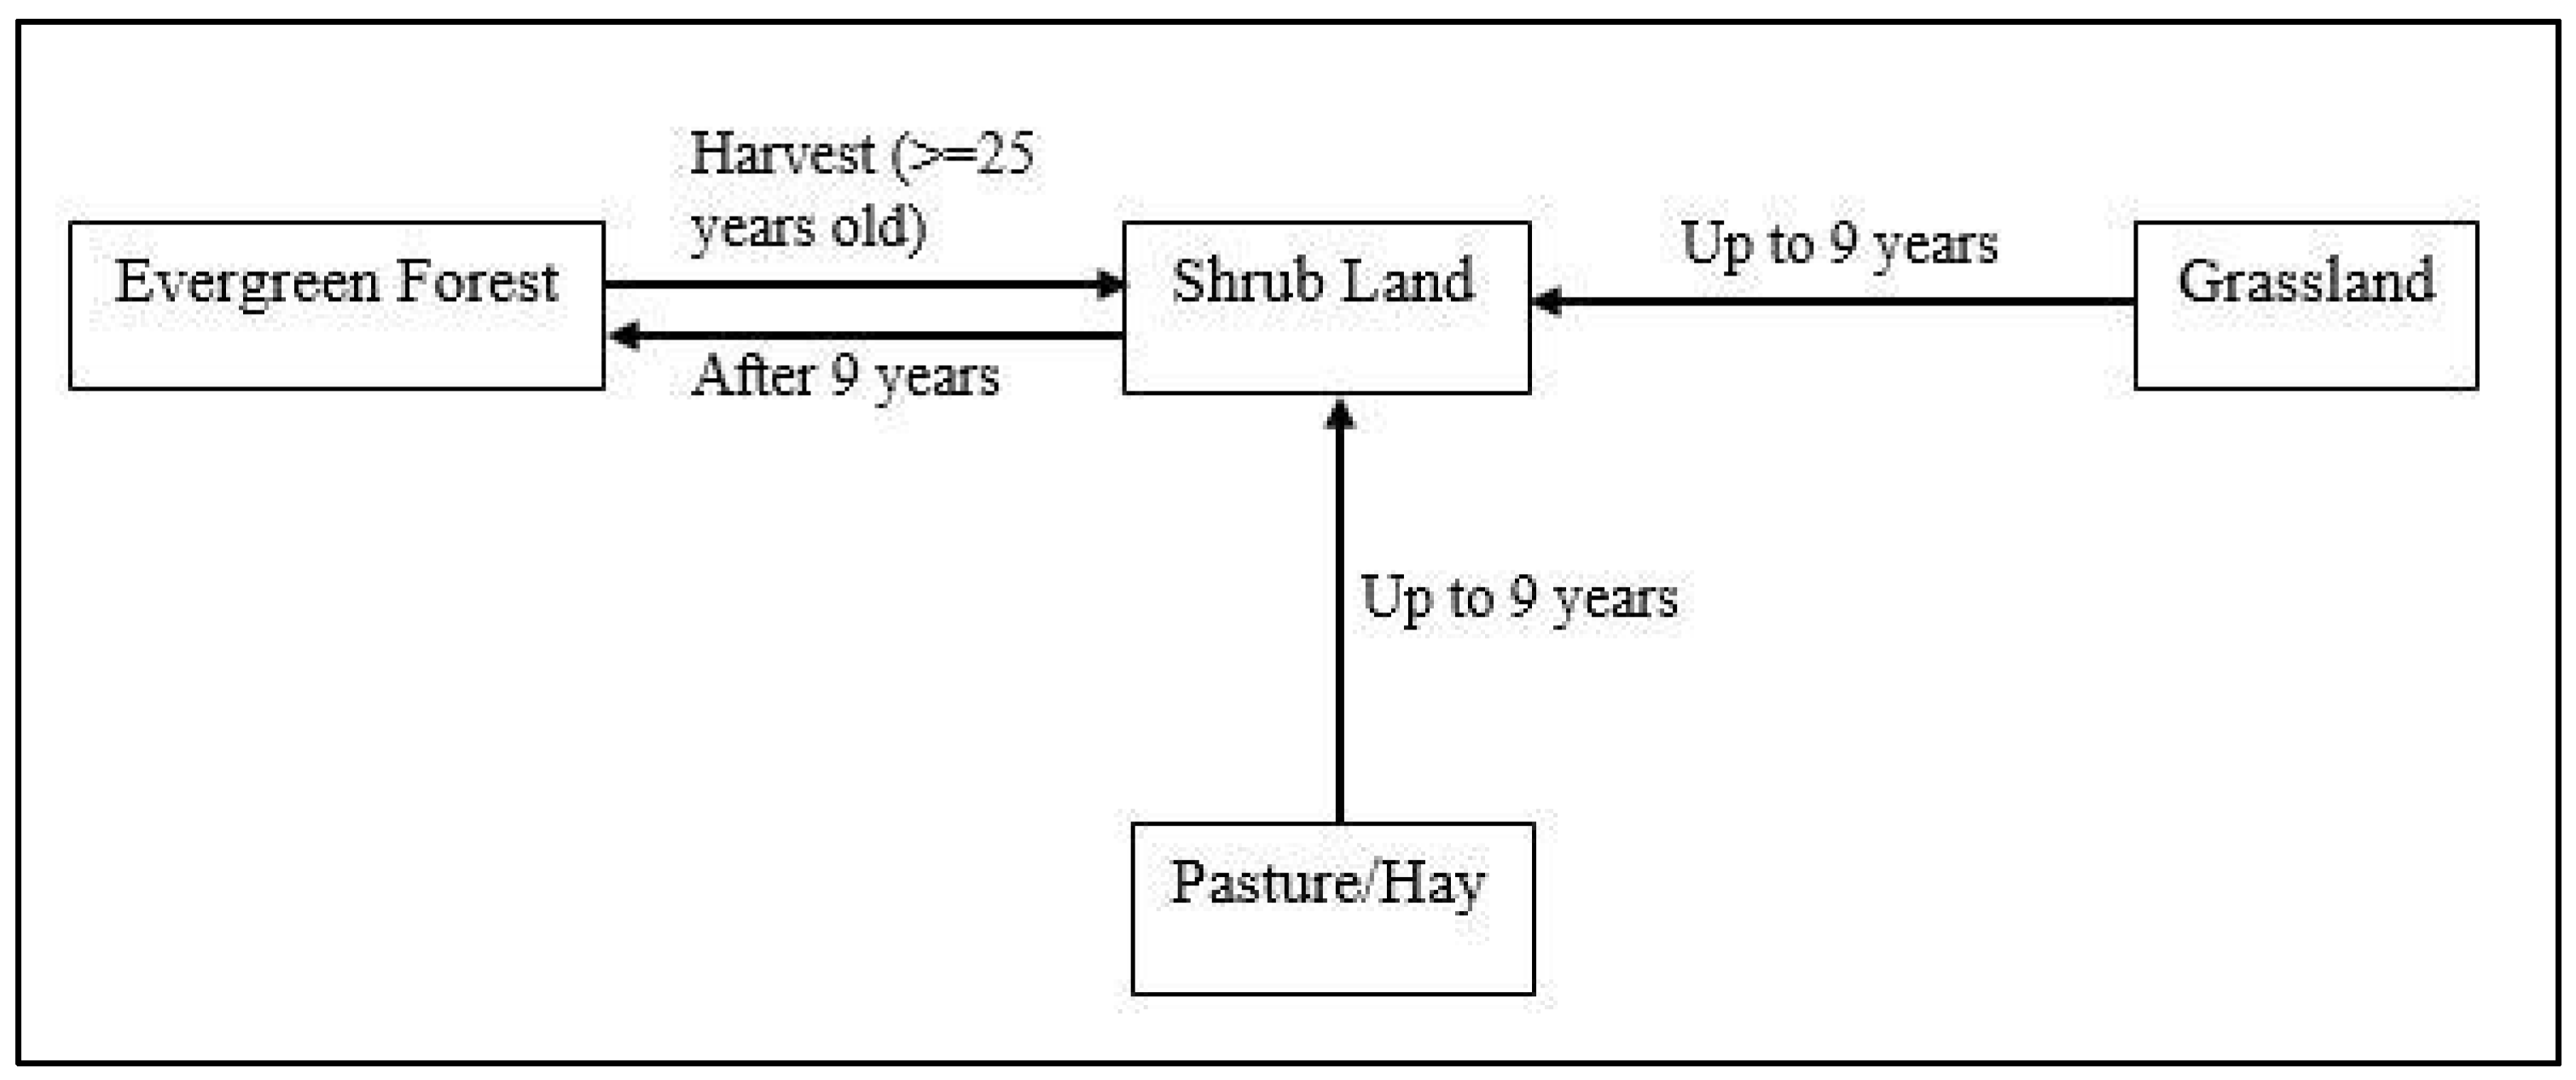
3.2. Historical and Future Changes in Land Use
3.3. Projection of Land Use Changes
4. Results
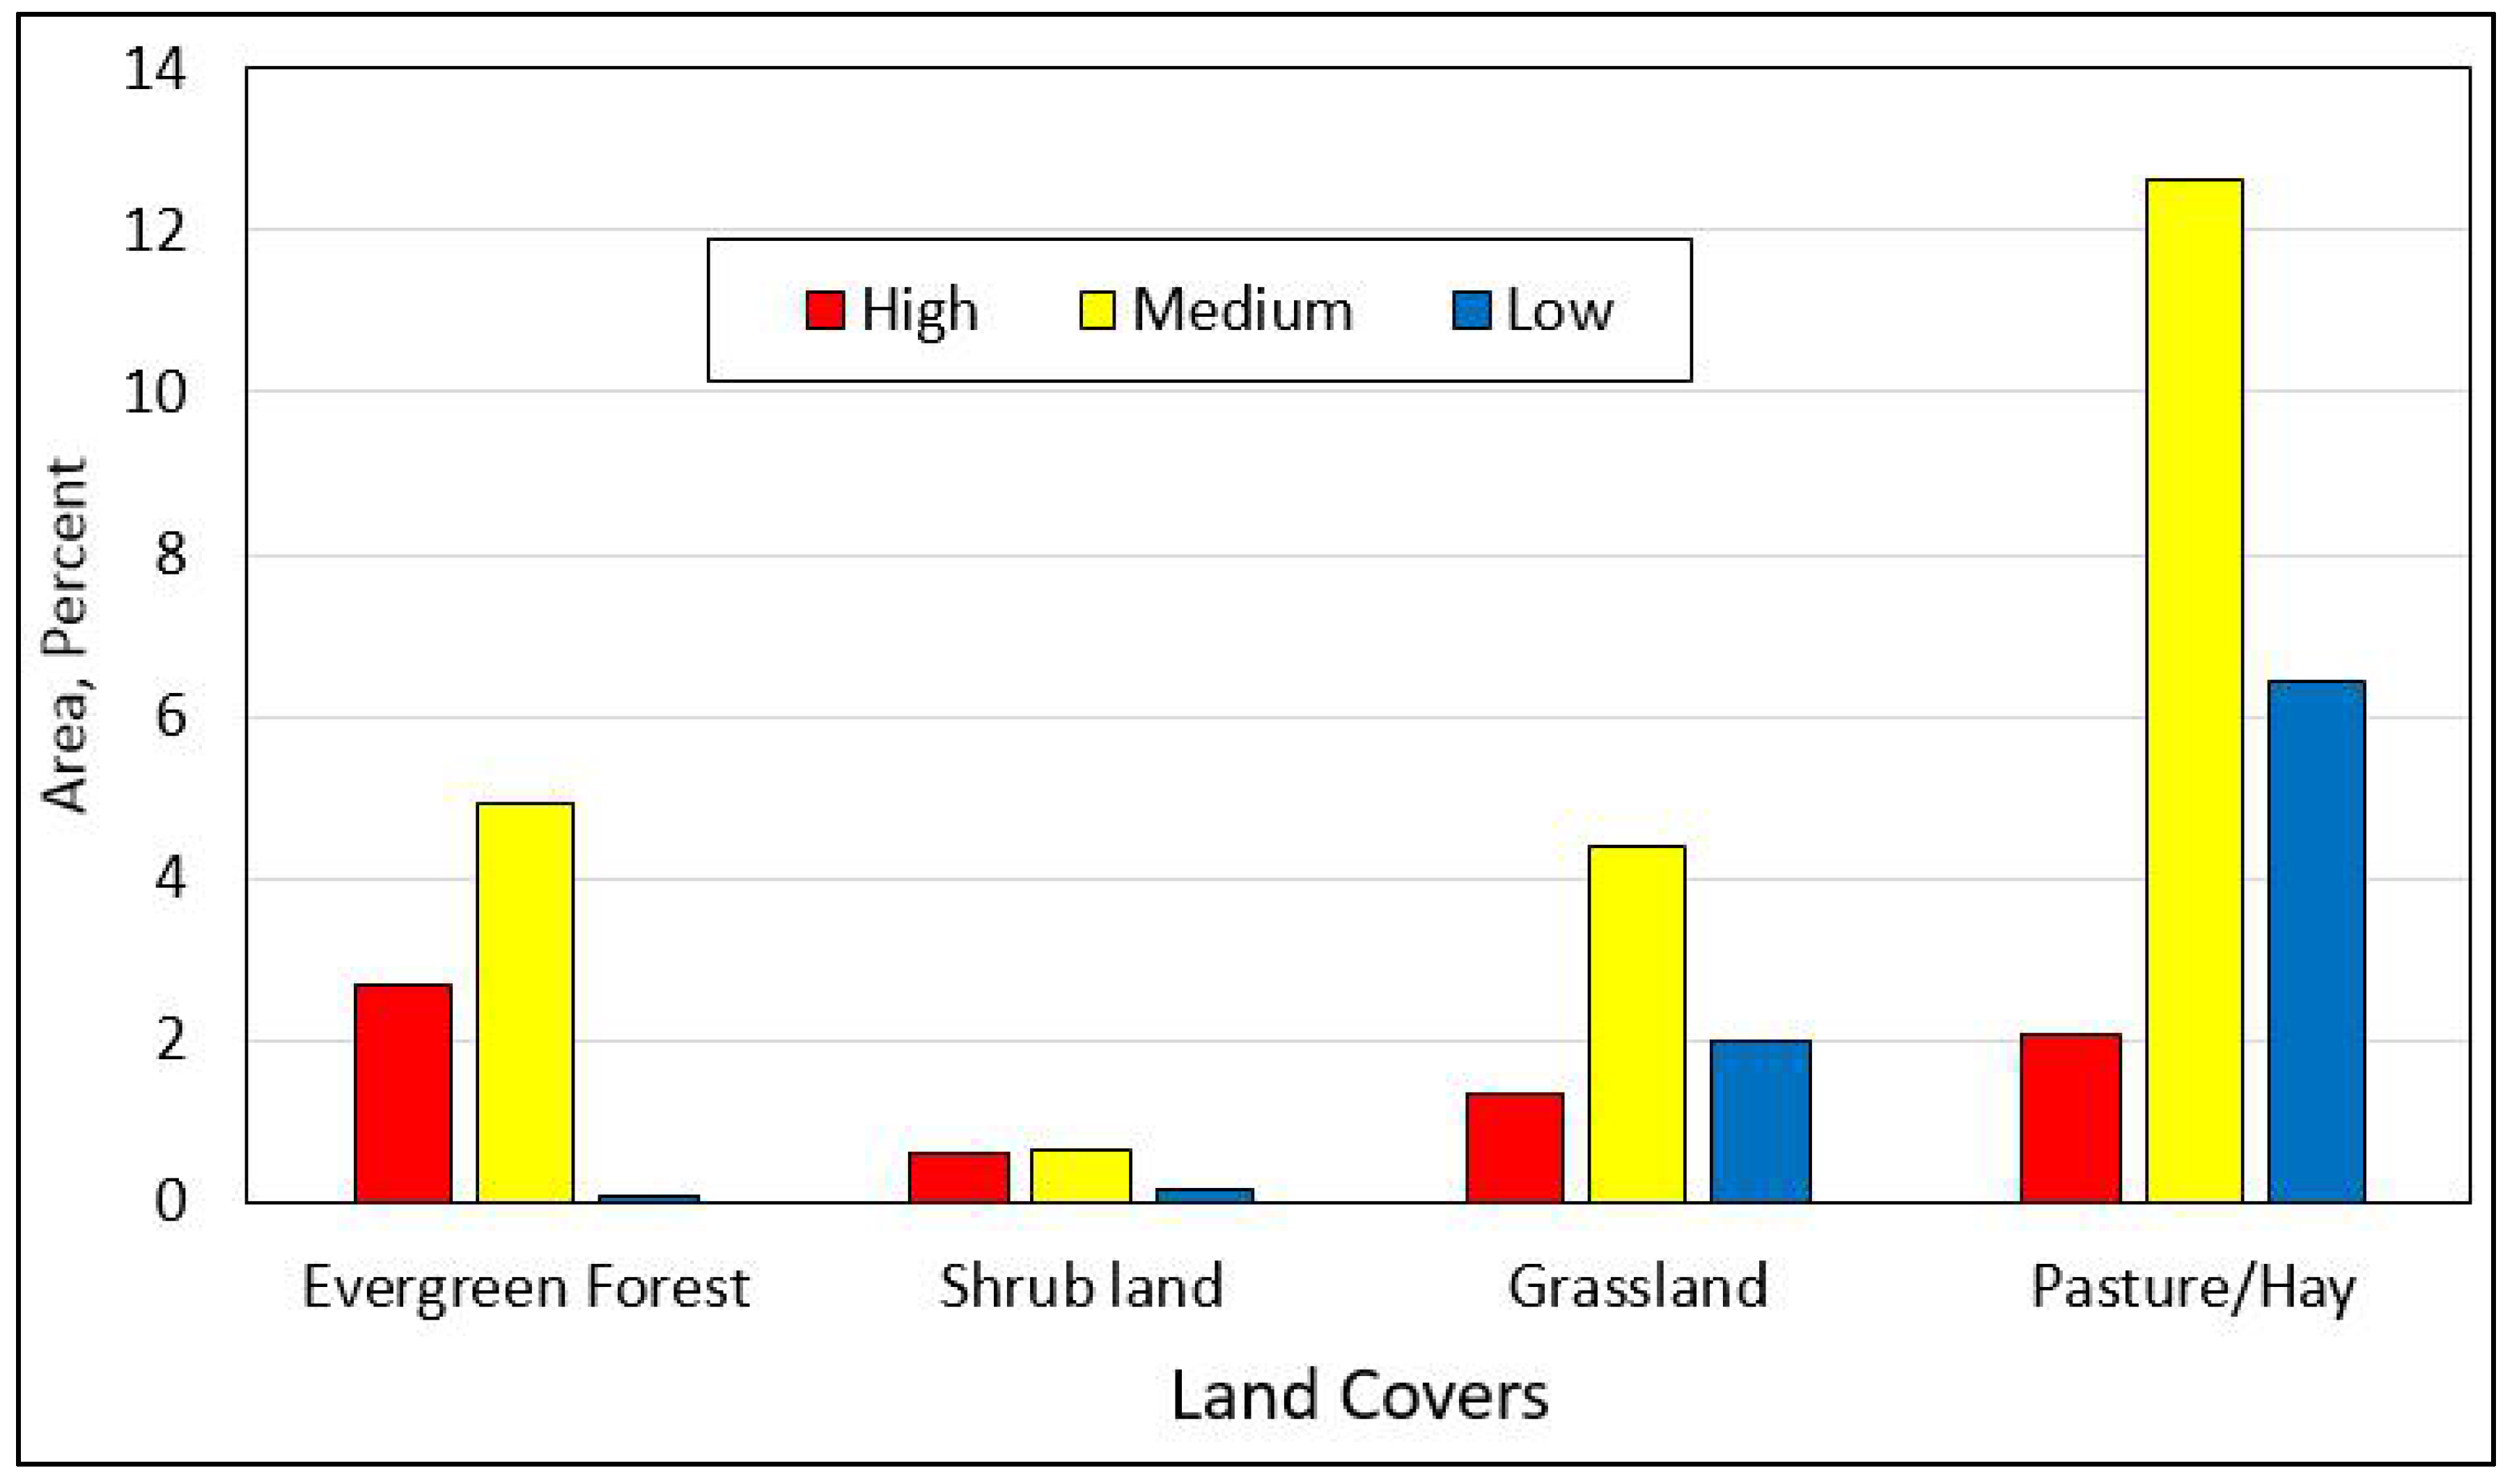
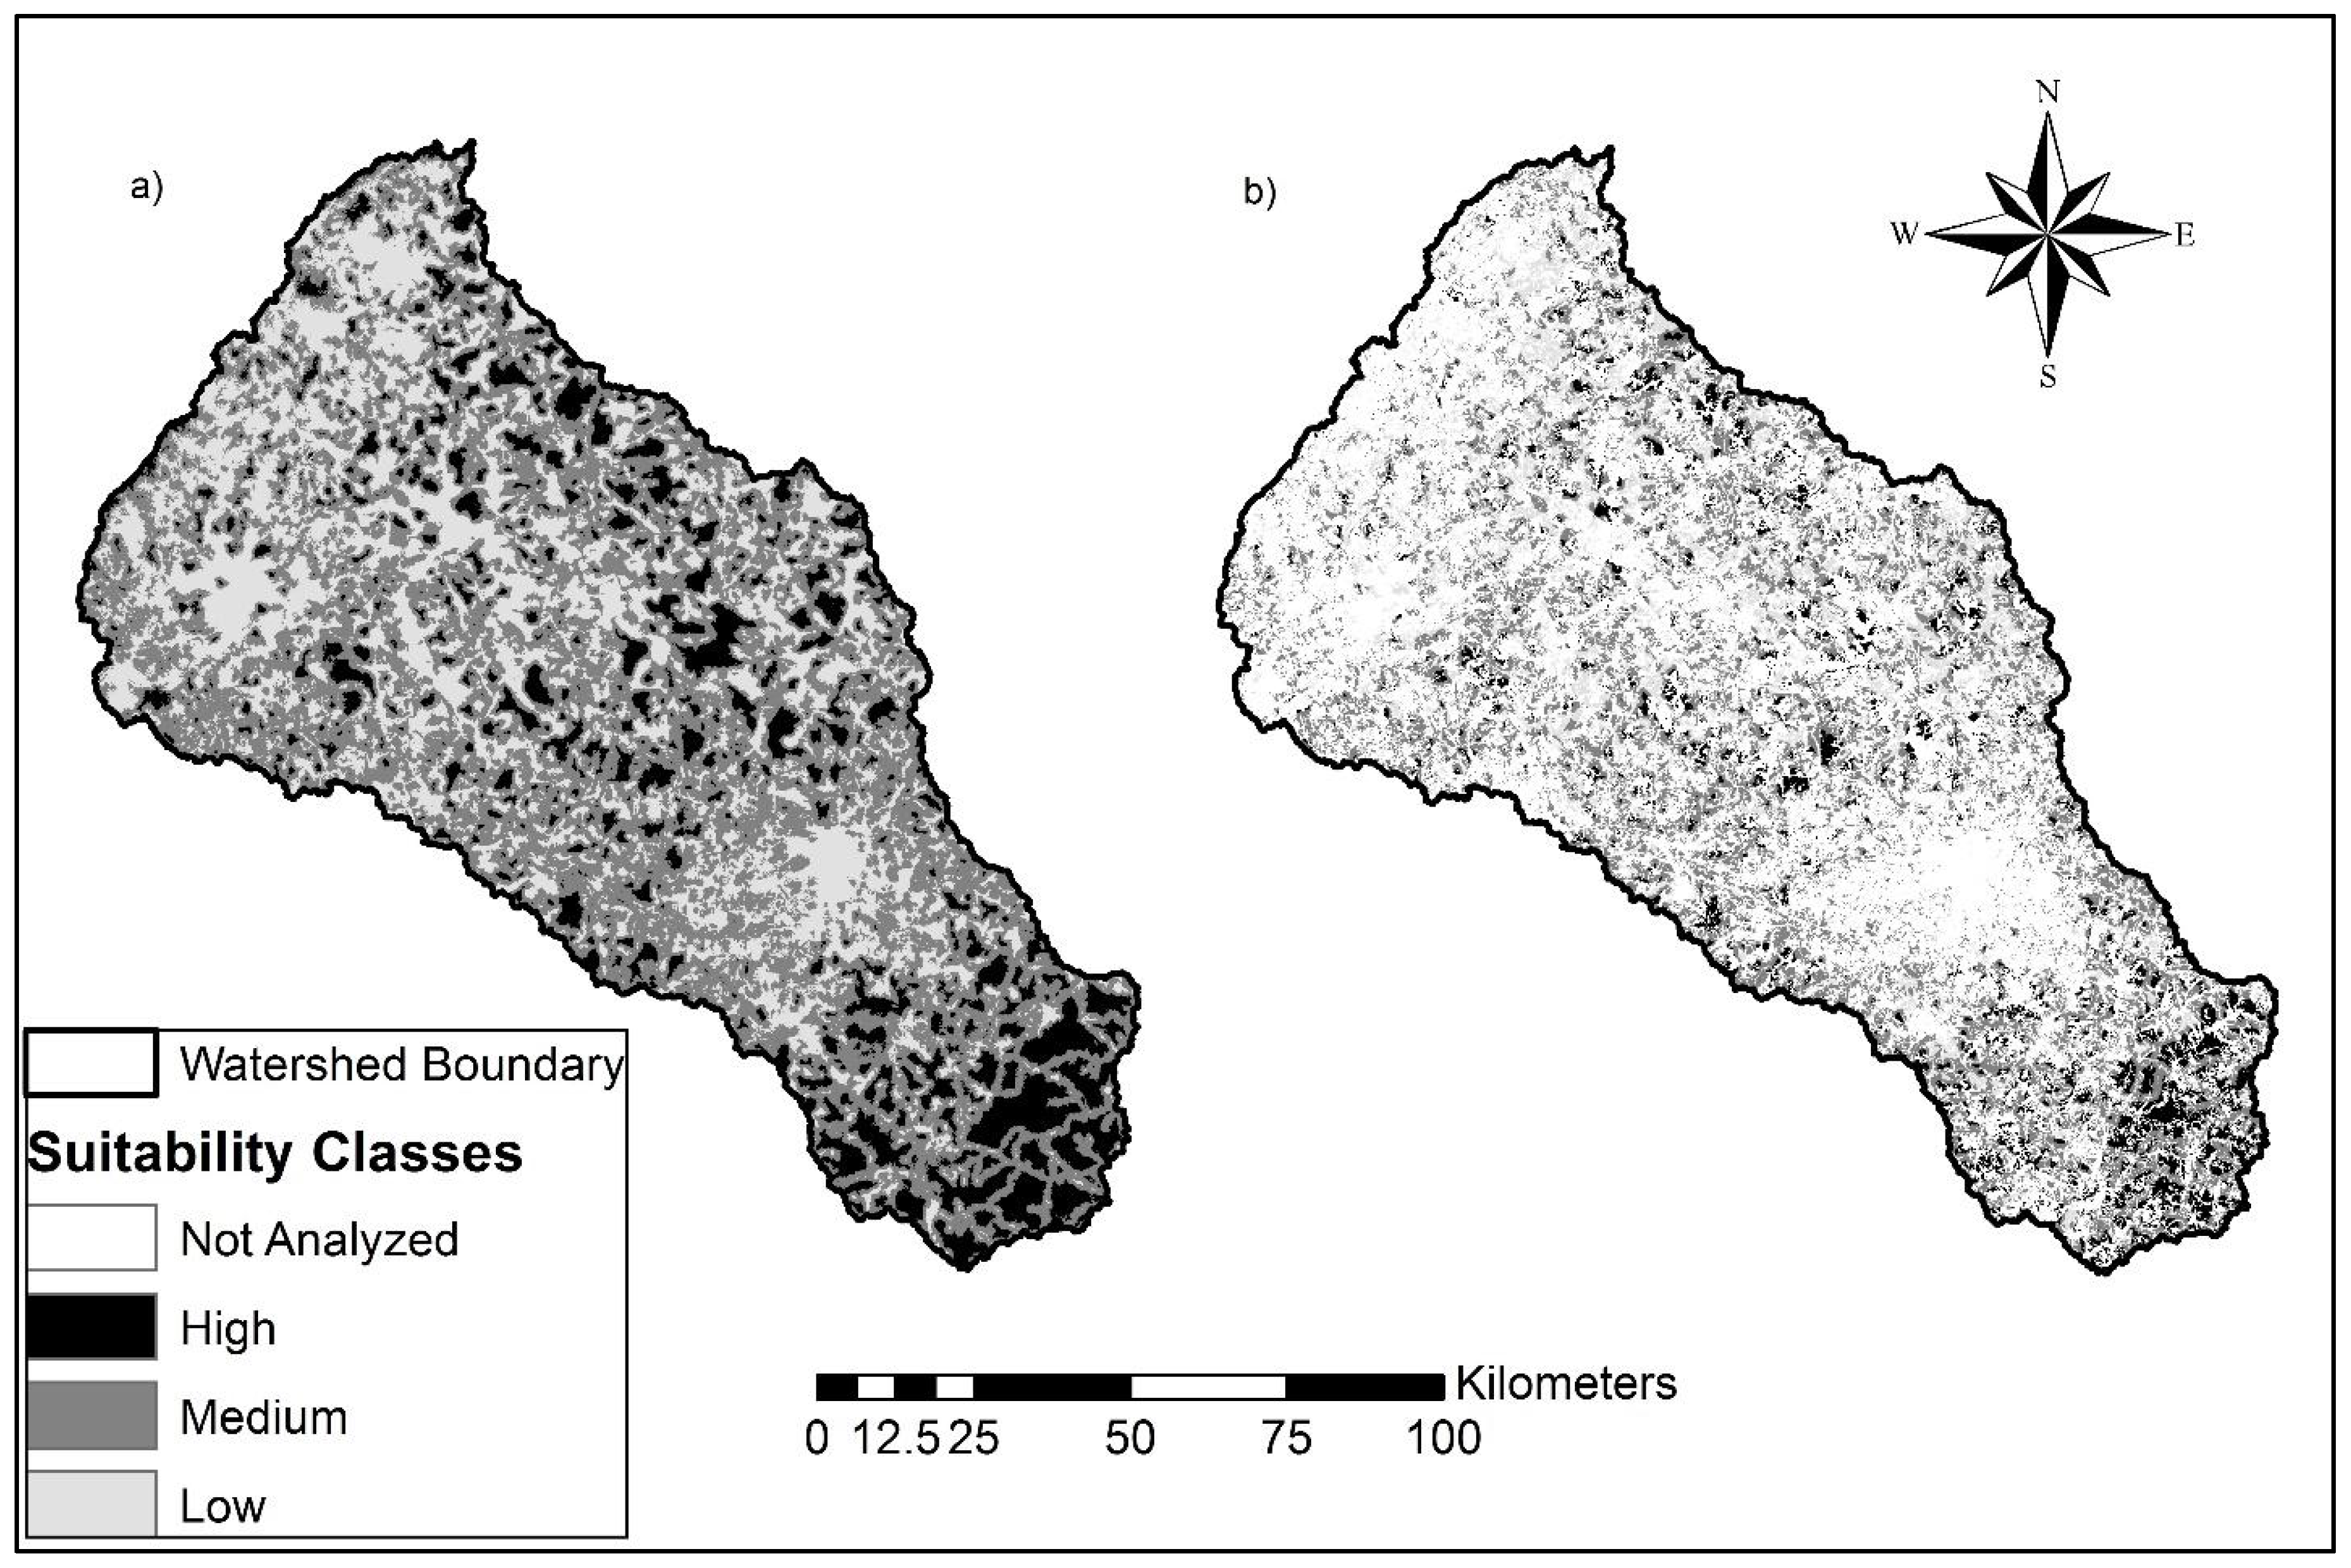
4.1. Suitability Analysis
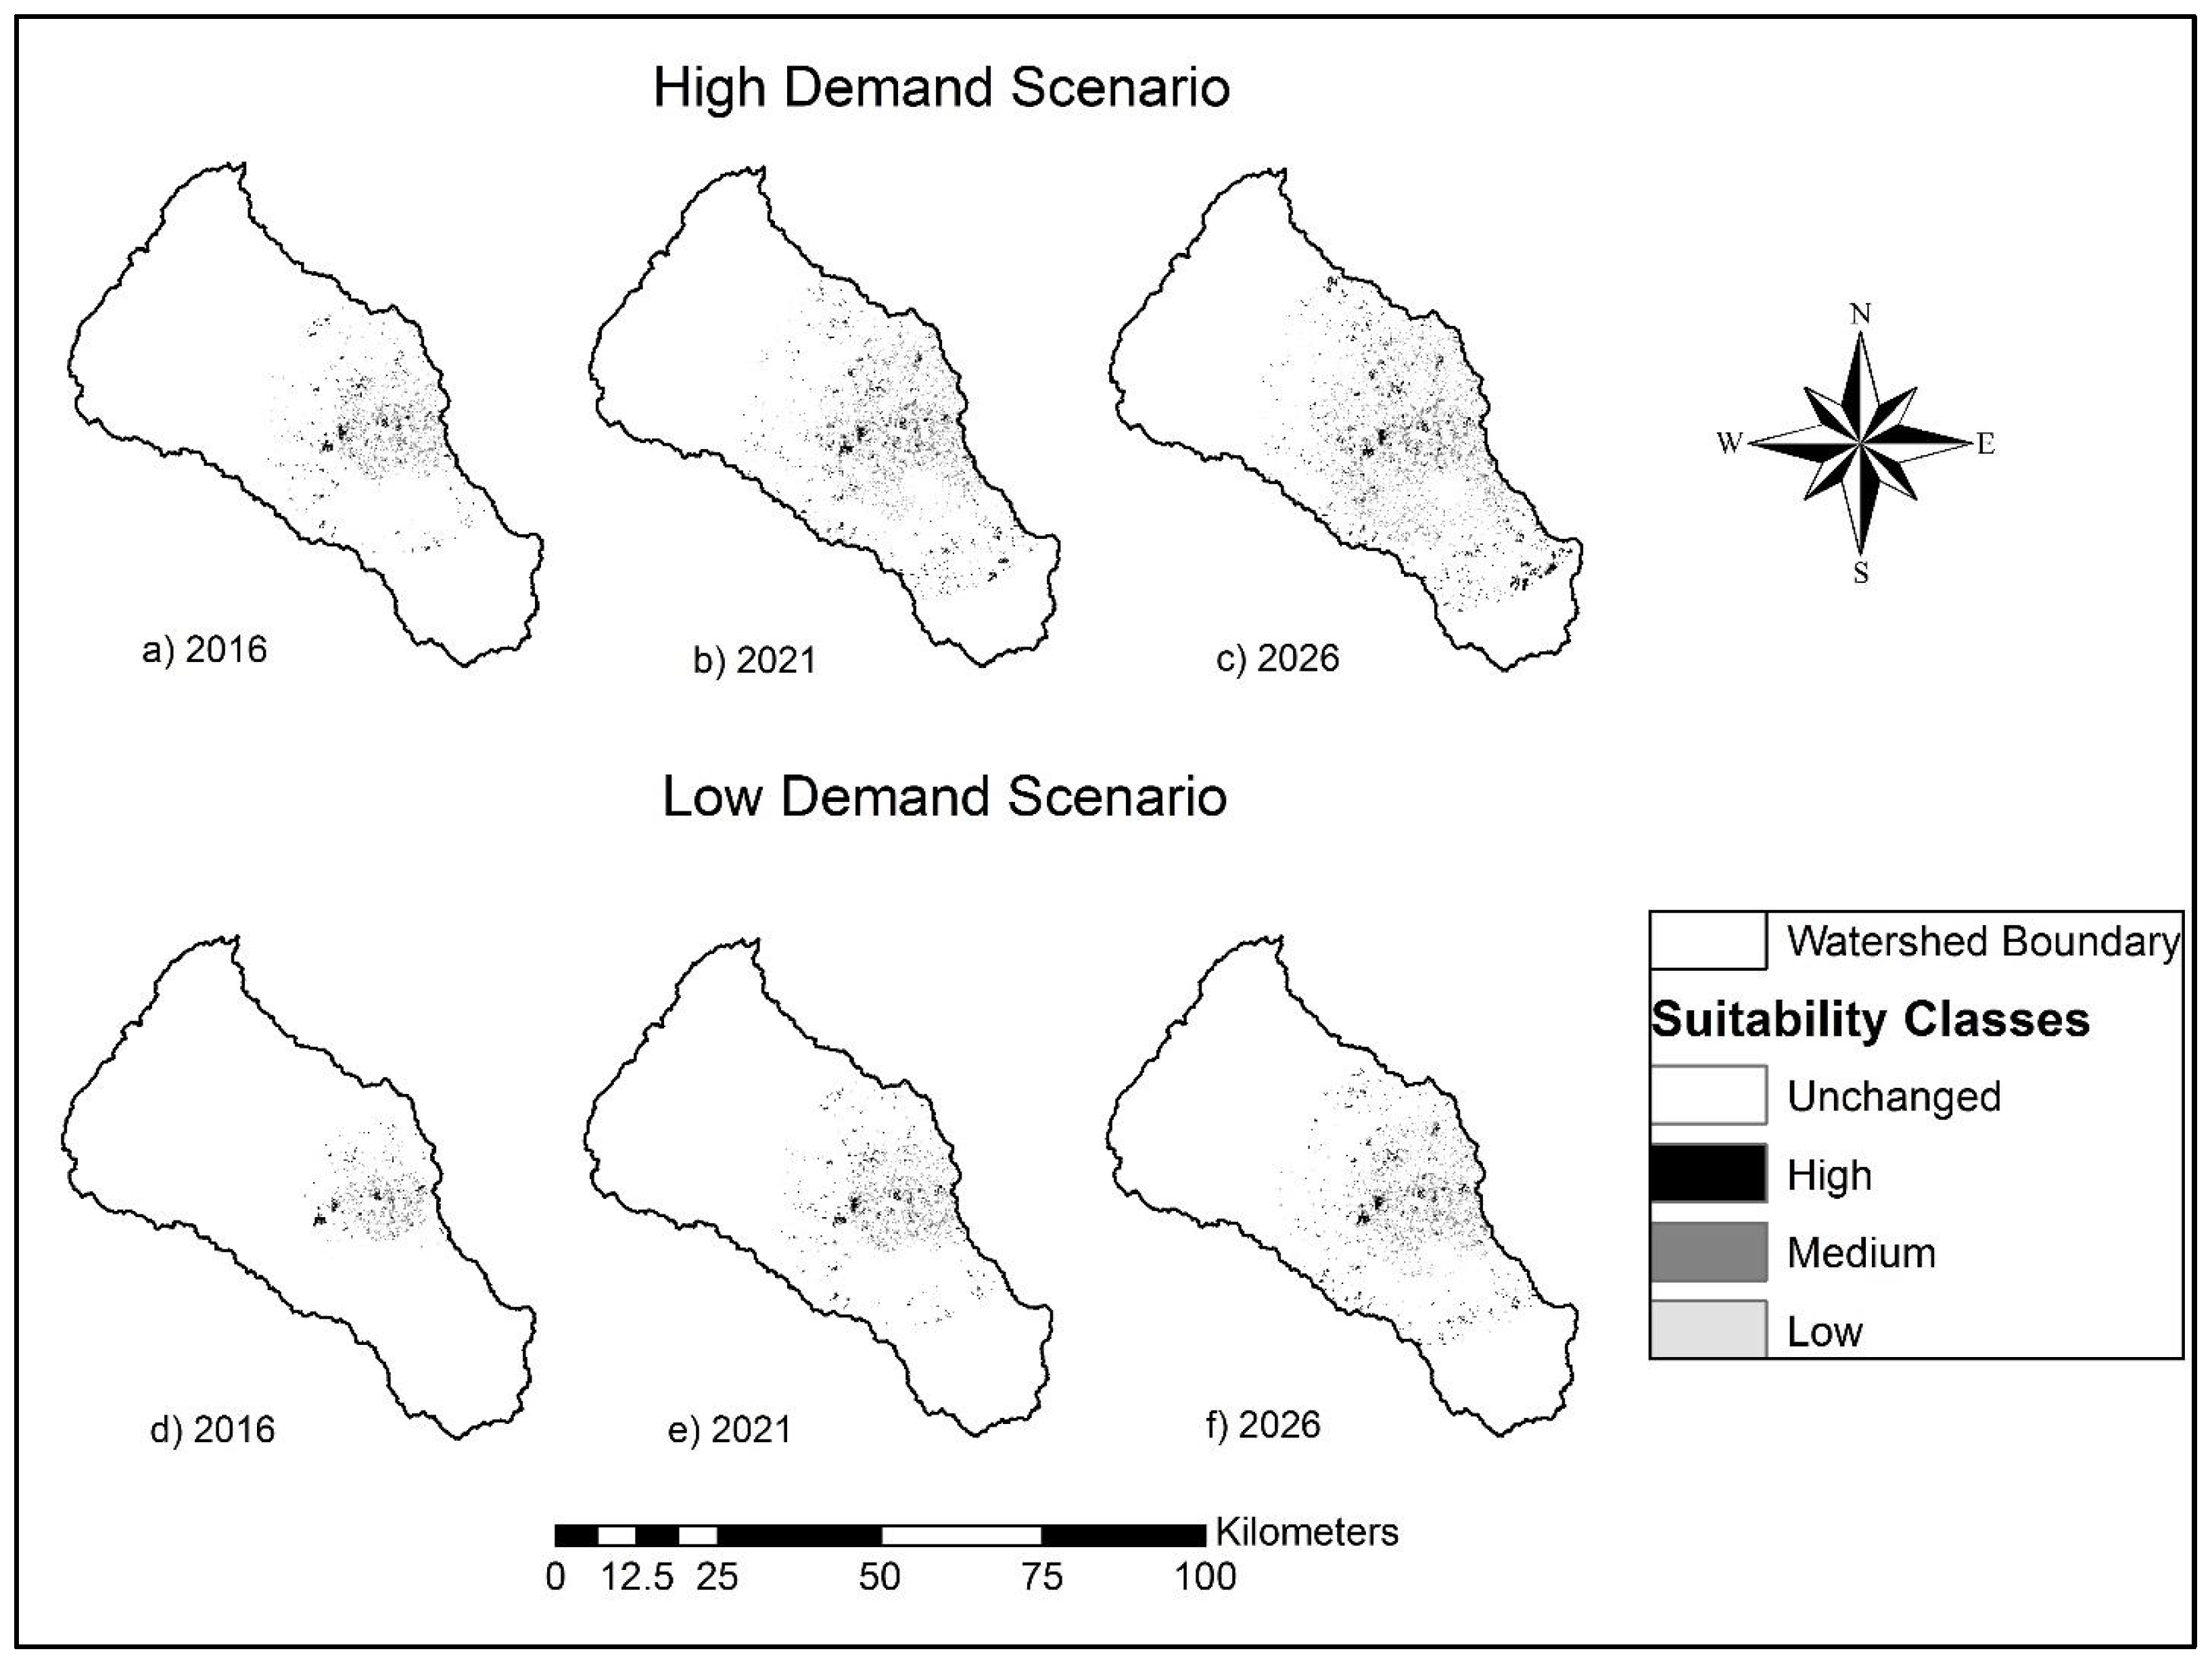
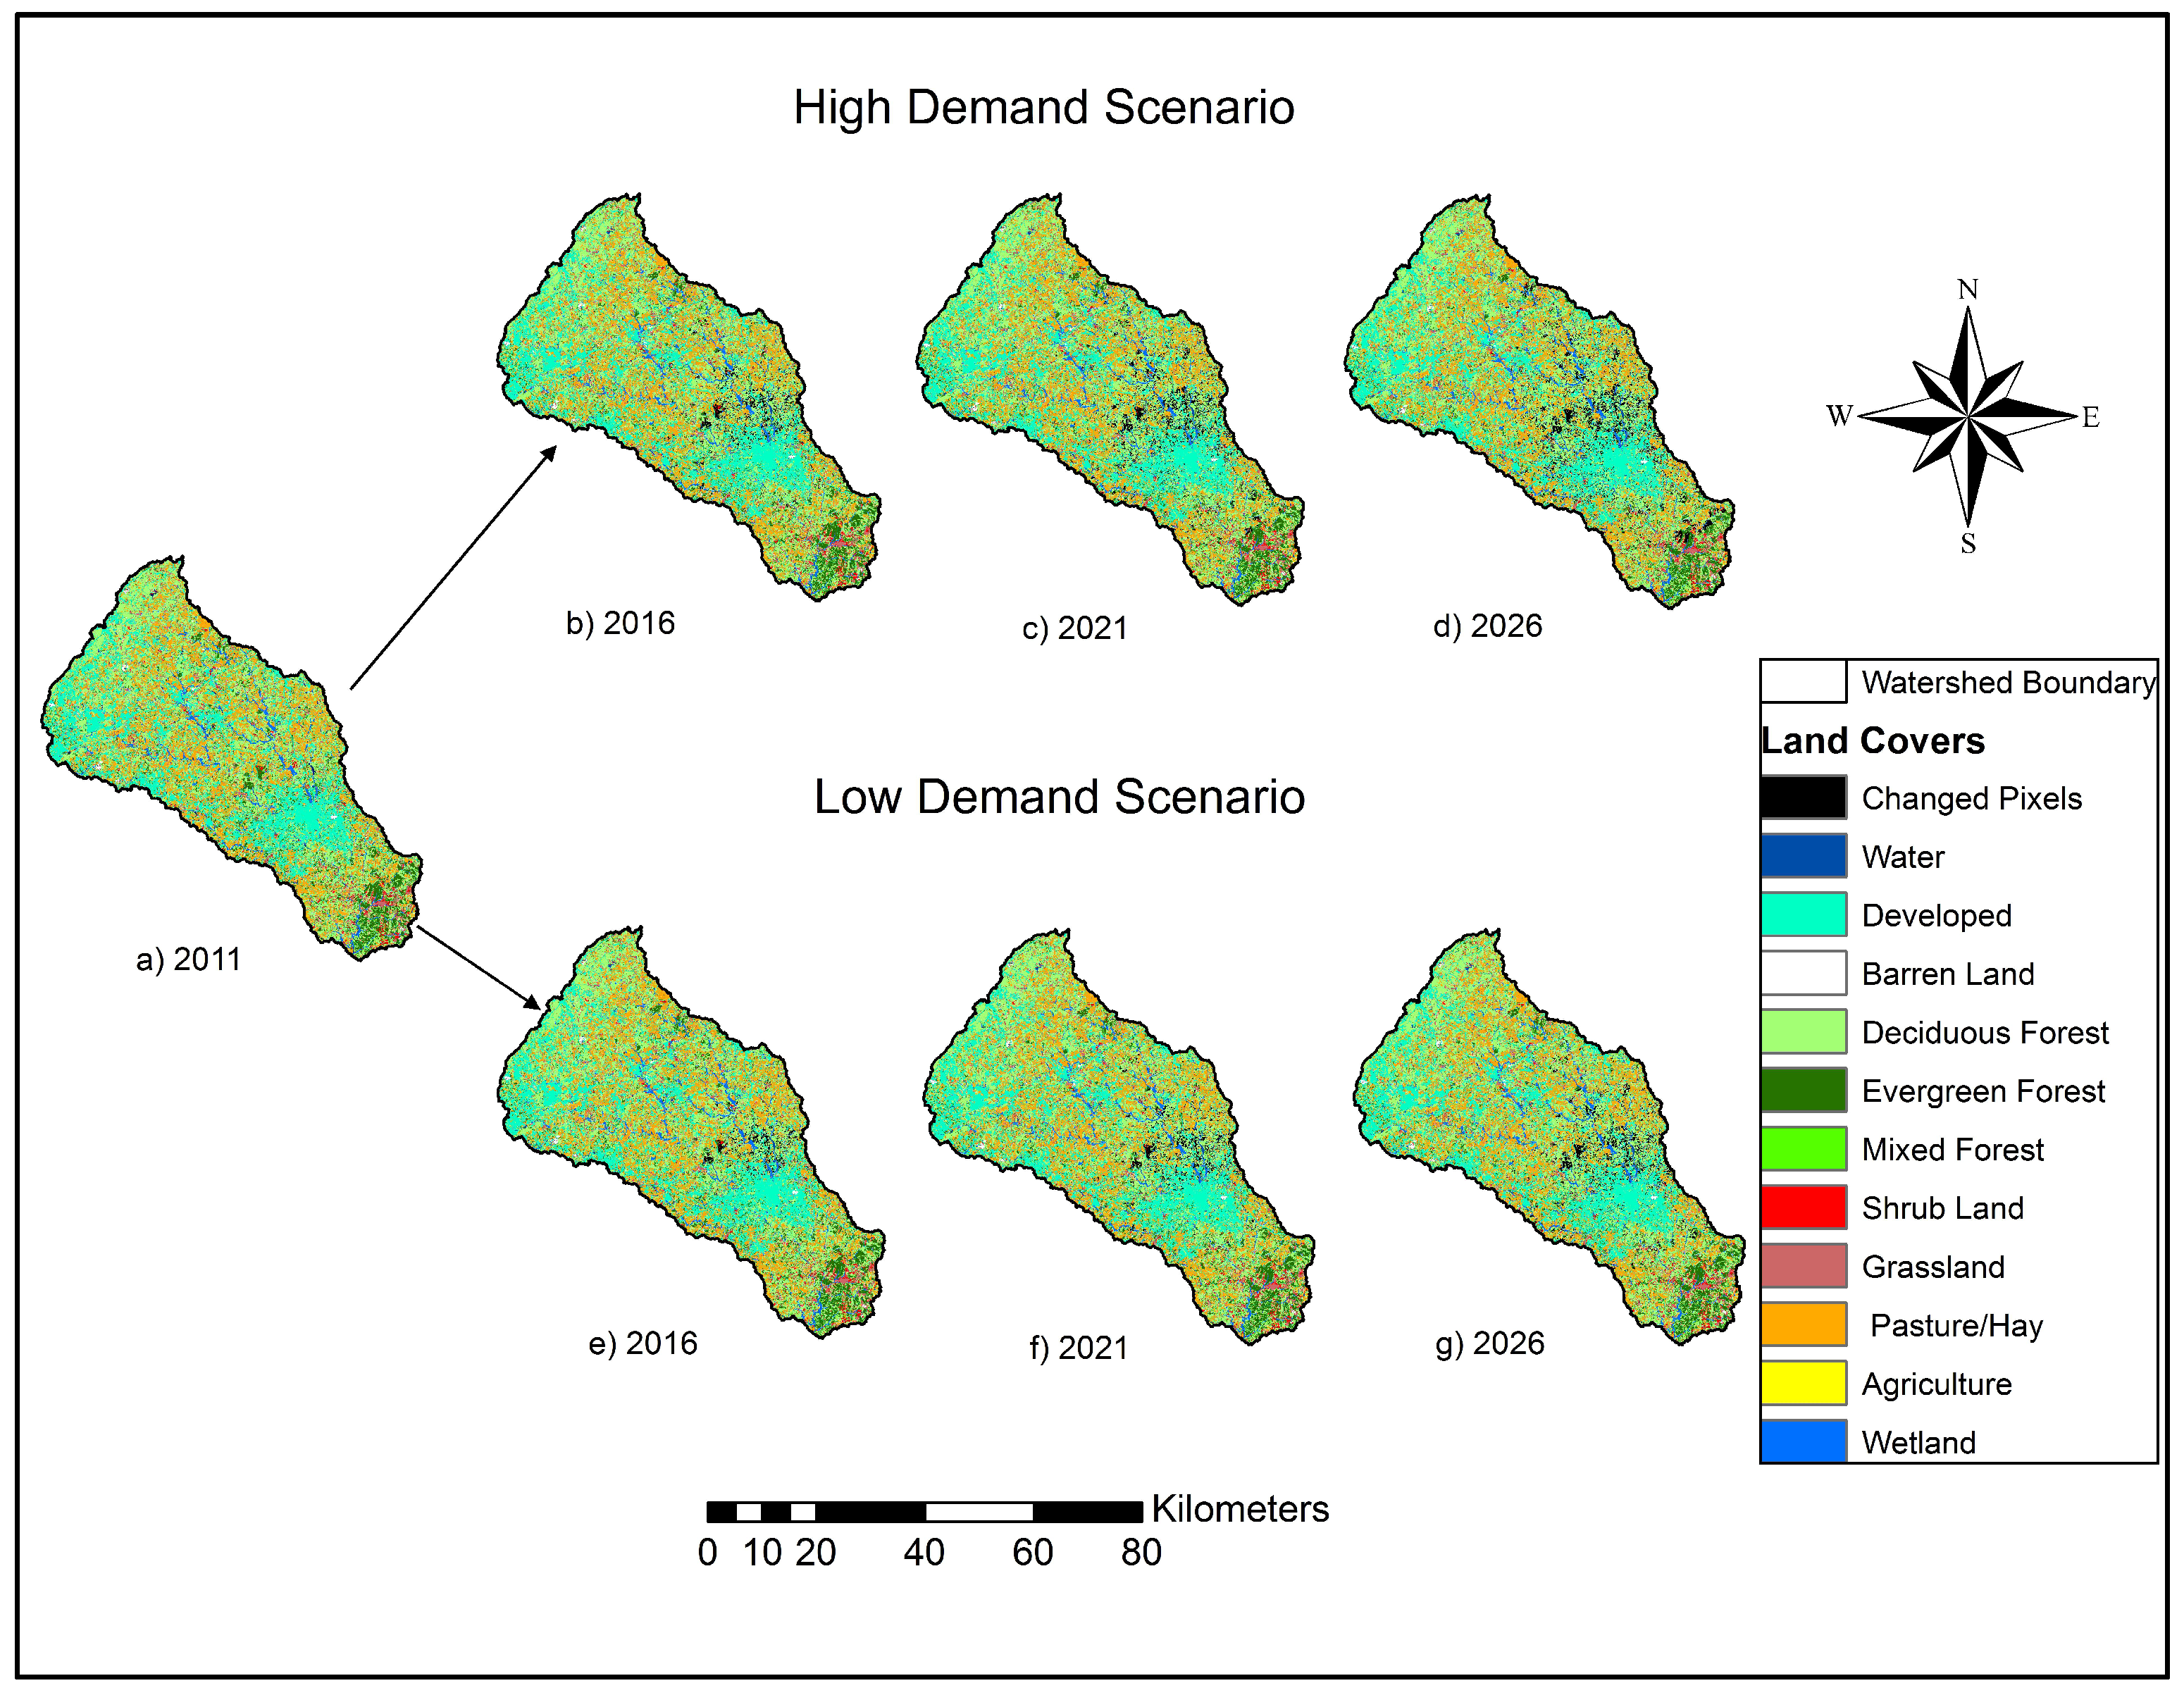
4.2. Land Use Change
5. Discussions
6. Conclusions
Author Contributions
Conflicts of Interest
Appendix

| Site Suitability Classes → | High | Medium | Low | |||||||||
|---|---|---|---|---|---|---|---|---|---|---|---|---|
| Land Covers → | 81 | 71 | 52 | 42 | 81 | 71 | 52 | 42 | 81 | 71 | 52 | 42 |
| Year | ||||||||||||
| 2012 | 99 | 727 | 133 | 3950 | 543 | 2308 | 115 | 3330 | 70 | 102 | 2 | 2 |
| 2013 | 99 | 712 | 132 | 3707 | 542 | 2263 | 114 | 3239 | 70 | 102 | 2 | 2 |
| 2014 | 99 | 697 | 131 | 3479 | 541 | 2218 | 114 | 3151 | 70 | 102 | 2 | 2 |
| 2015 | 99 | 683 | 130 | 3266 | 540 | 2175 | 113 | 3065 | 70 | 101 | 2 | 2 |
| 2016 | 99 | 669 | 129 | 3065 | 539 | 2132 | 112 | 2982 | 70 | 101 | 2 | 2 |
| 2017 | 98 | 656 | 128 | 2876 | 538 | 2090 | 111 | 2901 | 70 | 101 | 2 | 2 |
| 2018 | 98 | 642 | 126 | 2699 | 538 | 2050 | 110 | 2822 | 70 | 101 | 2 | 2 |
| 2019 | 98 | 629 | 125 | 2533 | 537 | 2009 | 110 | 2745 | 70 | 101 | 2 | 2 |
| 2020 | 98 | 616 | 124 | 2378 | 536 | 1970 | 109 | 2670 | 70 | 100 | 2 | 2 |
| 2021 | 98 | 604 | 123 | 2231 | 535 | 1931 | 108 | 2598 | 70 | 100 | 2 | 2 |
| 2022 | 98 | 591 | 122 | 2094 | 534 | 1894 | 107 | 2527 | 69 | 100 | 2 | 2 |
| 2023 | 97 | 579 | 121 | 1965 | 533 | 1856 | 107 | 2458 | 69 | 100 | 2 | 2 |
| 2024 | 97 | 568 | 120 | 1844 | 532 | 1820 | 106 | 2391 | 69 | 100 | 2 | 2 |
| 2025 | 97 | 556 | 119 | 1731 | 532 | 1784 | 105 | 2326 | 69 | 99 | 2 | 2 |
| 2026 | 97 | 545 | 118 | 1625 | 531 | 1749 | 105 | 2263 | 69 | 99 | 2 | 2 |
| 2027 | 97 | 533 | 117 | 1525 | 530 | 1715 | 104 | 2202 | 69 | 99 | 2 | 2 |
| 2028 | 97 | 523 | 116 | 1431 | 529 | 1681 | 103 | 2142 | 69 | 99 | 2 | 2 |
| 2029 | 96 | 512 | 115 | 1343 | 528 | 1649 | 102 | 2083 | 69 | 99 | 2 | 2 |
| 2030 | 96 | 501 | 114 | 1260 | 527 | 1616 | 102 | 2027 | 69 | 98 | 2 | 2 |
| Total | 1857 | 11,543 | 2343 | 45,002 | 10,165 | 36,910 | 2057 | 49,922 | 1321 | 1904 | 38 | 38 |
| Site Suitability Classes → | High | Medium | Low | |||||||||
|---|---|---|---|---|---|---|---|---|---|---|---|---|
| Land Covers → | 81 | 71 | 52 | 42 | 81 | 71 | 52 | 42 | 81 | 71 | 52 | 42 |
| Year | ||||||||||||
| 2012 | 50 | 364 | 133 | 1975 | 272 | 1154 | 115 | 1665 | 35 | 51 | 2 | 1 |
| 2013 | 50 | 360 | 132 | 1915 | 271 | 1143 | 114 | 1642 | 35 | 51 | 2 | 1 |
| 2014 | 50 | 356 | 131 | 1856 | 271 | 1132 | 114 | 1620 | 35 | 51 | 2 | 1 |
| 2015 | 50 | 353 | 130 | 1799 | 271 | 1121 | 113 | 1598 | 35 | 51 | 2 | 1 |
| 2016 | 50 | 349 | 129 | 1743 | 271 | 1110 | 112 | 1576 | 35 | 51 | 2 | 1 |
| 2017 | 50 | 345 | 128 | 1690 | 271 | 1099 | 111 | 1555 | 35 | 51 | 2 | 1 |
| 2018 | 50 | 342 | 126 | 1638 | 270 | 1088 | 110 | 1534 | 35 | 51 | 2 | 1 |
| 2019 | 50 | 338 | 125 | 1588 | 270 | 1077 | 110 | 1513 | 35 | 51 | 2 | 1 |
| 2020 | 50 | 335 | 124 | 1539 | 270 | 1067 | 109 | 1492 | 35 | 51 | 2 | 1 |
| 2021 | 50 | 332 | 123 | 1491 | 270 | 1056 | 108 | 1472 | 35 | 51 | 2 | 1 |
| 2022 | 49 | 328 | 122 | 1446 | 269 | 1046 | 107 | 1452 | 35 | 51 | 2 | 1 |
| 2023 | 49 | 325 | 121 | 1401 | 269 | 1036 | 107 | 1432 | 35 | 51 | 2 | 1 |
| 2024 | 49 | 322 | 120 | 1358 | 269 | 1026 | 106 | 1413 | 35 | 51 | 2 | 1 |
| 2025 | 49 | 318 | 119 | 1316 | 269 | 1016 | 105 | 1393 | 35 | 51 | 2 | 1 |
| 2026 | 49 | 315 | 118 | 1276 | 269 | 1006 | 105 | 1375 | 35 | 51 | 2 | 1 |
| 2027 | 49 | 312 | 117 | 1236 | 268 | 996 | 104 | 1356 | 35 | 50 | 2 | 1 |
| 2028 | 49 | 309 | 116 | 1198 | 268 | 986 | 103 | 1337 | 35 | 50 | 2 | 1 |
| 2029 | 49 | 305 | 115 | 1162 | 268 | 976 | 102 | 1319 | 35 | 50 | 2 | 1 |
| 2030 | 49 | 302 | 114 | 1126 | 268 | 967 | 102 | 1301 | 35 | 50 | 2 | 1 |
| Total | 941 | 6310 | 2343 | 28,753 | 5124 | 20,102 | 2057 | 28,045 | 665 | 965 | 38 | 19 |
References
- European Commission. Analysis of Options Beyond 20% GHG Emission Reductions: Member State Results. Commission Staff Working Paper. 2012. Available online: http://www.wire1002.ch/fileadmin/user_upload/Documents/COST_Office/2010_05_26_communication_en_1_.pdf (accessed on 10 March 2017).
- Goetzl, A. Developments in the Global Trade of Wood Pellets; Office of Industries Working Paper; U.S. International Trade Commission: Washington, DC, USA, 2015.
- Lamers, P.; Hoefnagels, R.; Junginger, M.; Hamelinck, C.; Faaij, A. Global solid biomass trade for energy by 2020: An assessment of potential import streams and supply costs to north-west Europe under different sustainability constraints. Glob. Chang. Biol. Bioenergy 2015, 7, 618–634. [Google Scholar] [CrossRef]
- Wong, P.; Bredehoeft, G. U.S. Wood Pellet Exports Double in 2013 in Response to Growing European Demand. 2014. Available online: http://www.eia.gov/todayinenergy/detail.cfm?id=16391 (accessed on 11 March 2017).
- USEIA. UK’s Renewable Energy Targets Drive Increases in U.S. Wood Pellet Exports. United States Energy Information Administration, 2015. Available online: https://www.eia.gov/todayinenergy/detail.cfm?id=20912 (accessed on 15 March 2017).
- Forisk. Wood Bioenergy Update and North American Pellet Capacity: Q3 2016. Available online: http://forisk.com/blog/2016/08/17/wood-bioenergy-update-north-american-pellet-capacity-q3-2016/ (accessed on 20 September 2017).
- Abt, K.L.; Abt, R.C.; Galik, C. Effect of bioenergy demands and supply response on markets, carbon, and land use. For. Sci. 2012, 58, 523–539. [Google Scholar] [CrossRef]
- Piva, R.J.; Bentley, J.W.; Hayes, S.W. National Pulpwood Production, 2010; Resource 346 Bulletin. NRS-89; United States Department of Agriculture Forest Service, Northern 347 Research Station, 2014; 74p, Available online: https://www.treesearch.fs.fed.us/pubs/45928 (accessed on 15 March 2017).
- Dwivedi, P.; Bailis, R.; Bush, T.G.; Marinescu, M. Quantifying GWI of wood pellet production in the Southern United States and its subsequent utilization for electricity production in The Netherlands/Florida. Bioenergy Res. 2011, 4, 180–192. [Google Scholar] [CrossRef]
- Dwivedi, P.; Khanna, M.; Bailis, R.; Ghilardi, A. Potential greenhouse gas benefits of transatlantic wood pellet trade. Environ. Res. Lett. 2014, 9, 11. [Google Scholar] [CrossRef]
- Galik, C.S.; Abt, R.C. Sustainability guidelines and forest market response: An assessment of European Union pellet demand in the Southeastern United States. Glob. Chang. Biol. Bioenergy 2016, 8, 658–669. [Google Scholar] [CrossRef]
- Nepal, P.; Wear, D.N.; Skog, K.E. Net change in carbon emissions with increased wood energy use in the United States. Glob. Chang. Biol. Bioenergy 2015, 7, 820–835. [Google Scholar] [CrossRef]
- Röder, M.; Whittaker, C.; Thornley, P. How certain are greenhouse gas reductions from bioenergy? Life cycle assessment and uncertainty analysis of wood pellet-to-electricity supply chains from forest residues. Biomass Bioenergy 2015, 79, 50–63. [Google Scholar]
- Wang, W.; Dwivedi, P.; Abt, R.; Khanna, M. Carbon savings with transatlantic trade in pellets: Accounting for market-driven effects. Environ. Res. Lett. 2015, 10, 114019. [Google Scholar] [CrossRef]
- Lewis, S.M.; Kelly, M. Mapping the potential for biofuel production on marginal lands: Differences in definitions, data and models across scales. ISPRS Intern. J. Geo-Inf. 2014, 3, 430–459. [Google Scholar] [CrossRef]
- Abolina, E.; Volk, T.A.; Lazdina, D. GIS based agricultural land availability assessment for the establishment of short rotation woody crops in Latvia. Biomass Bioenergy 2015, 72, 263–272. [Google Scholar] [CrossRef]
- Tang, Y.; Xie, J.-S.; Geng, S. Marginal land-based biomass energy production in China. J. Integr. Plant Biol. 2010, 52, 112–121. [Google Scholar] [CrossRef] [PubMed]
- Lu, L.; Jiang, D.; Zhuang, D.; Huang, Y. Evaluating the marginal land resources suitable for developing pistacia chinensis-based biodiesel in China. Energies 2012, 5, 2165–2177. [Google Scholar] [CrossRef]
- Pulighe, G.; Bonati, G.; Fabiani, S.; Barsali, T.; Lupia, F.; Vanino, S.; Nino, P.; Arca, P.; Roggero, P.P. Assessment of the Agronomic Feasibility of Bioenergy Crop Cultivation on Marginal and Polluted Land: A GIS-Based Suitability Study from the Sulcis Area, Italy. Energies 2016, 9, 895. [Google Scholar] [CrossRef]
- Miyake, S.; Smith, C.; Peterson, A.; McAlpine, C.; Renouf, M.; Waters, D. Environmental implications of using “underutilised agricultural land” for future bioenergy crop production. Agric. Syst. 2015, 139, 180–195. [Google Scholar] [CrossRef]
- Ranney, J.W.; Cushman, J.H. Regional evaluation of woody biomass production for fuels in the southeast. Biotechnol. Bioeng. 1980, 22, 109–120. [Google Scholar]
- Graham, R.L.; English, B.C.; Noon, C.E. A geographic information system-based modeling system for evaluating the cost of delivered energy crop feedstock. Biomass Bioenergy 2000, 18, 309–329. [Google Scholar] [CrossRef]
- Barney, J.N.; Di Tomaso, J.M. Bioclimatic predictions of habitat suitability for the biofuel switchgrass in North America under current and future climate scenarios. Biomass Bioenergy 2010, 34, 124–133. [Google Scholar] [CrossRef]
- Evans, J.M.; Fletcher, R.J.; Alavalapati, J. Using species distribution models to identify suitable areas for biofuel feedstock production. Glob. Chang. Biol. Bioenergy 2010, 2, 63–78. [Google Scholar] [CrossRef]
- Dawson, L.; Schlyter, P. Less is more: Strategic scale site suitability for concentrated solar thermal power in Western Australia. Energy Policy 2012, 47, 91–101. [Google Scholar] [CrossRef]
- Nepal, S.; Contreras, M.A.; Lhotka, J.M.; Stainback, G.A. A spatially explicit model to identify suitable sites to establish dedicated woody energy crops. Biomass Bioenergy 2014, 71, 245–255. [Google Scholar] [CrossRef]
- Houghton, R.A. The worldwide extent of land-use change. Bioscience 1994, 44, 305–313. [Google Scholar] [CrossRef]
- USDA/NRCS. Geospatial Data Gateway. United States Department of Agriculture Natural Resources Conservation Service, 2015. Available online: https://gdg.sc.egov.usda.gov/ (accessed on 20 March 2017).


| S. No. | Reference | Savings |
|---|---|---|
| 1. | Dwivedi, Bailis, Bush, & Marinescu [9] | 73% to 82% |
| 2. | Dwivedi, Khanna, Bailis, & Ghilardi [10] | up to 68% |
| 3. | Galik & Abt [11] | more than 100% |
| 4. | Nepal, Wear, & Skog [12] | 71% to 74% |
| 5. | Röder, Whittaker, & Thornley [13] | 83% |
| 6. | Wang, Dwivedi, Abt, & Khanna [14] | 85% |
| Land Use 2011 | Total | ||||||||||||||||
|---|---|---|---|---|---|---|---|---|---|---|---|---|---|---|---|---|---|
| 11 | 21 | 22 | 23 | 24 | 31 | 41 | 42 | 43 | 52 | 71 | 81 | 82 | 90 | 95 | |||
| Land Use 2001 | 11 | 95 | 1.2 | 1.1 | 0.5 | 0 | 0.3 | 0.2 | 0 | 0 | 0.1 | 0.2 | 0.3 | 0 | 0.1 | 1.1 | 100 |
| 21 | - | 95.8 | 0.9 | 2.9 | 0.4 | - | - | - | - | - | - | - | - | - | - | 100 | |
| 22 | - | - | 97.1 | 1.8 | 1.1 | - | - | - | - | - | - | - | - | - | - | 100 | |
| 23 | - | - | - | 99.6 | 0.4 | - | - | - | - | - | - | - | - | - | - | 100 | |
| 24 | - | - | - | - | 100 | - | - | - | - | - | - | - | - | - | - | 100 | |
| 31 | 1.3 | 5.6 | 9.2 | 7.3 | 1.3 | 61.6 | 6 | 1.5 | - | 3.7 | 1.4 | - | - | 0.3 | 0.7 | 100 | |
| 41 | 0.1 | 2.2 | 1.5 | 0.8 | 0.1 | 0.1 | 91.7 | - | - | 1.7 | 1.7 | 0.1 | - | - | - | 100 | |
| 42 | - | 2.5 | 2 | 1.3 | 0.3 | 0.2 | 0.6 | 85.6 | - | 3.5 | 4 | 0.1 | - | - | - | 100 | |
| 43 | - | 2.3 | 1.7 | 0.8 | 0.2 | 0.1 | 0.2 | 0.3 | 86.4 | 3.8 | 3.7 | 0.3 | - | 0.1 | 0.2 | 100 | |
| 52 | 0.4 | 5.6 | 3.1 | 1.8 | 0.3 | 0.4 | 2.5 | 15.6 | 0.1 | 69.5 | 0.8 | - | - | - | - | 100 | |
| 71 | 0.3 | 3.4 | 2.7 | 1.1 | 0.2 | 0.3 | 3 | 1.1 | - | 1.9 | 85.5 | - | - | 0.1 | 0.5 | 100 | |
| 81 | - | 2.9 | 2.1 | 1 | 0.2 | 0.1 | 0.2 | 0.1 | - | 0.2 | 0.2 | 92.9 | - | - | - | 100 | |
| 82 | - | 1.6 | 1.1 | 1.3 | 0.7 | 0.6 | 1.4 | - | - | 0.8 | 0.6 | - | 92 | - | - | 100 | |
| 90 | 0.1 | 1 | 0.4 | 0.1 | - | - | 0.1 | - | - | 0.1 | 0.1 | - | - | 97 | 1.1 | 100 | |
| 95 | - | 0.6 | 0.3 | - | - | - | 3 | - | - | 1.9 | - | - | - | 22.5 | 71.7 | 100 | |
| Evergreen Forest | Shrubland | Grassland | Pasture/Hay | |||||||||
|---|---|---|---|---|---|---|---|---|---|---|---|---|
| Historical | Future | Historical | Future | Historical | Future | Historical | Future | |||||
| Scenarios | High | Low | High | Low | High | Low | High | Low | ||||
| High | 0.21 | 6.15 | 3.08 | 0.86 | 0.86 | 0.86 | 0.07 | 2.04 | 1.02 | 0.006 | 0.18 | 0.09 |
| Medium | 0.14 | 2.72 | 1.36 | 0.69 | 0.69 | 0.69 | 0.04 | 1.96 | 0.98 | 0.008 | 0.16 | 0.09 |
| Low | 0.01 | 0.11 | 0.06 | 0.05 | 0.05 | 0.05 | 0.02 | 0.19 | 0.10 | 0.004 | 0.04 | 0.02 |
© 2017 by the authors. Licensee MDPI, Basel, Switzerland. This article is an open access article distributed under the terms and conditions of the Creative Commons Attribution (CC BY) license (http://creativecommons.org/licenses/by/4.0/).
Share and Cite
Shrestha, S.; Dwivedi, P. Projecting Land Use Changes by Integrating Site Suitability Analysis with Historic Land Use Change Dynamics in the Context of Increasing Demand for Wood Pellets in the Southern United States. Forests 2017, 8, 381. https://doi.org/10.3390/f8100381
Shrestha S, Dwivedi P. Projecting Land Use Changes by Integrating Site Suitability Analysis with Historic Land Use Change Dynamics in the Context of Increasing Demand for Wood Pellets in the Southern United States. Forests. 2017; 8(10):381. https://doi.org/10.3390/f8100381
Chicago/Turabian StyleShrestha, Surendra, and Puneet Dwivedi. 2017. "Projecting Land Use Changes by Integrating Site Suitability Analysis with Historic Land Use Change Dynamics in the Context of Increasing Demand for Wood Pellets in the Southern United States" Forests 8, no. 10: 381. https://doi.org/10.3390/f8100381
APA StyleShrestha, S., & Dwivedi, P. (2017). Projecting Land Use Changes by Integrating Site Suitability Analysis with Historic Land Use Change Dynamics in the Context of Increasing Demand for Wood Pellets in the Southern United States. Forests, 8(10), 381. https://doi.org/10.3390/f8100381