
Regional Differences in Upland Forest to Developed (Urban) Land Cover Conversions in the Conterminous U.S., 1973–2011


Abstract
:1. Introduction
2. Materials and Methods
2.1. Definitions of “Forest” and “Developed Land” Land Covers
2.2. Materials
2.3. Methods
2.4. Limitations
3. Results
4. Discussion
5. Conclusions
Supplementary Materials
Acknowledgments
Author Contributions
Conflicts of Interest
Abbreviations
| MDPI | Multidisciplinary Digital Publishing Institute |
| DOAJ | Directory of open access journals |
| TLA | Three letter acronym |
| LD | linear dichroism |
References
- Sleeter, B.M.; Sohl, T.L.; Loveland, T.R.; Auch, R.F.; Acevedo, W.; Drummond, M.A.; Sayler, K.L.; Stehman, S.V. Land-cover change in the conterminous United States from 1973 to 2000. Global Environ. Chang. 2013, 23, 733–748. [Google Scholar] [CrossRef]
- Seto, K.C.; Shepherd, J.M. Global urban land-use trends and climate impacts. Curr. Opin. Environ. Sustain. 2009, 1, 89–95. [Google Scholar] [CrossRef]
- DeFries, R.S.; Rudel, T.; Uriart, M.; Hansen, M. Deforestation driven by urban population growth and agricultural trade in the twenty-first century. Nat. Geosci. 2010, 3, 178–181. [Google Scholar] [CrossRef]
- Delphin, S.; Escobedo, F.J.; Abd-Elrahman, A.; Cropper, W.P. Urbanization as a land use change driver of forest ecosystem services. Land Use Policy 2016, 54, 188–199. [Google Scholar] [CrossRef]
- Seto, K.C.; Fragkias, M.; Güneralp, B.; Reilly, M.K. A meta-analysis of global urban land expansion. PLoS ONE 2011, 6, e23777. [Google Scholar] [CrossRef] [PubMed]
- Bounoua, L.; Zhang, P.; Mostovoy, G.; Thome, K.; Masek, J.; Imhoff, M.; Shepherd, M.; Quattrochi, D.; Santanello, J.; Silva, J. Impact of urbanization on US surface climate. Environ. Res. Lett. 2015, 10, 084010. [Google Scholar] [CrossRef]
- Bagan, H.; Yamagata, Y. Land-cover change analysis in 50 global cities by using a combination of Landsat data and analysis of grid cells. Environ. Res. Lett. 2014, 9, 064015. [Google Scholar] [CrossRef]
- Reinmann, A.B.; Hutyra, L.R.; Trlica, A.; Olofsson, P. Assessing the global warming potential of human settlement expansion in a mesic temperate landscape from 2005 to 2050. Sci. Total. Environ. 2016, 545–546, 512–524. [Google Scholar] [CrossRef] [PubMed]
- Seto, K.C.; Güneralp, B.; Hutyra, L.R. Global forecasts of urban expansion to 2030 and direct impacts on biodiversity and carbon pools. Proc. Natl. Acad. Sci. USA 2012, 109, 16083–16088. [Google Scholar] [CrossRef] [PubMed]
- Weber, T.; Sloan, A.; Wolf, J. Maryland’s Green Infrastructure Assessment: Development of a comprehensive approach to land conservation. Landsc. Urban Plan. 2006, 77, 94–110. [Google Scholar] [CrossRef]
- Gill, S.E.; Handley, J.F.; Ennos, A.R.; Pauleit, S.; Theuray, N.; Lindley, S.J. Characterising the urban environment of UK cities and towns: A template for landscape planning. Landsc. Urban Plan. 2008, 87, 210–222. [Google Scholar] [CrossRef]
- Guo, X.; Li, W.; Da, L. Near-natural silviculture: Sustainable approach for urban renaturalization? Assessment based on 10 years recovering dynamics and eco-benefits in Shanghai. J. Urban Plan. Dev. 2015, 141. [Google Scholar] [CrossRef]
- Salvati, L. Agro-forest landscape and the ‘fringe’ city: A multivariate assessment of land-use changes in a sprawling region and implications for planning. Sci. Total. Environ. 2014, 490, 715–723. [Google Scholar] [CrossRef] [PubMed]
- Shifley, S.R.; Moser, W.K.; Nowak, D.J.; Miles, P.D.; Butler, B.J.; Aguilar, F.X.; Desantis, R.D.; Greenfield, E.J. Five anthropogenic factors that will radically alter forest conditions and management needs in the Northern United States. For. Sci. 2014, 60, 914–925. [Google Scholar] [CrossRef]
- Millennium Ecosystem Assessment. Ecosystems and Human Well-Being: A Framework for Assessment; Island Press: Washington, DC, USA, 2005. [Google Scholar]
- Ye, Y.; Zhang, J.E.; Chen, L.; Ouyang, Y.; Parajuli, P. Dynamics of ecosystem services values in response to landscape pattern changes from 1995 to 2005 in Guangzhou, Southern China. Appl. Ecol. Environ. Res. 2015, 13, 21–36. [Google Scholar]
- Wu, Y.; Li, S.; Yu, S. Monitoring urban expansion and its effects on land use and land cover changes in Guangzhou city, China. Environ. Monit. Assess. 2016, 188, 1–15. [Google Scholar] [CrossRef] [PubMed]
- Xian, G.; Crane, M. Assessments of urban growth in the Tampa Bay watershed using remote sensing data. Remote. Sens. Environ. 2005, 97, 203–215. [Google Scholar] [CrossRef]
- Xian, G.; Crane, M.; McMahon, C. Quantifying multi-temporal urban development characteristics in Las Vegas from Landsat and ASTER data. Photogramm. Eng. Remote. Sens. 2008, 74, 473–481. [Google Scholar] [CrossRef]
- Jeon, S.B.; Olofsson, P.; Woodcock, C.E. Land use change in New England: A reversal of the forest transition. J. Land Use Sci. 2014, 9, 105–130. [Google Scholar] [CrossRef]
- Wu, Y.-J.; Thomas, V.; Oliver, R. Forest change dynamics across levels of urbanization in the eastern United States. Southeast. Geogr. 2014, 54, 406–420. [Google Scholar] [CrossRef]
- Kennedy, R.E.; Yang, Z.; Braaten, J.; Copass, C.; Natalya, A.; Jordan, C.; Nelson, P. Attribution of disturbance change agent from Landsat time-series in support of habitat monitoring in the Puget Sound region, USA. Remote. Sens. Environ. 2015, 166, 271–285. [Google Scholar] [CrossRef]
- Jiang, Y.; Fu, P.; Weng, Q. Assessing the impacts of urbanization-associated land use/land cover change on land surface temperature and surface moisture: A case study in the Midwestern United States. Remote. Sens. 2015, 7, 4880–4898. [Google Scholar] [CrossRef]
- Clement, M.T.; Chi, G.; Ho, H.C. Urbanization and land-use change: A human ecology of deforestation across the United States, 2001–2006. Sociol. Inq. 2015, 85, 628–653. [Google Scholar] [CrossRef]
- Omernik, J.M. Ecoregions of the conterminous United States. Ann. Assoc. Am. Geogr. 1987, 77, 118–125. [Google Scholar] [CrossRef]
- Omernik, J.M.; Griffith, G.E. Ecoregions of the conterminous United States: Evolution of a hierarchical spatial framework. Environ. Manag. 2014, 54, 1249–1266. [Google Scholar] [CrossRef] [PubMed]
- Sletter, B.M.; Wilson, T.S.; Acevedo, W. (Eds.) Appendix 3. In Status and Trends of Land Change in the Western United States—1973 to 2000; U.S. Geological Survey Professional Paper 1794-A; U.S. Geological Survey: Reston, VA, USA, 2012; p. 317.
- U.S. Geological Survey. National Land Cover Database 2006 (NLCD2006) Product Legend. 2016. Available online: http://www.mrlc.gov/nlcd06_leg.php (accessed on 11 May 2016). [Google Scholar]
- Loveland, T.R.; Sohl, T.L.; Stehman, S.V.; Gallant, A.L.; Sayler, K.L.; Napton, D.E. A strategy for estimating the rates of recent United States land-cover changes. Photogramm. Eng. Remote. Sens. 2002, 68, 1091–1099. [Google Scholar]
- Auch, R.F.; Drummond, M.A.; Sayler, K.L.; Gallant, A.L.; Acevedo, W. An approach to assess land cover trends in the conterminous United States (1973–2000). In Remote Sensing and Land Cover: Principles and Applications; Giri, C., Ed.; Taylor and Francis CRC Press: Boca Raton, FL, USA, 2012; pp. 351–367. [Google Scholar]
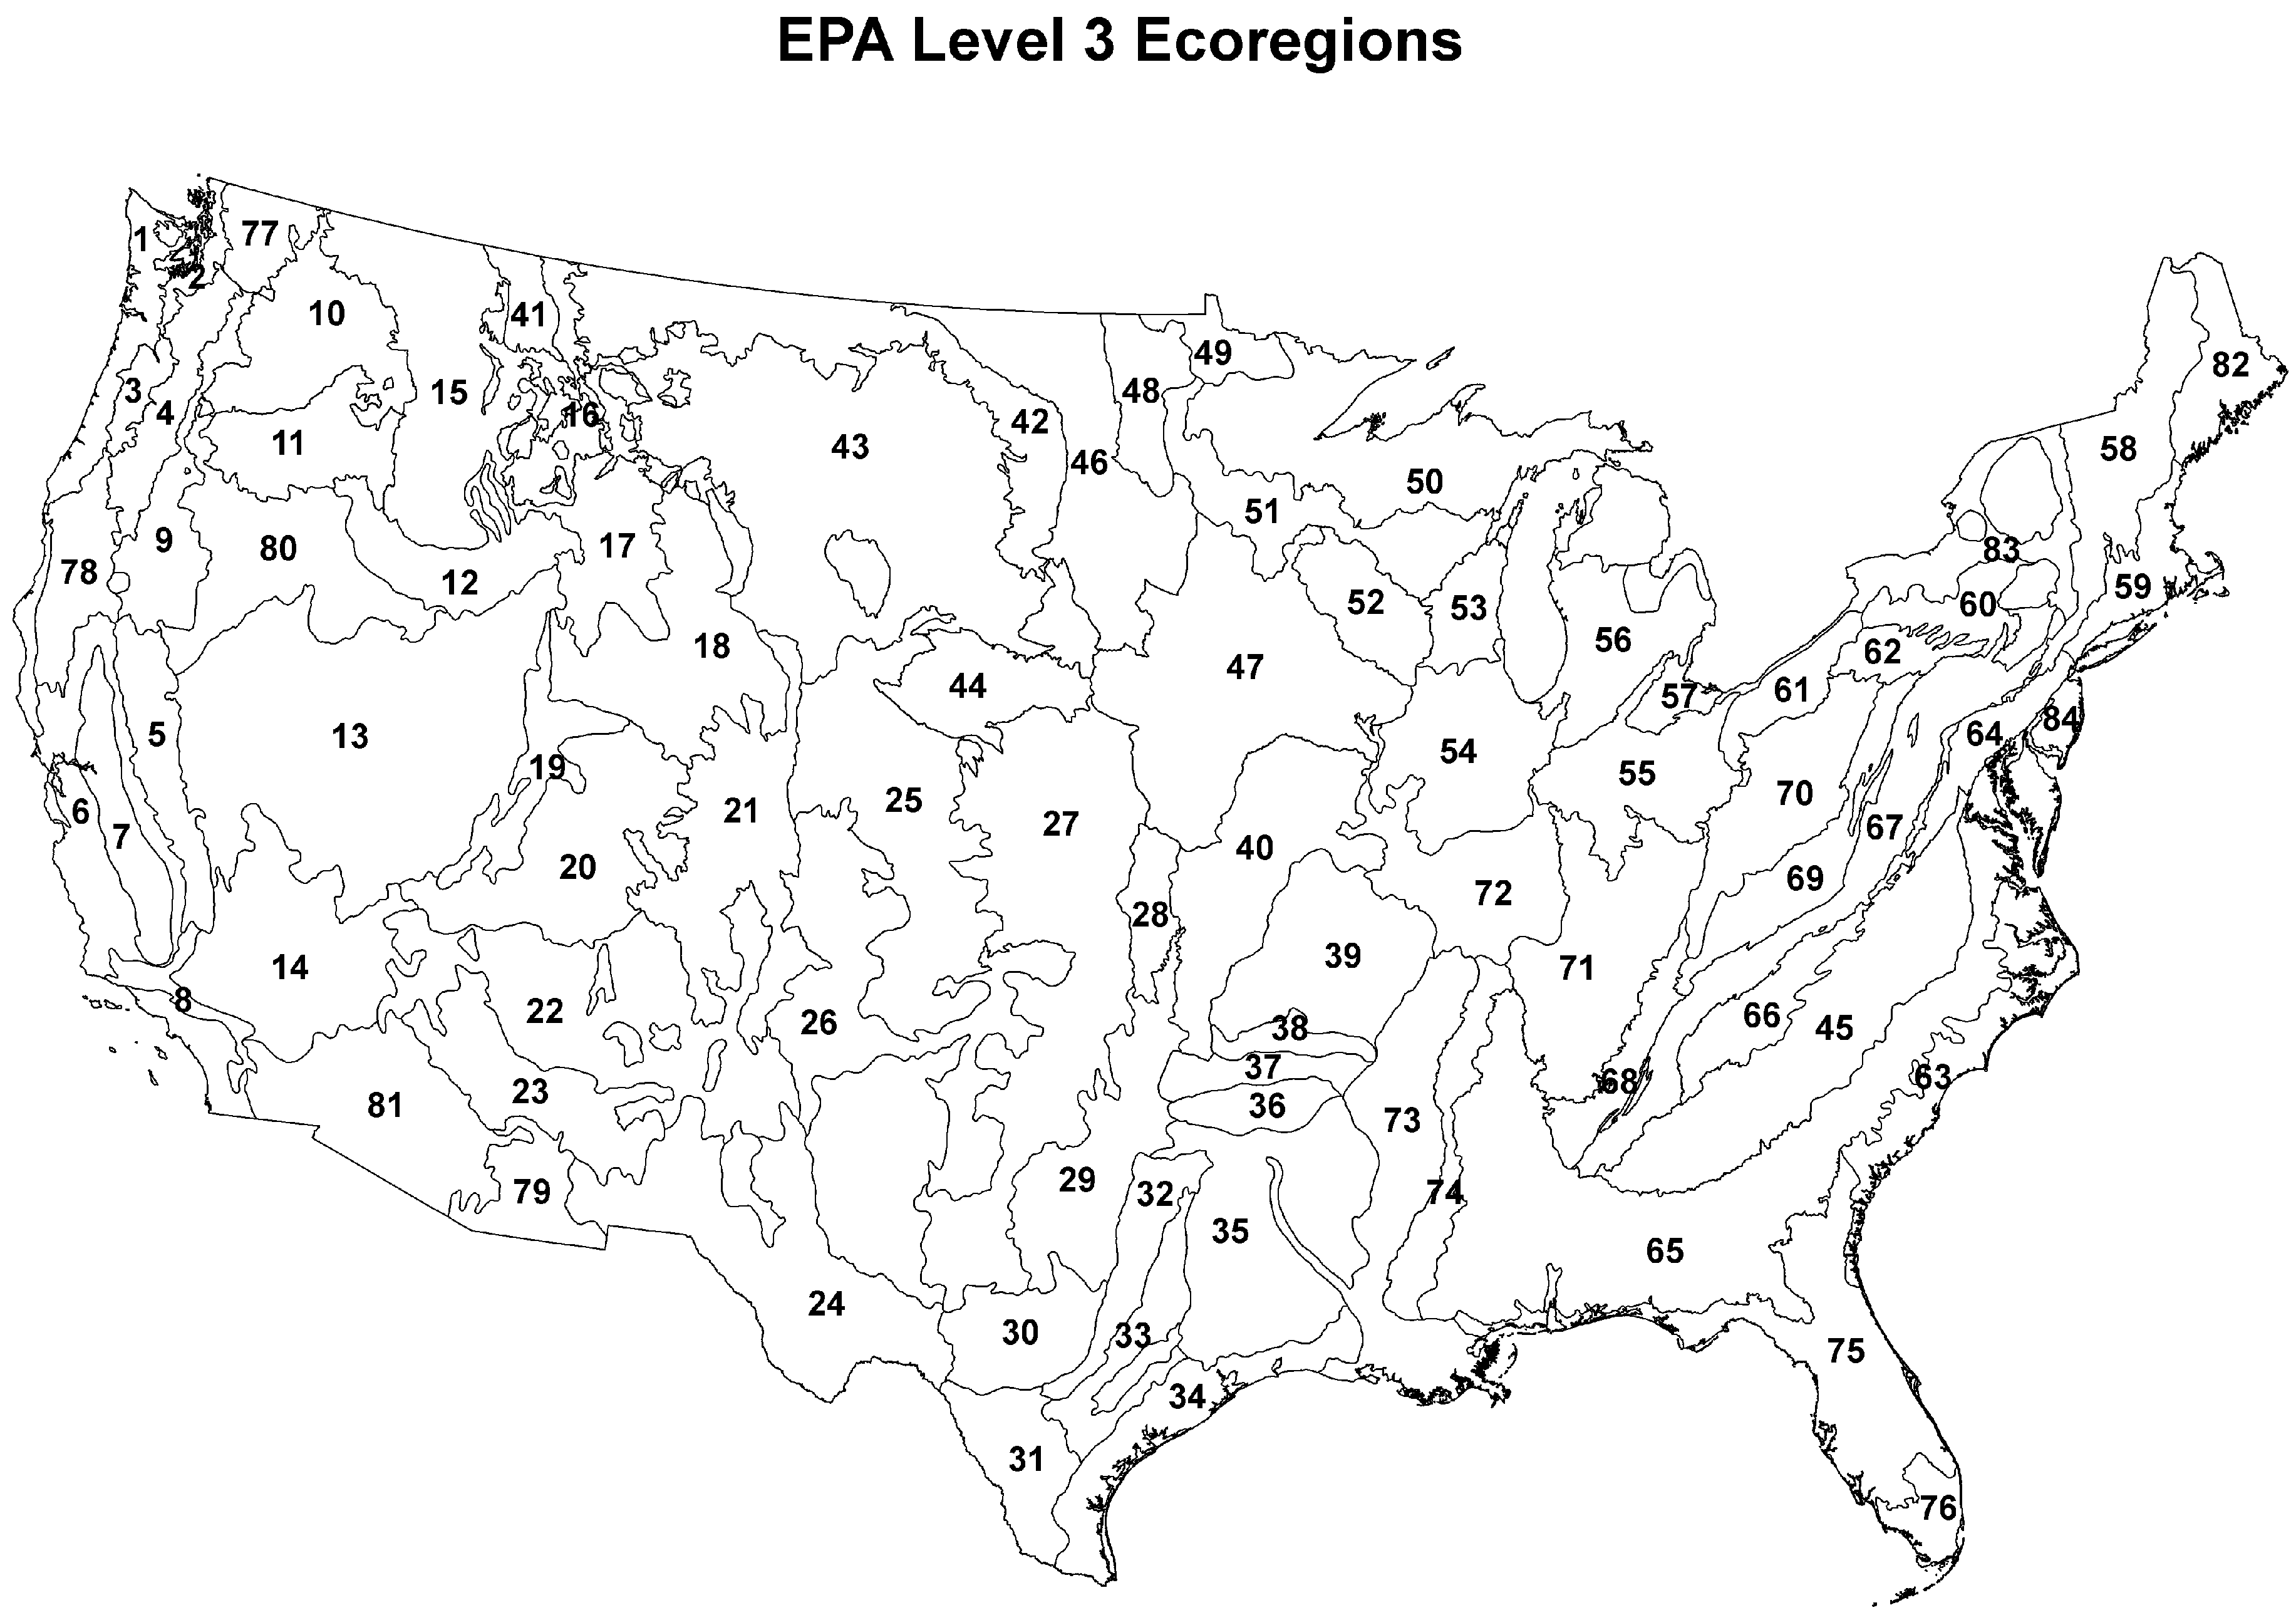
- U.S. Environmental Protection Agency. Level III Ecoregions of the Continental United States, 1999. National Health and Environmental Effects Research Laboratory, Scale 1:7,500,000 Map; 2015. Available online: ftp://ftp.epa.gov/wed/ecoregions/usgs/useco_March1999_v5.pdf (accessed on 26 March 2016). [Google Scholar]
- Anderson, J.R.; Hardy, E.E.; Roach, J.T.; Witmer, R.E. A Land use and Land Cover Classification System for Use with Remote Sensor Data; U.S. Government Printing Office: Washington, DC, USA, 1976; p. 41.
- Homer, C.G.; Dewitz, J.; Yang, L.; Jin, S.; Danielson, P.; Xian, G.; Coulston, J.; Herold, N.; Wickham, J.; Megown, K. Completion of the 2001 National Land Cover Database for the conterminous United States. Photogramm. Eng. Remote. Sens. 2007, 73, 337–341. [Google Scholar]
- Vogelmann, J.E.; Howard, S.M.; Yang, L.; Larson, C.R.; Wylie, B.K.; van Driel, N. Completion of the 1990s National Land Cover Data Set for the conterminous United States from Landsat Thematic Mapper data and ancillary data sources. Photogramm. Eng. Remote. Sens. 2001, 67, 650–662. [Google Scholar]
- Wickham, J.D.; Stehman, S.V.; Gass, L.; Dewitz, J.; Fry, J.A.; Wade, T.G. Accuracy assessment of NLCD 2006 land cover and impervious surface. Remote. Sens. Environ. 2013, 130, 294–304. [Google Scholar] [CrossRef]
- Fry, J.; Xian, G.; Jin, S.; Dewitz, J.; Homer, C.; Yang, L.; Barnes, C.; Herold, N.; Wickham, J. Completion of the 2006 National Land Cover Database for the conterminous United States. Photogramm. Eng. Remote. Sens. 2011, 77, 858–864. [Google Scholar]
- Homer, C.; Dewitz, J.; Yang, L.; Jin, S.; Danielson, P.; Xian, G.; Coulston, J.; Herold, N.; Wickham, J.; Megown, K. Completion of the 2011 National Land Cover Database for the conterminous United States—A decade of land cover change information. Photogramm. Eng. Remote. Sens. 2015, 81, 345–354. [Google Scholar]
- Fry, J.; Coan, M.; Homer, C.; Meyer, D.; Wickham, J. Completion of the National Land Cover Database (NLCD) 1992–2001 Land Cover Change Retrofit Product. U.S. Geological Survey Open-File Report 2008-1379. Available online: http://pubs.usgs.gov/of/2008/1379/ (accessed on 17 May 2016).
- Hollister, J.W.; Gonzalez, M.L.; Paul, J.P.; August, P.V.; Copeland, J.L. Assessing the accuracy of national land cover dataset area estimates at multiple spatial extents. Photogramm. Eng. Remote. Sens. 2004, 70, 405–414. [Google Scholar] [CrossRef]
- Stehman, S.V.; Sohl, T.L.; Loveland, T.R. Statistical sampling to characterize recent United States land-cover change. Remote. Sens. Environ. 2003, 86, 517–529. [Google Scholar] [CrossRef]
- Griffith, J.A.; Stehman, S.V.; Sohl, T.L.; Loveland, T.R. Detecting trends in landscape pattern metrics over a 20-year period using a sampling-based monitoring programme. Int. J. Remote. Sens. 2003, 24, 175–181. [Google Scholar] [CrossRef]
- Stehman, S.V.; Sohl, T.L.; Loveland, T.R. Statistical sampling to characterize recent United States land-cover change. Int. J. Remote. Sens. 2005, 26, 4941–4957. [Google Scholar] [CrossRef]
- Sleeter, B.M. Late 20th century land change in the Central California Valley Ecoregion. Calif. Geogr. 2008, 48, 27–60. [Google Scholar]
- Drummond, M.A.; Loveland, T.R. Land-use pressure and a transition to forest-cover loss in the eastern United States. BioScience 2010, 60, 286–298. [Google Scholar] [CrossRef]
- Napton, D.E.; Auch, R.F.; Headley, R.; Taylor, J.L. Land changes and their driving forces in the south eastern United States. Reg. Environ. Chang. 2010, 10, 37–53. [Google Scholar] [CrossRef]
- Auch, R.F.; Sayler, K.L.; Napton, D.E.; Taylor, J.L.; Brooks, M.S. Ecoregional differences in late-20th-century land-use and land-cover change in the U.S. northern great plains. Great Plains Res. 2011, 21, 231–243. [Google Scholar]
- Auch, R.F.; Napton, D.E.; Kambly, S.; Moreland, T.R., Jr.; Sayler, K.L. The driving forces of land change in the northern piedmont of the United States. Geogr. Rev. 2012, 102, 53–75. [Google Scholar] [CrossRef]
- Soulard, C.E.; Sletter, B.M. Late twentieth century land-cover change in the basin and range ecoregions of the United States. Reg. Environ. Chang. 2012, 12, 813–823. [Google Scholar] [CrossRef]
- Drummond, M.A.; Auch, R.F.; Karstensen, K.A.; Sayler, K.L.; Taylor, J.L.; Loveland, T.R. Land change variability and human-environment dynamics in the United States Great Plains. Land Use Policy 2012, 29, 710–723. [Google Scholar] [CrossRef]
- Sohl, T.L.; Sohl, L.B. Land-sue change in the Atlantic coastal pine barrens ecoregion. Geogr. Rev. 2012, 102, 180–201. [Google Scholar] [CrossRef]
- Soulard, C.E.; Wilson, T.S. Recent land-use/land-cover change in the Central California Valley. J. Land Use Sci. 2015, 10, 59–80. [Google Scholar] [CrossRef]
- Auch, R.F.; Napton, D.E.; Sayler, K.L.; Drummond, M.A.; Kambly, S.; Sorenson, D.G. The Southern Piedmont’s continued land-use evolution, 1973–2011. Southeast. Geogr. 2015, 55, 338–361. [Google Scholar] [CrossRef]
- Wickham, J.D.; Riitters, K.H.; Wade, T.G.; Coan, M.; Homer, C. The effect of Appalachian mountaintop mining on interior forest. Landsc. Ecol. 2007, 22, 179–187. [Google Scholar] [CrossRef]
- Xian, G.; Homer, C.; Bunde, B.; Danielson, P.; Dewitz, J.; Fry, J.; Pu, R. Quantifying urban land cover change between 2001 and 2006 in the Gulf of Mexico region. Geocarto Int. 2012, 27, 479–497. [Google Scholar] [CrossRef]
- Gottmann, J. Megalopolis: The Urbanized Northeastern Seaboard of the United States; Twentieth Century Fund: New York, NY, USA, 1961; p. 820. [Google Scholar]
- Hart, J.F.; Morgan, J.T. Spersopolis. Southeast. Geogr. 1995, 35, 103–117. [Google Scholar] [CrossRef]
- Terando, A.J.; Costanza, J.; Belyea, C.; Dunn, R.R.; McKerrow, A.; Collazo, J.A. The southern megalopolis: Using the past to predict the future urban sprawl in the Southeast U.S. PLoS ONE 2014, 9, e102261. [Google Scholar] [CrossRef] [PubMed]
- Sohl, T.L.; Sleeter, B.M.; Zhu, Z.; Sayler, K.L.; Bennett, S.; Bouchard, M.; Reker, R.; Hawbaker, T.; Wein, A.; Liu, S.; et al. A land-use and land-cover modeling strategy to support a national assessment of carbon stocks and fluxes. Appl. Geogr. 2012, 23, 111–124. [Google Scholar] [CrossRef]
- von Hoffman, A.; Fleckner, J. The Historical Origins and Causes of Urban Decentralization in the United States; Joint Center for Housing Studies, Harvard University: Cambridge, MA, USA, 2001; p. 35. [Google Scholar]
- Auch, R.F.; Acevedo, W.; Taylor, J.L. The historical development of the Nation’s urban areas. In Rates, Trends, Causes, and Consequences of Urban Land-Use Change in the United States; Acevedo, W., Taylor, J.L., Hester, D.J., Mladinich, C.S., Glavac, S., Eds.; U.S. Government Printing Office: Washington, DC, USA, 2006; pp. 1–12. [Google Scholar]
- Drummond, M.A.; Stier, M.P.; Auch, R.F.; Taylor, A.; Griffith, G.E.; Hester, D.J.; Riegle, J.L.; Soulard, C.E.; Mcbeth, J.L. Assessing landscape change and processes of recurrence, replacement, and recovery in the Southeastern Coastal Plains, USA. Environ. Manag. 2015, 56, 1252–1271. [Google Scholar] [CrossRef] [PubMed]
- Auch, R.F. Northeastern Coastal Zone. U.S. Geological Survey Land Cover Trends project web site; 2006. Available online: http://landcovertrends.usgs.gov/east/eco59Report.html (accessed on 26 March 2016). [Google Scholar]


| Ecoregion | Forest to Urban, 1973–1980, km2 | Forest to Urban as % of Total New Developed 1973–1980 | Forest to Urban, 1980–1986, km2 | Forest to Urban as % of Total New Developed 1980–1986 | Forest to Urban, 1986–1992, km2 | Forest to Urban as % of Total New Developed 1986–1992 | Forest to Urban, 1992–2000, km2 | Forest to Urban as % of Total New Developed 1992–2000 | Forest to Urban, 2001–2006, km2 | Forest to Urban as % of Total New Developed 2001–2006 | Forest to Urban, 2006–2011, km2 | Forest to Urban as % of Total New Developed 2006–2011 |
|---|---|---|---|---|---|---|---|---|---|---|---|---|
| Coast Range | 59 (±38) | 75% | 37 (±23) | 58% | 48 (±30) | 72% | 92 (±45) | 72% | 1 | 47% | ||
| Puget Lowland | 222 (±62) | 85% | 144 (±56) | 73% | 215 (±52) | 71% | 290 (±43) | 66% | 51 | 58% | 24 | 48% |
| Cascades | 18 (±10) | 92% | 14 (±9) | 63% | 36 (±17) | 78% | 29 (±14) | 85% | ||||
| Sierra Nevada | 2 (±3) | 100% | ||||||||||
| Wasatch and Uinta Mountains | 4 (±6) | 93% | 1 (±1) | 68% | ||||||||
| Arizona/New Mexico Mountains | 17 (±24) | 61% | ||||||||||
| Edwards Plateau | 37 (±34) | 66% | 42 (±50) | 49% | 55 (±47) | 54% | 64 | 51% | 51 | 47% | ||
| South Central Plains | 167 (±83) | 72% | 374 (±239) | 70% | 103 (±38) | 48% | 367 (±297) | 86% | 156 | 52% | 115 | 53% |
| Ouachita Mountains | 11 (±7) | 62% | 12 (±9) | 69% | 15 (±15) | 91% | 17 (±12) | 87% | 17 | 62% | 9 | 60% |
| Arkansas Valley | 29 (±21) | 41% | 17 | 40% | ||||||||
| Boston Mts. | 3 (±3) | 62% | 4 (±3) | 63% | 4 (±3) | 90% | 5 | 52% | ||||
| Ozark Highlands | 112 (±121) | 66% | 42 (±33) | 56% | 61 (±42) | 48% | 55 (±38) | 48% | ||||
| Canadian Rockies | 3 (±3) | 99% | 4 (±3) | 98% | 2 (±2) | 83% | 5 (±3) | 74% | ||||
| Piedmont | 980 (±895) | 79% | 503 (±201) | 58% | 1569 (±859) | 70% | 2263 (±1374) | 73% | 837 | 59% | 269 | 52% |
| Northern Minnesota Wetlands | 5 (±5) | 64% | 1 (±1) | 59% | ||||||||
| Northern Lakes and Plains | 45 (±37) | 97% | 63 (±33) | 85% | 64 (±35) | 89% | 115 (±104) | 94% | ||||
| Northeastern Highlands | 85 (±53) | 83% | 67 (±52) | 84% | 161 (±116) | 91% | 194 (±140) | 69% | 34 | 62% | 29 | 55% |
| Northeastern Coastal Zone | 223 (±73) | 78% | 162 (±44) | 75% | 368 (±85) | 71% | 369 (±83) | 75% | 214 | 60% | 137 | 57% |
| N. Appalachian Plateau and Uplands | 24 (±15) | 63% | 11 (±11) | 62% | 19 (±12) | 43% | 4 | 43% | ||||
| Erie Drift Plains | 67 (±36) | 43% | 137 (±77) | 44% | 53 | 45% | ||||||
| North Central Appalachians | 7 (±5) | 75% | 16 (±11) | 83% | 27 (±17) | 82% | 27 (±14) | 90% | 6 | 73% | 12 | 68% |
| Middle Atlantic Coastal Plain | 444 (±270) | 88% | 498 (±336) | 83% | 493 (±305) | 83% | 306 (±178) | 54% | ||||
| Southeastern Plains | 483 (±325) | 73% | 578 (±367) | 70% | 578 (±330) | 61% | 1415 (±713) | 69% | ||||
| Blue Ridge Mountains | 112 (±59) | 95% | 95 (±68) | 94% | 66 (±53) | 61% | 191 (±71) | 94% | 38 | 67% | 17 | 55% |
| Ridge and Valley | 148 (±70) | 60% | 110 (±39) | 41% | 152 (±66) | 47% | 317 (±126) | 46% | 219 | 43% | ||
| SW Appalachians | 14 (±7) | 77% | 61 (±50) | 72% | 56 (±29) | 64% | 92 (±42) | 70% | 23 | 42% | 15 | 56% |
| Central Appalachians | 60 (±28) | 59% | 18 (±10) | 65% | 37 (±18) | 40% | 74 (±37) | 61% | 5 | 51% | ||
| Western Allegheny Plateau | 47 (±26) | 74% | 30 (±11) | 56% | 76 (±46) | 53% | 79 (±26) | 47% | 87 | 57% | 38 | 48% |
| Interior Plateau | 105 (±73) | 46% | ||||||||||
| Mississippi Alluvial Plain | 178 (±163) | 50% | 266 (±217) | 47% | 286 (±349) | 41% | ||||||
| North Cascades | 1 (±2) | 100% | 3 (±3) | 99% | 3 | 47% | ||||||
| Klamath Mountains | 28 (±27) | 51% | ||||||||||
| Laurentian Plains and Hills | 17 (±9) | 91% | 18 (±9) | 78% | 25 (±12) | 85% | 49 (±20) | 81% | 11 | 60% | 6 | 58% |
| E Great Lakes and Hudson Lowlands | 160 (±108) | 64% | 168 (±135) | 62% | 185 (±130) | 42% | ||||||
| Atlantic Coastal Pine Barrens | 88 (±45) | 45% | 98 (±32) | 41% | 73 | 45% | 45 | 45% |
| Ecoregion | % Forest to Urban, 1973–1980, LC Trends | % Forest to Ecoregion, 1973–1980, LC Trends | % Forest to Urban, 1980–1986, LC Trends | % Forest to Ecoregion, 1980–1986, LC Trends | % Forest to Urban, 1986–1992, LC Trends | % Forest to Ecoregion, 1986–1992, LC Trends | % Forest to Urban, 1992–2000, LC Trends | % Forest to Ecoregion, 1992–2000, LC Trends | % Forest to Urban, 2001–2006, NLCD | % Forest to Ecoregion, 2001–2006, NLCD | % Forest to Urban, 2006–2011, NLCD | % Forest to Ecoregion, 2006–2011, NLCD |
|---|---|---|---|---|---|---|---|---|---|---|---|---|
| Coast Range | 72.0 | 71.7 | ||||||||||
| Puget Lowland | 85.5 | 55.5 | 73.0 | 53.0 | 70.7 | 50.0 | 66.2 | 47.6 | 58.4 | 42.9 | 48 | 41.2 |
| Cascades | 99.0 | 81.8 | 85.3 | 81.7 | ||||||||
| Sierra Nevada | 100.0 | 72.8 | ||||||||||
| S. California Mountains | 28.9 | 27.3 | ||||||||||
| MT Valley & Foothill Prairies | 35.8 | 17.8 | ||||||||||
| Wyoming Basin | 5 | 2.4 | ||||||||||
| Wasatch and Uinta Mts. | 92.8 | 61.7 | 68.0 | 61.6 | ||||||||
| Arizona/New Mexico Mountains | 61 | 58 | ||||||||||
| Chihuahuan Deserts | 4.2 | 2.4 | ||||||||||
| Western High Plains | 0.7 | 0.5 | ||||||||||
| Southwestern Tablelands | 5.7 | 2.8 | ||||||||||
| Central Great Plains | 3.8 | 2.5 | 3.2 | 2.5 | ||||||||
| Flint Hills | 16.3 | 6.1 | 13.7 | 5.6 | 10 | 5.6 | ||||||
| Central Oklahoma/Texas Plains | 23.7 | 19.3 | ||||||||||
| Edwards Plateau | 66.4 | 27.9 | 49.4 | 27.5 | 54.3 | 27.1 | 51.4 | 24.5 | 46.4 | 23.9 | ||
| Southern Texas Plains | 11.1 | 5.4 | 1.5 | 1.1 | 2.8 | 1.1 | ||||||
| Texas Blackland Prairies | 15.9 | 12.1 | 16.3 | 11.9 | ||||||||
| East Central Texas Plains | 35.1 | 31.3 | 32.6 | 30.7 | 29.5 | 20.6 | 24.6 | 20.3 | ||||
| Western Gulf Coastal Plain | 21.2 | 12 | 12.7 | 11.9 | 21.5 | 11.9 | 28.3 | 11.7 | 12.9 | 5 | 11.3 | 4.8 |
| South Central Plains | 72.4 | 62.7 | 69.9 | 60.6 | 85.9 | 59.3 | 51.8 | 47.2 | 52.8 | 45.8 | ||
| Ouachita Mountains | 90.5 | 76.9 | 86.8 | 78.5 | ||||||||
| Boston Mts. | 89.9 | 76.2 | ||||||||||
| Ozark Highlands | 66.2 | 58.1 | ||||||||||
| Canadian Rockies | 98.6 | 70.2 | 98.2 | 70.2 | 82.9 | 69.6 | 74.5 | 68.8 | ||||
| Nebraska Sandhills | 1.0 | 0.4 | 2.2 | 0.4 | ||||||||
| Piedmont | 78.6 | 59.4 | 70.4 | 57.2 | 72.6 | 55.8 | 59.4 | 57.3 | ||||
| Northern Glaciated Plains | 3.3 | 3.0 | 1.2 | 1.1 | ||||||||
| Western Corn Belt Plains | 5.4 | 3.3 | 4 | 3.3 | 6.2 | 4.4 | ||||||
| Lake Agassiz Plain | 6.3 | 5.6 | ||||||||||
| Northern Minnesota Wetlands | 63.9 | 38.2 | 59.5 | 36.5 | 21.4 | 13.0 | ||||||
| Northern Lakes and Forests | 97.3 | 64.1 | 84.5 | 63.2 | 88.6 | 62.4 | 94.4 | 61.9 | ||||
| Southeastern Wisconsin Till Plains | 15.5 | 11.9 | ||||||||||
| Central Corn Belt Plains | 11 | 9.5 | 12.5 | 9.4 | 9.6 | 8.8 | 12.1 | 8.8 | ||||
| Eastern Corn Belt Plains | 13.9 | 12.8 | 14.2 | 13.9 | ||||||||
| S. Michigan/N. Indiana Drift Plains | 33.4 | 24.4 | 23.0 | 20.1 | 20.3 | 20 | ||||||
| Huron/Erie Lake Plains | 17.5 | 12.8 | 13.0 | 12.7 | 21.5 | 12.7 | 18.8 | 12.6 | 11.6 | 8.9 | ||
| Northeastern Highlands | 83.9 | 83.1 | 91.3 | 81.9 | ||||||||
| Northeastern Coastal Zone | 77.9 | 50.2 | 75.3 | 49.5 | 71.2 | 48.7 | 75.3 | 47.5 | 60.4 | 45.6 | 56.6 | 44.9 |
| N. Appalachian Plateau and Uplands | 63.1 | 60.0 | 62.0 | 60.0 | ||||||||
| Erie Drift Plains | 43.0 | 37.5 | 38.0 | 37.4 | 44.0 | 37.2 | 45.3 | 37.5 | ||||
| North Central Appalachians | 90.4 | 86.7 | ||||||||||
| Middle Atlantic Coastal Plain | 88.5 | 34.7 | 82.7 | 33.5 | 84.3 | 32.6 | 54.2 | 32 | 30.7 | 18.9 | 29.4 | 17.4 |
| Northern Piedmont | 35.9 | 30.4 | ||||||||||
| Southeastern Plains | 73.3 | 52.6 | 70.4 | 51.9 | 60.6 | 51.8 | 69.3 | 51.9 | ||||
| Blue Ridge Mountains | 95.1 | 79.3 | 93.9 | 79 | 93.7 | 78.5 | ||||||
| Ridge and Valley | 60.2 | 57.1 | ||||||||||
| Western Allegheny Plateau | 74.3 | 64.3 | ||||||||||
| Interior Plateau | 45.8 | 38.9 | ||||||||||
| Interior River Lowland | 27.4 | 27 | 28.6 | 26.9 | ||||||||
| Mississippi Alluvial Plain | 49.7 | 10.3 | 46.5 | 9.9 | 28.4 | 9.6 | 41.3 | 9.6 | 11.4 | 4.5 | 14.8 | 4.5 |
| Southern Coastal Plain | 27.9 | 27.6 | 32.9 | 26.4 | 27.7 | 25.3 | 29.1 | 24.4 | ||||
| Southern Florida Coastal Plain | 35.6 | 2.8 | 21.2 | 2.7 | 14.9 | 2.6 | 9.9 | 2.6 | ||||
| Northern Cascades | 100.0 | 71.7 | 98.9 | 70.9 | 100.0 | 70.4 | ||||||
| Northern Basin and Range | 3.0 | 1.7 | 2.1 | 1.6 | ||||||||
| Laurentian Plains and Hills | 90.8 | 71.8 | 77.9 | 71.0 | 84.7 | 70.2 | 81.0 | 70.0 | ||||
| E Great Lakes and Hudson Lowlands | 62.4 | 39.3 | 62.5 | 39 | 42.2 | 38.9 | 39 | 34.2 | 34.4 | 34 | ||
| Atlantic Coastal Pine Barrens | 44.7 | 23.1 | 40.9 | 22.5 | 25.8 | 22 | 25.7 | 21.7 | 44.6 | 25.5 | 45 | 24.9 |
| Eco | Annual Rate of Forest to Urban Change 73–80 LC Trends | Annual Rate of Forest to Urban Change 80–86 LC Trends | Annual Rate of Forest to Urban Change 86–92 LC Trends | Annual Rate of Forest to Urban Change 92–00 LC Trends | Annual Rate of Forest to Urban Change 01–06 NLCD | Annual Rate of Forest to Urban Change 06–11 NLCD |
|---|---|---|---|---|---|---|
| Puget Lowland | 0.31% | 0.25% | 0.38% | 0.42% | ||
| Western Gulf Coastal Plain | 0.26% | 0.21% | ||||
| Piedmont | 0.27% | 0.30% | ||||
| Eastern Corn Belt Plains | 0.20% | 0.24% | ||||
| Northeastern Coastal Zone | 0.34% | 0.26% | 0.27% | |||
| Erie Drift Plains | 0.20% | |||||
| Middle Atlantic Coastal Plain | 0.20% | 0.27% | 0.28% | |||
| Northern Piedmont | 0.25% | 0.21% | ||||
| Mississippi Alluvial Plain | 0.31% | 0.26% | ||||
| Southern Coastal Plain | 0.26% | 0.26% | 0.22% | 0.27% | ||
| Southern Florida Coastal Plain | 0.56% | 0.48% | 0.61% | 0.23% | ||
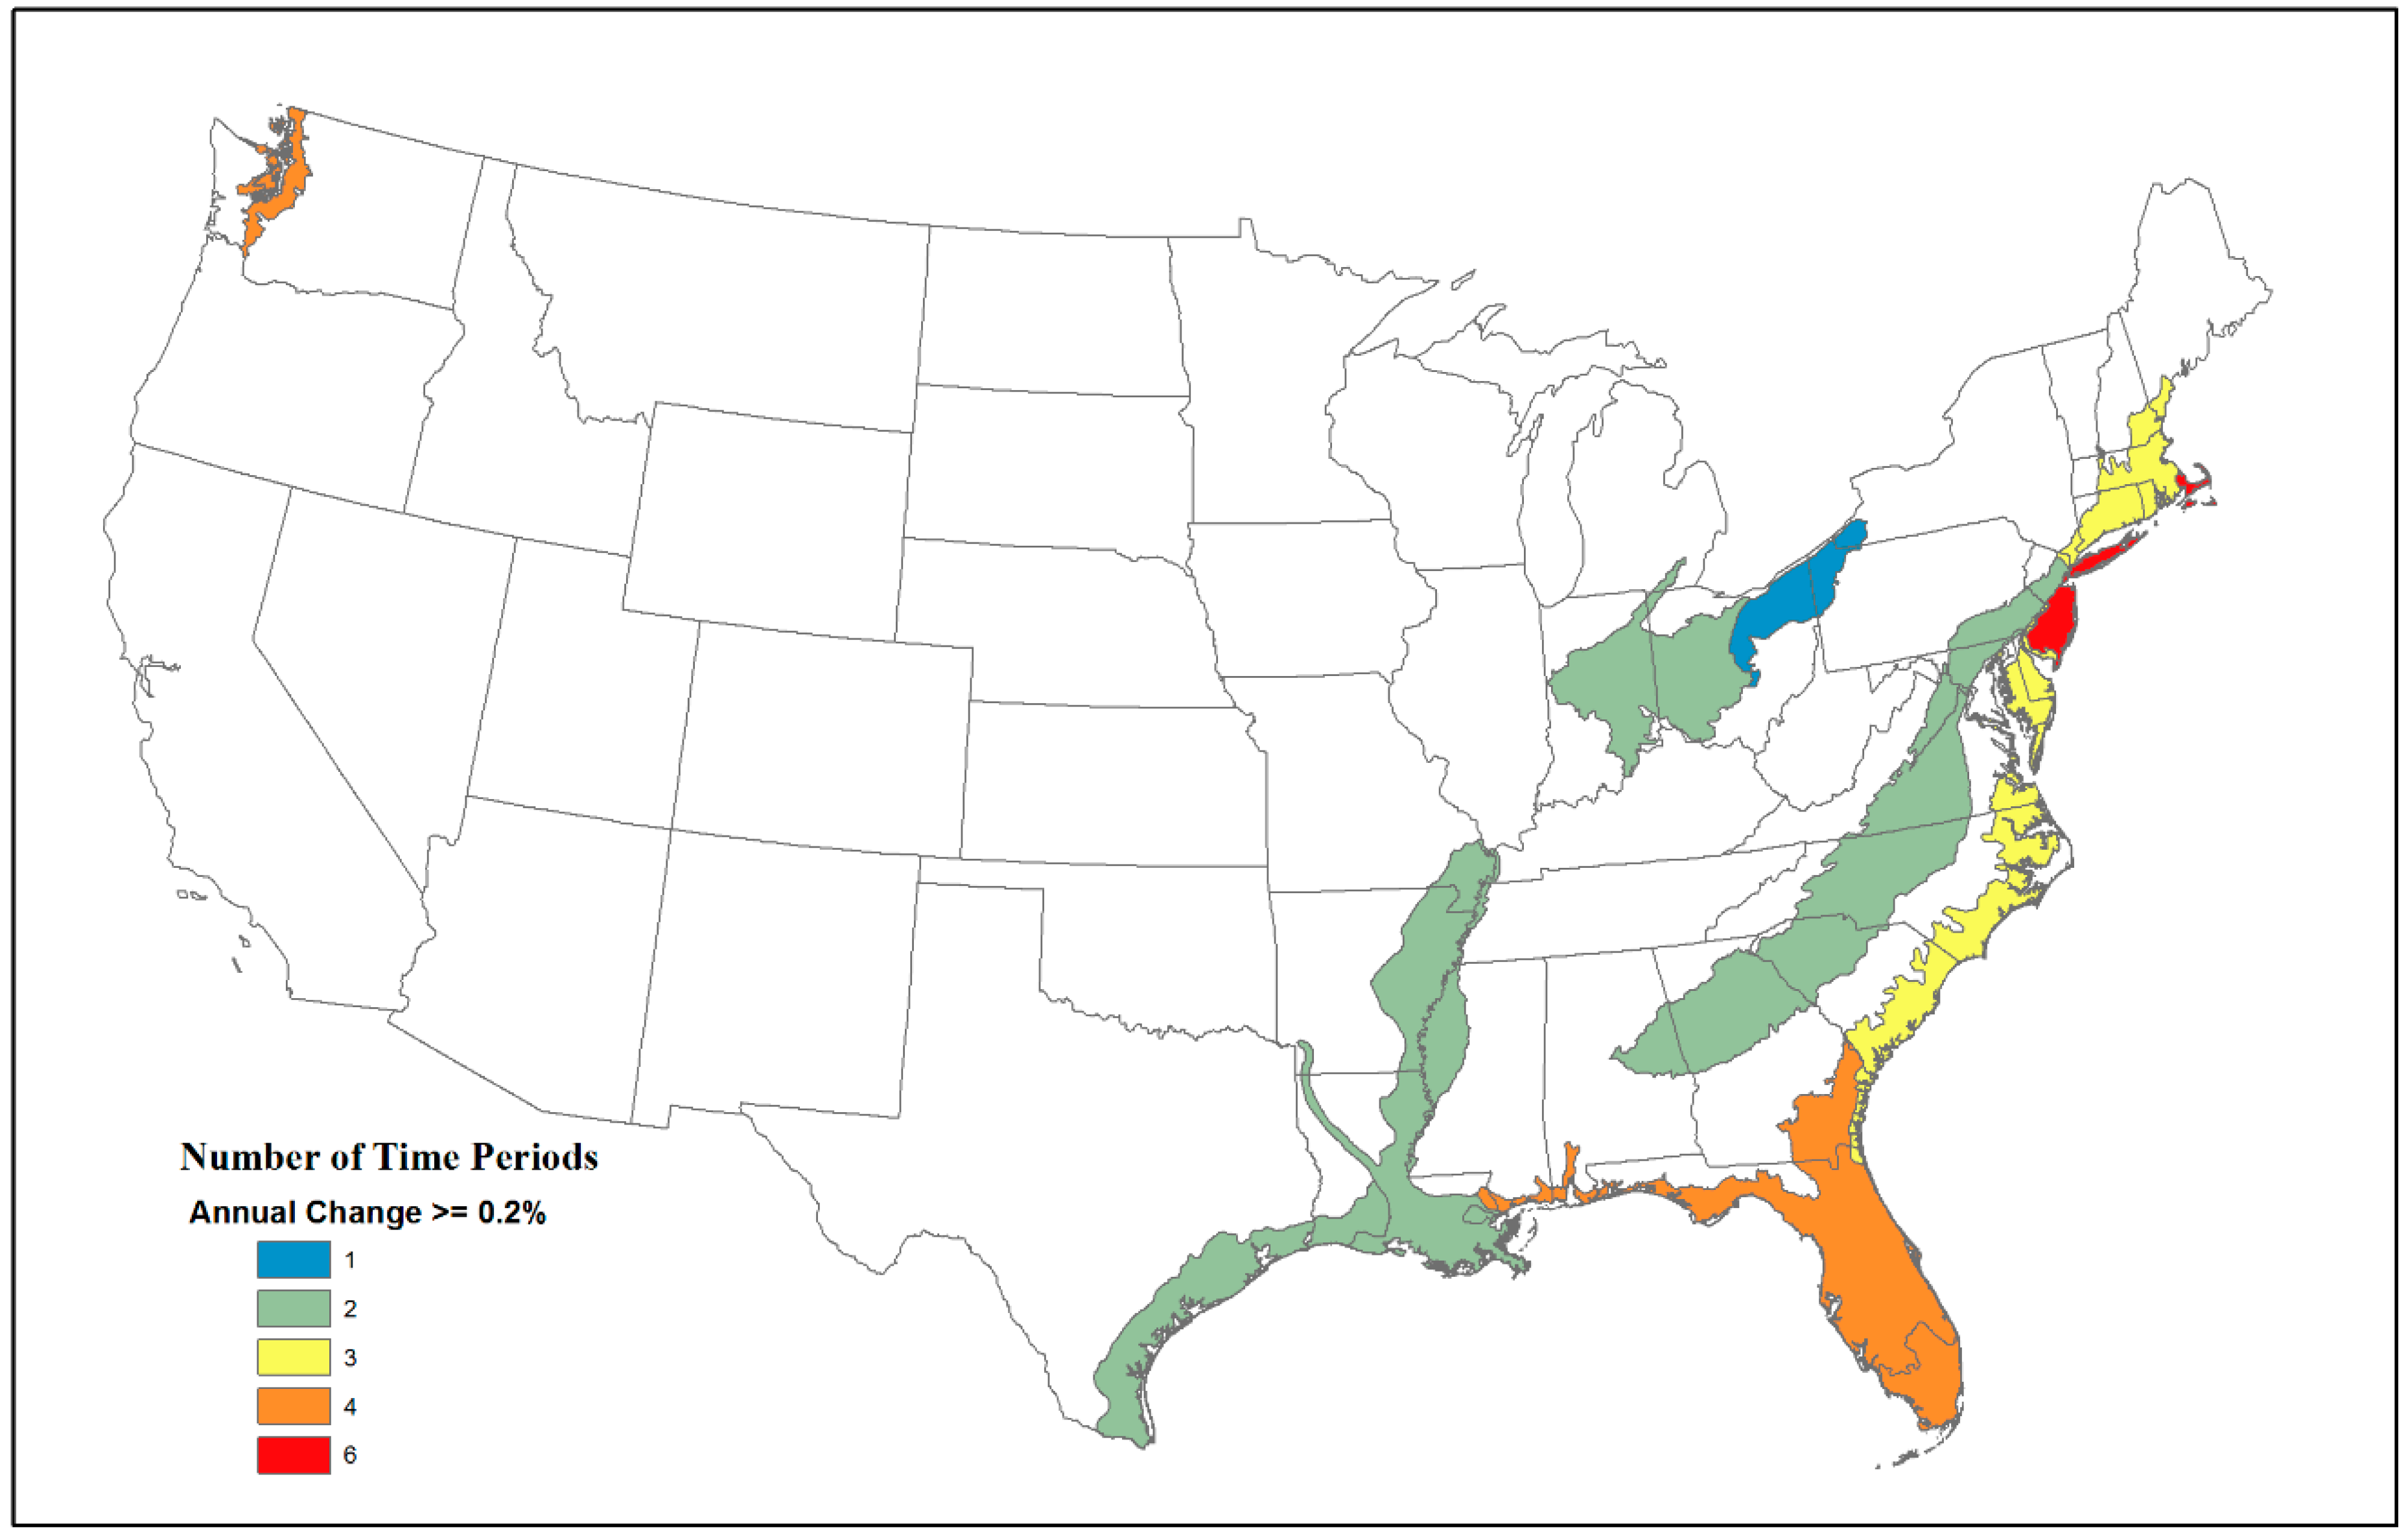
| Atlantic Coastal Pine Barrens | 0.28% | 0.37% | 0.24% | 0.20% | 0.35% | 0.22% |
© 2016 by the authors; licensee MDPI, Basel, Switzerland. This article is an open access article distributed under the terms and conditions of the Creative Commons Attribution (CC-BY) license (http://creativecommons.org/licenses/by/4.0/).
Share and Cite
Auch, R.F.; Drummond, M.A.; Xian, G.; Sayler, K.L.; Acevedo, W.; Taylor, J.L. Regional Differences in Upland Forest to Developed (Urban) Land Cover Conversions in the Conterminous U.S., 1973–2011. Forests 2016, 7, 132. https://doi.org/10.3390/f7070132
Auch RF, Drummond MA, Xian G, Sayler KL, Acevedo W, Taylor JL. Regional Differences in Upland Forest to Developed (Urban) Land Cover Conversions in the Conterminous U.S., 1973–2011. Forests. 2016; 7(7):132. https://doi.org/10.3390/f7070132
Chicago/Turabian StyleAuch, Roger F., Mark A. Drummond, George Xian, Kristi L. Sayler, William Acevedo, and Janis L. Taylor. 2016. "Regional Differences in Upland Forest to Developed (Urban) Land Cover Conversions in the Conterminous U.S., 1973–2011" Forests 7, no. 7: 132. https://doi.org/10.3390/f7070132
APA StyleAuch, R. F., Drummond, M. A., Xian, G., Sayler, K. L., Acevedo, W., & Taylor, J. L. (2016). Regional Differences in Upland Forest to Developed (Urban) Land Cover Conversions in the Conterminous U.S., 1973–2011. Forests, 7(7), 132. https://doi.org/10.3390/f7070132