Article

Spatio-Temporal Changes in Structure for a Mediterranean Urban Forest: Santiago, Chile 2002 to 2014

by
Francisco J. Escobedo
1,*,
Sebastian Palmas-Perez
2,
Cynnamon Dobbs
3,
Salvador Gezan
2 and
Jaime Hernandez
4
1
Biology Program—Functional and Ecosystem Ecology Unit, Faculty of Natural Sciences and Mathematics, Universidad del Rosario, Kr 26 No 63B-48, Bogotá D.C. 111221492, Colombia
2
School of Forest Resources and Conservation, IFAS-University of Florida, Gainesville, FL 32611, USA
3
Departamento de Ecosistemas y Medio Ambiente, Facultad de Agronomia e Ingenieria Forestal, Pontificia Universidad Catolica de Chile, Av. Vicuna Mackenna 4860, Macul, Santiago 7820436, Chile
4
Laboratorio de Geomática y Ecología del Paisaje, Facultad de Ciencias Forestales y de la Conservación de la Naturaleza, Universidad de Chile, Santiago 7820436, Chile
*
Author to whom correspondence should be addressed.
Forests 2016, 7(6), 121; https://doi.org/10.3390/f7060121
Submission received: 15 March 2016 / Revised: 1 June 2016 / Accepted: 2 June 2016 / Published: 11 June 2016
(This article belongs to the Special Issue Urban and Periurban Forest Diversity and Ecosystem Services)

Abstract

:
There is little information on how urban forest ecosystems in South America and Mediterranean climates change across both space and time. This study statistically and spatially analyzed the spatio-temporal dynamics of Santiago, Chile’s urban forest using tree and plot-level data from permanent plots from 2002 to 2014. We found mortality, ingrowth, and tree cover remained stable over the analysis period and similar patterns were observed for basal area (BA) and biomass. However, tree cover increased, and was greater in the highest socioeconomic stratum neighborhoods while it dropped in the medium and low strata. Growth rates for the five most common tree species averaged from 0.12 to 0.36 cm·year−1. Spatially, tree biomass and BA were greater in the affluent, northeastern sections of the city and in southwest peri-urban areas. Conversely, less affluent central, northwest, and southern areas showed temporal losses in BA and biomass. Overall, we found that Santiago’s urban forest follows similar patterns as in other parts of the world; affluent areas tend to have more and better managed urban forests than poorer areas, and changes are primarily influenced by social and ecological drivers. Nonetheless, care is warranted when comparing urban forest structural metrics measured with similar sampling-monitoring approaches across ecologically disparate regions and biomes.

Graphical Abstract

1. Introduction

Urban forests are characterized by unique soils and urban morphologies, heterogeneous vegetation structure and composition, and novel assemblages of native and exotic tree species [1,2,3]. The spatial and temporal characteristics of urban forest structure are driven by biophysical factors such as topography, climate, biogeochemical cycles, and disturbances such as drought [2,4,5]. They are also affected by socioeconomic factors such as management and planning regimes, people’s preferences, and socio-political budgets and directives [6,7,8]. As all these drivers alter the structure and composition of an urban forest, so too are ecological processes affected and subsequently the provision of ecosystem services [6]. A few studies have examined urban forests, their functions, and mortality with some examples from Mediterranean climate urban forests in California (United States, US), Spain, and Italy [9,10,11,12]. However, other than these few studies, there is little information on how and why urban forest structure in South America, the global south, and Mediterranean climates changes across space and time.
Urban forests are a key component in cities and provider of ecosystem services as they influence the well-being of urban inhabitants [11,13]. They are able to store and sequester carbon, regulate hydrologic cycles, ameliorate climate, remove air pollutants, provide habitat for fauna and space for recreation and spiritual enjoyment, among other services [13,14]. However, multi-scale economic and socio-ecological drivers can alter urban forest structure, thus understanding the spatio-temporal dynamics of urban forest structure and composition can provide insights on their management and planning [15].
Tree planting preferences and management decisions by both private individuals and communities can influence urban forest cover and density, growth, mortality, and distribution [6]. Similarly, species composition, age diversity, condition, site characteristics, and socio-ecological disturbances have an effect on growth of the urban forest [2,4,7,8], affecting several ecosystem processes, disservices and services. The type of land use and building density (i.e., urban morphology) and socioeconomic status in particular, affect the structure and distribution of the urban forest, leading to changes in biomass with consequences for carbon storage and sequestration [5,6,10,12]. Growth, mortality, and regeneration in both urban and natural forests depend on environmental factors such as rainfall, temperature, and soil conditions; however, urban tree growth and biomass have been shown to be often greater in urban than natural landscapes [16]. Other anthropogenic factors affecting growth and mortality include exposure to pollution, artificial irrigation, and vegetation management and maintenance practices [7,8,16,17].
Irrigation becomes extremely influential in Mediterranean semi-arid and arid cities where frequent droughts and water scarcity during growing periods can cause reduced growth, basal area, and biomass, and can increase mortality rates [15]. These structural effects can be measured in growth rates, biomass, basal area, and mortality rates, and are key for analyzing temporal patterns of carbon sequestration and storage [17], tree wood waste biomass [5], and overall effects of climate on urban forest structure [6]. Research on urban tree growth, biomass, and basal area is scarce and, to our knowledge, limited to a number of species mainly from North America [10,16,18] and a few studies from other regions [19,20,21]. Further information on drivers of urban tree growth and mortality can improve decision-making on tree selection, urban forest carbon accounting, and benefit estimates [10,17,22,23].
Temporal studies of urban forest ecosystems are not common and are mainly based on coarse resolution information derived from satellite imagery [7,24,25,26,27]. Most research for monitoring the urban forest has been based on land use/land cover change analyses, with several examples from the US [5,7,16], Europe [24], and Asia [25], with few examples from Latin America [26] and Africa [27]. Research based on inventories and field data are particularly scarce, aside from monitoring of planted street trees [10,20] and citation therein], and a few examples from the subtropics [5,8,16,28] and humid temperate areas of North America [7] exist. However, most of these mentioned studies are located in temperate and industrialized regions, with a scarce few studies from elsewhere [2,15] such as those in South America and from cities in Mediterranean climates. The use of permanent urban forest plots for monitoring the structure and composition of the urban forest is increasingly being used for not only recognizing necessary changes in planning and management goals, but also for distinguishing the most effective practices that maximize the provision of ecosystem services [4,7]. Nevertheless, such research and information is rare for urban forests in South America and in Mediterranean climates, such as south and western Australia [15], southern Europe [20,23], and southern Africa [27].
The aim of this study is to analyze the spatio-temporal dynamics of a South American urban forest with a Mediterranean climate using tree and plot-level data from permanent monitoring plots. Additionally, to our knowledge, such an approach would make this study one of the first of its kind in South America. Our specific study objectives are to analyze temporal changes from 2002 to 2014 and spatial differences in urban forest structural characteristics from Santiago, Chile including: (1) overall tree population growth, mortality, and ingrowth; (2) basal area, biomass, and tree cover change dynamics; (3) correlates of structural change; and (4) spatial patterns across the study area. We propose to address these research questions using statistical and spatial analyses of field data collected during 2002 and 2014. This type of study can be used to better understand the effects of urbanization and land use change on the structure of not only Latin American but Mediterranean climate urban forests as well. Findings can also be compared to similar plot based studies from other urban forests. Similarly, structural information, such as growth rates and biomass change, is key towards assessing ecosystem services and disservices that are frequently being used in urban planning, sustainability and climate change initiatives, and land management decisions.

2. Methods

2.1. Study Area and Field Sampling

Santiago, Chile is located in the middle of the Chilean Mediterranean climate zone (33°27′ S–70°41′ W). According to the Köppen climate classification systems, Santiago has a cool, semi-arid climate with warm, dry, hot, summers (November to March; [29]). Temperatures vary from an average of 20 °C in January to 8 °C in June–July with an annual average of 14.4 °C, while mean rainfall is 312.5 mm per year ([29]). The city lies in the center of a valley surrounded by a coastal mountain range to the west and the foothills of the Andes to the east. The elevation varies from 400 to 900 m with an average of 540 m. In 2002 its population was 5.3 million inhabitants with a population density of 10,000 people/km2 and 55,700 ha of built up area, which increased to 61,679 ha by 2009 [30]. The study area of 967 km2 is within the Santiago Metropolitan area and its 2014 population of approximately 7 million inhabitants, and encompasses multiple land use, land covers, and tenures. The eastern higher elevation portion of the study area is located in Andean piedmont shrublands while the western portion, once an Acacia spp. and grass dominated alluvial plain, has now mostly been altered to agricultural and urban land covers [12,30].
A total of 200 stratified random 400 m2 plots, originally measured during January and February 2002 using criteria outlined in [12], were allocated across all of the Santiago Metropolitan area’s 36 comunas and an additional four unincorporated ones (i.e., Colina, Lampa, Puente Alto, and San Bernardo). A comuna in Chile is a geographically and administratively delineated municipality. Of the 200 originally measured plots in the study area, 192 were relocated and re-measured during October 2014 to January 2015 (Figure 1).
Re-measured plots were assigned land use classes based on existing land use and land cover types originally defined in 2002 ([12]; Table 1). We also classified the 2002 pervious surface cover types on each plot into percent: maintained grass, herbaceous vegetation, and bare soil. Percent impervious surface covers were also measured and include: cement, buildings, and paved surfaces. Plots were also post-stratified into low, medium, or high socioeconomic strata based on the Asociación Chilena de Empresas de Investigación de Mercado and an approach described in [12]; socioeconomic strata being defined as a combination of average annual income, education, vehicle ownership, and house services (e.g., fixed telephone). Due to the low number of individual trees per species found on the plots, we grouped tree species into five tree growth form types based on Lawrence et al.’s [16] classes: conifers, broadleaf-evergreen, broadleaf-deciduous, shrubs, and palms.

2.2. Plot Matching and Data Analysis

During 2014, plot locations were relocated using 2002 measured field reference data (e.g., Geographical Information System plot centroid coordinates, aerial photographs, plot center photos, and plot sketches). Once true plot center was identified using azimuth and distance to permanent reference object measurements (e.g., utility poles, manhole covers, building corners), we identified trees, palms, and shrubs originally measured in 2002. A tree, palm, or shrub is defined as a woody plant or palm with a diameter at breast height (DBH) of 2.5 cm or greater at 1.5 m above the ground surface. Plot data in 2002 recorded each tree’s distance and direction to the plot center. This same information was available in 2014 to locate and identify individuals that were measured in 2002. If species matched and DBH was similar to the 2002 measurement, or wherever diameter was indicated to have been originally measured in the case of forked or deformed stems; trees were re-measured. Missing trees that were originally measured in 2002, but were not located in 2014, were further investigated to determine if stumps were present to confirm mortality or removal. Trees in 2014 that were not present in 2002 were also recorded. See [16,28] for details on specific plot and tree matching approaches.
Urban forest structure changes were analyzed using tree mortality and ingrowth variables as previously done in studies from North America [16,28]. Specifically, we defined mortality as 2002 trees that could not be matched to 2014 trees. As such, mortality does not distinguish between tree removal due to maintenance or land clearing activities. Ingrowth was defined as the presence of a new tree in 2014, not measured in 2002 that could be the result of planting (i.e., existing trees that grew into the 2.5 DBH criteria), or natural regeneration. Average annual tree diameter growth (ΔDBH; cm·year−1) was estimated for matched trees by calculating the change in DBH divided by the total number of days between measurements and then annualized using 365 days per year [16]. Plot-level basal area change (ΔBA; m2·year−1) was also estimated using average annualized tree diameter growth for all trees on a plot [28].
We estimated individual tree biomass (kg) using aboveground allometric biomass equations from [19] and from the GlobAllomeTree database [31]. If species-specific equations were not available, we used equations from the same genus, family, or tree type (i.e., conifer and hardwoods) following [32] and [33]’s approaches. Plot-level biomass was obtained as the sum of individual tree biomass on a specific plot; temporal changes in biomass (ΔBiomass kg·year−1) were estimated by subtracting 2014 biomass from 2002 and dividing by the time since measurements. We did not include new biomass from 2002 due to ingrowth or biomass from 2014 lost to mortality. Plot-level basal area and biomass estimates were then converted to a per hectare basis for subsequent analyses.

2.3. Statistical Analysis

We tested for differences in DBH, BA, and biomass change at the species-level for both the five most frequent tree species as well as tree classification groups based on their form. We also analyzed differences in 2014 basal area and biomass and 2002 to 2014 ΔDBH, ΔBA, and ΔBiomass by comuna, socioeconomic strata, soil surface cover types, and land use classification. The 2014 biomass data was transformed using a logarithmic function for subsequent statistical analysis. We also analyzed for statistical differences in tree cover change as well as mortality and ingrowth according to socioeconomic strata, soil surface cover, and land use.
To test for statistical differences in mortality and ingrowth according to tree form, we used a five-sample test for equality of proportions without continuity correction using the R procedure prop.test [34] and alternative two-sided hypotheses. To better identify the plot-level surface cover factors, or correlates, that can possibly be driving the changes in structure, we determined the correlation between surface cover types and DBH, BA, and biomass (B). Specifically, we calculated Spearman correlation coefficients between 2002 to 2014 change in basal area and biomass with 2014 surface cover data using the cor procedure. Residuals were evaluated using Q-Q plots to assess their distribution and statistical differences were determined using Analyses of Variance with the aov function. This function was also used to test for differences in plot-level tree cover among strata while a paired t-test was used to determine city-wide tree cover differences during the analysis period.
Spatial correlations were determined using the Spatial Dependence: Weighting Schemes, Statistics and Model (spdep), and Data Analysis in Ecology (pgirmess) packages with the R correlog function. Finally, to better visually assess spatial patterns in BA and biomass we mapped urban tree biomass using spatial interpolation with an Inverse Distance Weighting (IDW) method using QGIS 2.10 and a distance coefficient of 0.05. Spatial autocorrelation was determined using Moran’s I with the correlog procedure in the pgirmess package. All analyses were done using R version 3.1.3 [34].

3. Results

Of the original 200 plots from 2002, only eight could not be re-measured due to lack of access and permission. Given Santiago’s semi-arid environment, high building density, and low tree cover; our overall sample size and number of matched trees (Table 2) was low compared to other urban forest ecosystem studies from the subtropics [16,28,33] and more humid temperate areas [7]. Table 2 below provides an overview of the basal area, ingrowth, and mortality in Santiago, Chile’s urban forest from 2002 to 2014.

3.1. Spatial Differences in Tree Biomass, Cover, and Basal Area

We found that 2014 tree biomass (kg·ha−1) was greater in the northeastern sections of the study area (Figure 2) and significant differences were found among socioeconomic strata (p < 0.01; Table 3). In general, wealthier comunas (i.e., the northeastern section of the study area) had greater tree biomass than lower income ones. We observed that city-wide plot-level tree cover was not significantly different (p = 0.45) during the analysis period, with a value of 18.2% (+/− 1.6%) in 2002 that dropped to 16.6% (+/− 1.6%) in 2014. Tree cover in the high socioeconomic stratum was significantly greater than the other two strata and increased during the period of analysis from 17.3% to 23.1%. Conversely, tree cover dropped from 16.8% to 13.1% in the medium strata, and from 20.1% to 12.8% in the low strata (Table 3). We also observed a high variability in ΔBA and ΔBiomass, but no significant differences were found across socioeconomic strata (p = 0.4, Table 3) or land uses (p = 0.71, Table 4). Overall, we found no statistically significant differences in both ΔBA and ΔBiomass, and we observed almost a static biomass accumulation and BA increases during the analyzed period (Table 4). Overall, biomass (p = 0.42) and BA (p = 0.37) were not significantly different across land uses (Table 4). However, commercial/industrial areas did present lower average biomass and BA values than other land use types.

3.2. Changes in DBH, BA, and Biomass According to Species and Tree Form

The five most frequent tree species represented approximately 25% of all our matched trees, and their overall growth rate by species ranged from 0.12 to 0.36 cm·year−1 (Table 5). These species also had an increase in biomass between 0.46 to 6.47 kg·year−1 during the analyzed period; with R. pseudoacacia having the highest growth rates and P. ceracifera the greatest biomass change (Table 5). Actual ΔDBH (p < 0.0001) and ΔBiomass (p = 0.03) during the analysis period were significantly different among the five most frequent tree species (Table 5).
Growth diameter rates (ΔDBH) were greater for conifers, while conifers and broadleaf deciduous trees exhibited the greatest change in biomass (Table 6). The large standard errors found for conifers and palms are likely due to a very small sample size, stem shrinkage or swelling, and the palm’s stem sheath and fronds that makes DBH re-measurements unreliable [4] (Table 6).

3.3. Surface Cover Correlates

We assessed the use of plot-level surface cover as an indicator for urban forest structural changes and found that both BA and biomass were poorly correlated with all measured surface covers (Table 7). Increases in building cover indicate lower BA and biomass, however, low building cover was not indicative of BA and Biomass. We only found that cement coverage was correlated to 2002 Basal Area (r = 0.43) and 2002 and 2014 Biomass (r = 0.41 and r = 0.36, respectively; Table 7).

3.4. Spatio-Temporal Changes and Patterns in Biomass and Basal Area

Similar to the previous statistical analyses, our spatial analyses also showed greater tree biomass towards the northeastern section of the city and a cluster of plots with greater biomass in the peri-urban, southwest comunas of the study area (Figure 2 and Figure 3). These same plots had greater basal area. Spatial interpolation by IDW of ΔBiomass also exhibited a similar pattern to the plot-level biomass distribution (Figure 2 and Figure 4). Plots and areas in the central, northwest, and southern sections of Santiago showed losses in both ΔBA and ΔBiomass (Figure 3). Figure 4 maps biomass change but should be interpreted carefully since the IDW spatial interpolation based on the plot influence distance for urban areas has high uncertainty, given the non-continuous heterogeneous character of cities. Similarly, we found some significantly high spatial autocorrelation according to Moran’s I statistic in plots that were less than 4 km in proximity relative to each other.

4. Discussion

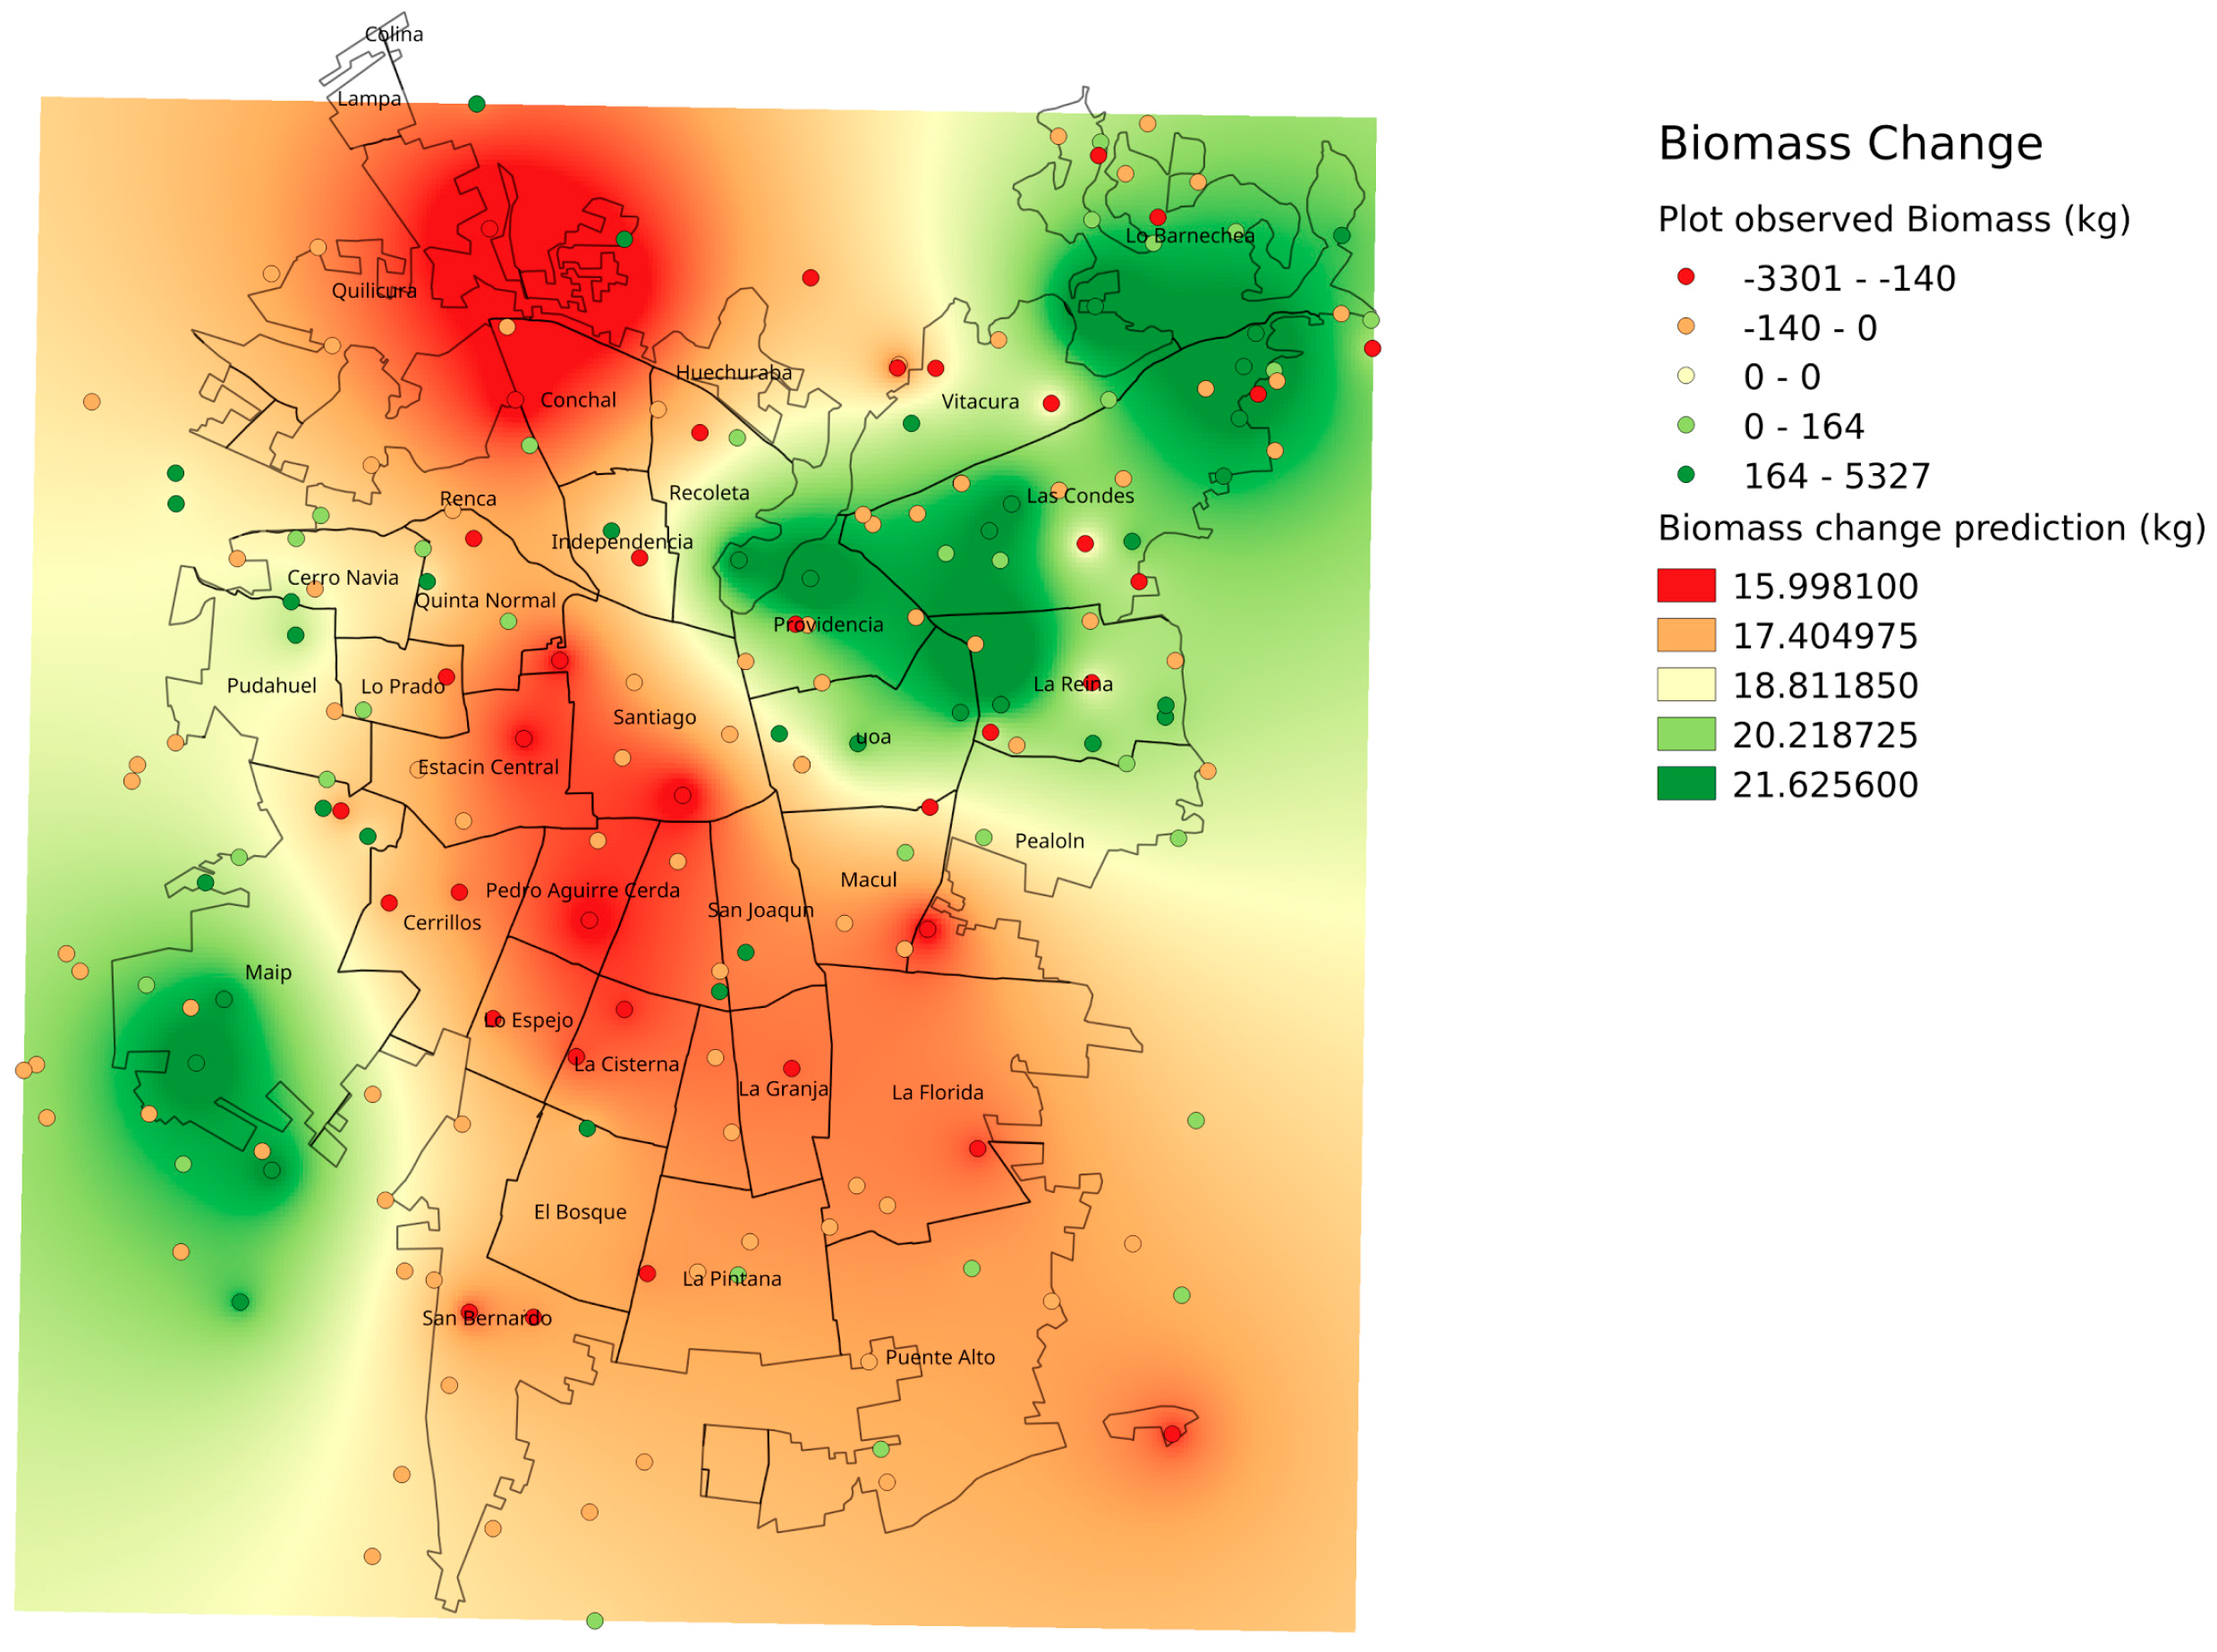
Although no clear evidence can be observed in the 2002 and 2014 Landsat imagery (Figure 1), the Santiago Metropolitan Area has undergone noticeable urbanization in the form of infill and land use changes since 2002 [30]. Rapid economic development and recent large-scale infrastructure projects such as new transportation rights of way and hubs, tunnels, and building-housing projects [35] has negatively affected the structure of Santiago’s urban forest. These changes have occurred for most of the city with the exception of the most affluent areas, the northeast and few areas in the oldest sections of the city center [35]. Santiago’s semi-arid climate and relative drought related water scarcity explains its low tree cover; however, even small changes can have noticeable effects in terms of the urban forest structure and subsequent functions and services. The tree scarcity in semi-arid Santiago resulted in different patterns than previous studies that used similar field sampling approaches from wet and humid urban forests in temperate and subtropical North America (e.g., Syracuse, USA [7]; Gainesville, USA [16]; Orlando, USA [33] and San Juan, Puerto Rico [28]); making this study unique.
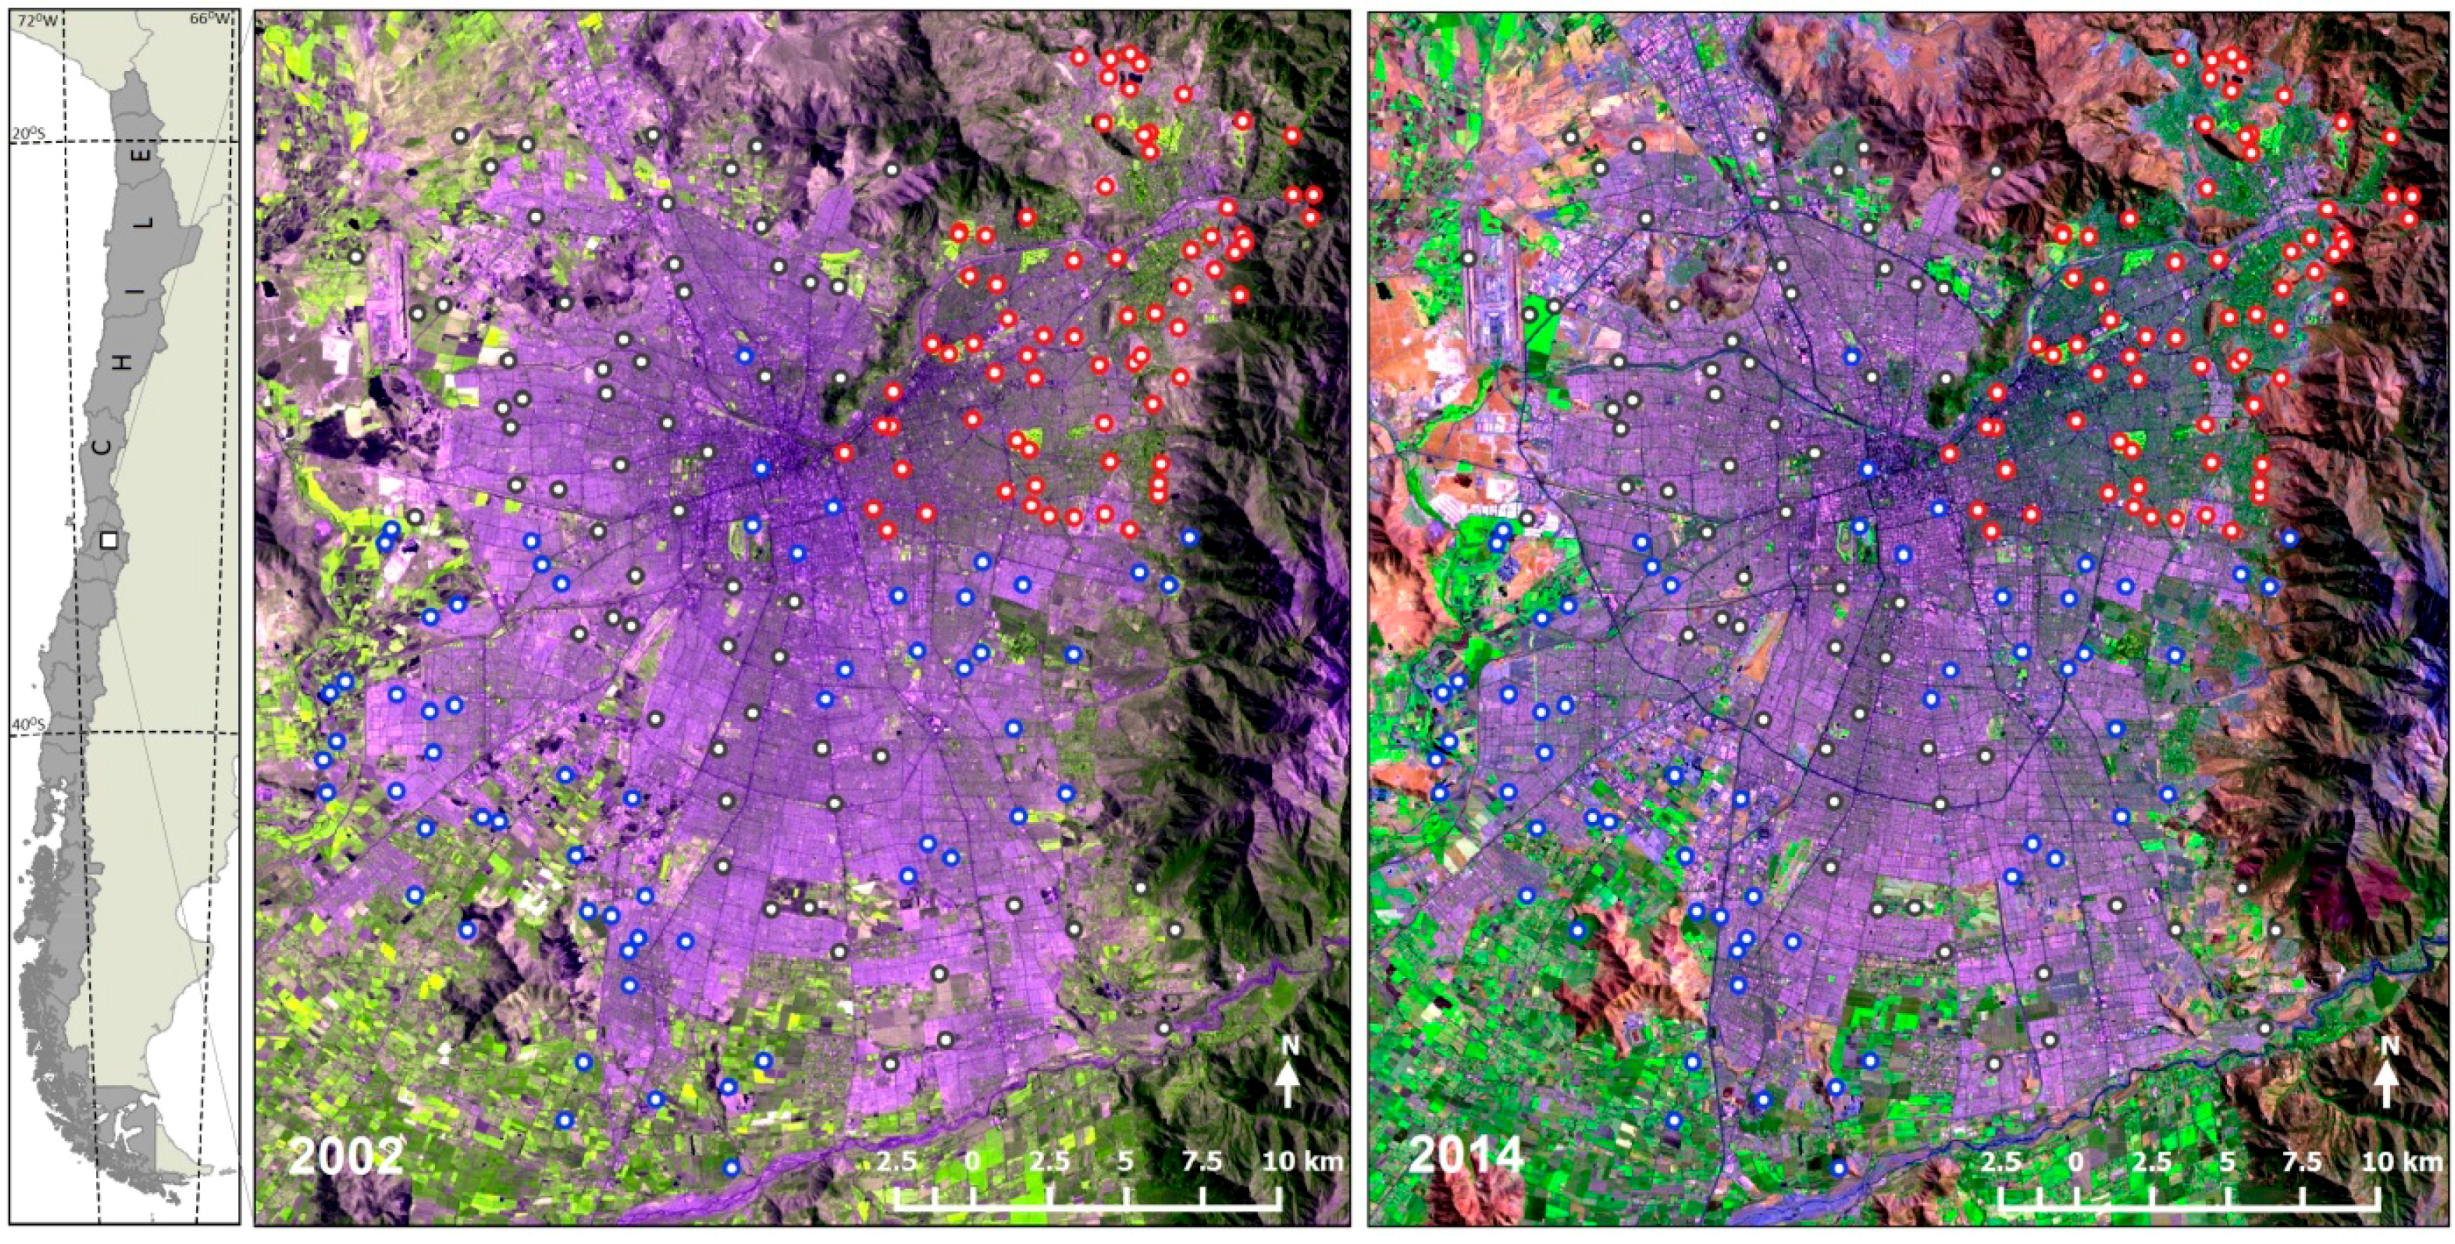
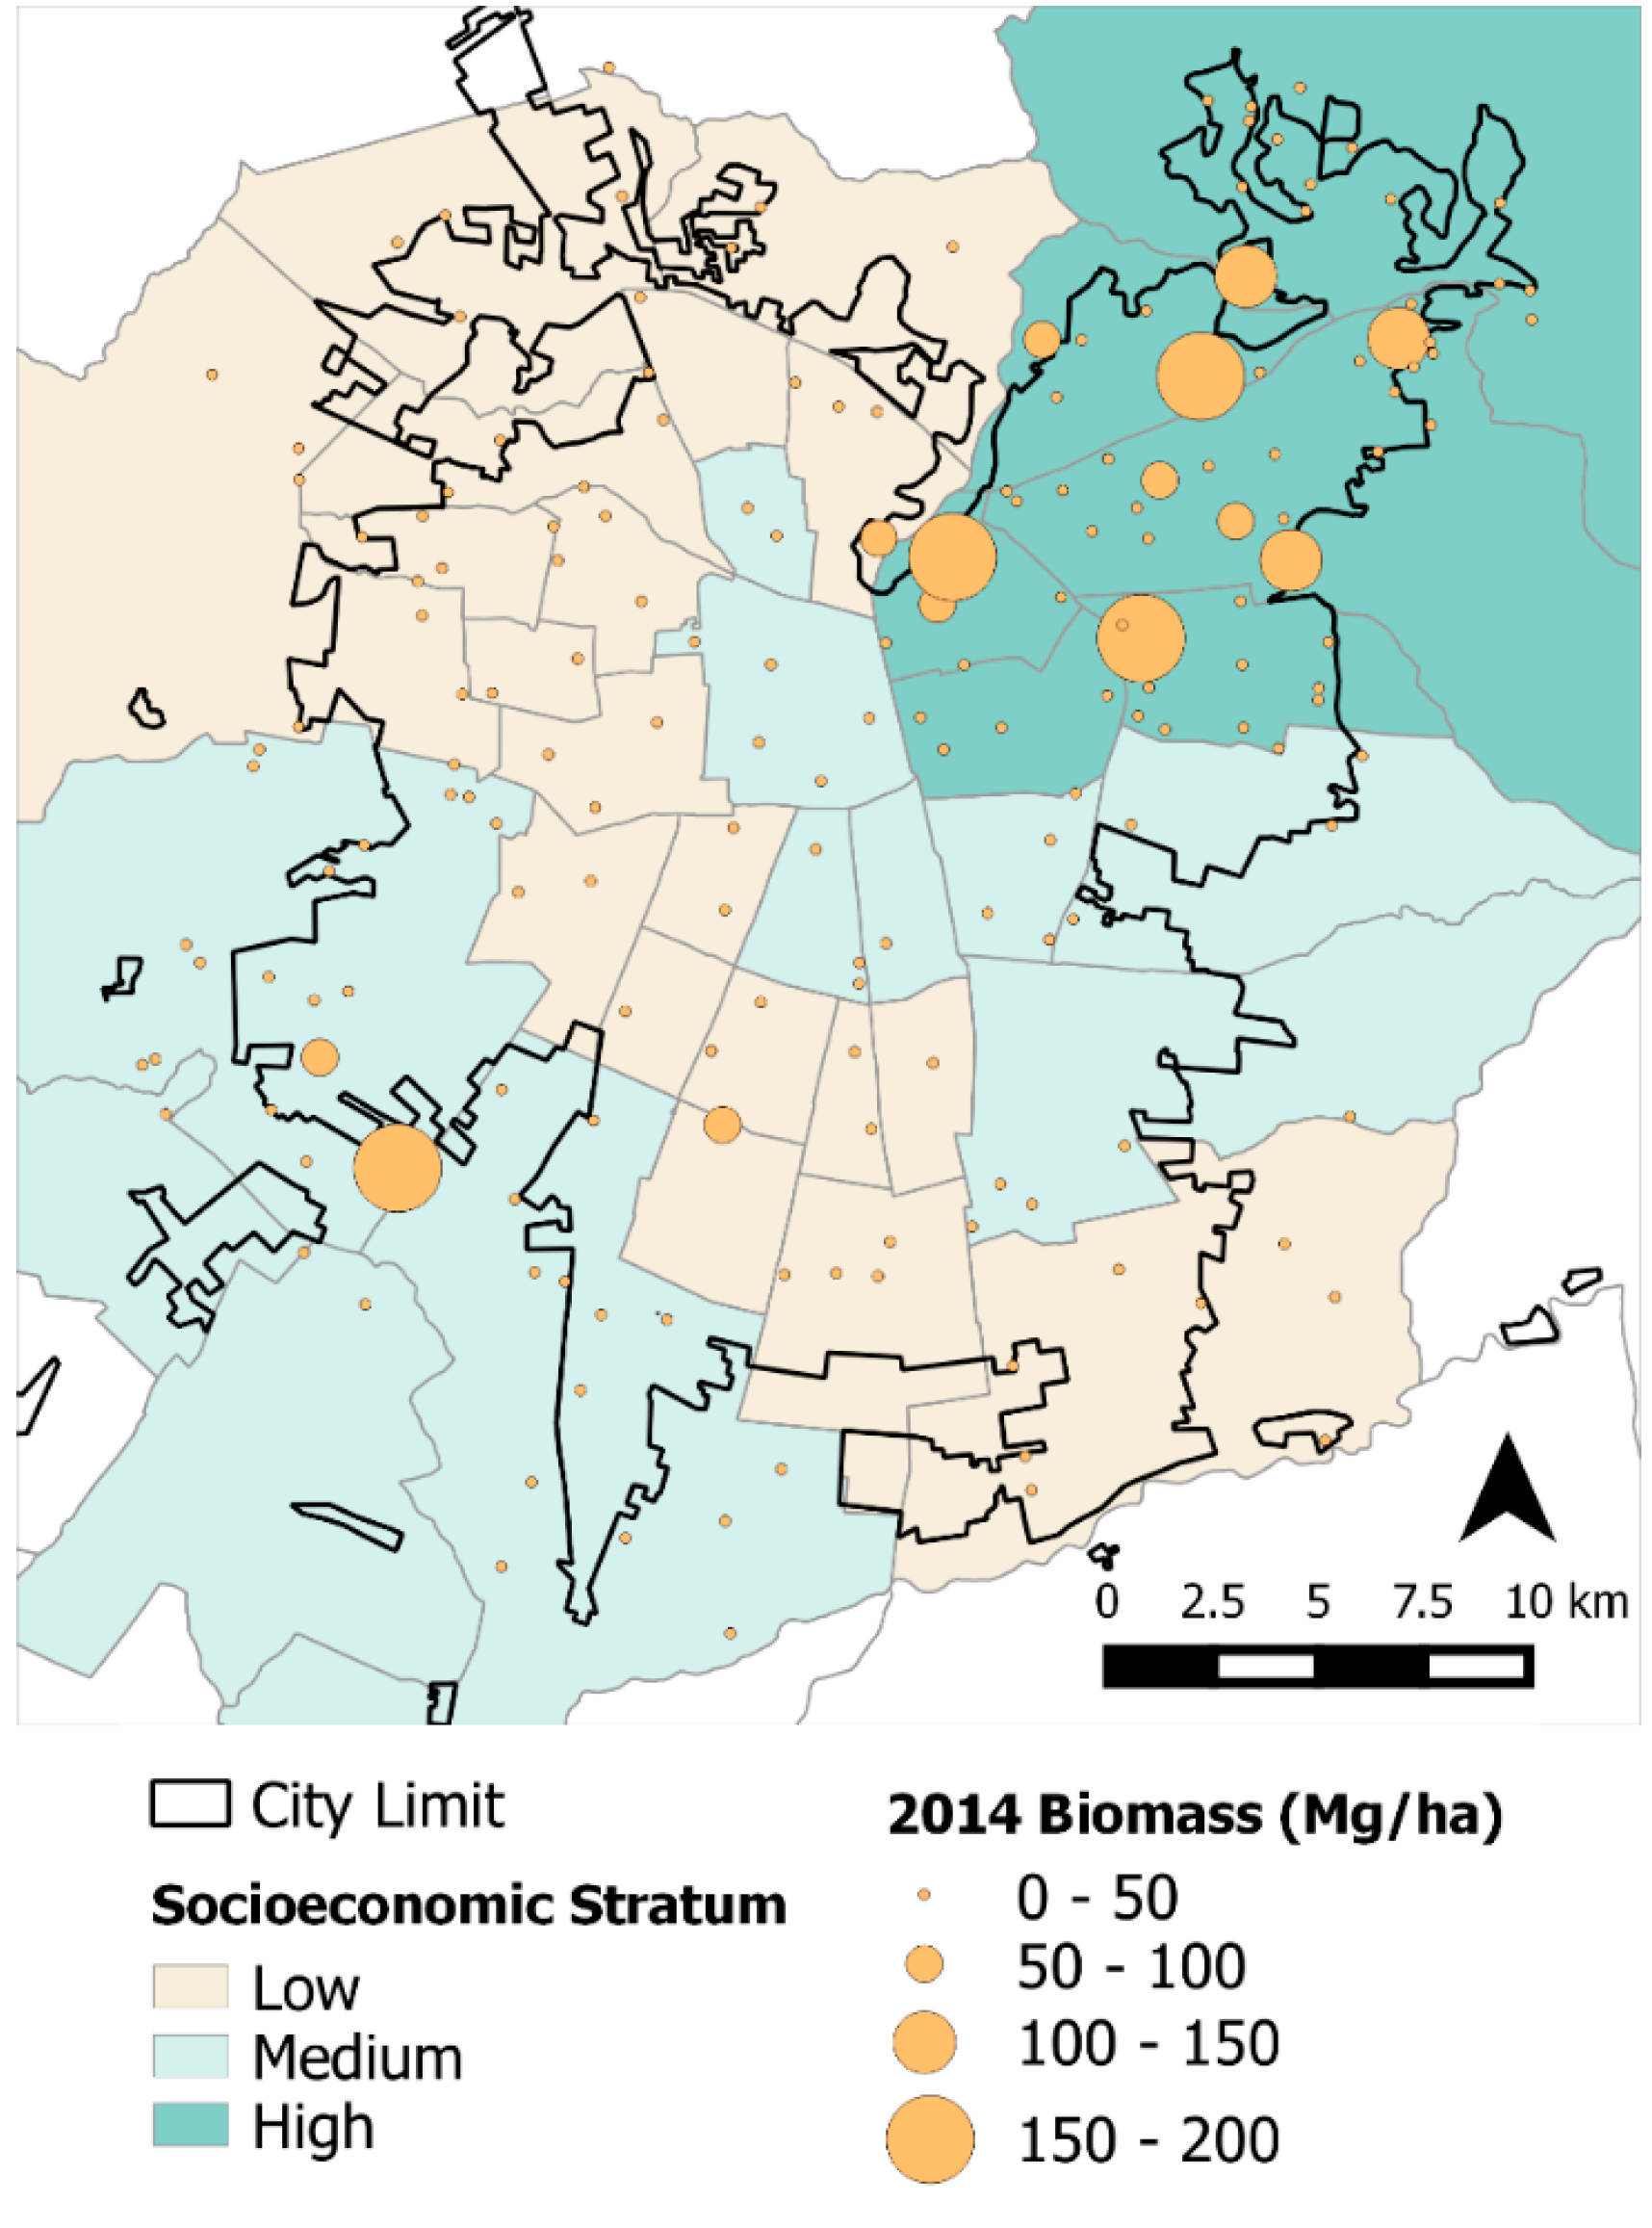
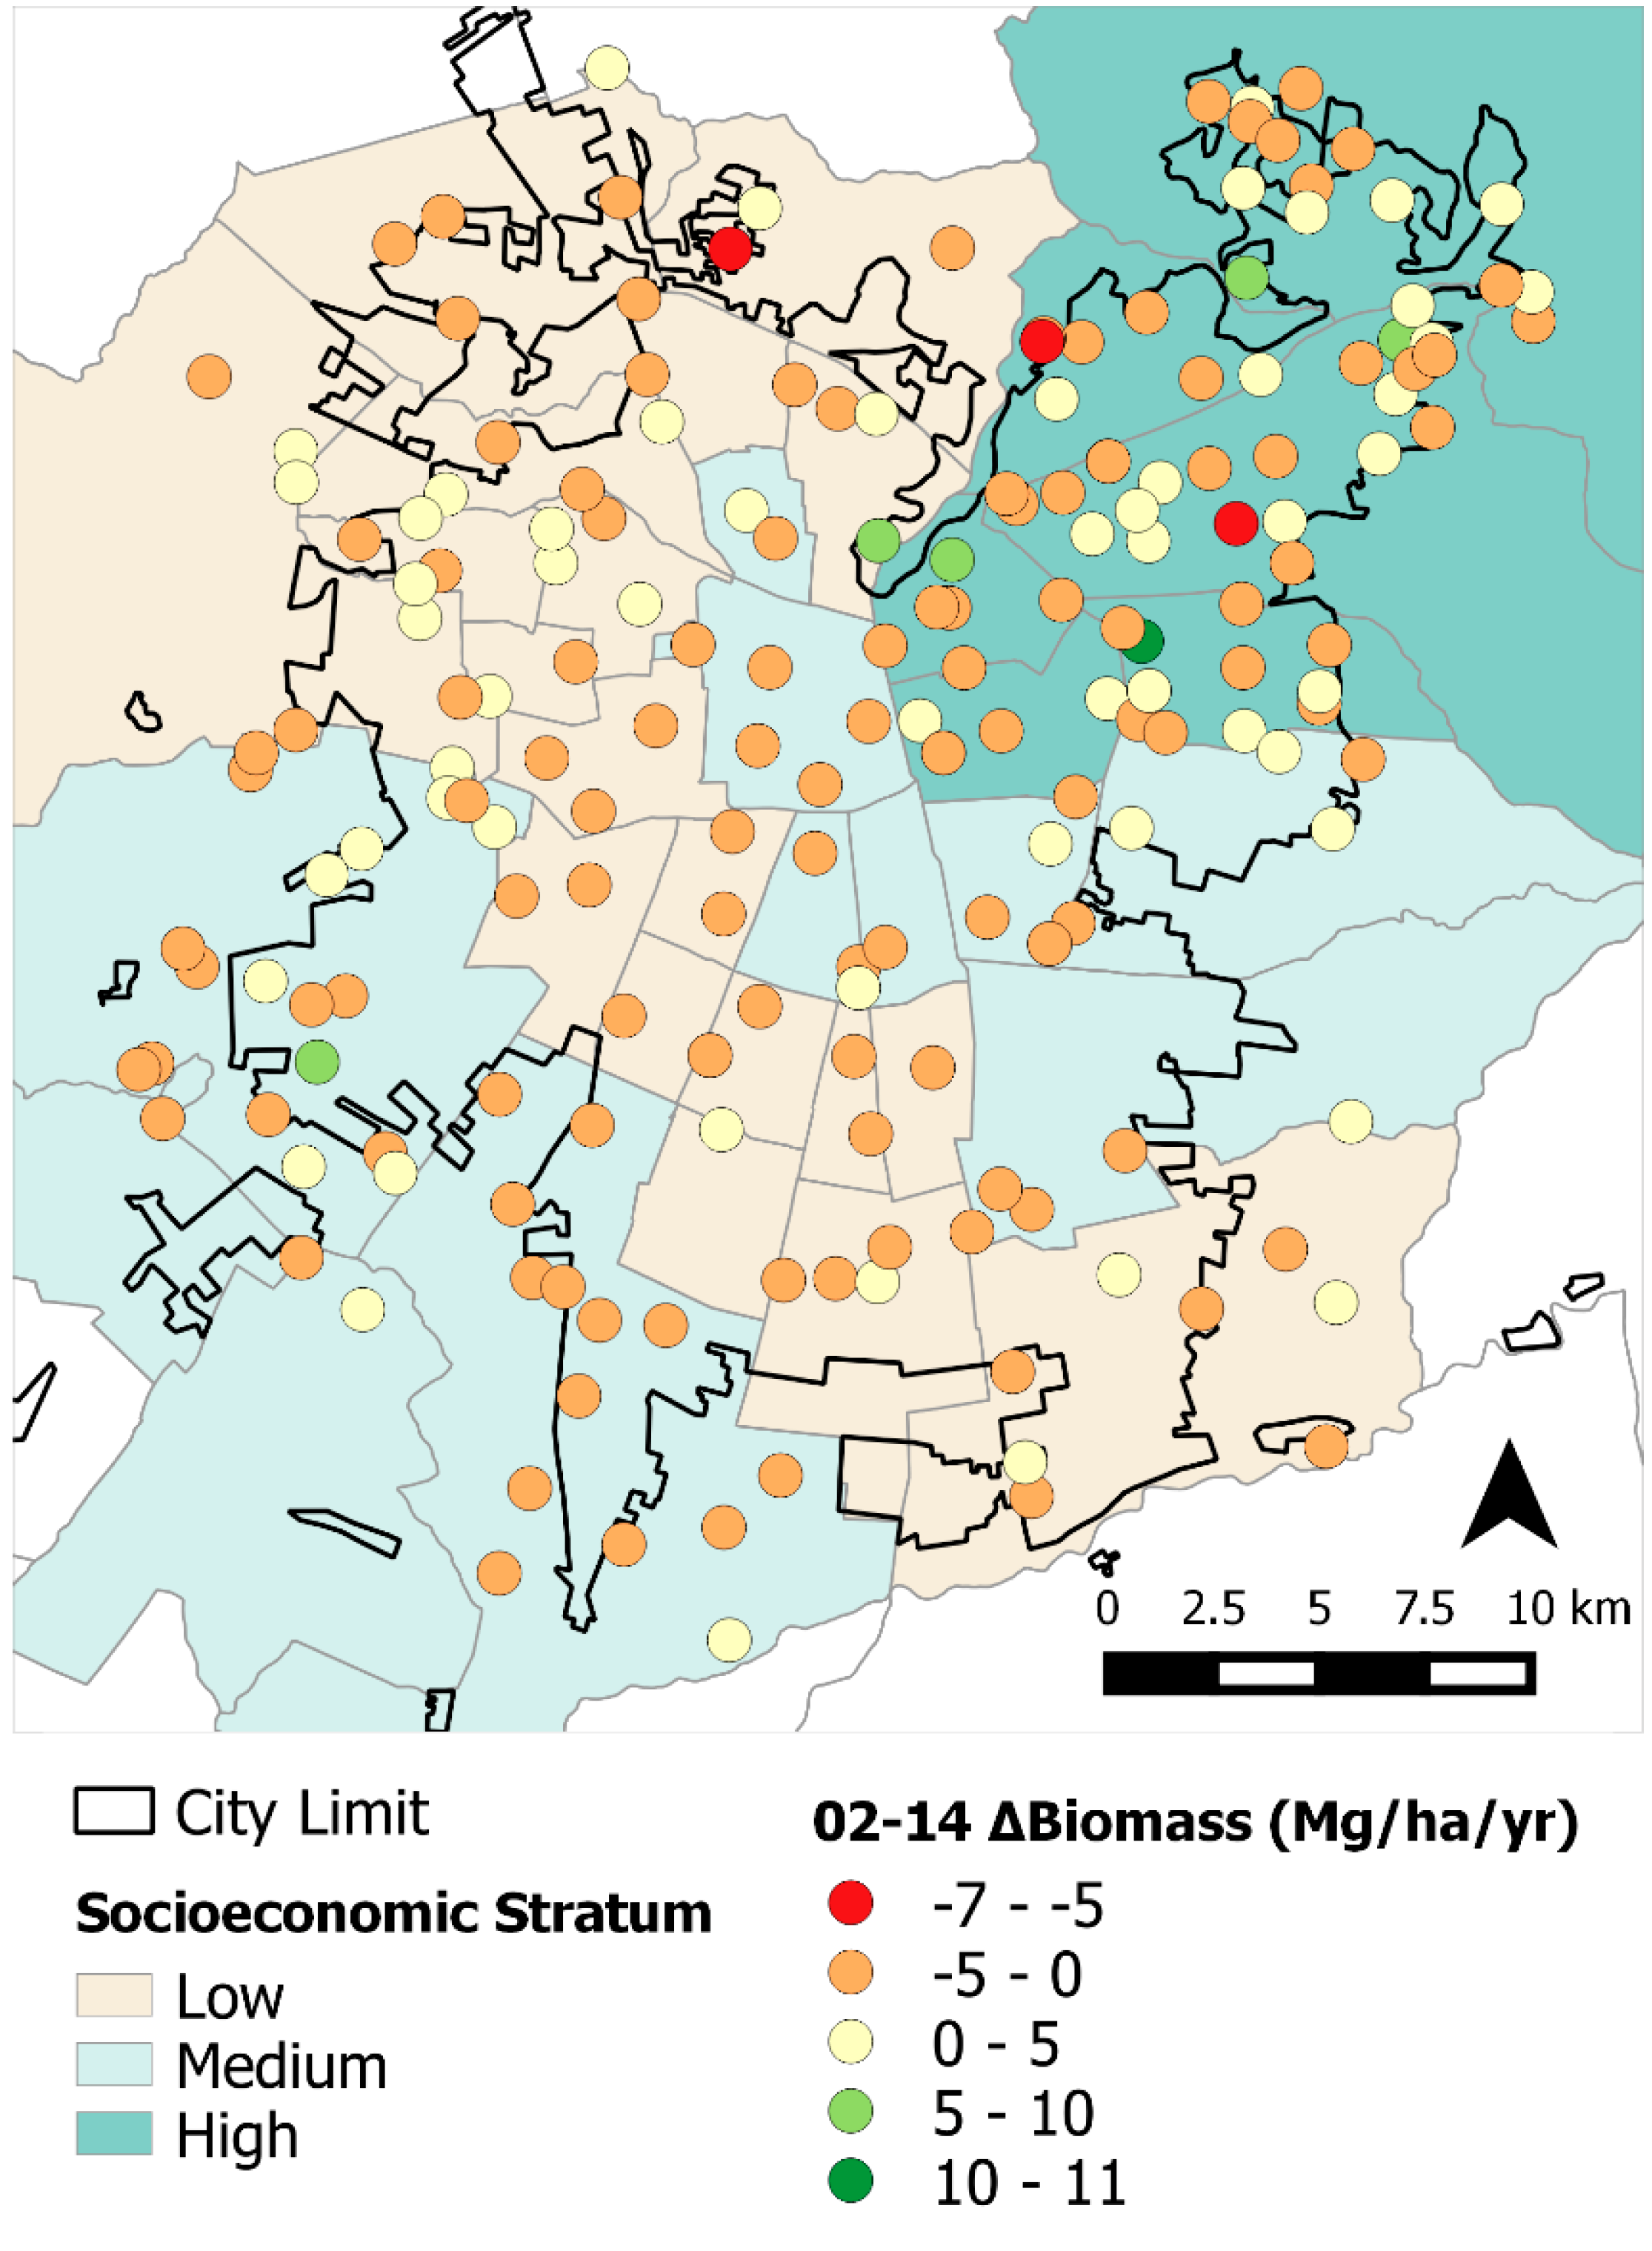
These socio-ecological and urbanization effects were observed in the results from both our statistical and spatial analyses. This is particularly evident from the differences in tree cover, losses in biomass throughout the study area, and BA changes among socioeconomic strata (Table 3). More affluent comunas are mostly located in the northeastern section of the city and, because of greater resources, have more tree cover, larger trees (i.e., greater BA), more abundant trees, and therefore, greater ΔBiomass (0.29 Mg·ha−1·year−1) [6,15,36]. Conversely, plots on the medium and lower socioeconomic strata had losses in overall tree cover and negative ΔBiomass. These plots generally correspond to areas with higher building densities and comunas with lesser economic resources ([12]; 
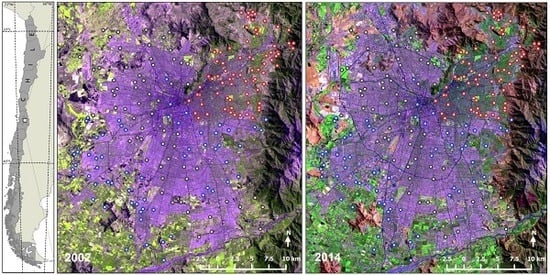
Figure 4). Spatially, plots in the northeastern section of the city had greater tree biomass; however, in the far southwest section of study area we also found high biomass areas corresponding to agricultural land from the peri-urban section (Figure 2). Rainfall gradients across the study areas could also be playing a role in structural differences as upper elevation plots in the Andean piedmont receive more rain, but management and maintenance regimes (i.e., irrigation and fertilization) could be masking the effects of precipitation on tree growth and mortality.
Poor correlations between surface cover and BA and biomass might be a result of having small sample sizes and a number of plots with both high cement cover and high biomass and others with high grass cover and low biomass. High cement cover and high biomass are typical of large street trees near building areas. Using the sum of the different vegetation cover (horizontal) and height (vertical) estimates might increase the correlations, as observed by [33]. We noted that cover types are regularly used as indicators of urbanization, planting space, and urban forest structure and function [7,16], but given our semi-arid and high building densities, this might have resulted in different patterns.
We acknowledge that our sample size, in terms of plot density and tree numbers, was low relative to similar urban forest studies using fixed area plots [7,16,28,33]. Factors—not analyzed in this study—such as climate change and socio-ecological dynamics—could have also driven these changes. Additionally, our use of forest grown allometric equations on urban trees can often lead to errors of up to 40% in biomass estimates [5]. Similarly, the sample size for conifers and palms was very low, seasonal stem shrinkage and swelling is likely [4,16], and this was also confounded by the difficulties in measuring palms using measurement techniques developed for single stem temperate trees [4,16,28]. However, we note that all these cited studies had the same limitations. Indeed, given the context of our study area’s: size, socio-political dynamics, and limited infrastructure that characterizes cities from developing countries, we feel that our results do provide a better understanding of urban forests outside the frequently studied areas of the United States and Canada, giving more insights to understudied areas such as Latin America [1,13,32], Mediterranean climates [12,28,32], and Australia [3,15].
When comparing urban forest structure results such as annual mortality to other studies using inventory data, we can distinguish the effect of climate and management. Mortality of urban trees was apparently more related to management than to climate; Santiago showed much lower mortality rates (3.0%) than subtropical San Juan, Puerto Rico [28], with values between 30%–40%. Conversely a subtropical city in the United States, Gainesville [16] had an average mortality rate between 10%–19%. Looking at growth rates, climate appears to be a stronger driver than management; values for subtropical cities of San Juan and Gainesville are closer to each other (0.7–1.0 cm·year−1), while Santiago had lower average values between 0.1 to 0.4 cm·year−1. In terms of the temporal changes to urban forest structure, there are no similarities to relevant studies [7,28].
Studies that use permanent random plots often report number of trees per unit area—as opposed to basal area—as a measure of tree density [7]; however, multi-stemmed trees with a shrub form or secondary tropical forests and mangroves can confound comparisons, thus our preference for basal area. Values for tree density can vary from 222–328 trees per ha in San Juan in 2001 and 2010, respectively [28]. While there is an average of 34 trees per ha in a temperate city such as Syracuse, US [7], in Santiago, a Mediterranean shrubland biome, this value reached 64 trees per ha [12]. Meanwhile, there was an overall annual net loss of approximately four trees per ha in subtropical Gainesville [16]. Tucker-Lima et al. report a basal area of 4.6 m2·ha−1 in San Juan, which is very similar to our 2014 estimate of 4.8 m2·ha−1. Changes in basal area in Santiago of 0.1 m2·ha−1 were, however, much lower than in San Juan (1.0 m2·ha−1) [28].
The growing body of literature using similar sized, long-term monitoring plots as utilized in this study can be used to compare trends for urban forests across different regions of the globe [5,6,16,28,33,36]. The characteristics of urban forest growth, mortality, and the effects of site characteristic such as irrigation, and ecological disturbance on these, could be analyzed against field measured plot and site correlates [5,16,20,21]. However, the presence of palms, multi-stemmed tall shrubs, and size criteria for tree-shrub differentiation across different biomes can confound some of these comparisons. Care is also warranted when comparing shrubland dominated biomes such as Santiago, to dense subtropical secondary and mangrove forests or temperate forests. Similarly, because of the difficulty in sampling large, heterogeneous, urbanized areas, sampling intensities can be low and result in larger uncertainties. This is particularly true in Santiago’s densely built, semi-arid, urban context, which also resulted in a reduced sample of measured and matched trees.
Our study provides one of the few comparative insights into how a South American and Mediterranean urban forest changes across space and time. Future research could analyze spatio-temporal changes in urban forest composition and its subsequent effects such as the spatial dynamics of ecosystem service provision and disservice hotspots [11,13,21,22,24,25,26]. Plot level structure-function information could also be used to test land management and planning scenario effects on the demand and supply of services [4,7,14,33]. Quantitative analyses could also determine the socio-ecological causal factors behind, and the drivers related to, changes in urban forests, their processes, and services [1,3,6,23,36]. More basic research could use these monitoring sites for better understanding floral diversity and the occurrence of invasives and understory dynamics in urbanized forests, as well as for developing allometric equations [36,37,38,39]. Permanent plots could also facilitate dendrochronological analysis of different tree species and their growth and mortality as affected by climate change, pollution, maintenance practices, and community preferences.

5. Conclusions

Overall, we found that urban forest mortality, ingrowth, and tree cover in the greater Santiago area remained stable during 2002 to 2014. We also noticed slight losses in basal area and biomass change across the study area. However, there were some noticeable trends during the analysis period in that tree cover increased and was greater in the highest socioeconomic stratum; however, it decreased in the medium and low strata. Similarly, the less affluent central, northwest, and southern plots, in particular, exhibited losses in BA and biomass from 2002 to 2014.
As previously mentioned, other studies have used plot-level data to analyze changes in an urban forest but, to our knowledge, most of these studies are from North America. Here, we describe for the first time the spatio-temporal dynamics of a South American urban forest in a Mediterranean climate. Overall, we found that these urban forests follow similar trends as in other parts of the world. For example, affluent areas tend to have more and better condition urban forests than poorer areas. Thus, barring substantial ecological disturbance (e.g., storms, drought, pests, or urbanization), changes in urban forest structure will primarily depend on human management (e.g., maintenance and irrigation) and biophysical factors (i.e., growing space and climate). Findings could also be used to identify which tree species perform better in terms of growth and basal area. Accordingly, this information could be used to identify tree functional traits that are most associated with ecosystem service provision (e.g., carbon offsets) and disservice minimization (e.g., allergenic tree locations).
However, Latin America and the rest of the developing world are generally characterized by unplanned land uses and marked socioeconomic inequities. Thus, studies such as ours can be used for targeting specific sites for improved management and setting monitoring and evaluation standards for municipalities. Conversely, areas that are maintaining their urban forest and standards—despite limited budgets—could also be identified. Most importantly, issues of environmental justice and resilience to the effects of climate and socio-political changes could be better addressed with this long-term data. Indeed, the growing body of literature calls for the development of an available global urban forest monitoring database that could be used for research by the global scientific community.

Acknowledgments

We would thank the Chilean Fondo Nacional de Desarrollo Científico y Tecnológico (FONDECYT 1140319) project “Vegetation Knowledge-based Indicators for Urban Sustainable Planning “for funding this study. Research was also partly funded by FONDECYT 3150352 “Provision of urban ecosystem services, exploring the effects of planning, urbanization, climate and environmental conditions on the urban forest of Santiago and La Serena”. We are also very grateful to the three reviewers whose suggestions greatly improved this manuscript.

Author Contributions

All authors contributed equally to this work.

Conflicts of Interest

The authors declare no conflict of interest.

References

  1. Aronson, M.F.J.; La Sorte, F.A.; Nilon, C.H.; Katti, M.; Goddard, M.A.; Lepczyk, C.A.; Warren, P.S.; Williams, N.S.G.; Cilliers, S.; Clarkson, B.; et al. A global analysis of the impacts of urbanization on bird and plant diversity reveals key anthropogenic drivers. Proc. R. Soc. Lond. B Biol. Sci. 2014, 281. [Google Scholar] [CrossRef] [PubMed]
  2. Avolio, M.; Pataki, D.E.; Gillespie, T.; Jenerette, G.D.; McCarthy, H.R.; Pincetl, S.; Weller-Clarke, L. Tree diversity in southern california’s urban forest: The interacting roles of social and environmental variables. Front. Ecol. Evol. 2015, 3. [Google Scholar] [CrossRef]
  3. Kendal, D.; Williams, N.S.G.; Williams, K.J.H. Drivers of diversity and tree cover in gardens, parks and streetscapes in an Australian city. Urban For. Urban Green. 2012, 11, 257–265. [Google Scholar] [CrossRef]
  4. Brandeis, T.J.; Escobedo, F.J.; Staudhammer, C.L.; Nowak, D.J.; Zipperer, W. San Juan Bay Estuary Watershed Urban Forest Inventory; USDA-Forest Service, Southern Research Station: Asheville, NC, USA, 2014; p. 44.
  5. Timilsina, N.; Staudhammer, C.L.; Escobedo, F.J.; Lawrence, A. Tree biomass, wood waste yield, and carbon storage changes in an urban forest. Landsc. Urban Plan. 2014, 127, 18–27. [Google Scholar] [CrossRef]
  6. Zhao, M.; Escobedo, F.J.; Staudhammer, C. Spatial patterns of a subtropical, coastal urban forest: Implications for land tenure, hurricanes, and invasives. Urban For. Urban Green. 2010, 9, 205–214. [Google Scholar] [CrossRef]
  7. Nowak, D.J.; Hoehn, R.E.; Bodine, A.R.; Greenfield, E.J.; O’Neil-Dunne, J. Urban forest structure, ecosystem services and change in Syracuse, NY. Urban Ecosyst. 2013, 1–23. [Google Scholar] [CrossRef]
  8. Staudhammer, C.L.; Escobedo, F.J.; Lawrence, A.B.; Duryea, M.; Smith, P.; Merritt, M. Rapid assessment of change and hurricane impacts to houston’s urban forest structure. Arboricult. Urban For. 2011, 37, 60. [Google Scholar]
  9. Manes, F.; Marando, F.; Capotorti, G.; Blasi, C.; Salvatori, E.; Fusaro, L.; Ciancarella, L.; Mircea, M.; Marchetti, M.; Chirici, G.; et al. Regulating ecosystem services of forests in ten Italian metropolitan cities: Air quality improvement by PM10 and O3 removal. Ecol. Indic. 2016, 67, 425–440. [Google Scholar] [CrossRef]
  10. Roman, L.A.; Battles, J.; McBride, J.R. Urban Tree Mortality: A Primer on Demographic Approaches; US Department of Agriculture, Forest Service, Northern Research Station: Newtown Square, PA, USA, 2016; p. 24. [Google Scholar]
  11. Cariñanos, P.; Casares-Porcel, M.; Quesada-Rubio, J.M. Estimating the allergenic potential of urban green spaces: A case-study in Granada, Spain. Landsc. Urban Plan. 2014, 123, 134–144. [Google Scholar] [CrossRef]
  12. Escobedo, F.J.; Nowak, D.J.; Wagner, J.E.; De la Maza, C.L.; Rodríguez, M.; Crane, D.E.; Hernández, J. The socioeconomics and management of Santiago de Chile’s public urban forests. Urban For. Urban Green. 2006, 4, 105–114. [Google Scholar] [CrossRef]
  13. Dobbs, C.; Kendal, D.; Nitschke, C.R. Multiple ecosystem services and disservices of the urban forest establishing their connections with landscape structure and sociodemographics. Ecol. Indic. 2014, 43, 44–55. [Google Scholar] [CrossRef]
  14. Escobedo, F.J.; Kroeger, T.; Wagner, J.E. Urban forests and pollution mitigation: Analyzing ecosystem services and disservices. Environ. Pollut. 2011, 159, 2078–2087. [Google Scholar] [CrossRef] [PubMed]
  15. Dobbs, C.; Kendal, D.; Nitschke, C. The effects of land tenure and land use on the urban forest structure and composition of Melbourne. Urban For. Urban Green. 2013, 12, 417–425. [Google Scholar] [CrossRef]
  16. Lawrence, A.B.; Escobedo, F.J.; Staudhammer, C.L.; Zipperer, W. Analyzing growth and mortality in a subtropical urban forest ecosystem. Landsc. Urban Plan. 2012, 104, 85–94. [Google Scholar] [CrossRef]
  17. Escobedo, F.; Varela, S.; Zhao, M.; Wagner, J.E.; Zipperer, W. Analyzing the efficacy of subtropical urban forests in offsetting carbon emissions from cities. Environ. Sci. Policy 2010, 13, 362–372. [Google Scholar] [CrossRef]
  18. Peper, P.J.; McPherson, E.G.; Mori, S.M. Equations for predicting diameter, height, crown width, and leaf area of San Joaquin Valley street trees. J. Arboricult. 2001, 27, 306–317. [Google Scholar]
  19. Dobbs, C.; Hernández, J.; Escobedo, F. Above ground biomass and leaf area models based on a non destructive method for urban trees of two communes in central Chile. Bosque (Valdivia) 2011, 32, 287–296. [Google Scholar] [CrossRef]
  20. Semenzato, P.; Cattaneo, D.; Dainese, M. Growth prediction for five tree species in an italian urban forest. Urban For. Urban Green. 2011, 10, 169–176. [Google Scholar] [CrossRef]
  21. Rahman, M.A.; Armson, D.; Ennos, A.R. A comparison of the growth and cooling effectiveness of five commonly planted urban tree species. Urban Ecosyst. 2014, 18, 371–389. [Google Scholar] [CrossRef]
  22. Xie, Q.; Zhou, Z.; Chen, F. Quantifying the beneficial effect of different plant species on air quality improvement. Environ. Eng. Manag. J. 2011, 10, 959–963. [Google Scholar]
  23. Haase, D.; Larondelle, N.; Andersson, E.; Artmann, M.; Borgström, S.; Breuste, J.; Gomez-Baggethun, E.; Gren, Å.; Hamstead, Z.; Hansen, R.; et al. A quantitative review of urban ecosystem service assessments: Concepts, models, and implementation. AMBIO 2014, 43, 413–433. [Google Scholar] [CrossRef] [PubMed]
  24. Strohbach, M.W.; Haase, D. Above-ground carbon storage by urban trees in leipzig, germany: Analysis of patterns in a European city. Landsc. Urban Plan. 2012, 104, 95–104. [Google Scholar] [CrossRef]
  25. Gong, C.; Yu, S.; Joesting, H.; Chen, J. Determining socioeconomic drivers of urban forest fragmentation with historical remote sensing images. Landsc. Urban Plan. 2013, 117, 57–65. [Google Scholar] [CrossRef]
  26. Sperandelli, D.; Dupas, F.; Dias Pons, N. Dynamics of urban sprawl, vacant land, and green spaces on the metropolitan fringe of São Paulo, Brazil. J. Urban Plan. Dev. 2013, 139, 274–279. [Google Scholar] [CrossRef]
  27. Cilliers, S.; Cilliers, J.; Lubbe, R.; Siebert, S. Ecosystem services of urban green spaces in African countries—Perspectives and challenges. Urban Ecosyst. 2012, 16, 681–702. [Google Scholar] [CrossRef]
  28. Lima, J.M.T.; Staudhammer, C.L.; Brandeis, T.J.; Escobedo, F.J.; Zipperer, W. Temporal dynamics of a subtropical urban forest in San Juan, Puerto Rico, 2001–2010. Landsc. Urban Plan. 2013, 120, 96–106. [Google Scholar] [CrossRef]
  29. Peel, M.C.; Finlayson, B.L.; McMahon, T.A. Updated world map of the Köppen-Geiger climate classification. Hydrol. Earth Syst. Sci. 2007, 11, 1633–1644. [Google Scholar] [CrossRef]
  30. Romero, H.; Vásquez, A.; Fuentes, C.; Salgado, M.; Schmidt, A.; Banzhaf, E. Assessing urban environmental segregation (UES). The case of Santiago de Chile. Ecol. Indic. 2012, 23, 76–87. [Google Scholar] [CrossRef]
  31. Henry, M.; Bombelli, A.; Trotta, C.; Alessandrini, A.; Birigazzi, L.; Sola, G.; Vieilledent, G.; Santenoise, P.; Longuetaud, F.; Valentini, R.; Picard, N. GlobAllomeTree: International platform for tree allometric equations to support volume, biomass and carbon assessment. iFor. Biogeosci. For. 2013, 6, 326. [Google Scholar] [CrossRef] [Green Version]
  32. Escobedo, F.J.; Clerici, N.; Staudhammer, C.L.; Corzo, G.T. Socio-ecological dynamics and inequality in Bogotá, Colombia’s public urban forests and their ecosystem services. Urban For. Urban Green. 2015, 14, 1040–1053. [Google Scholar] [CrossRef]
  33. Horn, J.; Escobedo, F.J.; Hinkle, R.; Hostetler, M.; Timilsina, N. The role of composition, invasives, and maintenance emissions on urban forest carbon stocks. Environ. Manag. 2014, 55, 431–442. [Google Scholar] [CrossRef] [PubMed]
  34. R Core Team. R: A Language and Environment for Statistical Computing; R Foundation for Statistical Computing: Vienna, Austria, 2008. [Google Scholar]
  35. Figueroa, O.; Rodriguez, C. Urban Transport, Urban Expansion and Institutions and Governance in Santiago, Chile. Available online: http://unhabitat.org/wp-content/uploads/2013/06/GRHS.2013.Case_.Study_.Santiago.Chile_.pdf (accessed on 20 May 2016).
  36. Staudhammer, C.L.; Escobedo, F.J.; Holt, N.; Young, L.J.; Brandeis, T.J.; Zipperer, W. Predictors, spatial distribution, and occurrence of woody invasive plants in subtropical Urban Ecosyst. J. Environ. Manag. 2015, 155, 97–105. [Google Scholar] [CrossRef] [PubMed]
  37. Loeb, R.E. Arboricultural introductions and long-term changes for invasive woody plants in remnant urban forests. Forests 2012, 3, 745. [Google Scholar] [CrossRef]
  38. Pretzsch, H.; Biber, P.; Uhl, E.; Dahlhausen, J.; Rötzer, T.; Caldentey, J.; Koike, T.; van Con, T.; Chavanne, A.; Seifert, T.; et al. Crown size and growing space requirement of common tree species in urban centres, parks, and forests. Urban For. Urban Green. 2015, 14, 466–479. [Google Scholar] [CrossRef]
  39. He, R.; Yang, J.; Song, X. Quantifying the impact of different ways to delimit study areas on the assessment of species diversity of an urban forest. Forests 2016, 7, 42. [Google Scholar] [CrossRef]
Figure 1. Plot locations within the Santiago de Chile study area in 2002 (left) and 2014 (right). Plots located on high, medium, and low socioeconomic strata are represented in red, gray, and blue circles, respectively. Vegetated land covers are green in color, bare soil areas are in pink, while orange and brown depict sparsely vegetated areas. High to low urban density areas are dark to light magenta, respectively, and dark magenta, linear features are major transportation rights of way. Linear light magenta areas in the southeast and far east in the Andean foothills are a river flood plain and barren rock, respectively. Note: images are from Landsat-7 RGB 742 taken on February 2002 and January 2014.
Forests 07 00121 g001
Figure 2. Aboveground tree biomass distribution in Santiago, Chile in 2014. Larger sized circles represent plots with higher biomass estimates.
Forests 07 00121 g002
Figure 3. Plot-level urban tree biomass change in Santiago, Chile from 2002 to 2014 based on 192 re-measured plots.
Forests 07 00121 g003
Figure 4. Urban tree biomass change prediction map for Santiago, Chile using Inverse Distance Weighting interpolation using the 192 re-measured plots.
Forests 07 00121 g004
Table 1. 2002 land use/cover classes analyzed in Santiago, Chile.
Land Use ClassesLand Use/Land CoversNumber of Plots
ResidentialLow to high density residential, multi-family, mixed residential86
Commercial/IndustrialCommercial shopping areas, industrial areas, public buildings, airports, athletic stadiums26
Green AreasVacant areas, shrub lands, plazas, parks, cemeteries, golf courses, athletic fields36
AgricultureAgricultural areas38
TransportationHighways, major transportation rights-of-way6
Table 2. Basal area and average annual urban forest percent mortality and ingrowth for different tree forms in Santiago, Chile during 2002 to 2014.
Tree FormsRe-Measured TreesTotal Basal Area (m2·ha−1) % Mortality (SE)% Ingrowth (SE)
Broadleaf-Deciduous4762.292.99 (0.18)2.94 (0.18)
Broadleaf-Evergreen2100.762.98 (0.27)3.13 (0.27)
Conifer430.653.29 (0.64)2.71 (0.59)
Palm200.592.92 (0.88)3.33 (0.91)
Shrub860.143.1 (0.43)2.81 (0.42)
Note: SE is Standard error.
Table 3. Mean aboveground tree biomass in 2014, change in aboveground tree biomass (ΔBiomass), and mean percent tree cover change (ΔTree Cover%) according to socioeconomic strata during 2002 to 2014 in Santiago, Chile.
Socioeconomic StrataPlots2014 Biomass (Mg·ha−1) (SE)ΔBiomass 2002 to 2014 (Mg·ha−1·year−1) (SE)ΔTree Cover% (2002 to 2014)
High6921.66 (5.20)0.29 (0.31)5.80 (3.53) a
Medium618.32 (3.24)−0.05 (0.18)−3.70 (3.67) a,b
Low625.98 (2.05)−0.15 (0.17)−7.30 (3.84) b
Note: SE is Standard error and different letter superscripts between strata in ΔTree cover represent significant statistical difference (p < 0.05).
Table 4. Mean tree biomass, change in tree biomass (ΔBiomass) during 2002 to 2014, mean basal area, and change in basal area (ΔBA) during 2002 to 2014 in Santiago, Chile.
Land Use ClassPlots2014 Biomass (Mg·ha−1) (SE)ΔBiomass (Mg ha−1·year−1) (SE)2014 Basal Area (m2·ha−1) (SE)ΔBA (m2·ha−1·year−1) (SE)
Agriculture387.91 (5.01)−0.09 (0.18)2.10 (0.83)0.00 (0.06)
Commercial/Industrial264.85 (1.56)−0.38 (0.32)1.83 (0.45)−0.04 (0.05)
Green Areas3611.90 (4.77)0.22 (0.32)2.72 (0.81)0.03 (0.05)
Residential8616.84 (4.10)0.16 (0.25)3.96 (0.89)0.07 (0.06)
Transportation611.93 (7.68)−0.13 (0.70)5.50 (3.10)−0.06 (0.17)
Santiago19212.35 (2.29)0.04 (0.14)3.12 (0.47)0.03 (0.03)
Note: SE is Standard error.
Table 5. Growth diameter rate (ΔDBH), change in biomass (ΔBiomass) and basal area for the five most frequent tree species in Santiago, Chile during 2002 to 2014.
SpeciesMeasured TreesΔDBH (cm·year−1) (SE)ΔBiomass (kg·year−1) (SE)Total Basal Area (m2·ha−1) (SE)
Acer negundo150.12 (0.15)0.46 (0.40)0.20 (0.02)
Citrus limon120.26 (0.12)2.49 (1.47)0.02 (0.00)
Prunus amygdalus140.13 (0.05)1.09 (0.46)0.04 (0.00)
Prunus ceracifera200.21 (0.11)6.47 (4.33)0.12 (0.01)
Robinia pseudoacacia270.36 (0.05)2.61 (1.29)0.30 (0.01)
Table 6. Annual average change in growth diameter rate (ΔDBH) and aboveground biomass for different tree forms in Santiago Chile during 2002 to 2014.
Tree FormTreesΔDBH (SE) (cm·year−1)ΔBiomass (SE) (kg·year−1)
Broadleaf-Deciduous1490.47 (0.06)9.92 (2.34)
Broadleaf-Evergreen560.49 (0.41)7.35 (4.03)
Conifer121.94 (0.65)*
Palm5*1.86 (1.01)
Shrub250.36 (0.14)6.91 (2.80)
* Standard errors were much too large to report value.
Table 7. Spearman correlation coefficients, r, for basal area (BA), basal area change (ΔBA), biomass (kg), and biomass change (ΔBiomass) according to 2002 and 2014 surface covers in Santiago, Chile.
Surface CoverBA m2·ha−1 2002BA m2·ha−1 2014ΔBA m2·ha−1Biomass (kg) 2002Biomass (kg) 2014ΔBiomass (kg·year−1)
Impervious0.1980.179−0.0210.1860.147−0.018
Asphalt0.1110.1630.0880.0990.1790.082
Building0.1610.147−0.0360.1650.108−0.068
Cement0.4330.39−0.0660.4050.362−0.061
Pervious−0.077−0.0120.021−0.0820.0170.008
Bare soil0.0200.027−0.0170.0390.032−0.013
Grass0.2870.3180.0260.2310.291−0.024
Herbaceous−0.134−0.160−0.091−0.106−0.104−0.068

