
Quantitative Analysis of Uncertainty in Financial Risk Assessment of Road Transportation of Wood in Uruguay

Abstract
:
1. Introduction
2. Materials and Methods
2.1. Flow of the Wood Transportation
2.2. Operational Cost
2.2.1. Fixed Costs
- Garage shelterwhere: cost of the garage shelter; —initial value of LCC with the value of tires; —administration rate of the garage shelter (0.5%); —useful mileage of LCC.
- Administrationwhere: —cost of administration; —administration rate (2.0%).
- Depreciationwhere: —cost of depreciation; —initial value of LCC without the value of tires; —final value of LCC without the value of tires.
- Tax on motor vehicleswhere: —tax on motor vehicle; —price of motor vehicle licensing; —price of compulsory insurance; —economic life of LCC expressed in years.
- Technical vehicle inspectionwhere: —cost of technical vehicle inspection; —price of technical vehicle inspection.
- Manpower cost of the administrative staffwhere: —manpower cost of the administrative staff; —monthly fixed salary and benefits of the manager; —monthly social security contributions of the manager (73.6%); —monthly salary and benefits of the administrative technician; —monthly social security contributions of the administrative technician (73.6%); —economic life of LCC expressed in months.
- Driver’s manpower costwhere: —driver’s manpower cost; —monthly fixed salary and benefits of the driver; —monthly social security contributions of the driver (73.6%).
- Auto repair servicewhere: —cost of own auto repair service; —administration rate of the auto repair service (0.5%); —monthly salary and benefits of the mechanic and assistant; —monthly social security contributions of the mechanic and assistant (73.6%).
- Return on capitalwhere: —return on capital (LCC); —final value of LCC with the value of tires; —minimum attractive rate of return (14.0%).
- Private insurancewhere: —insurance cost of LCC; —rate on the initial value of LCC (2.0%); —number of months of the insurance duration.
2.2.2. Variable Costs
- Fuelswhere: —cost of fuel; —price of diesel per liter; —average fuel consumption (km·L−1).
- Filterswhere: —cost of filters; —rate on fuel cost (1.0%).
- Washing and lubricatingwhere: —cost of washing and lubricating the LCC; —quantity of water consumed (L); —price of water per liter; —quantity of degreaser consumed (L); —price of degreaser per liter; —quantity of liquid soap consumed (L); —price of liquid soap consumed per liter; —quantity of lubricating grease consumed (L); —price of lubricating grease consumed per liter; —interval between washings (km).
- Lubricating oils and fluidswhere: —cost of lubricating oils and fluids; —volume of the crankcase (L); —volume of the crankcase before replacing (L); —price of engine oil per liter; —mileage limit before the engine oil is replaced; —volume of oil for the gearbox (L); —price of oil for the gearbox per liter; —volume of oil for the driving rear axle (L); —price of oil for the driving rear axle per liter; —volume of oil for the power steering (L); —price of oil for the power steering per liter; —volume of the coolant fluid (L); —price of the coolant fluid per liter; —mileage limit for changing the oil of the gearbox, driving rear axle, power steering, and the coolant fluid.
- Tollswhere: —cost of tolls; —price of toll paid per month.
- Tireswhere: —cost of tires; —quantity of tires for rear-wheel drive axle; —price of tires for rear-wheel drive axle; —quantity of tires for directional axle; —price of tires for directional axle; —price of protector and air chamber; —failure rate related to the loss of tires (50.0%); —price of retreading tire for rear-wheel drive axle; —price of retreading tire for directional axle; —number of retreading; —total mileage of the tires.
- Repairs and maintenancewhere: —cost of repairs and maintenance; —rate of repairs and maintenance (1.2%).
2.3. Gross Revenue of Wood Transportation
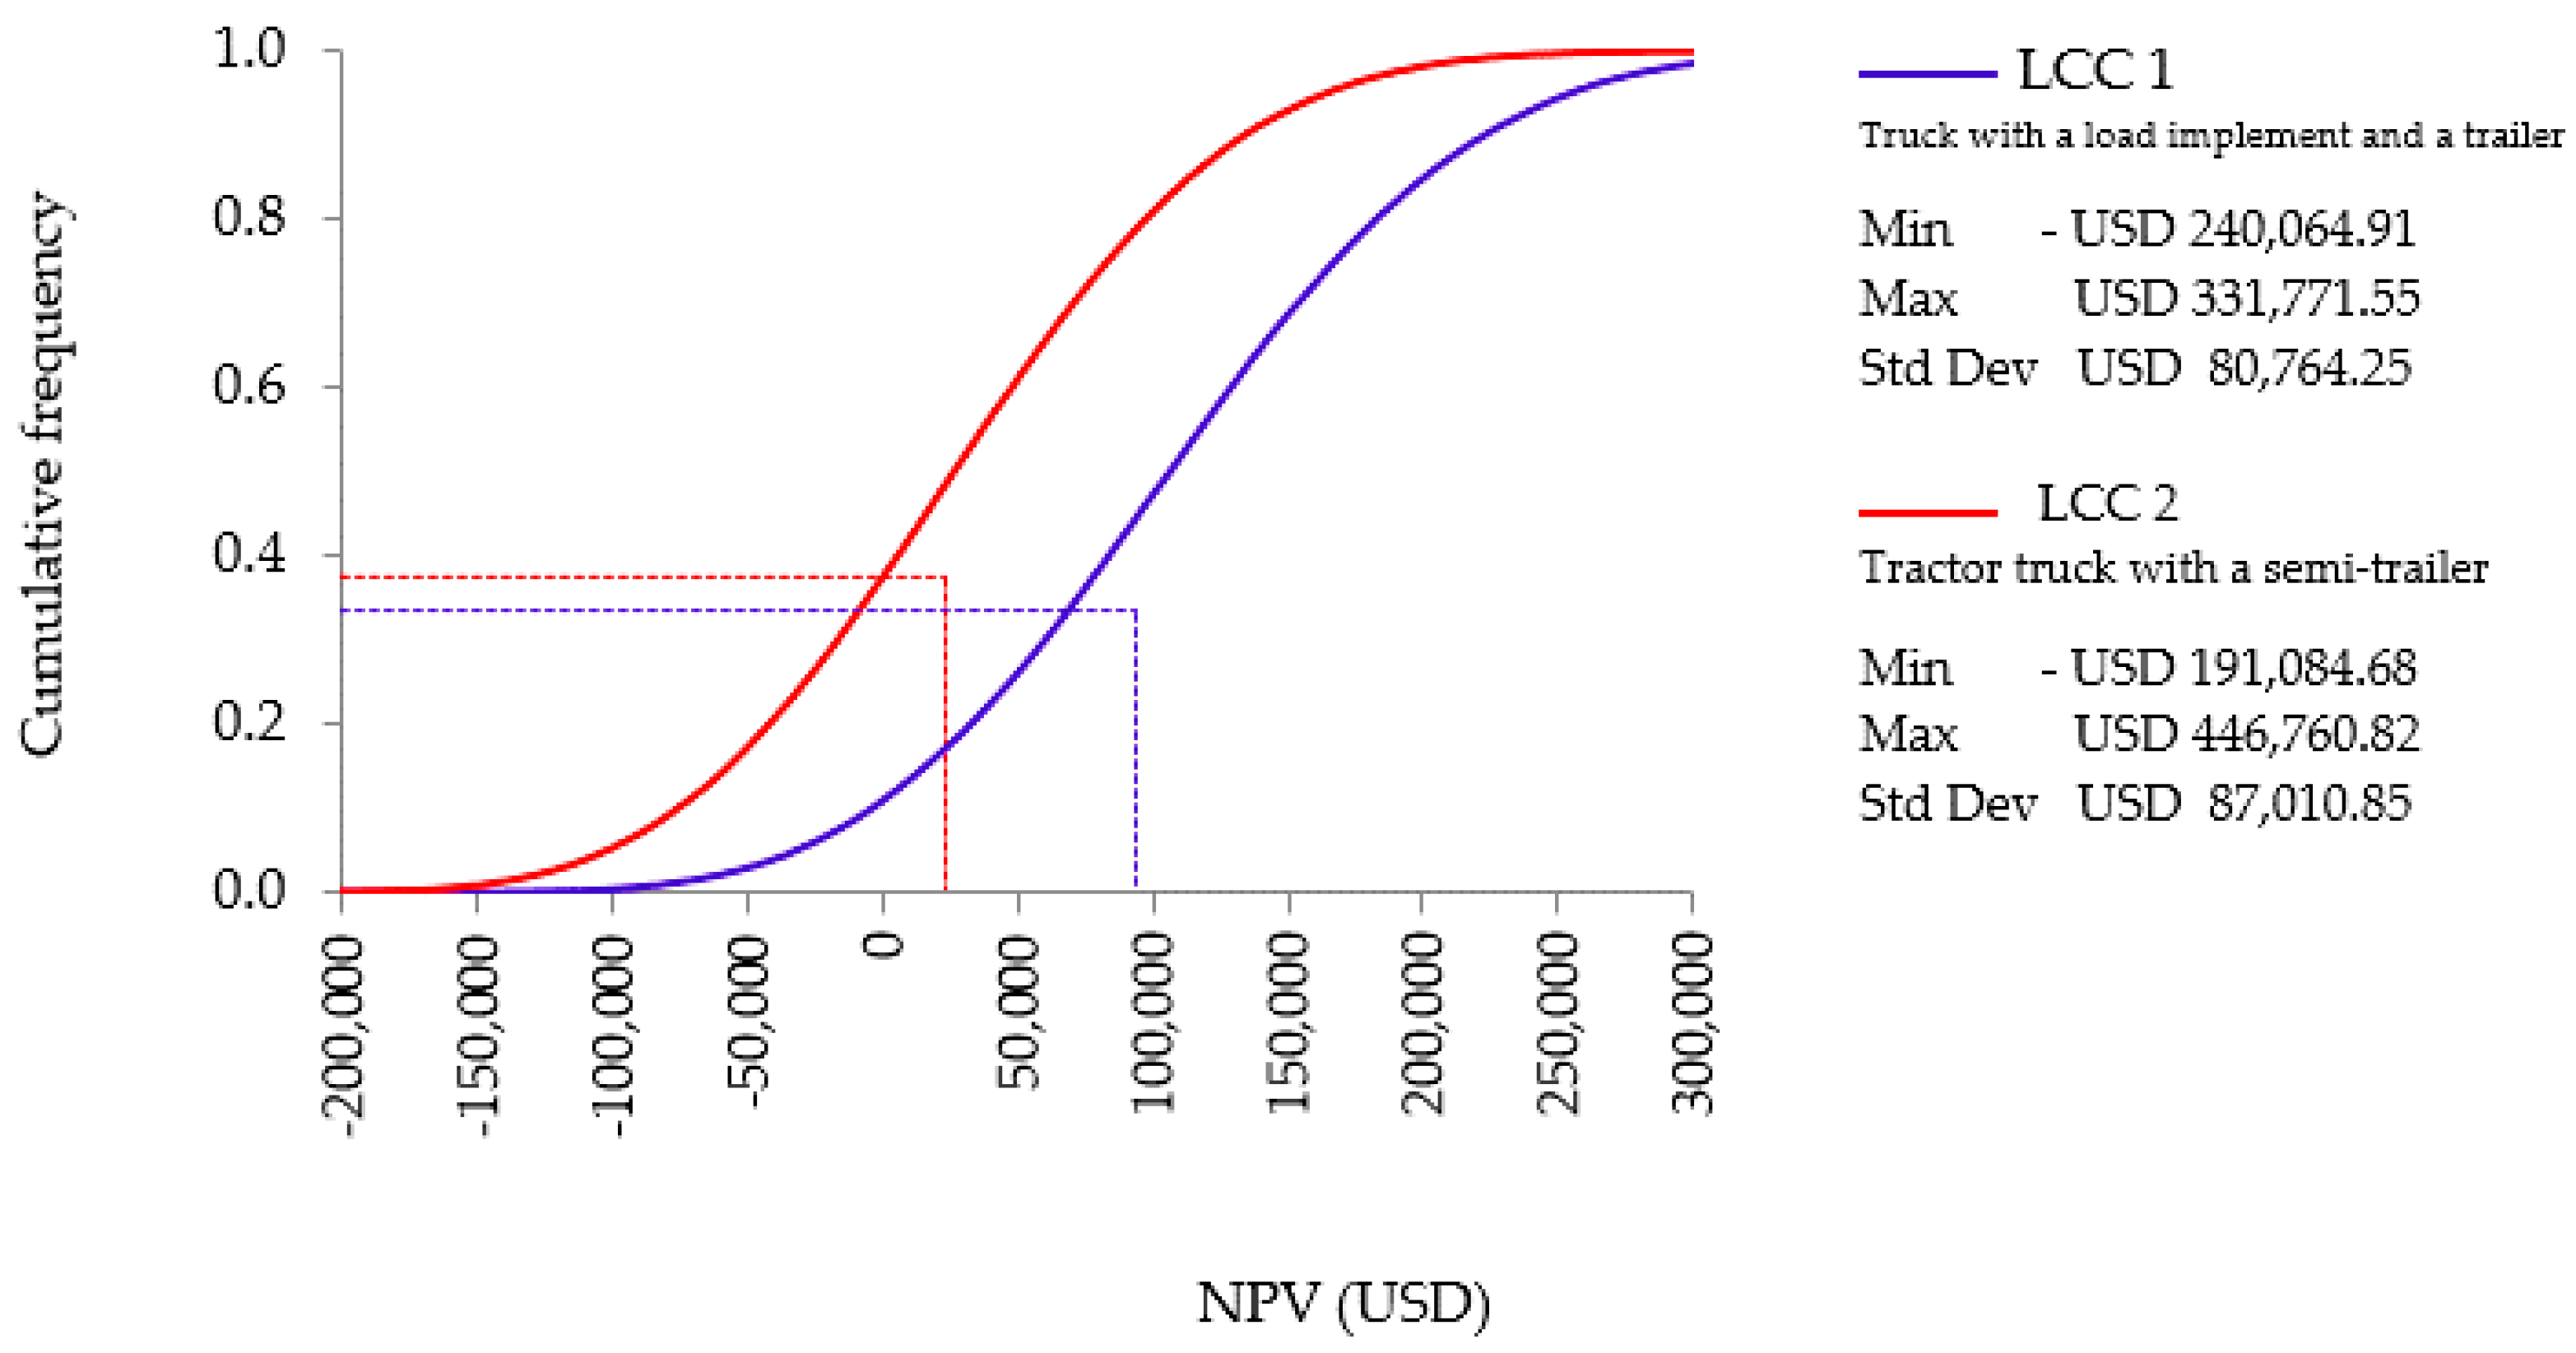
2.4. Investment Project Assessment
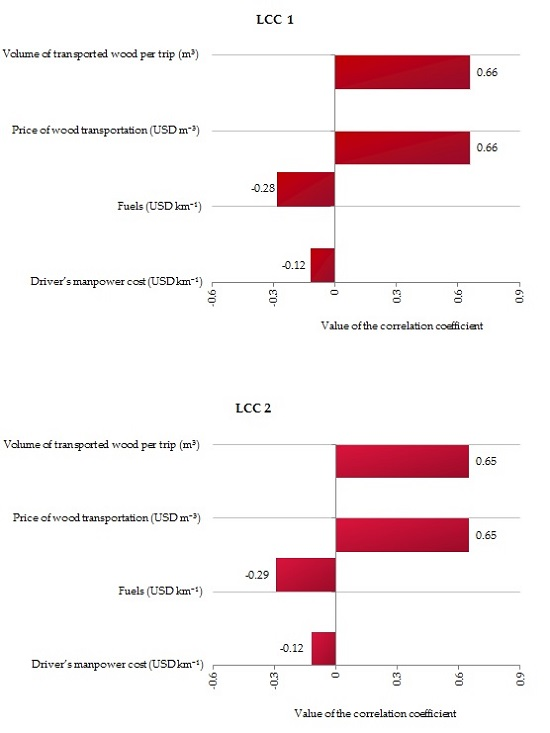
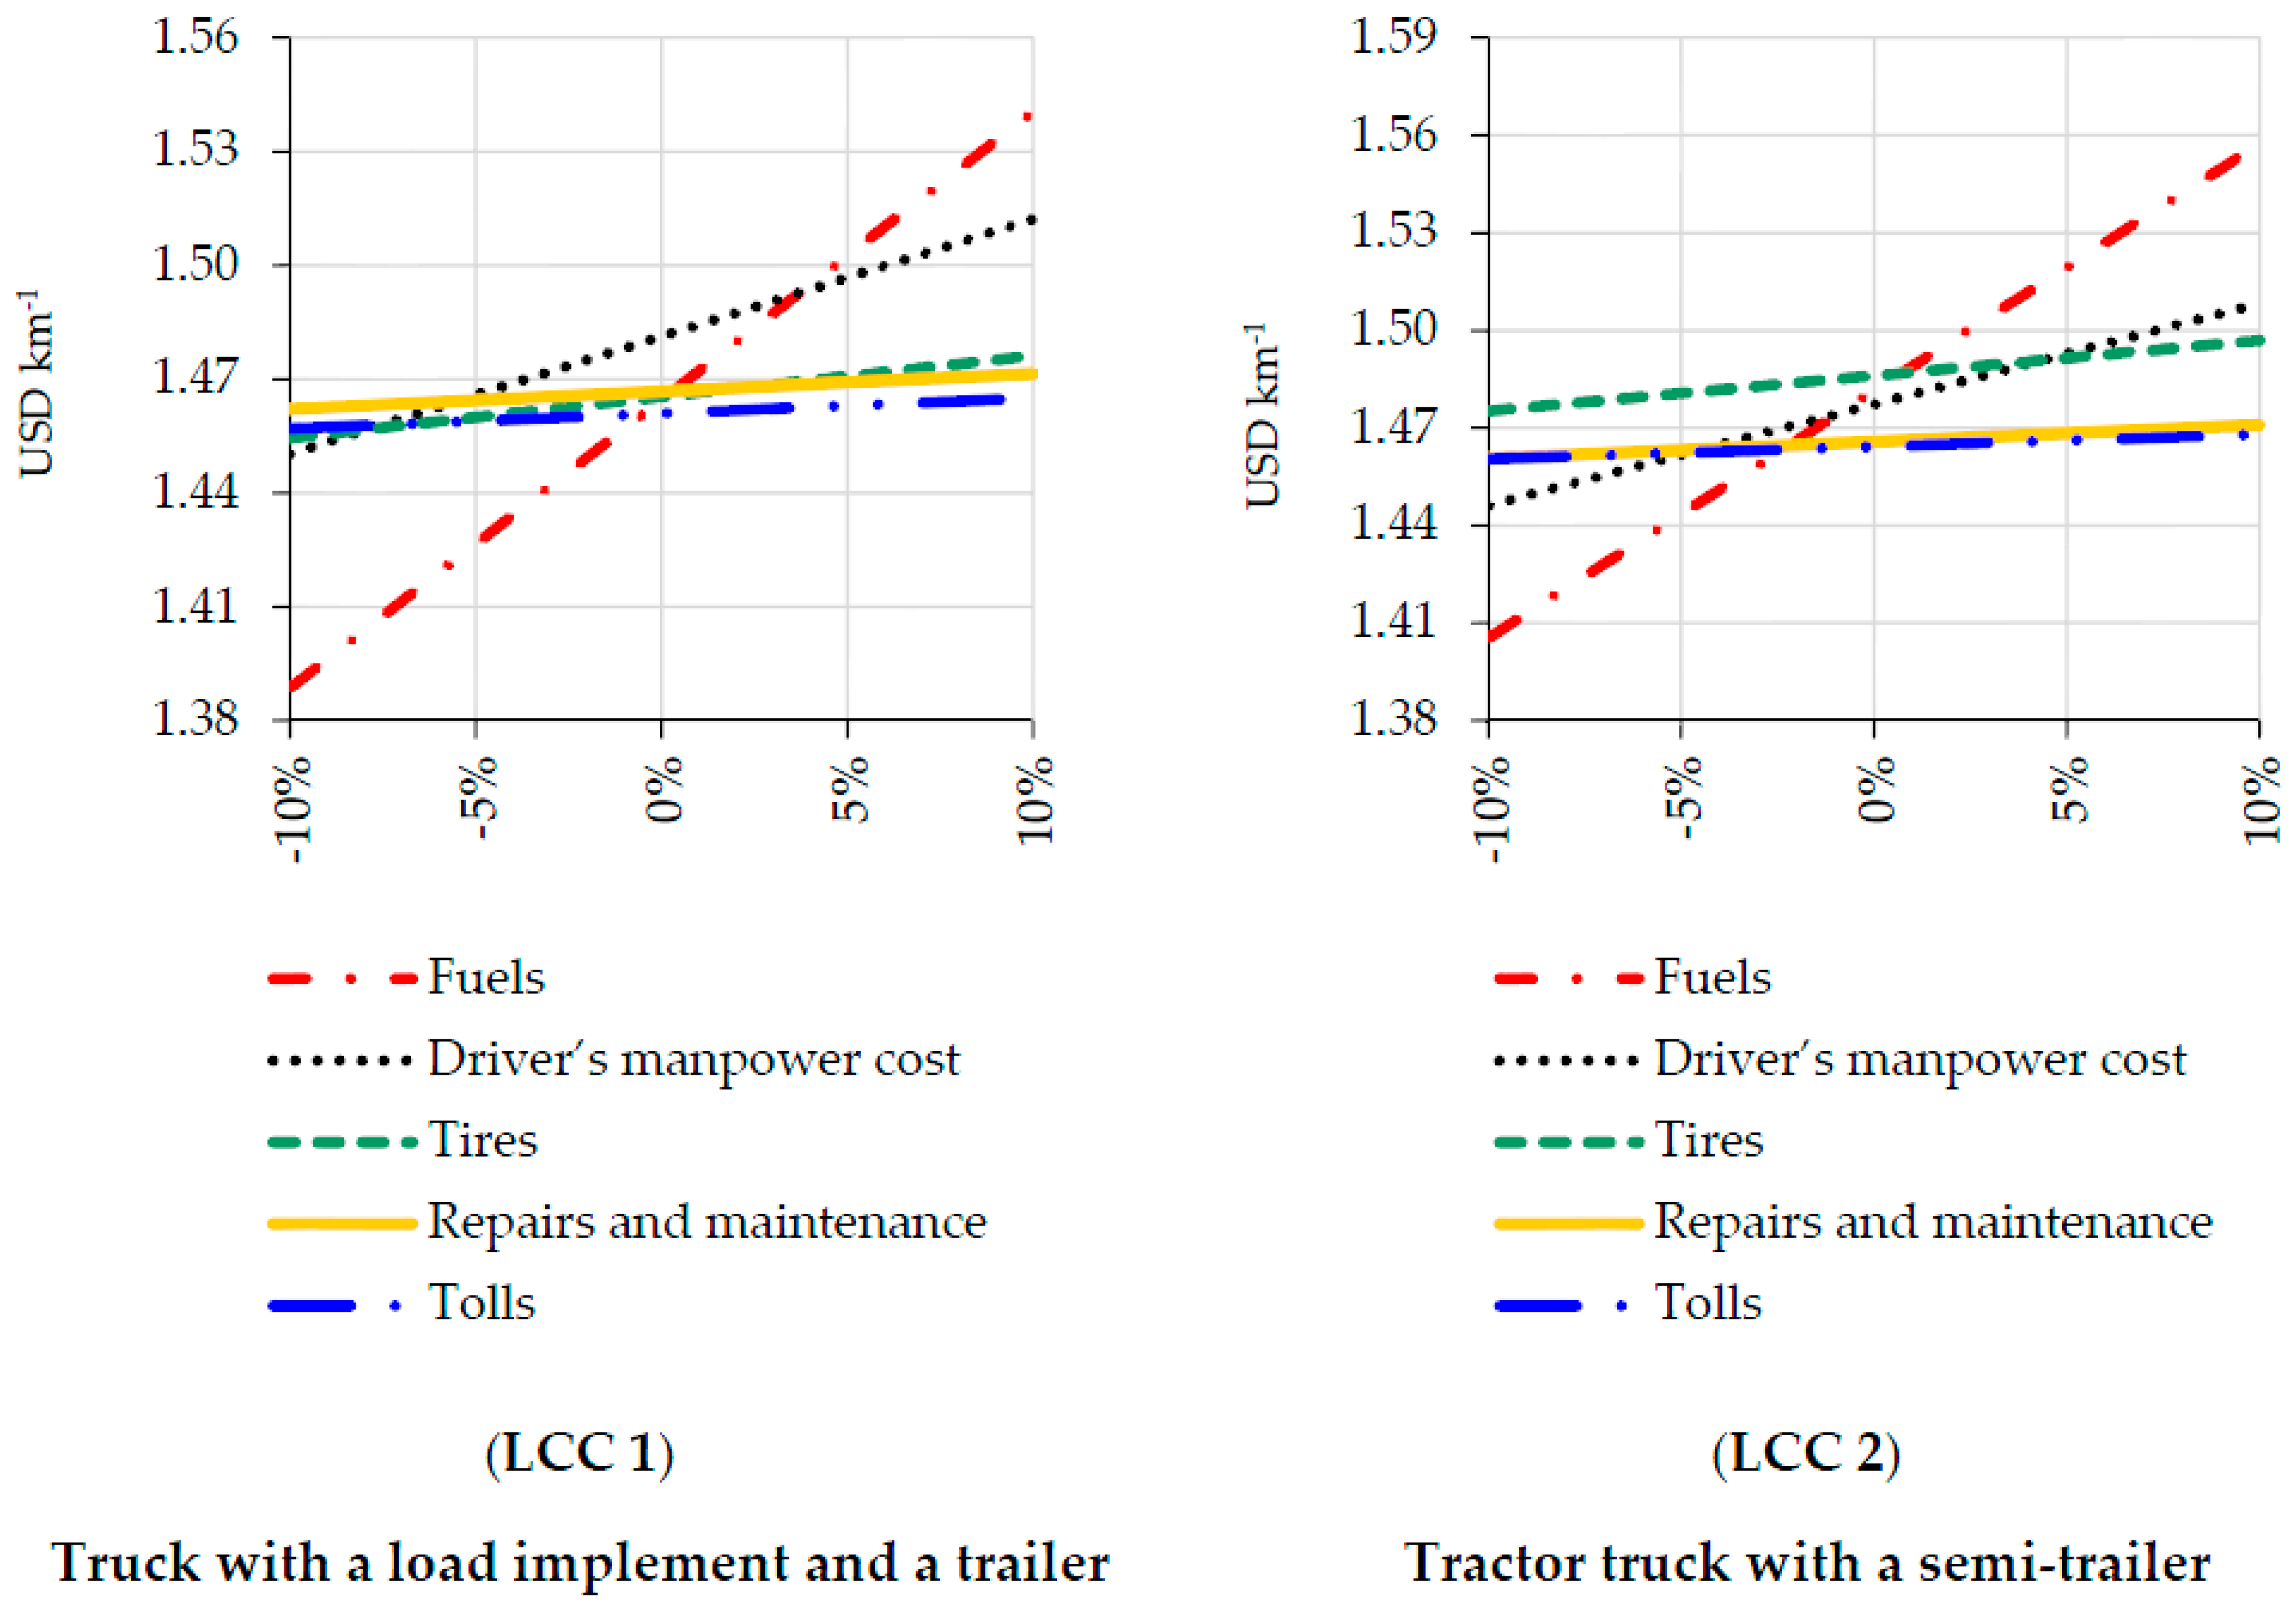
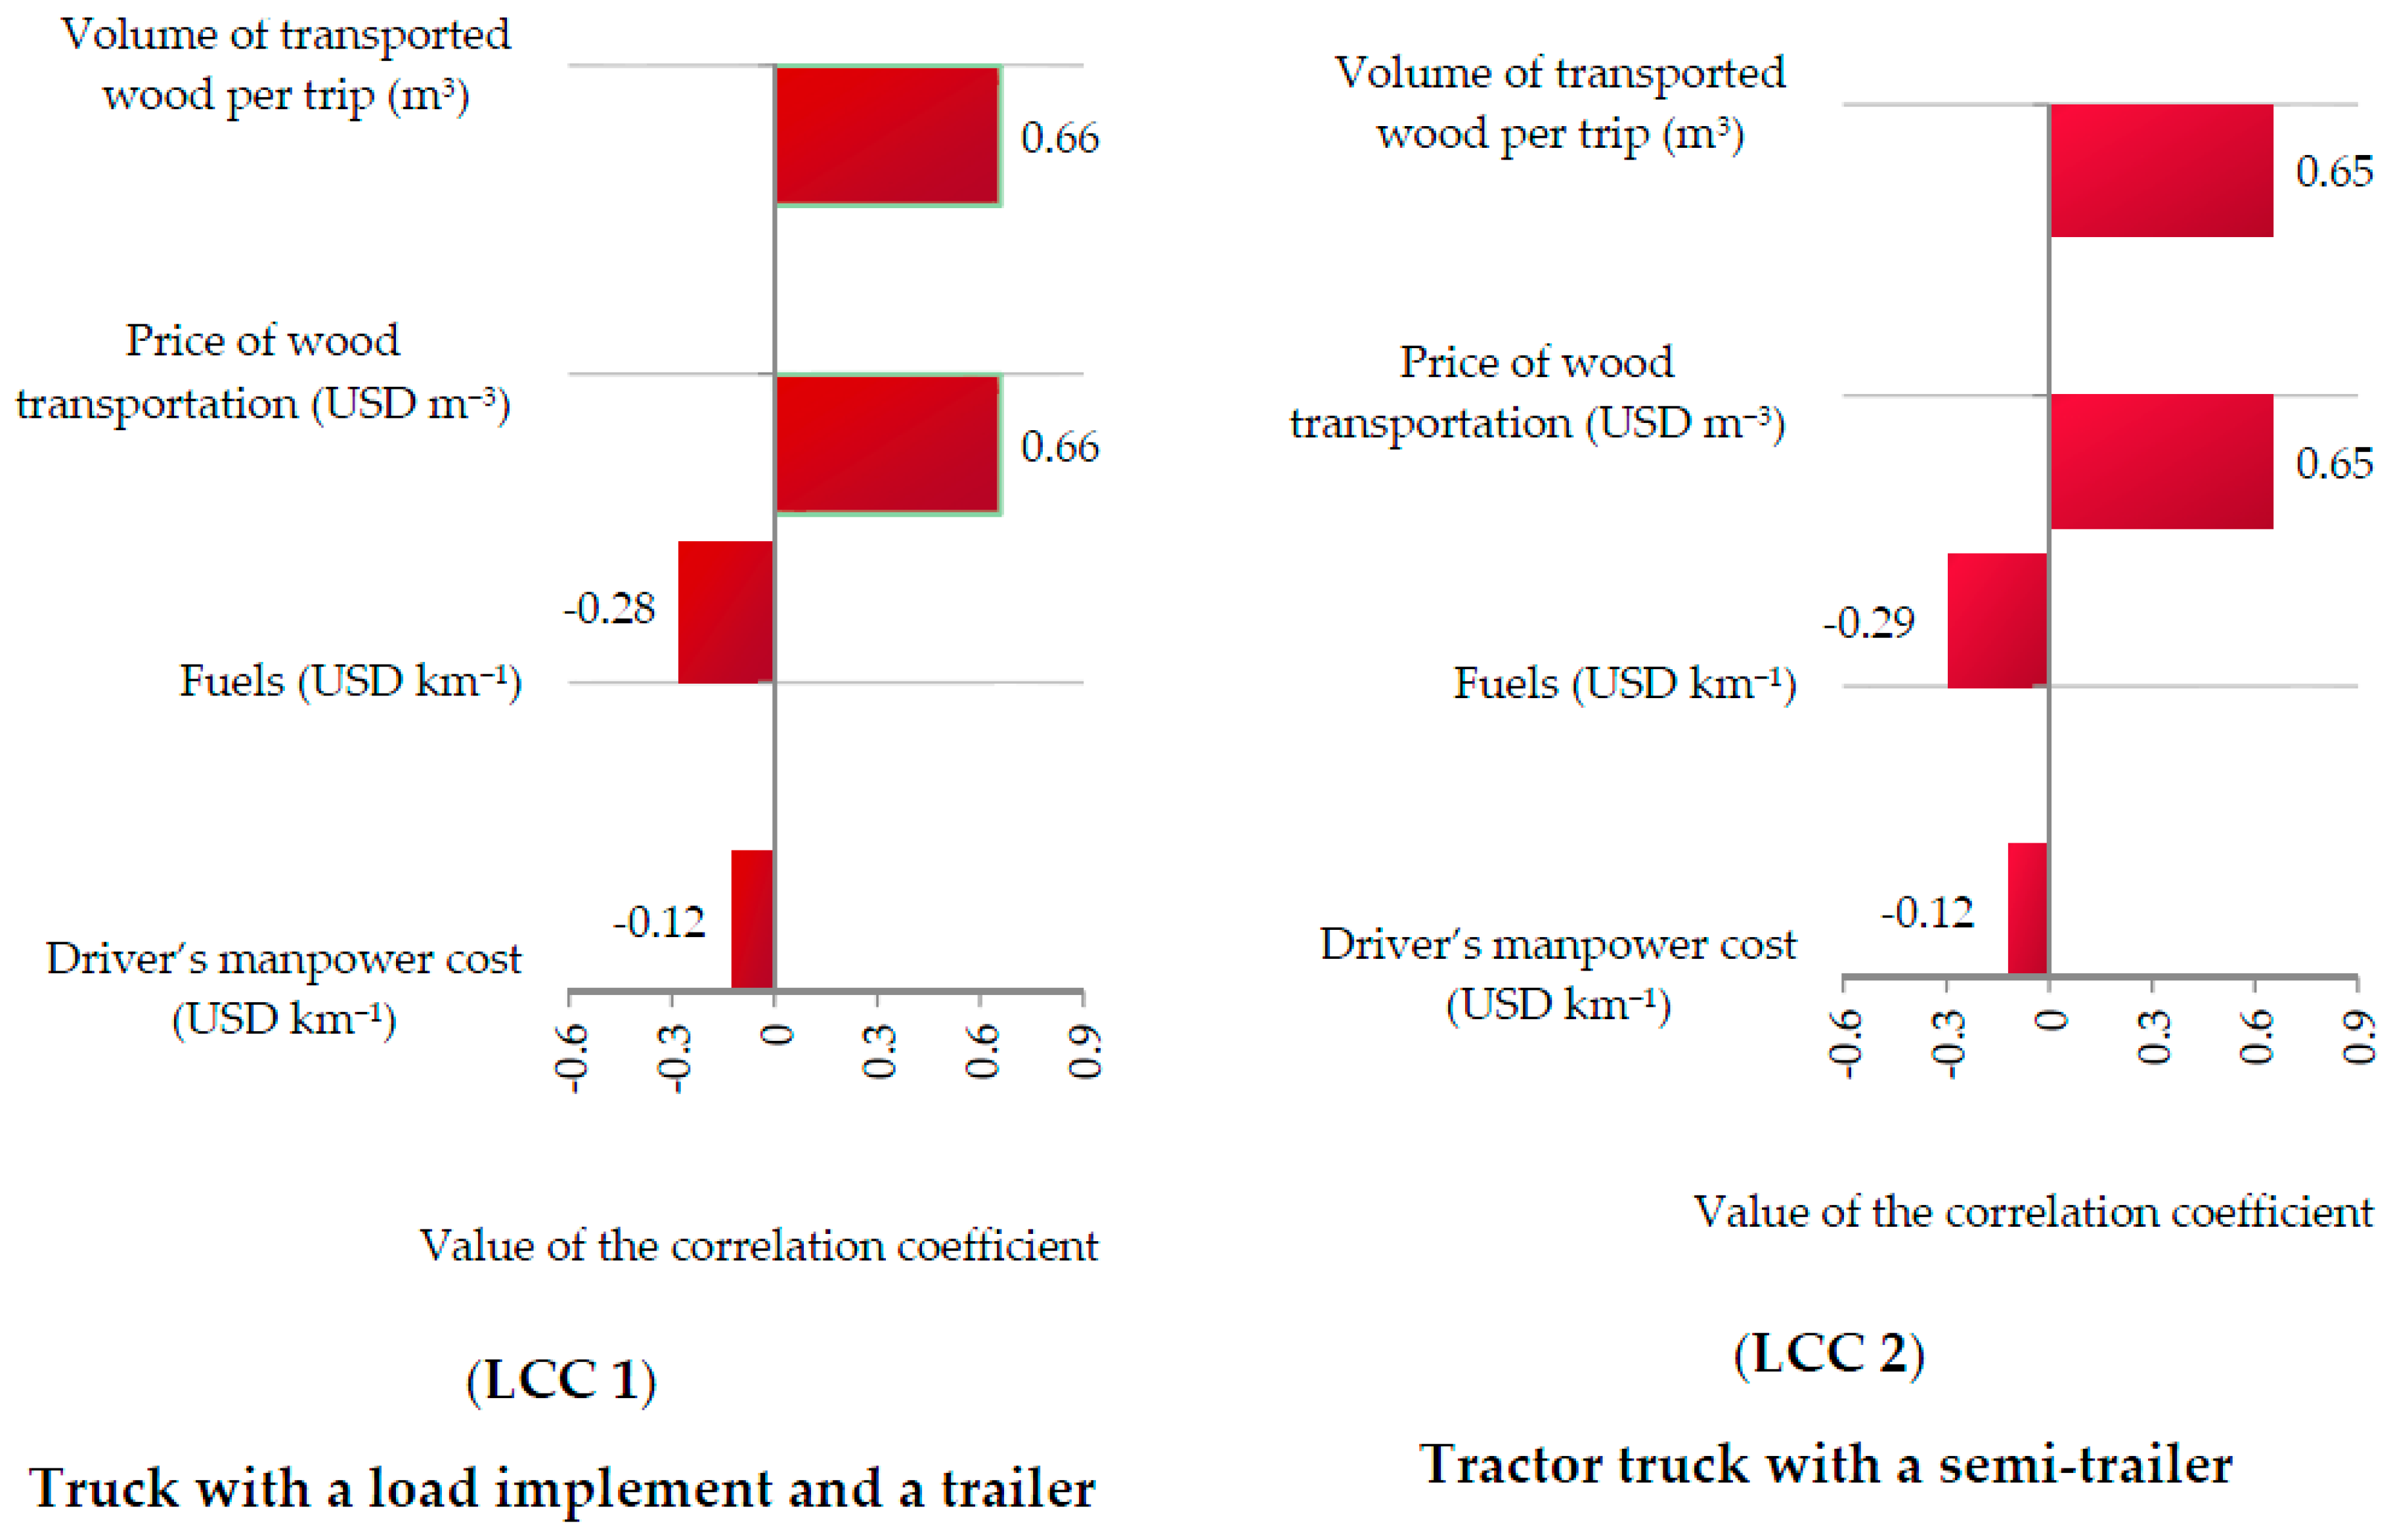
2.5. Risk Analysis of the Investment Project
3. Results and Discussion
4. Conclusions
Acknowledgments
Author Contributions
Conflicts of Interest
References
- Machado, C.C.; Lopes, E.S.; Birro, M.H.B. Transporte Rodoviário Florestal, 2rd ed.; UFV: Viçosa, Brasil, 2009; pp. 1–167. [Google Scholar]
- Hakkila, P. Procurement of Timber for the Finnish Forest Industries; Finnish Forest Research Institute: Vantaa, Finland, 1995; pp. 1–73. [Google Scholar]
- Frisk, M.; Göthe-Lundgren, M.; Jörnsten, K.; Rönnqvist, M. Cost allocation in collaborative forest transportation. Eur. J. Oper. Res. 2010, 205, 448–458. [Google Scholar] [CrossRef]
- Carlsson, D.; Rönnqvist, M. Supply chain management in forestry-case studies at Södra Cell AB. Eur. J. Oper. Res. 2005, 163, 589–616. [Google Scholar] [CrossRef]
- Berger, R.; Timofeiczyk, R., Jr.; Carnieri, C.; Lacowicz, P.G.; Junior, J.S.; Brasil, A.A. Minimização de custos de transporte florestal com a utilização da programação linear. Rev. Flor. 2005, 33, 53–62. [Google Scholar] [CrossRef]
- Food and Agriculture Organization. The Cost of Truck Transport for Wood in Some European Countries; Food and Agriculture Organization: Rome, Italy, 1969; pp. 1–17. [Google Scholar]
- Strehlke, B. Anweisung zur Herleitung von Maschinenbetriebskosten in der Forsfwirtschaft, 1st ed.; Kuratorium für Waldarbeit und Forsttechnik: Buschlag, Germany, 1971; pp. 1–12. [Google Scholar]
- Berger, R. Minimização do Custo de Transporte de Madeira de Eucalipto no Estado de São Paulo. Master’s Thesis, Universidade de São Paulo, São Paulo, Brazil, 1975. [Google Scholar]
- Watanatada, T.; Paterson, W.D.O.; Bhandari, A.; Harral, C.; Dhareshwar, A.M.; Tsunokawa, K. The Highway Design and Maintenance Standards Model: Description of the HDM-III Model; World Bank: Washington, DC, USA, 1987; pp. 149–236. [Google Scholar]
- SAAB-SCANIA do Brasil Ltda. Custos Operacionais; Centro Gráfico SAAB-SCANIA: São Bernardo do Campo, Brasil, 1988; pp. 1–68. [Google Scholar]
- Machado, C.C. Sistema Brasileiro de Classificação de Estradas Florestais (SIBRACEF): Desenvolvimento e Relação com o meio de Transporte Florestal Rodoviário. Ph.D. Thesis, Universidade Federal do Paraná, Paraná, Brazil, 1989. [Google Scholar]
- Jokic, S.V.; Zupunski, L.; Zupunski, I. Measurement uncertainty estimation of health risk from exposure to natural radionuclides in soil. Measurement 2013, 46, 2376–2383. [Google Scholar] [CrossRef]
- Hilli, P.; Koivu, M.; Pennanen, T. Cash-flow based valuation of pension liabilities. Eur. Actuar. J. 2011, 1, 329–343. [Google Scholar] [CrossRef]
- Scott, D.F.; Moore, L.J. Financial planning in a simulation framework vectors. Atlanta Econ. Rev. 1975, 10–14. [Google Scholar]
- Hertz, D.B.; Thomas, H. Risk Analysis and its Applications; Wiley: Chichester, UK, 1983; pp. 11–15. [Google Scholar]
- Mattos, A.C.M.; Vasconcellos, H. Análise de sensibilidade. Rev. Adm. Empres. 1989, 29, 85–91. [Google Scholar] [CrossRef]
- Danh, V.T.; Khai, H.V. Using a Risk Cost-Benefit Analysis for a Sea Dike to Adapt to the Sea Level in the Vietnamese Mekong River Delta. Climate 2014, 2, 78–102. [Google Scholar] [CrossRef]
- Tsu-Ming, Y.; Jia-Jeng, S. Preventive maintenance model with FMEA and Monte Carlo simulation for the key equipment in semiconductor foundries. Sci. Res. Essays 2011, 6, 5534–5547. [Google Scholar] [CrossRef]
- Safadi, E.A.E.; Adrot, O.; Flaus, J.M. Advanced Monte Carlo Method for model uncertainty propagation in risk assessment. IFAC Pap. 2015, 48, 529–534. [Google Scholar] [CrossRef]
- Banco Central del Uruguay. Available online: http://www.bcu.gub.uy/Estadisticas-e-Indicadores/Paginas/Cotizaciones.aspx (accessed on 28 February 2016).
- Palisade Corporation. @Risk for Excel. v. 6.3.0; Palisade Corporation: Ithaca, USA, 2014. [Google Scholar]
- Matsumoto, M.; Nishimura, T. Mersenne twister: A 623-dimensionally equidistributed uniform pseudo-random number generator. ACM Trans. Model. Comput. Simul. 1998, 3, 3–30. [Google Scholar] [CrossRef]
- Spearman, C. “General Intelligence,” Objectively Determined and Measured. Am. J. Psychol. 1904, 15, 201–292. [Google Scholar] [CrossRef]
- Brigham, E.F.; Ehrhardt, M.C. Financial Management: Theory and Practice, 14th ed.; Cengage Learning: Kentucky, USA, 2014; pp. 415–459. [Google Scholar]
- Gujarati, D.N.; Porter, D.C. Basic Econometrics, 5th ed.; McGraw-Hill Companies: New York, NY, USA, 2011; pp. 767–793. [Google Scholar]
- Box, G.E.P.; Jenkins, G.M.; Reinsel, G.C. Multivariate Time Series Analysis, 4th ed.; John Wiley & Sons, Inc.: Hoboken, NJ, USA, 2008; pp. 551–595. [Google Scholar]
- Schwarz, G. Estimating the dimension of a model. Ann. Stat. 1978, 6, 461–464. [Google Scholar] [CrossRef]
- Paula, P.W.; Lima, G.B.; Zanetti, J.B. Análise comparativa de modelos de séries temporais para modelagem e previsão de regimes de vazões médias mensais do Rio Doce, Colatina-Espírito Santo. Cienc. Nat. 2015, 37, 1–11. [Google Scholar]
- Źróbek-Różańska, A.; Nowak, A.; Nowak, M.; Źróbek, S. Financial Dilemmas Associated with the Afforestation of Low-Productivity Farmland in Poland. Forests 2014, 5, 2846–2864. [Google Scholar] [CrossRef]
- Kierulff, H. MIRR: A better measure. Bus. Horiz. 2008, 51, 321–329. [Google Scholar] [CrossRef]
- Swalm, R.O. Profitability index for investments. Eng. Econ. 1958, 3, 40–46. [Google Scholar] [CrossRef]
- Khodakarami, V.; Abdi, A. Project cost risk analysis: A Bayesian networks approach for modeling dependencies between cost items. Int. J. Proj. Manag. 2014, 32, 1233–1245. [Google Scholar] [CrossRef]
- Freitas, L.C.; Marques, G.M.; Silva, M.L.; Machado, R.R.; Machado, C.C. Estudo comparativo envolvendo três métodos de cálculo de custo operacional do caminhão bitrem. Rev. Árvore 2004, 22, 855–863. [Google Scholar] [CrossRef]
- Andreu, L.; Gutiérrez, E.; Macias, M.; Ribas, M.; Bosch, O.; Camarero, J.J. Climate increases regional tree-growth variability in Iberian pine forests. Glob. Chang. Biol. 2007, 13, 804–815. [Google Scholar] [CrossRef]
- Tilman, D.; Knops, J.; Wedin, D.; Reich, P.; Ritchie, M.; Siemann, E. The influence of functional diversity and composition on ecosystem processes. Science 1997, 277, 1300–1302. [Google Scholar] [CrossRef]
- Alves, R.T.; Fiedler, N.C.; Silva, E.N.; Lopes, E.S.; Carmo, F.C.A. Análise técnica e de custos do transporte de madeira com diferentes composições veículares. Rev. Árvore 2013, 37, 897–904. [Google Scholar] [CrossRef]
- Hederstrom, T. Ubicación de las Industrias Forestales; FAO: Rome, Italy, 1974; pp. 1–11. [Google Scholar]
- Machado, R.R.; Silva, M.L.; Machado, C.C.; Leite, H.G. Avaliação do desempenho logístico do transporte rodoviário de madeira utilizando rede de petri em uma empresa florestal de Minas Gerais. Rev. Árvore 2006, 30, 999–1008. [Google Scholar] [CrossRef]
- Lacowicz, P.G.; Berger, R.; Júnior, R.T.; Silva, J.C.G.L. Minimização dos custos de transportes rodoviário florestal com o uso da programação linear e otimização do processo. Floresta 2002, 32, 75–87. [Google Scholar] [CrossRef]
- Rodrigues, A.; Rojo, C.A.; Bertolini, G.R.F. Formulação de estratégias competitivas por meio de análise de cenários na construção civil. Produção 2013, 23, 269–282. [Google Scholar] [CrossRef]
- Silva, M.L.; Oliveira, R.J.; Valverde, S.R.; Machado, C.C.; Pires, V.A.V. Análise do custo e do raio econômico de transporte de madeira de reflorestamentos para diferentes tipos de veículos. Rev. Árvore 2007, 31, 1073–1079. [Google Scholar] [CrossRef]
- Zaidan, A.; Ismail, Z.; Yusof, Y.M.; Kashefi, H. Misconceptions in Descriptive Statistics among Postgraduates in Social Sciences. Soc. Behav. Sci. 2012, 46, 3535–3340. [Google Scholar] [CrossRef]
- Black, F.; Scholes, M. The pricing of options and corporate liabilities. J. Political Econ. 1973, 81, 637–654. [Google Scholar] [CrossRef]
- Van Groenendaal, W.J.H. Estimating NPV variability for deterministic models. Eur. J. Oper. Res. 1998, 16, 202–213. [Google Scholar] [CrossRef]
- Inanoglu, H.; Jacobs, M. Models for Risk Aggregation and Sensitivity Analysis: An Application to Bank Economic Capital. J. Risk. Financ. Manag. 2009, 31, 118–189. [Google Scholar] [CrossRef]
- Arnold, U.; Yildiz, Ö. Economic risk analysis of decentralized renewable energy infrastructures—A Monte Carlo Simulation approach. Renew. Energy 2015, 77, 227–239. [Google Scholar] [CrossRef]
- Yang, J. Convergence and uncertainty analyses in Monte-Carlo based sensitivity analysis. Environ. Model. Softw. 2011, 26, 444–457. [Google Scholar] [CrossRef]
- Satyasai, K.J.S. Application of Modified Internal Rate of Return Method for Watershed Evaluation. Agric. Econ. Res. Rev. 2009, 22, 401–406. [Google Scholar]
- Baral, S.; Kim, K.C. Stand-alone solar organic rankine cycle water pumping system and its economic viability in Nepal. Sustainability 2015, 8, 1–18. [Google Scholar] [CrossRef]
- Sajid, Z.; Zhang, Y.; Khan, F. Process design and probabilistic economic risk analysis of bio-diesel production. Sustain. Prod. Consum. 2016, 5, 1–15. [Google Scholar] [CrossRef]


© 2016 by the authors; licensee MDPI, Basel, Switzerland. This article is an open access article distributed under the terms and conditions of the Creative Commons Attribution (CC-BY) license (http://creativecommons.org/licenses/by/4.0/).
Share and Cite
Simões, D.; Andrés Daniluk Mosquera, G.; Cristina Batistela, G.; Raimundo de Souza Passos, J.; Torres Fenner, P. Quantitative Analysis of Uncertainty in Financial Risk Assessment of Road Transportation of Wood in Uruguay. Forests 2016, 7, 130. https://doi.org/10.3390/f7070130
Simões D, Andrés Daniluk Mosquera G, Cristina Batistela G, Raimundo de Souza Passos J, Torres Fenner P. Quantitative Analysis of Uncertainty in Financial Risk Assessment of Road Transportation of Wood in Uruguay. Forests. 2016; 7(7):130. https://doi.org/10.3390/f7070130
Chicago/Turabian StyleSimões, Danilo, Gustavo Andrés Daniluk Mosquera, Gislaine Cristina Batistela, José Raimundo de Souza Passos, and Paulo Torres Fenner. 2016. "Quantitative Analysis of Uncertainty in Financial Risk Assessment of Road Transportation of Wood in Uruguay" Forests 7, no. 7: 130. https://doi.org/10.3390/f7070130