Abstract
In order to develop adequate adaptation measures for environmental vulnerability, we need detailed knowledge on the climatic performance of forest ecosystems. In this study, we aim to explore climate function variability of lowland beech forest distribution at a landscape scale. We also construct the response profiles of these forests near their xeric limit under wet continental climatic conditions. We studied distribution responses using presence-absence forest records and 18 bioclimatic variables. We performed exploratory factor analysis and frequency estimation to evaluate climate function distribution responses. We found that temperature adjusted precipitation measures during summer were the most important, followed by winter rainfall indices. The relative Drought Response Range (rDRR) in the response profile presented the climate limitation function of the distribution. According to our results, higher level of climate function variability is associated with lower level of rDRR, presenting an ecological trade-off. Our results suggest that distribution functions of the rDRR, especially the Ombrothermic index, can be used as landscape indicators of drought stress. Consequently, rDRR could be a useful measure to assess regional climatic vulnerability of forest occurrence and distribution patterns.
1. Introduction
The distribution of temperate forests is limited by climate (e.g., temperature and precipitation), topography (e.g., altitude), and site-dependent ecological constraints (e.g., soil, microclimate) [1,2,3,4,5,6,7]. When examining temporal variation of precipitation in a changing climate, it can be more important than temperature in driving the presence and ecological functions of plants [8]. As a result, plant functional parameters are affected by water balance, nutrient uptake, and competitive ability [1,6,9,10]. At the edge of a species’ distribution, a reduction in total precipitation can be the question of life or death and marks the xeric limit of occurrence [11]. In order to learn more about the ecological constraints of species distribution under changing precipitation regimes, researchers should prioritize studies on functional responses to environmental stress at the xeric limit.
Beech forests, and in particular, European beech (Fagus sylvatica L.) are among the most frequently studied objects of ecological investigations at several scales, as they can teach us a lot about ecological responses [1,2,3,4,5,6,7,10,12,13,14,15,16,17,18,19,20,21]. These forests play a significant role in European forested landscapes, having a high level of spatial variation from west to east as well as a high level of heterogeneity under diverse climatic and local environmental conditions [2,5,13,15,16,17,22,23]. Ecological constraints at the lowest altitudinal limit of beech forest distribution were found in several northern, southern, and eastern regions of Europe [13,15,16,17,24,25,26]. Additionally, beech forests are geographically and ecologically limited by climate in the Pannonian Region of the Carpathian Basin in Central Europe [4,27,28,29,30,31]. Temperature variables, such as annual mean, warmest, and coldest seasonal values determine the large-scale distribution pattern of beech forests. The importance of rainfall values and the ratio of precipitation and temperature seem to be circumstantial; at the northern and south-eastern boundaries post-glacial colonization of European beech is controlled by both temperature and precipitation [2,16,18]. Development, presence, and distribution of beech forest stands are limited by minimum annual precipitation (at least 500 mm), July maximum temperature (at most 19 °C), and a moderate January mean temperature (above −3 °C).
The environmental factors that should be considered significant drivers of beech forest distribution have been discussed widely among vegetation ecologists [1,17,23]. Studying the climatic limit of the European beech, as the dominant and constant element of beech forests, can answer this question. This species exhibits increased susceptibility to summer drought and low winter temperature, which affect growth and productivity most, especially in the continental regions of Europe [6,10,14,24,25]. The distribution and landscape patterns of beech-dominated forests are highly correlated with annual mean temperature and precipitation. Additionally, seasonal climatic responses by mean or minimum temperature or precipitation of the coldest or the warmest periods can be more important [2,12,16].
Despite the high number of ecological investigations on European beech and beech forests, the objective of our research was to find a novel interpretation of the bioclimatic performance of lowland continental beech forests at their xeric distribution limit in Central Europe. Specifically, this study addressed the following: (1) we examined the functional distribution variability by using region-specific drought-related bioclimatic variables; (2) we developed regional climate responses of the distribution and characterized their attributes (limits and thresholds) by the observed and expected frequency of occurrence; and (3) we estimated and quantified the ecological vulnerability of beech forests by the drought response range as the regional climate limitation function of the distribution.
2. Materials and Methods
2.1. Site Description and Location
The Southern Transdanubian region (STR, 14,400 km2, Figure 1a,b) is a lowland-hilly landscape at the southern edge of the Pannonian Biogeographic Region between the humid (alpine) and semi-arid (continental) areas of Central Europe [9,32]. Elevation varies moderately from lowlands (79 m) to hills (up to 610 m) with an average altitude of 150 m above sea level. The geographic surface is diversified by four great rivers and Lake Balaton, which are connected by a dense inland fluvial network. The main soil types are loess or loess-like, glacial and alluvial deposits, with sparse limestone or sandstone as parent material. Continental beech forests are found from lowlands to colline elevation throughout the region (123 to 606 m) (Figure 1b). The annual precipitation is 648 mm (min: 517 mm; max: 764 mm), the mean annual temperature is 10.9 °C (min: 8.4 °C; max: 11.4 °C) according to the climate reference period of 1961–1990 [33]. The investigation area is classified into the temperate climatic zone with the intersection of three macroclimatic regions at the large scale: Oceanic, Continental, and Mediterranean [34]. According to landscape scale vegetation units, the region is in the range of the sub-mountainous oak-hornbeam woodlands of the European thermo-nemoral domain [35]. Regarding the Köppen-Geiger classification [36], there is a cold humid continental climate at the global scale, with no arid season throughout the year.
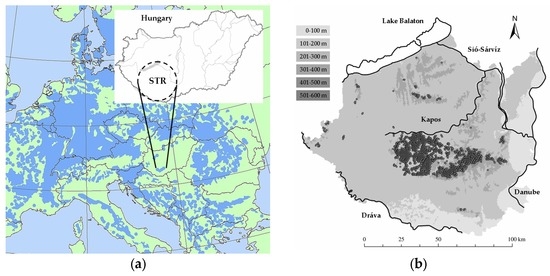
Figure 1.
Location and characteristics of the investigation area. (a) Southern Transdanubian region in Central Europe (STR; Hungary) with the continental scale distribution of European beech (blue patterned area) [37]; (b) Regional geographic surface with the four main rivers and Lake Balaton (inland watercourses are not illustrated); distribution pattern of the studied beech forests (filled circles); and indication of the altitudinal zones (ranges in the upper-left corner).
At a regional scale, there is a strong gradient in annual precipitation from South to West, characterized by a frequent double maximum in late spring and autumn with warm or hot dry summers, due to the influence of Atlantic and Submediterranean climates. This macroclimatic effect interacts with the regional topography and gradually weakens towards the north-eastern part of the region [34,38,39]. In particular, the period of the highest mean temperature overlaps the period of the highest precipitation between June and August. Consequently, the ecological effect of the high summer temperature can largely be compensated by the high amount of precipitation. Due to this climatic and geographic heterogeneity primarily derived from precipitation variability, this area is ideal to investigate the ecological effects of drought at a high resolution.
2.2. MÉTA Vegetation Survey and Beech Forest Records
A systematic field survey of the actual (semi-)natural vegetation of Hungary was implemented between 2004 and 2007, integrating geographical, landscape ecological, and landuse information by the MÉTA (multi-attributed vegetation mapping) project [40]. Field data were collected in systematic grid cells of 35-hectare hexagon-shaped spatial units. Presence-absence records of the habitats, including those inside the sub-mountainous beech forests, are managed in the MÉTA database [41]. The presence-absence dataset was embedded in the matrix of the regional sampling points as a total (n = 39,450). In this study, beech forests generally were high-growing with a dense canopy layer (canopy cover between 80% and 100%) at a height of 20–35 m, and in general, European beech has high vitality and growing potential. Stands were dominated by the European beech, and there were many mesic forest understory species in the herb layer [42,43]. We used the records of sub-mountainous beech forests coded as “K5” in the National Habitat Classification System [44]; other occurrences of beech trees or related habitats were not included. According to the current syntaxonomic system, these regional stands are Illyrian beech forests, consisting of four plant associations: Vicio oroboidi-Fagetum Pócs & Borhidi 1960, Helleboro odori-Fagetum Soó & Borhidi in Soó 1960, Doronico austriaci-Fagetum Borhidi & Kevey 1996, and Leucojo verni-Fagetum Kevey & Borhidi 1992 [43].
2.3. Drought Stress Related Bioclimatic Variables
Bioclimatic variables (monthly minima, maxima, and means of temperature and precipitation) were obtained from the regional meteorological stations from the climate reference period of 1961–1990. Temperature values were imported from the WorldClim database [45,46] and precipitation data were obtained from the Hungarian Meteorological Service as elevation-corrected, spatially interpolated high-resolution climate surface data [33]. We used multivariate linear correlation to explain local topological variables and interpolated regression residuals by kriging (AURELHY method) [47]. We extracted climatic data for the hexagon grid system inventory by using central spatial coordinates. Ultimately, we obtained an integrated regional bioclimatic database at the hexagon level.
We selected a primary set of drought-related bioclimatic variables including several rainfall values corresponding to various time scales. They were compiled from five monthly precipitation values during winter and summer periods, five values from the BIOCLIM series [46] representing seasonal rainfall measures, and eight composite indices, where precipitation values were integrated with temperature components that can modify rainfall pattern, and account for the humidity aspect of the climate. Composite indices were combined in a standardized way and can provide a useful tool to detect some integrated climate function of the distribution. The selected variables are:
- P01
- January precipitation (mm)
- P06
- June precipitation (mm)
- P07
- July precipitation (mm)
- P08
- August precipitation (mm)
- P12
- December precipitation (mm)
- BIO 12
- Annual precipitation (mm)
- BIO 14
- Precipitation of the driest month (here February) (mm)
- BIO 17
- Precipitation of the driest quarter (here January–March) (mm)
- BIO 18
- Precipitation of the warmest quarter (here June–August) (mm)
- BIO 19
- Precipitation of the coldest quarter (here December–February) (mm)
Precipitation during the vegetation period (PVEG):
where: ΣP04–10 = precipitation sum from April to October (mm).
PVEG = ΣP04–10
Aridity index (Ai) [48]:
where: Pann = annual precipitation; Tann = annual mean temperature; Pd and Td = mean temperature and precipitation, respectively, of the driest month (here February); (mm·°C−1).
Ai = [Pann/(Tann + 10) + 12 × Pd/(Td + 10)]/2
Compensated Summer Ombrothermic index (CSOi) [49]:
where: P05 to P08 = precipitation sum from May to August; T05 to T08 = sum of temperature means from May to August; (mm·°C−1).
CSOi = (P05 + P06 + P07 + P08)/(T05 + T06 + T07 + T08)
Ellenberg’s Quotient (EQ) [22]:
where: Th = mean temperature of the hottest month (here July); Pann = annual sum of precipitation; (°C·mm−1).
EQ = 1000 × Th/Pann
Forestry Aridity index (FAi) [50]:
where: T07–08 = mean temperature of July and August; P05–07 = precipitation sum from May to July; P07–08 = precipitation sum from July to August; (°C·mm−1).
FAi = 100 × (T07–08)/(P05–07 + P07-08)
Ombrothermic index (Oi) [49]:
where: ΣPT0 = precipitation sum of the months with average temperature above 0 °C (here February–December); ΣTT0 = mean temperature sum of months with average temperature above 0 °C (here February–December); (mm·°C−1).
Oi = 10 × (ΣPT0/ΣTT0)
Pluviothermic Quotient (Q) [51]:
where: Pann = annual sum of precipitation; Tmaxh = mean of maximum temperature of the hottest month (here July); Tminc = mean of minimum temperature of the coldest month (here January); (mm·°C−1).
Q = 2000 × Pann/(T2maxh − T2minc)
Summer Drought Stress (SDS) [52]:
where: PS = mean precipitation of the three summer months (here June–August); (mm).
SDS = 2 × (50 − Ps)
2.4. Data Processing and Analyses
First, we assembled an integrated regional database consisting of presence-absence records of beech forests and 18 drought-related climatic variables of all hexagonal spatial units. We performed an exploratory factor analysis (principal component extraction; Varimax normalized rotation; Eigenvalue>1) on beech forest occurrences (n = 1868 sampling points) in order to extract factors as principal components, to determine which variables were correlated and independent, and to reveal the relative importance of climate measures. We examined the factor loadings in the rotated component matrix. We also calculated normalized factor loading (NFL) to highlight the relative importance of variables throughout all principal components and to select the most important climate functions.
Next, using drought-related bioclimatic variables on the presence-absence records of beech forests, we performed a frequency distribution analysis. We calculated the observed and expected frequency of beech forest regional distribution as a whole. Observed occurrences were divided into frequency bins within the regional range. Our null hypothesis was an even beech forest distribution throughout the regionwith no preference for any climatic condition. Expected frequency was interpreted as probability of the occurrence in a given range of a bioclimatic measure, performing as a continuous random variable. Expected frequency was calculated by multiplying the observed value by a proportional coefficient (k). We calculated k as the ratio between total occurrence of beech forests and regional plots (k = 1868/39,450). Then, we calculated the difference between observed and expected frequency bins in order to construct regional climate response profiles. Based on the climate response profile, functional attributes of the occurrence were estimated by distribution limits (MIN, MAX), Drought Threshold Value (DTV), and Drought Response Range (DRR) (for calculation see Figure 2). In addition, we calculated relative Drought Response Ranges when DRR was related to forest and regional total range (rDRRB and rDRRR, respectively). To discover the relationship between the rDRR and relative importance of the variables indicated by the factor loading, we applied the Mann-Whitney U-test as a non-parametric analysis of variance. We used Microsoft Office Excel 2003 (Microsoft Corporation, Redmond, WA, USA) for frequency calculation, Origin 6.1 (OriginLab, Northampton, MA, USA) [53] for response profile construction, and Statistica 12.6 (StatSoft Inc., Tulsa, OK, USA) [54] for statistical analyses.
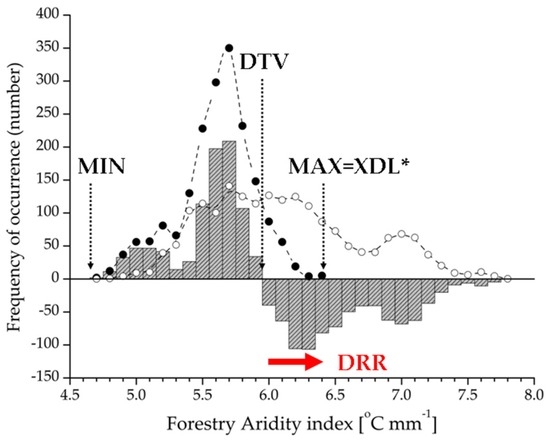
Figure 2.
Calculation method for climate function estimation of beech forest distribution by Forestry Aridity index as a sample. Drought Response Range (DRR; red arrow) was extracted from climate response profile (grey bars), the profile was derived as the difference of observed (filled circles) and expected frequency (open circles) of beech forest occurrence. The DRR represents the climate limitation function of the distribution, meaning the difference between Drought Threshold Value (DTV) and Xeric Distribution Limit (XDL). DTV is the value of the bioclimatic variable if the observed frequency is equal with the expected frequency, and this is also interpreted as the initial threshold for the DRR. * XDL is identical with the maximum (MAX) if the high value of the variable represents a climate limitation range; otherwise it is equal with the minimum (MIN).
3. Results
3.1. Climate Function Variability of the Distribution
Regarding the beech forest occurrences, the exploratory factor analysis resulted in two principal components on the selected bioclimatic variables (Table 1). There was a high level of total variance (88.7%), partitioning in the first (PC-1; 79.5% variance; Eigenvalue: 14.3) and the second (PC-2; 9.2% variance; Eigenvalue: 1.7) principal components. We extracted 12 summer and annual bioclimatic variables to describe climate-driven functional heterogeneity of beech forest distribution pattern. The most important variable was the Forestry Aridity index (FAi), while the least important was annual rainfall (BIO 12). In this component, seven variables had a high relative importance (NFL > 0), including monthly (P07), seasonal (CSOi, SDS) and annual (Oi, Q, Ti) rainfall variables. Four of these present a specific ratio of precipitation and temperature formulated by P/T or T/P. Six monthly and seasonal precipitation variables referring to the winter season were separated in the second component. January rainfall (P01) was the most important, and precipitation of the driest month (February) contributed the least to beech forest climate-driven distribution patterns. Regarding the selection of the most significant variables (NFL > 0), the coldest and driest quarter precipitation measures proved to be the most important for the variability estimation.

Table 1.
Results of the exploratory factor analysis in relation to climate functions of beech forest distribution. Variables are listed in descending order of importance with factor loadings in the principal components (PC-1; PC-2). Abbreviation of the variable, type (T: temperature; P: precipitation; T/P and P/T ratio), and description are also indicated. The most important variables are indicated by italics (NFL > 0 as the value of normalized factor loading).
3.2. Climate Response Profiles and Drought Response Ranges
Based on presence-absence records for beech forests we constructed climate response profiles of the distribution (Figure 3 and Figure 4). Observed and expected frequency and the differences provided an appropriate tool to demonstrate a functional response profile and its attributes, including the absolute and relative range of occurrence, Drought Threshold Value (DTV), and Xeric Distribution Limit (XDL). These attributes were calculated for each variable presented in Table 2. Important values (e.g., DTV and XDL) and drought response ranges (e.g., DRRs and rDRRs) of the response profiles were detected and compared in order to find a novel explanation of climatic drought stress at a landscape scale.
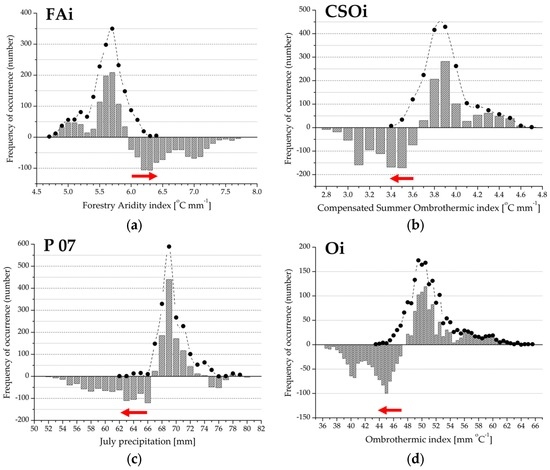
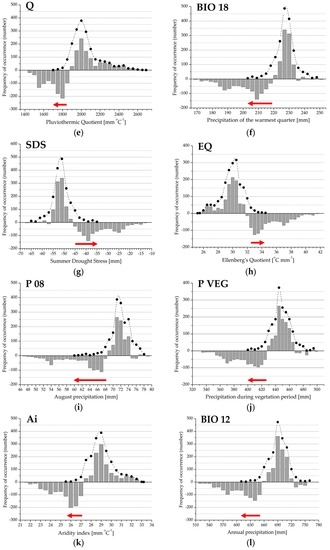
Figure 3.
(a–l) Drought Response Range (DRR; red arrow) and the regional climate response profile (grey bars) for the variables extracted in the first principal component. The histograms represent the difference between observed and expected frequency; positive values indicate climate preference range; negative values refer to the climate limitation function of beech forest distribution. Filled circles denote observed frequency of occurrence, absence data are not shown. See also Figure 2 and Table 1.
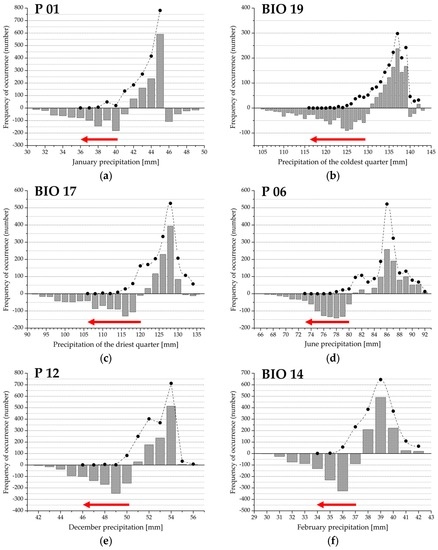
Figure 4.
(a–f) Drought Response Range (DRR; red arrow) and the regional climate response profile (grey bars) for the variables extracted in the second principal component. The histograms represent the difference between observed and expected frequency; positive values indicate climate preference range; negative values refer to the climate limitation function of beech forest distribution. Filled circles denote observed frequency of occurrence, absence data are not shown. See also Figure 2 and Table 1.
Table 2.
Attributes of climate response profiles. Lower (MINB) and upper (MAXB) limit and range (RNGB), Drought Threshold Value (DTVB), Xeric Distribution Limit (XDLB)of forest occurrence; lower (MINR) and upper (MAXR) limit and range (RNGR) of the region; absolute (DRRB) and relative Drought Response Range related to forest and regional total range (rDRRB; rDRRR). Variables are listed by principal components and factor loadings (see Table 1). B = beech forest; R = region.
3.2.1. Climate Function Patterns in the Summer Season
Bioclimatic measures in the first principal component provided a primary set for describing beech forest variability at a landscape scale. In each case, observed distribution frequency and the range differed from the expected. In the case of the Forestry Aridity index, the Summer Drought Stress, and the Ellenberg’s Quotient (Figure 3a,g,h), Xeric Distribution Limit was identical to the upper limit of the occurrence (MAXB). In the other cases, the lower limit of the occurrence (MINB) was identical to the XDL value. The Drought Threshold Value (DTV) was clearly identified within the distribution range, representing a lower or an upper limit of the climate preference function (if the observed frequency was equal to the expected). The climate preference range (the positive section of the histogram) shows bimodal distribution in the case of composite variables (Figure 3a,b,d,e,g,h,k). For indices based on monthly or seasonal precipitation, there is a unimodal distribution in the climate preference section (Figure 3c,f,i,j,l). The relative Drought Response Range in the case of total forest range (rDRRB) is the narrowest for the Ombrothermic index (Figure 3d), and the widest for August precipitation (Figure 3i). There is a similar pattern for the relative Drought Response Range in relation to regional extension (rDRRR).
3.2.2. Climate Function Patterns during the Winter Season
In the second principal component, six precipitation variables, mainly of the winter season, were extracted to represent climate function variability. Observed distribution frequency and the range are slightly different from the expected frequency. The lower limit of the total forest range (MINB) represents the regional xeric limit (XDLB) in each case. The DTV value can also be clearly identified in the regional range (i.e., the lower limit of climate preference function of the distribution and the upper limit of DRR). Positive values of the preference range can be characterized by an asymmetric and unimodal distribution density. Relative Drought Response Ranges (rDRRB, rDRRR) are the narrowest in June precipitation and the widest in January rainfall (Figure 4a,d, and Table 2).
Exploratory factor analysis between the principal components resulted in a large difference in the explained proportion of variance (see Subsection 3.1). Therefore, we performed a non-parametric statistical analysis on the relative drought response ranges (rDRRB and rDRRR, see Table 2). We selected three sets of variables to investigate the relationship between functional range breadth and statistical variability in the principal components (Table 3). In the first case, including all the drought related bioclimatic variables, PC-1 population (rDRRB = 31.1 ± 2.6; rDRRR = 18.7 ± 1.1 as weighted mean ± SE) presents a significantly narrower functional response range than PC-2 (rDRRB = 53.9 ± 3.5; rDRRR = 35.0 ± 1.3 as weighted mean ± SE), by both of the relative range attributes. Regarding the set of variables that have positive normalized factor loading, PC-1 population also showed a narrower distribution response range by both of the measures (rDRRB = 28.6 ± 3.4; rDRRR = 17.6 ± 1.3 as weighted mean ± SE). There was a significant difference between the principal components only in the drought response range in the case regional extension (rDRRR) on the variables with negative normalized factor loading.
Table 3.
Relative Drought Response Ranges (rDRRB; rDRRR) in the principal components (PCs) according to Mann-Whitney U-test.
4. Discussion
In this study, we quantified drought-related bioclimatic performance of continental beech forests close to their lower altitudinal xeric distribution limit based on regional presence-absence data. Summer precipitation measures, mainly the composite variables that consist of both temperature and precipitation components, turned out to be the most important for representing the climate function heterogeneity of the distribution. Temperature-adjusted precipitation measures had the highest relevance. Among them, the Forestry Aridity index seemed to be the most important, particularly in regards to July precipitation. According to the climate response profiles, Drought Threshold Value and Xeric Distribution Limit indicated a markedly restricted range within the regional scale that can be interpreted as the climate limitation function of the distribution. Derived from this, the relative Drought Response Ranges as the difference of DTV and XDL, in the case of beech forest and regional scale, can be an adequate measure for climate vulnerability assessment during the progression of climate change in this continental climatic region of Central Europe. Precipitation and related measures in the first principal component of the exploratory factor analysis explained a high level of climate function heterogeneity, and resulted in significantly narrower rDRR ranges. Variables in the second principal component exhibited a low level of climate function variability, but resulted in wider rDRRs.
The importance of summer and winter climate attributes on the function, distribution, and adaptation of temperate forests (including beech stands) as it is indicated by several climatic and bioclimatic variables is well known [1,12,16,20,24,25]. Values, ranges, and thresholds of temperature and precipitation measures, especially the low June and September total seasonal rainfall and low seasonal temperature during December and January, are essential for the occurrence of beech at large spatial scales. Additionally, ecological functions of beech forests can be significantly limited by high summer temperature [6,20,24,25]. Furthermore, low seasonal precipitation (e.g., during the vegetative growth stage) also has a negative effect limiting expansion at the north-eastern leading edge [18,25]. According to our results, a relatively high summer temperature (T07–08) and relatively low precipitation levels during the two hottest summer terms (P05–07 + P07–08) were both significant. Due to the greatly overlapping periods corresponding to the highest mean temperature and the largest total precipitation between June and August, their ratio configured as the Forestry Aridity index implies a relatively high level of humidity in the distribution range. Therefore, this composite index could be used to estimate distribution variability under wet continental climate conditions. The highest value at this xeric limit (6.4 °C·mm−1) denotes 21.3 °C of the mean temperature in July and 20.7 °C in August, 328 mm of cumulative precipitation, 204 mm between June and July, and 64 mm in July only. The July precipitation is a multiplied component in the FAi, since it is the most significant monthly explanatory variable. August (P08) and June precipitation (P06) subsequently proved to have importance for the distribution variability.
Species distribution and the ecological limit of occurrence in the temperate regions of Europe are frequently interpreted by the Ellenberg’s Quotient (EQ) or other alternative climatic measures [4,15,19,28,29]. Indicative function of this bioclimatic variable is based on the ratio between July mean temperature and annual precipitation. The EQ scale exhibits a wide range for forest type characterization, varying from the pure beech zone (EQ ≤ 20) through oak-hornbeam woodlands (EQ = 20–30) and mesic oak forests (EQ = 30–40) to dry oak forests (EQ > 40) [9]. According to the beech forest distributional range, a ratio below 20 indicates a pure beech climate in the ’prevailing range’, between 20 and 30, the competitive vigor of the species gradually decreases in this ’transition range’, and in the ’exclusion range’ over 30 beech presence is strongly reduced [55]. The exclusion range refers to a threatening climatic position at the lowest elevation xeric edge [4,15,28]. According to our results, xeric distribution limit and the drought threshold value (upper limit of the preference range) of the occurrence are both ranked in the exclusion range, indicating a real xeric edge position in the Carpathian Basin. In addition, distribution showed a bimodal frequency distribution, indicating a segregated functional pattern of occurrence (see Figure 3h). This phenomenon is in accordance with previous findings that lowland beech forests partially occupy the territories of the oak-hornbeam forests at low elevation throughout the south-western part of Hungary, near the Mediterranean [43]. Nevertheless, Ellenberg’s Quotient was not the most important bioclimatic variable to describe climate related functional heterogeneity of the distribution pattern, but proved to be more suitable to express drought limitation by its narrow relative drought response range (see Table 2 and Table 3).
Annual precipitation (BIO 12) is also one of the frequently reported bioclimatic variables to predict occurrence and distribution of vegetation formations at large scales [9,22]. As one of the essential components of ombrothermic diagrams, annual rainfall seems to be useful to classify climate-based broad-scale vegetation zones [35]. In our study, annual precipitation proved to be the least important bioclimatic predictor for the variability of the climate-related functional distribution pattern (NFL = −2.538; see Table 1). Moreover, the composite indices that contained annual or other long-term rainfall components proved to have poor explanatory power (e.g., EQ, Oi, Q, PVEG; see Table 1). On the other hand, medium-term precipitation measures, especially those of summer months or season were more important for determining ecological variability (e.g., FAi, CSOi, P07). Among the short-term (monthly) precipitation variables, July rainfall was the most important, and February precipitation (that of the driest month) was the least effective (see Table 1).
A surprising result of the drought response analysis was winter precipitation; January rainfall during the winter (from December to February) provided the most conclusive validation (see Table 1). Because of this phenomenon, beech forest distribution could independently be predicted by the precipitation of the coldest season at the lowland xeric limit. This finding suggests that total cold season rainfall preceding the vegetation period could have a protracted impact for the presence and distribution of beech forests.
Our results have important ramifications when considering projected climate change, especially the estimated shifts in temperature and precipitation. Climate change projections under SRES A1B, RCP4.5, and RCP8.5 emission scenarios [21] predict robust and significant warming in the range of 2–3.5 °C, but no significant increase in annual precipitation of 5%–10% that can be expected in the Central European region for the periods 2021–2050 and 2071–2100 compared to 1971–2000. A definite shift towards the edge of the current xeric distribution would be expected, as indicated by most of the bioclimatic indices. Specifically, a continuous warming trend may occur in the Carpathian Basin, mainly during the summer season. Changes in the annual precipitation will not be significant, but some restructuring of the seasonal rainfall pattern could be predicted [10]. Winter precipitation will potentially increase and summer rainfall is predicted to decrease. Summer, currently the wettest season in the region, may become the driest period by the end of the 21st century [8]. Consequently, warming and drying may increase the probability of severe drought during summer.
The mean of the Ellenberg’s Quotient of 29.0 °C·mm−1 with a maximum of 39.4 °C·mm−1 at the lower/southern distribution limit of the European beech was calculated based on climatic data from 1941 to 1971 at a global scale [15]. This study reports a mean of 29.8 °C·mm−1 (26.9 and 30.1 by the bimodal distribution), a drought threshold value of 31.5 °C·mm−1, and a maximum of 34.5 °C·mm−1, as the upper (xeric) limit. As a consequence, regional distribution of the beech forests in this study is suitably adjusted to the world range. Regarding the country-scale climate change predictions, more than 90% of current beech forest occurrence would be outside their optimal bioclimatic range by 2050. One of the most distinguishing predictors was the Ellenberg’s Quotient. Water availability in May and July was vital for the survival of the European beech [4]. In accordance with the previous discussion, summer season composite indices presented the highest explanatory power; however, distribution performance by the Forestry Aridity index was more adequate in case of these lowland continental beech forests.
Distribution modeling simulation on four dominant forest tree species confirmed that beech stands at low elevation are not significantly threatened by climate change in Hungary [29]. The xeric limit is determined by short-term dry periods rather than long-term climatic means. Modified EQ (T07/PVEG) and the maximum temperature of May turned out to have the highest predictive power. Regionally, the most serious decrease is expected for the sub-Mediterranean region in southwest Hungary and, alternatively, a spatially more pronounced vitality loss of beech forests is predicted. In this study, FAi, CSOi, and P07 proved to be the most important indices that are closely related to the summer drought precipitation regime. Based on the predicted changes of FAi, beech forests will not occur in SW Hungary by 2050 and an abrupt decline in vitality status of the species is expected. Climate change, for instance an EQ index that is projected to increase up to 7.7 °C·mm−1 until 2100 in southwest Hungary, will make it necessary to enforce an adaptive forests management at a regional scale [31]. This increase in EQ will shift the regional climate envelope near or over the current xeric distribution limit, and climatic conditions are assumed to be more favorable for mixed or oak forests rather than beech forests.
The relative Drought Response Range as the regional climate limitation function of beech forest distribution showed a negative relationship with the climate function variability in the principal components (see Table 2 and Table 3). A higher level of climate function variability based on bioclimatic measures in the first principal component was associated with a narrower relative Drought Response Range, presenting an ecological trade-off. Summer season climate functions exhibited a significantly narrower drought response range and a high level of explained variance of climate functions. This means that the majority of beech forests are within their climate preference range. In contrast, a higher proportion of the drought response range and a significantly lower level of the climate function variance were represented by certain winter climate measures. Therefore, a more extended climate limitation range can be established during the coldest and the driest period of the year (from December to March), indicating a lower level of climatic vulnerability.
5. Conclusions
In this study, we analyzed bioclimatic drought responses of lowland beech forests at a landscape scale near their xeric limit, in a wet continental temperate region of Central Europe. Since this region represents a spatially diverse climatic environment, a more detailed knowledge on the functional distribution responses of forest stands is acutely needed [3,26,56]. The drought threshold value and the relative drought response range can be used as indicators to assess regional climate vulnerability of beech forests. Considering the simulated climate change in this European region, i.e., increasing temperature and a slightly decreasing summer precipitation [3,8,31,57,58], a parameter-dependent restriction in the functional responses can be predicted. The variability in climate functions with a narrow relative drought response range will be more affected because of the decrease in the functional distribution range under the current and predicted climate change conditions. The distribution function of the Ombrothermic index turned out to be the most sensitive indicator, presenting the lowest ratio of the relative drought response range to the factor loading. A distribution function that has a higher relative drought response range would preserve a less restricted climate limitation function and distribution range (e.g., P01, BIO 19). These results can be used to estimate current and future climatic vulnerability of the occurrence or the distribution pattern of forests, and can offer a scientific contribution towards the further development of adaptive forest management strategies.
Supplementary Materials
Table S1: Bioclimatic data for beech forests and frequency distributions. It is available online at www.mdpi.com/1999-4907/7/12/298/Table S1.xls.
Acknowledgments
Field data collecting was financed by MÉTA habitat framework project NKFP 3B/0050 (Széchenyi Plan). Data analysis and manuscript preparation was supported by Agrárklíma-2 VKSZ_12-1-2013-0034 project (National Research, Development and Innovation Office). Thanks to Bálint Czúcz (HAS IEB) for completing climatic data. University of West Hungary and Centre for Ecological Research, Hungarian Academy of Sciences shared covering the costs to publish in open access. The present scientific contribution is dedicated to the 650th anniversary of the foundation of the University of Pécs, Hungary.
Author Contributions
É.S.-A. and F.H. conceived and designed the analyses, D.B. developed the theoretical background, G.P. and É.S.-A. computed statistical analyses, É.S.-A. and P.L. contributed to field data collection, and all the co-authors collaborated on writing the main text and revising the manuscript.
Conflicts of Interest
The authors declare no conflict of interest. The founding sponsors had no influence on the design, analyses, data interpretation, writing of the manuscript, and the decision to publish the results.
References
- Di Filippo, A.; Biondi, F.; Čufar, K.; De Luis, M.; Grabner, M.; Maugeri, M.; Saba, E.P.; Schirone, B.; Piovesan, G. Bioclimatology of beech (Fagus sylvatica L.) in the Eastern Alps: Spatial and altitudinal climatic signals identified through a tree-ring network. J. Biogeogr. 2007, 1–20. [Google Scholar] [CrossRef]
- Gärtner, S.; Reif, A.; Xystrakis, F.; Sayer, U.; Bendagha, N.; Matzarakis, A. The drought tolerance limit of Fagus sylvatica forest on limestone in southwestern Germany. J. Veg. Sci. 2008, 19, 757–768. [Google Scholar] [CrossRef]
- Lindner, M.; Maroschek, M.; Netherer, S.; Kremer, A.; Barbati, A.; Garcia-Gonzalo, J.; Seidl, R.; Delzon, S.; Corona, P.; Kolström, M.; et al. Climate change impacts, adaptive capacity, and vulnerability of European forest ecosystems. For. Ecol. Manag. 2010, 259, 698–709. [Google Scholar] [CrossRef]
- Czúcz, B.; Gálhidy, L.; Mátyás, C. Present and forecasted xeric climatic limits of beech and sessile oak distribution at low altitudes in Central Europe. Ann. For. Sci. 2011, 68, 99–108. [Google Scholar] [CrossRef]
- Michelot, A.; Bréda, N.; Damesin, C.; Dufrêne, E. Differing growth responses to climatic variations and soil water deficits of Fagus sylvatica, Quercus petraea and Pinus sylvestris in a temperate forest. For. Ecol. Manag. 2012, 265, 161–171. [Google Scholar] [CrossRef]
- Hacket-Pain, A.J.; Cavin, L.; Friend, A.D.; Jump, A.S. Consistent limitation of growth by high temperature and low precipitation from range core to southern edge of European beech indicates widespread vulnerability to changing climate. Eur. J. For. Res. 2016. [Google Scholar] [CrossRef]
- Latte, N.; Perin, J.; Kint, V.; Lebourgeois, F.; Claessens, H. Major changes in growth rate and growth variability of Beech (Fagus sylvatica L.) related to soil alteration and climate change in Belgium. Forests 2016, 7, 174. [Google Scholar] [CrossRef]
- Bartholy, J.; Pongrácz, R.; Gelybó, G.; Kern, A. What climate can we expect in Central/Eastern Europe by 2071–2100? In Bioclimatology and Natural Hazards; Střelcová, K., Mátyás, C., Kleidon, A., Lapin, M., Matejka, F., Blazenec, M., Škvarenina, J., Holecy, J., Eds.; Springer: Dordrecht, The Netherlands, 2007; pp. 3–14. [Google Scholar]
- Ellenberg, H. Vegetation Mitteleuropasmit den Alpen, 5th ed.; Ulmer: Stuttgart, Germany, 1996; p. 1095. [Google Scholar]
- Gessler, A.; Keitel, C.; Kreuzwieser, J.; Matyssek, R.; Seiler, W.; Rennenberg, H. Potential risks for European beech (Fagus sylvatica L.) in a changing climate. Trees 2007, 21, 1–11. [Google Scholar] [CrossRef]
- Mátyás, Cs. Forecasts needed for retreating forests. Nature 2010, 464, 1271. [Google Scholar] [CrossRef] [PubMed]
- Huntley, B.; Bartlein, P.J.; Prentice, I.C. Climatic Control of the Distribution and Abundance of Beech (Fagus L.) in Europe and North America. J. Biogeogr. 1989, 16, 551–560. [Google Scholar] [CrossRef]
- Bergmeyer, E.; Dimopoulos, P. Fagus sylvatica forest vegetation in Greece: Syntaxonomy and gradient analysis. J. Veg. Sci. 2001, 12, 109–126. [Google Scholar] [CrossRef]
- Rennenberg, H.; Seiler, W.; Matyssek, R.; Gessler, A.; Kreuzwieser, J. Die Buche (Fagus sylvatica L.)—Ein Waldbaum ohne Zukunft im südlichen Mitteleuropa? European beech (Fagus sylvatica L.)—A forest tree without future in the south of Central Europe? Allg. For. Jagdztg. 2004, 175, 210–224. [Google Scholar]
- Fang, J.; Lechowicz, M.J. Climatic limits for the present distribution of beech (Fagus L.) species in the world. J. Biogeogr. 2006, 33, 1804–1819. [Google Scholar] [CrossRef]
- Bolte, A.; Czajkowski, T.; Kompa, T. The north-eastern distribution range of European Beech—A review. Forestry 2007, 80, 413–429. [Google Scholar] [CrossRef]
- Marinšek, A.; Šilc, U.; Čarni, A. Geographical and ecological differentiation of Fagus forest vegetation in SE Europe. Appl. Veg. Sci. 2012, 1–17. [Google Scholar] [CrossRef]
- Saltré, F.; Saint-Amant, R.; Gritti, E.S.; Brewer, S.; Gaucherel, C.; Davis, B.A.S.; Chuine, I. Climate or migration: What limited European beech post-glacial colonization? Glob. Ecol. Biogeogr. 2013, 22, 1217–1227. [Google Scholar] [CrossRef]
- Stojanović, D.B.; Kržič, A.; Matović, A.; Orlović, S.; Duputie, A.; Djurdjević, A.; Galić, A.; Stojnić, S. Prediction of the European beech (Fagus sylvatica L.) xeric limit using a regional climate model: An example from southeast Europe. Agric. For. Meteorol. 2013, 176, 94–103. [Google Scholar] [CrossRef]
- Tegel, W.; Seim, A.; Hakelberg, D.; Hoffmann, S.; Panev, M.; Westphal, T.; Büntgen, U. A recent growth increase of European beech (Fagus sylvatica L.) at its Mediterranean distribution limit contradicts drought stress. Eur. J. For. Res. 2014, 133, 61–71. [Google Scholar] [CrossRef]
- Jacob, D.; Petersen, J.; Eggert, B.; Alias, A.; Christensen, O.B.; Bouwer, L.M.; Braun, A.; Colette, A.; Déqué, M.; Georgievski, G.; et al. EURO-CORDEX: New high-resolution climate change projections for European impact research. Reg. Environ. Chang. 2014, 14, 563–578. [Google Scholar] [CrossRef]
- Ellenberg, H. Vegetation Ecology of Central Europe, 4th ed.; Cambridge University Press: Cambridge, UK, 1988; pp. 71–138. [Google Scholar]
- Dierschke, H.; Bohn, U. Eutraphente Rotbuchenwälder in Europa. (Eutrophic beech forests in Europe). Tuexenia 2004, 24, 19–56. [Google Scholar]
- Augustaitis, A.; Jasineviciene, D.; Girgzdiene, R.; Kliučius, A.; Marozas, V. Sensitivity of Beech Trees to Global Environmental Changes at Most North-Eastern Latitude of Their Occurrence in Europe. Sci. World J. 2012, 1–12. [Google Scholar] [CrossRef] [PubMed]
- Augustaitis, A.; Kliučius, A.; Marozas, V.; Pilkauskas, M.; Augustaitiene, I.; Vitas, A.; Staszewski, T.; Jansons, A.; Dreimanis, A. Sensitivity of European beech trees to unfavorable environmental factors on the edge and outside of their distribution range in northeastern Europe. iForest 2015, 9, 259–269. [Google Scholar] [CrossRef]
- Bauwe, A.; Jurasinski, G.; Scharnweber, T.; Schröder, C.; Lennartz, B. Impact of climate change on tree-ring growth of Scots pine, common beech and pedunculate oak in northeastern Germany. iForest 2015, 9, 1–11. [Google Scholar] [CrossRef]
- Standovár, T.; Kenderes, K. A review on natural stand dynamics in beechwoods of East Central Europe. Appl. Ecol. Environ. Res. 2003, 1, 19–46. [Google Scholar] [CrossRef]
- Mátyás, C.; Berki, I.; Czúcz, B.; Gálos, B.; Móricz, N.; Rasztovits, E. Future of beech in Southeast Europe from the perspective of evolutionary ecology. Acta Silv. Lign. Hung. 2010, 6, 91–110. [Google Scholar]
- Rasztovits, E. Modelling the Future Distribution of Beech at low-Elevation Xeric Limits—Comparison of Empirical and Stochastic Models. Ph.D. Thesis, University of West Hungary, Sopron, Hungary, 2011. [Google Scholar]
- Rasztovits, E.; Móricz, N.; Berki, I.; Pötzelsberger, E.; Mátyás, C. Evaluating the performance of stochastic distribution models for European beech at low-elevation xeric limits. Időjárás 2012, 116, 173–194. [Google Scholar]
- Gálos, B.; Führer, E.; Czimber, K.; Gulyás, K.; Bidló, A.; Hänsler, A.; Jacob, D.; Mátyás, C. Climatic threats determining future adaptive forest management—A case study of Zala County. Időjárás 2015, 119, 425–441. [Google Scholar]
- Europe’s Biodiversity—Biogeographical Regions and Seas. Biogeographical Regions in Europe. The Pannonian Region. Available online: http://www.eea.europa.eu/publications/report_2002_0524_154909/biogeographical-regions-in-europe/pannonian.pdf (accessed on 14 September 2016).
- Mersich, I.; Práger, T.; Ambrózy, P.; Hunkár, M.; Dunkel, Z. (Eds.) Climate Atlas of Hungary; Hungarian Meteorological Service: Hungary, Budapest, 2001; p. 107. (In Hungarian)
- Climate of Hungary—General Characteristics. Available online: http://www.met.hu/en/eghajlat/magyarorszag_eghajlata/altalanos_eghajlati_jellemzes/altalanos_leiras/ (accessed on 14 September 2016).
- Ozenda, P.; Borel, J.L. An ecological map of Europe: Why and how? C.R. Acad. Sci. Paris Life Sci. 2000, 983–994. [Google Scholar] [CrossRef]
- Peel, M.C.; Finlayson, B.L.; McMahon, T.A. Updated world map of the Köppen-Geiger climate classification. Hydrol. Earth Syst. Sci. 2007, 11, 1633–1644. [Google Scholar] [CrossRef]
- Distribution Map of Fagus sylvatica. Available online: http://www.euforgen.org/species/fagus-sylvatica/ (accessed on 4 November 2016).
- Borhidi, A. Klimadiagramme und klimazonale Karte Ungarns. Ann. Univ. Sci. Budapest. Sec. Geogr. 1961, 4, 21–50. [Google Scholar]
- Zólyomi, B.; Kéri, M.; Horváth, F. Spatial and temporal changes in the frequency of climatic year types in the Carpathian Basin. Coenoses 1997, 12, 33–41. [Google Scholar]
- MÉTA—Methodology. Available online: http://www.novenyzetiterkep.hu/english/node/59 (accessed on 14 September 2016).
- Molnár, Z.; Bartha, S.; Seregélyes, T.; Illyés, E.; Botta-Dukát, Z.; Tímár, G.; Horváth, F.; Révész, A.; Kun, A.; Bölöni, J.; et al. A grid-based, satellite-image supported, multi-attributed vegetation mapping method (MÉTA). Folia Geobot. 2007, 42, 225–247. [Google Scholar] [CrossRef]
- Bölöni, J.; Molnár, Z.; Biró, M.; Horváth, F. Distribution of the (semi-)natural habitats in Hungary II. Woodlands and shrublands. Acta Bot. Hung. 2008, 50, 107–148. [Google Scholar] [CrossRef]
- Borhidi, A.; Kevey, B.; Lendvai, G. Plant Communities of Hungary, 1st ed.; Akadémiai Kiadó: Budapest, Hungary, 2012; pp. 423–426. [Google Scholar]
- Csiky, J.; Borhidi, A.; Bölöni, J.; Fekete, G.; Nagy, J.; Tímár, G.; Ódor, P.; Bartha, D.; Bodonczi, L. K5 - Beech forests. In Magyarország Élőhelyei; Vegetációtípusok Leírása és Határozója—ÁNÉR 2011; Bölöni, J., Molnár, Z., Kun, A., Eds.; MTA Ökológiai és Botanikai Kutatóintézet: Vácrátót, Hungary, 2011; pp. 268–273. (In Hungarian) [Google Scholar]
- Hijmans, R.J.; Cameron, S.E.; Parra, J.L.; Jones, P.G.; Jarvis, A. Very high resolution interpolated climate surfaces for global land areas. Int. J. Clim. 2005, 25, 1965–1978. [Google Scholar] [CrossRef]
- Bioclim—Bioclimatic Variables. Available online: http://www.worldclim.org/bioclim (accessed on 14 September 2016).
- Bihari, Z. Climate Atlas of Hungary. In Forest and Climate; Mátyás, C., Víg, P., Eds.; University of West Hungary: Sopron, Hungary, 2004; pp. 23–34. (In Hungarian) [Google Scholar]
- De Martonne, E. Regions of interior basin drainage. Geogr. Rev. 1927, 17, 397–414. [Google Scholar] [CrossRef]
- Rivas-Martínez, S.; Sánchez-Mata, D.; Costa, M. North American boreal and western temperate forest vegetation. Itinera Geobot. 1999, 12, 5–316. [Google Scholar]
- Führer, E.; Horváth, L.; Jagodics, A.; Machon, A.; Szabados, I. Application of a new aridity index in Hungarian forestry practice. Időjárás 2011, 115, 205–216. [Google Scholar]
- Emberger, L. La végétation de la region méditérranéenne. Essaid’une classification des groupements végétaux. Rev. Bot. 1930, 503, 642–662. [Google Scholar]
- Mitrakos, K. A theory for Mediterranean plant life. Acta Oecol. 1980, 1, 245–252. [Google Scholar]
- Origin. Available online: http://www.originlab.com/index.aspx?go=PRODUCTS/Origin (accessed on 14 September 2016).
- Statistica 12—Product Features. Available online: http://www.statsoft.com/Resources/Library (accessed on 25 November 2016).
- Jahn, G. Temperate deciduous forests of Europe. In Ecosystems of the World—Temperate Deciduous Forests, 2nd ed.; Röhrig, E., Ulrich, B., Eds.; Elsevier: Amsterdam, The Netherlands, 1991; Volume 7, pp. 377–502. [Google Scholar]
- Kolström, M.; Lindner, M.; Vilén, T.; Maroschek, M.; Seidl, R.; Lexer, M.J.; Netherer, S.; Kremer, A.; Delzon, S.; Barbati, A.; et al. Reviewing the science and implementation of climate change adaptation measures in European forestry. Forests 2011, 2, 961–982. [Google Scholar] [CrossRef]
- Bolte, A.; Ammer, C.; Löf, M.; Madsen, P.; Nabuurs, G.-J.; Schall, P.; Spathelf, P.; Rock, J. Adaptive forest management in central Europe: Climate change, impacts, strategies and integrative concept. Scand. J. For. Res. 2009, 24, 473–482. [Google Scholar] [CrossRef]
- Intergovernmental Panel on Climate Change. IPCC 2014: Climate Change 2014: Synthesis Report. Contribution of Working Groups I, II and III to the Fifth Assessment Report of the Intergovernmental Panel on Climate Change; Core Writing Team, Pachauri, R.K., Meyer, L.A., Eds.; IPCC: Geneva, Switzerland, 2015; p. 151. Available online: https://www.ipcc.ch/report/ar5/syr/ (accessed on 4 November 2016).
© 2016 by the authors; licensee MDPI, Basel, Switzerland. This article is an open access article distributed under the terms and conditions of the Creative Commons Attribution (CC-BY) license (http://creativecommons.org/licenses/by/4.0/).