1. Introduction
The global carbon cycle involves exchange of carbon between the atmosphere and marine and terrestrial biospheres, and sediments that include fossil fuels. For the past several decades, burning of fossil fuels and other human activities such as deforestation have produced a net CO
2 increase in the atmosphere of 1–2 Pg (= 10
15 g) each year [
1]. The increasing atmospheric concentration of CO
2 and other greenhouse gases (GHG) has created a measurable increase in global temperature [
2].
Future climate changes depend on the magnitude and dynamics of both anthropogenic and natural GHG sources and sinks. Regarding the latter, forests play a major role in carbon cycling as they account for 80% of terrestrial carbon [
3]. With a typical wood density of Scots pine and Norway spruce of ~400 kg dry matter/m
3 and 50% carbon content, the carbon stored in 1m
3 of conifer wood equals ~0.73 tCO
2. In the past few decades, the world’s forests have absorbed as much as 30% of the total anthropogenic CO
2 emissions [
4]. Thus, maintenance of forest area, reforestation of former agricultural land, increased use of woody products and production of wood biomass for bio-energy are measures included in the climate change mitigation portfolio of the forest sector [
2].
Aerobic white-rot fungi are the only organisms able to efficiently mineralize all cell wall components of wood to carbon dioxide and water, and therefore these fungi play a central role in carbon and nitrogen cycling in forests [
5]. Disruptions in this cycle are caused by pathogenic microorganisms that attack living trees, reduce tree growth and cause premature tree mortality. These effects in turn reduce the carbon sequestration potential of forests, and accelerate cycling of sequestered carbon. It has been estimated that globally 85 billion tons of carbon are annually recycled back into the atmosphere through the process of lignocellulose decay by microbes [
6].
Besides CO
2, decomposition of wood can produce CH
4, a very potent GHG. Methane in stem wood has traditionally been believed to originate from microbial activity where anaerobic bacteria first degrade wood cell wall components to acetate, formate, H
2 and CO
2, which are in turn transformed to CO
2 and CH
4 by co-existing methanogenic archaea [
7]. Anaerobic conditions in tree stems that lead to CH
4 formation may be associated with bacterial wetwood, especially on poorly-drained soils [
8]. Anaerobic or microaerobic conditions can also occur in the heartwood of trees growing on well-drained upland soils to an extent that the mineralization of heartwood by associated decay fungi is hampered [
9,
10]. Under such conditions the intermediate degradation products from lignocellulose decomposition may provide substrates for anaerobic bacteria and archaea, which in turn can accelerate fungal growth by removing their metabolic waste products and by supplying nitrogen through N-fixation [
11]. In addition, it has also been proposed that wood decay fungi themselves can produce small amounts of CH
4 without the involvement of methanogenic archaea [
12].
The white-rot fungi
Heterobasidion annosum sensu lato and
Armillaria spp. are the most important root and heartwood decaying fungi of Norway spruce, the ecologically dominant conifer that grows on mesophile, well-drained soils in the boreal region. In particular, the
Heterobasidion species have benefited from the current forest practice. Primary infection of stands by these fungi takes place through colonization of fresh stumps created during active sporulation of the fungus. In addition, wounds on roots created by mechanical logging during snowless and frost-free periods serve as infection routes. From infected stumps and trees the mycelia of these fungi spread to neighboring trees through root contacts [
13]. In managed Norway spruce forests within the Nordic countries, commonly every fifth Norway spruce is infected by
H. annosum s.l. by the time of final harvest [
14,
15]. The heartwood-bound decay columns caused by these species in Norway spruce can rise up to 10–15 m above ground level at the late stage of infection [
13]. Ability to grow under microaerobic conditions is typical to many heartwood associated decay fungi—upon culturing on malt extract agar
H. annosum s.l. can grow at oxygen pressures down to (2 mm Hg) [
16], which equals 0.26 atm% O
2. These fungi can also produce anaerobically small amounts of CO
2 as a result of alcohol fermentation [
17]. At stem base of Norway spruce
Heterobasidion species often co-occur with white-rot fungi in the genus
Armillaria. When the two coexist,
Armillaria species usually occupy outer heartwood, while
Heterobasidion is associated with the inner heartwood [
18]. Root infection by
Armillaria species is often associated with predisposing abiotic conditions such as poorly drained soils [
19].
Taking into account the high frequency of extensive stem decay columns caused by H. annosum s.l. in managed Norway spruce stands in Northern Europe, we hypothesized that the emission of CO2 and possibly also CH4 from colonized wood could amount to regionally significant levels. To examine this, we monitored stem CO2 and CH4 concentrations in healthy Norway spruce trees and trees infected by H. annosum s.l. and/or Armillaria spp. over two growing seasons. After completing the field monitoring, the infected tree with the highest concentration of methane was felled and CO2 and CH4 production potentials from defined wood tissues were measured under laboratory conditions.
2. Materials and Methods
2.1. Sites
Norway spruce (Picea abies) trees were subjected to field monitoring at seven upland stands on well-drained soil in Eastern Norway: Ås-1 (seven trees), 59°41′31′′ N 10°45′04′′ E; Ås-2 (three trees), 59°40′05′′ N 10°42′44′′ E; Hokksund (nine trees), 59°44′28′′ N 09°55′32′′ E; Haukeli-1 (five trees), 59°44′18′′ N 7°33′09′′ E, Haukeli-2 (two trees), 59°44′00′′ N 7°32′02′′ E; Jevnaker-1 (eight trees), 60°15′49′′ N 10°30′06′′ E; Jevnaker-2 (three trees), 60°18′04′′ N 10°23′22′′ E. The sampling started in the spring 2013 at Ås and in July at Hokksund and Haukeli, whereas at Jevnaker the trees were sampled in the summer of 2014. Trees with heartrot were localized by collecting increment cores from stem base. Neighboring trees that showed no signs of decay in the increment core were used as healthy controls. At the Haukeli sites we also sampled three living aspen trees (Populus tremula) with heartrot caused by the white-rot fungus Phellinus tremulae.
2.2. Sample Trees and Gas Collection
Tree stems were drilled horizontally at stump level and normally also at breast height with a ten-millimeter-diameter borer, so that the bore hole extended into the pith. For some trees with decay additional drillings were made up to 3.5 m above stump level. Stainless steel tubes, 100–150 mm long with 10.5 mm outer diameter were forced into the holes with a hammer and stopped with butyl rubber septa. Gas samples were taken by a 20 mL polypropylene syringe equipped with a three-way valve, normally every week in 2013 and at longer time intervals in 2014. Caution was taken to adjust atmospheric pressure (by slipping the plunger) before detaching the syringe to avoid contamination from air. The samples (15 mL) were transferred to helium-washed, pre-evacuated 12 mL glass vials crimped with butyl rubber septa resulting in an overpressure in the vials to avoid contamination during sample storage.
2.3. Gas Analysis
The gas samples were analyzed for O2, CO2, N2O and CH4 by gas chromatography (GC, Model 7890, Agilant, Santa Clara, CA, USA) with back flushing and helium (He) as a carrier gas, equipped with a 30 m wide-bore Poraplot Q (0.53 mm) column (38 °C) for separation of CO2, N2O and CH4 from air and a 60 m 5Å molsieve capillary column (25 °C) for separation of Ar, O2 and N2. The analytical columns were connected to a thermal conductivity detector (TCD), a flame ionization detector (FID) and an electron capture detector (ECD) for quantification of CO2 and O2, CH4 and N2O, respectively. The ECD was run at 375 °C with 17 mL·min−1 argon/methane [Ar/CH4] [90/10 vol.%] as make-up gas. The GC was connected to an auto-sampler via a peristaltic pump (Gilson minipuls 3, Middleton, WI, USA) pumping approximately 1.2 mL gas at 1 atmosphere into two 250 μL sampling loops dedicated to each column. Certified standard mixtures of CO2, N2O and CH4 in Helium (AGA, Norway) were used for calibration.
2.4. CH4 and CO2 Production Potentials
Sample tree #6 (Ås), shown to have high stem wood CH
4 concentrations in field measurements and appreciable signs of stem base infection by both
Heterobasidion annosum s.l. and
Armillaria sp., was felled on 5th November 2015. One ten-centimeter-thick stem disc was cut at stump level and one at breast height so that these discs enclosed the bore holes used for
in situ profiling of gas concentrations. After visual inspection, three bark-to-heartwood sectors were chosen on each disk for sub-sampling, one of the sectors was taken from the position used for
in situ profiling of gas concentrations. Samples (
ca. 0.5 × 1.0 × 3.0 cm) were excised with the aid of a band saw from healthy sapwood, a wetwood appearing tissue adjacent to healthy sapwood, a reaction zone tissue formed between healthy sapwood and colonized heartwood, and colonized heartwood (
Figure S1). The samples, immediately transferred to sterile 120 mL serum bottles, had a fresh weight of 4 to 12 g (depending on sample moisture content). For each sample, two replicate bottles were prepared, one for anoxic, and one for hypoxic incubation. The bottles were crimp sealed with butyl rubber septa, amended with 1 mL DI water and He-washed (5 cycles of evacuation and He-loading with final pressure equilibration). Initially hypoxic bottles received pure O
2 to a final headspace concentration of 4 vol% immediately after He-washing. Altogether, 52 incubation bottles were prepared within <8 h since felling.
The bottles were kept in a climate cabinet set at 20 °C. Subsamples (1 mL) for analysis of CO
2, O
2 and CH
4 in headspace were taken at hours 40, 140, 300 and 550. Gas concentrations were analyzed, as described above, directly in the headspace by using an automatic incubator set up similar to that described in an earlier study [
20]. After incubation, the samples were freeze-dried to determine the dry weight. CO
2 and CH
4 production rates were estimated from increase in concentration over time [ppm h-1] by fitting the product accumulation to a quadratic equation. Rates were recalculated as mg CO
2 and μg CH
4 m
−3·s
−1, using headspace volume, sample dry weight and a wood density of 420 kg·m
−3 for Norway spruce [
21].
2.5. Estimation of Gas Fluxes from Tree Stems
Diffusion of gases in wood can be modelled by Fick’ law [
22]:
where M
i is moles of gas
i diffusing from compartment 1 to 2, D
12 the coefficient of diffusion for molecules of type
i, C
1i and C
2i the concentrations of type
i molecules in compartment 1 and 2, respectively, and Z the distance between compartment 1 and 2. The diffusion coefficient has been determined for various wood samples and species [
23], and found to vary by four orders of magnitude, mostly due to differences in water content of wood. The actual D in a living tree is likely to vary even more due to variability in wood density, humidity, and particularly wood degradation, which alters wood structure, density and humidity. It should be, however, possible to develop a simple model based on Fick’s law to obtain a rough estimate for D
12 for any given stem section. This requires measurements of the mixing ratios of CO
2 and O
2 in stems and outside air over time, and validation of the assumption that the respiration consumes one mole of O
2 for each mole of CO
2 produced:
where P
CO2 is the production of CO
2 in the stem from time t
1 to t
2.
This production is the sum of the increase or decrease in the mixing ratio in the stem and the number of moles that have diffused in or out of the stem. Thus, we can write:
With the assumption that Equation (2) applies, we can write
where the subscript
j denotes the
jth gas, in this case O
2, and where V is the volume of the stem section, dC
1i is the change in the mixing ratio from time t1 to t2, t is the time period between t2 and t1, C′
1i and C′
2i are the mean mixing ratios of the gases in compartment 1 and 2 during t, and A and Z are area and distance as explained for Equation (1).
After accounting for the differences in the molecular masses of CO
2 and O
2, their diffusivities in wood should be fairly similar. The diffusivity is related to molecular mass according to Graham’s law [
24].
where m
i is the molar mass of the gas in question and m
a is the molar mass of air, 28.97 g·mol
−1. Since the latter is obviously different inside and outside the tree, we use the mixing ratios for the inside air to calculate m
a.
Inserting δ
i and δ
j into Equation (4) and solving this with respect to D we obtain:
If the gas concentrations are converted to moles per cubic meter and the time unit is days, the unit for D12 becomes m2·d−1, which can be converted to cm2·s−1, the standard unit of diffusivity. After D is determined in this way, the flux of each gas is calculated according to Equation 1 after taking Graham’s law into account.
2.6. Upscaling of CO2 Fluxes from Decaying Stem Heartwood to Stand and Regional Level
To explore the impact of CO
2 fluxes from decay columns in the heartwood of living trees, we first pooled data from the five trees colonized by
H. annosum s.l., since this decay class dominates in the boreal Norway spruce forests in Europe. Upscaling from the tree/site level to county or the whole-country level requires estimates of the difference in carbon emission (E
c) between decaying and healthy trees, and how the E
c develops with age of the decay. Least square means of the flux data for decay type, site and stem position from July to November 2013 were used to calculate the annual mean flux. Justification for this comes from the fairly symmetrical distribution of monthly mean fluxes [
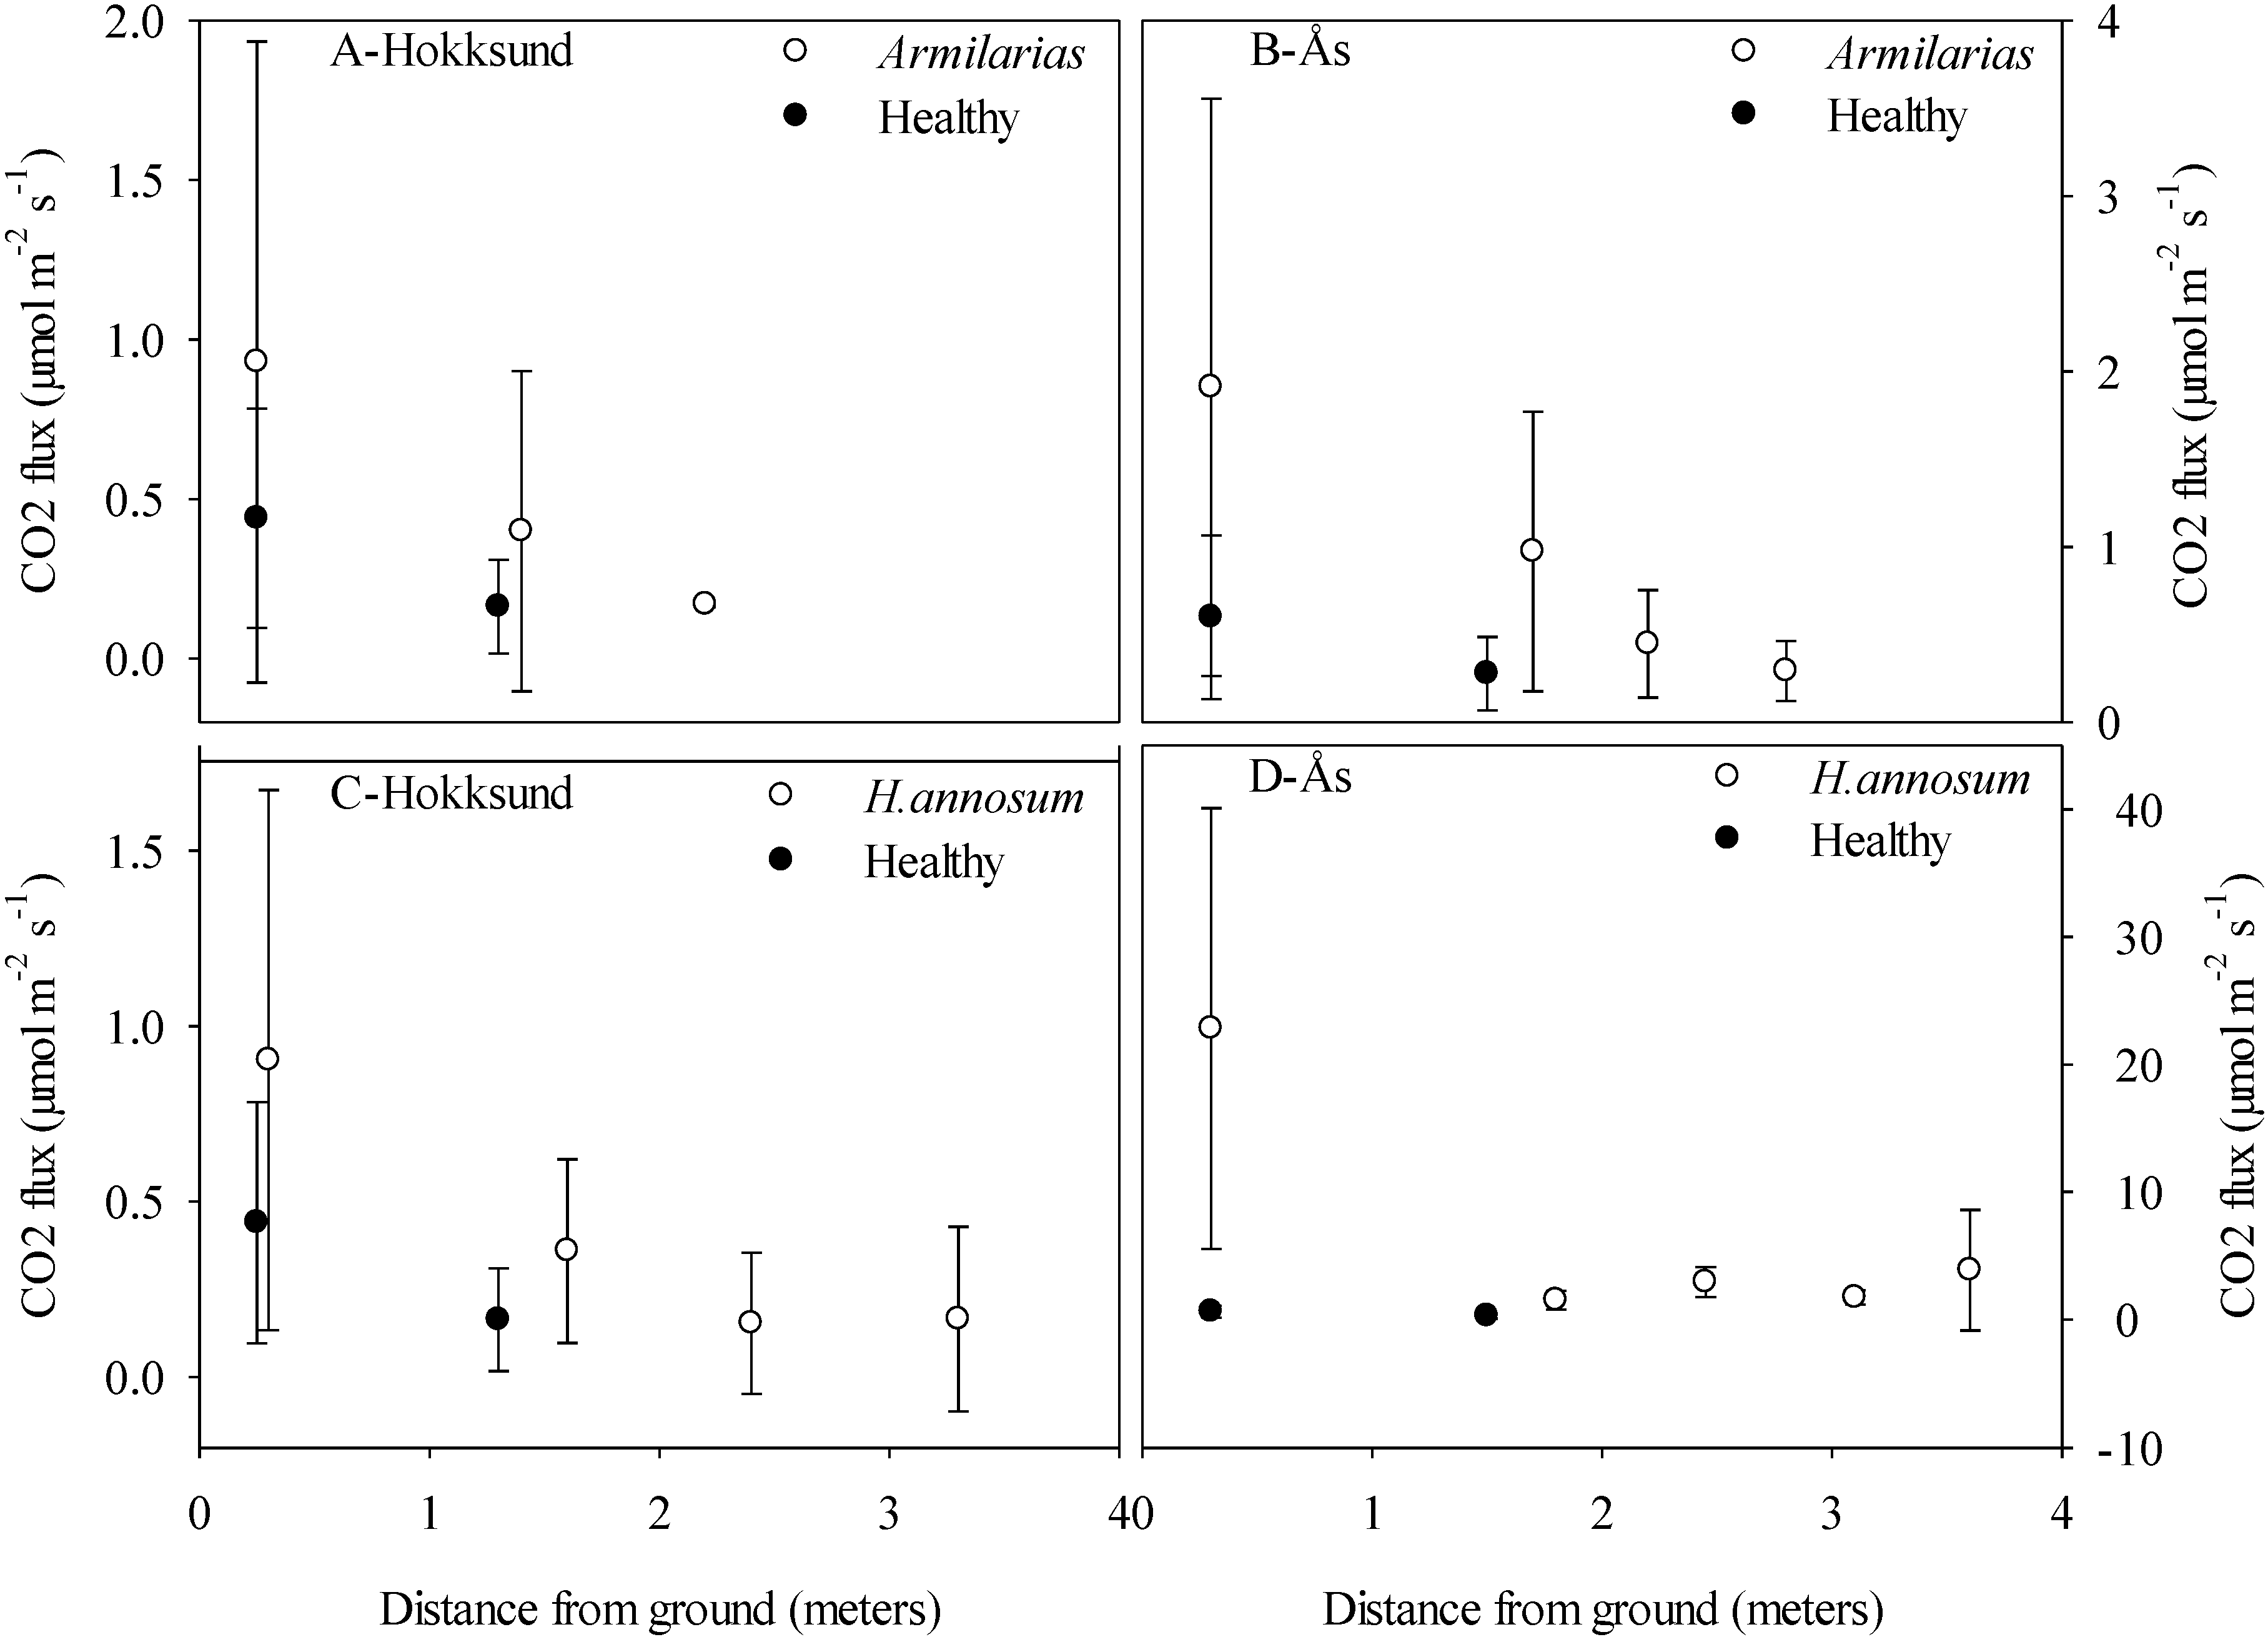
25]. These estimates of the annual mean flux were then plotted against the distances of the sampling points from the ground. For decaying trees a general exponential decline in the flux from the root and upwards was observed, and a simple model was fitted to the least square mean of each fungus and site:
where E
ci is the annual flux of CO
2 at the
ith sampling point, α, and β are parameters to be estimated, H is the distance from root to the
ith sampling point, and e
i is the residual term. After estimation of the parameters α and β, the difference in E
c between decaying and healthy trees was calculated by inserting the E
c values from breast height of healthy trees into
Equation (8) was solved with respect to H to give the height at which E
c-rotten = E
chealthy, which is an estimate of how high in the stem the decay had spread:
where H
r is the estimated height of the decay column. Thereafter, E
c-healthy was subtracted from the predicted E
c-rotten values in decaying trees to give estimated surplus CO
2 flux, E
cnet, due to decaying wood. An exponential function, Equation (9), was fitted to E
cnet with the distance from H
r to each sampling point L
i as independent variable
Data from the trees studied at Hokksund were pooled, because all sample heights were not represented in each tree, whereas the tree #7 infected by H. annosum s.l. at Ås was analyzed separately.
To calculate the flux for a decaying stem section we first used Behre’s stem curve function to find the diameter
dr at the top of the rot column H
r:
where L is the ratio of the distance from the top to H
r and to D, and a and b are coefficients; b was estimated from the height diameter ratio of the tree and a is simply 1 − b (a complete description of the method is given in the supplementary material).
Assuming linear taper from the top of the rot column (H
r) to the root, the tree circumference of any point below H
r can be approximated by:
where O
i is the circumference at point
i,
dr is the diameter at H
r in meters, and t is the stem taper in meters per meter, and L
i is the length from H
r to point
i.
To find the flux of the whole decaying stem section, Equation (12) is first multiplied with Equation (10).
where E
s is the flux in a small section and the other terms as described above.
Integration of Equation (13) gives the total flux in the whole area of the decaying stem section E
tots:
The lower limit is at Hr which is Lr = 0 and the upper limit is the distance from Hr to Li or to the ground.
To test how the estimated fluxes conformed to biomass loss from rotten wood, we used the wood density profiles measured from a Norway spruce tree with an advanced stem decay column caused by
Heterobasidion parviporum [
26]. The estimated biomass loss was converted to annual CO
2 flux in kg per square meter by converting the distance between the sampling points to colonization time with the assumption of a constant vertical spread of decay. Huse and Venn [
27] reported a mean vertical spread of 18.5 cm per year for Heterobasidion, but we adjusted this to 17 cm per year, as one of their experimental trees showed an exceptional spread value of 70 cm per year. Details of the calculations are given in the supplementary material. Because the density data were given as kg per m
3, the flux was multiplied by the volume of the section and thereafter divided by the area to give the annual flux in kg CO
2 per m
2.
For up scaling, we employed publicly available data from the National Forest Inventory for the eight counties in Eastern Norway (
Table S1). The county reports contain tables with information about cutting class, site index, the number of trees per hectare, standing volume, basal area, increment, age, as well as the percentage of wood volume with decay. The decay data were obtained from increment cores that extend from bark to pith at breast height; in presence of decay the volume of the tree would be classified as rotten. The number of sample trees in each stratum can be found by the information on the number of temporary sample plots relative to permanent sample plots and the fact that the sample trees at each temporary plot were sampled with a relascope factor of six. By weighing the various stand variables with the number of sample trees, one can join aggregated data for growth and standing volume with data for decay from the same aggregated strata. The mean age of the decay in the trees can in principle be calculated from the percentages of rotten volume provided that estimates of the annual rate of infection can be obtained. In the county Hedmark there are data for the percent of trees with rot in different diameter classes from two inventories, 1995–1999, and 2000–2004. We used the difference in the un-weighted means of rot frequencies as an estimate of the annual rate of infection, 0.30%. Assuming an equal probability of infection for all diameter classes in a stand, the mean age of the rot is estimated by dividing the percentage of rotten volume by the annual rate of infection.
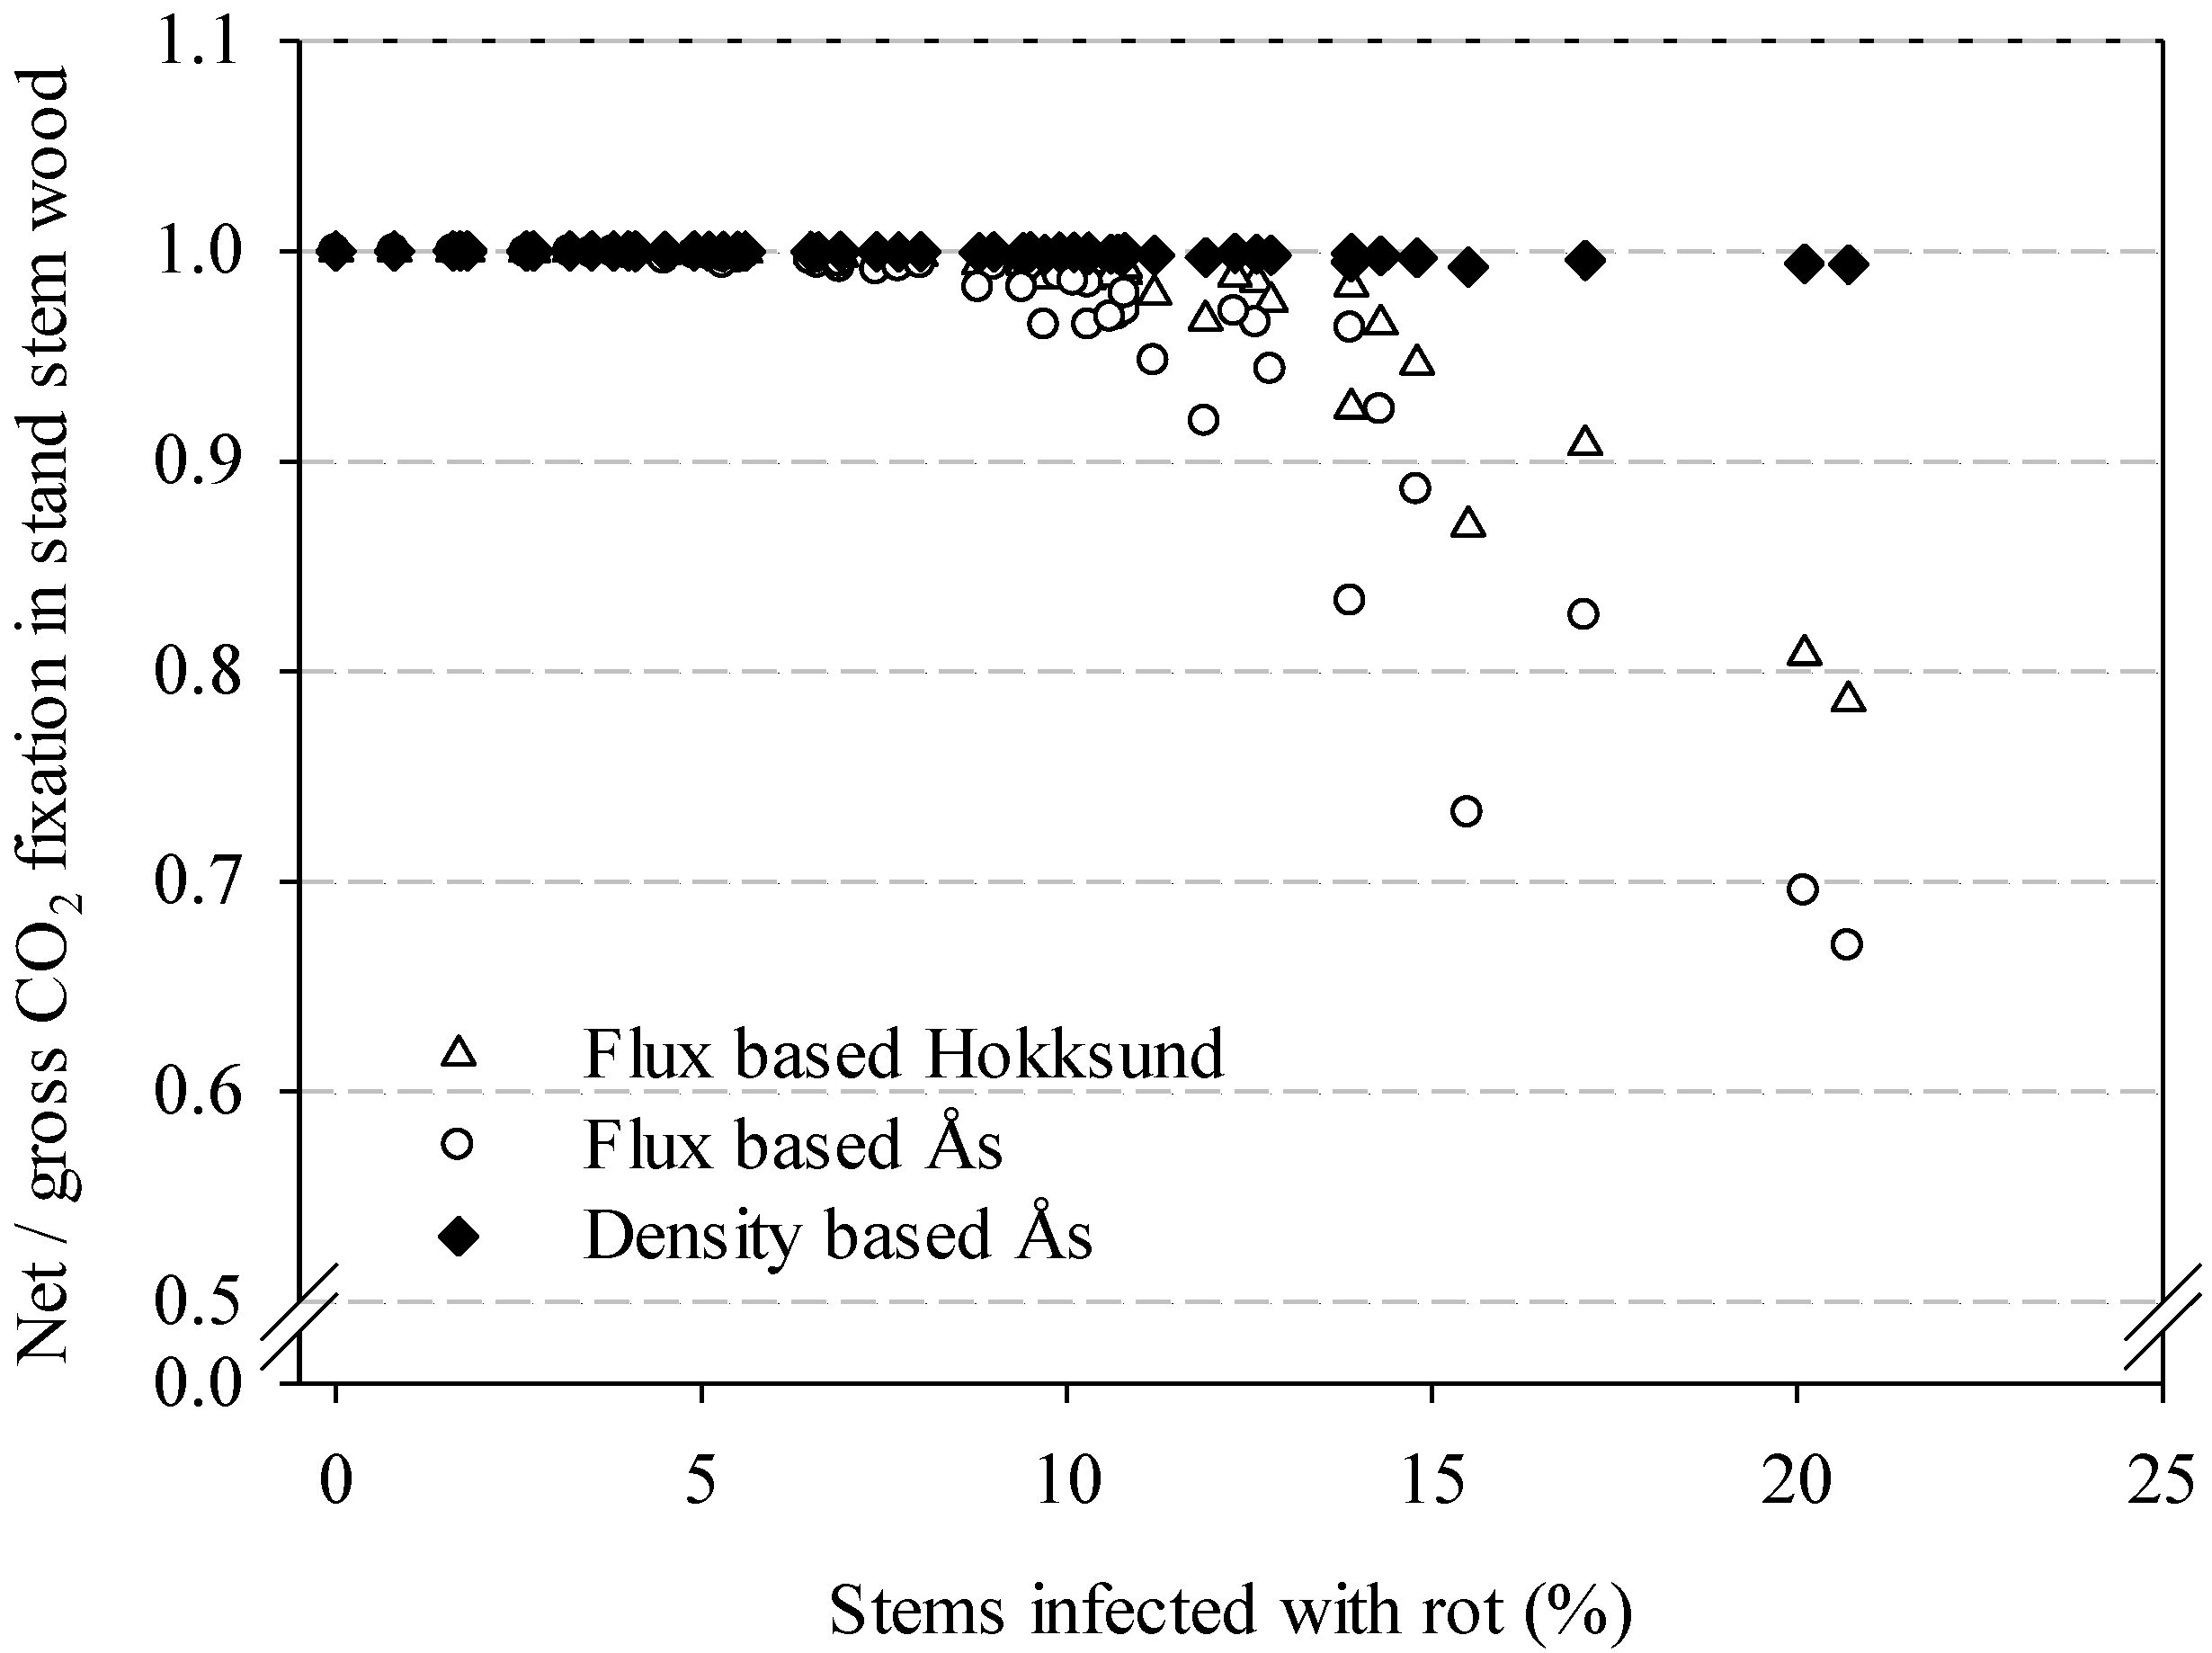
To calculate the net loss of CO
2 from stem wood due to rot, the current annual volume increments taken from the county inventory reports were converted to gross CO
2 fixation in stem wood, GSP
CO2, by multiplying the assumed average wood density of 420 kg by 0.51 (carbon ratio in the wood), and the resulting 214.2 kg by 44/12 (the ratio of the mole weight of CO
2 to carbon). The net production NPP
CO2 was then calculated as:
where RP is the percentage of rotten wood volume taken from the county inventory reports.
The ratio of net CO2 accumulation in stem wood NPPCO2 to GSPCO2, the net-to-gross ratio NGr, was used as a common metrics to assess the impact of rot on CO2 fixation at the stand level in the various counties and strata.
2.7. Statistical Analysis
For practical reasons a stepwise sampling design was used. The decaying and healthy trees at the Ås site which is close to the laboratory were sampled first; the other sites were sampled later. No trees at the Jevnaker sites showed infection by Armillaria sp. and P. chrysoloma was the only decay fungus present in trees at the Haukeli site. Therefore, to get a more balanced comparison of healthy trees and trees infected with the two most common wood rot fungi in Norway, Armillaria spp. and H. annosum s.l., we used the data from the Ås and Hokksund sites where both fungi were present. All heights were not sampled in all trees, for example the healthy trees were sampled only at stump and breast heights. The sampling design is therefore incomplete and imbalanced and involves repeated measurements of the same trees and heights taken at irregular intervals. A mixed model was used for the analysis of the O2 and CO2 mixing ratios and for the CO2 flux data. Site was considered to be a fixed factor, as the sites were selected based on prior knowledge of edaphic factors that influence decay incidence. Trees within site was considered a random factor, because the trees were selected without any prior knowledge of their gas emissions. A first order autoregressive model was used to model the autocorrelation between repeated measurements from the same sampling point. To test if the CO2 efflux was dependent on the height of the sampling position, the CO2 flux data were log transformed and a regression model with distance from the stump height to the sampling point was fitted to the data by taking other effects into account. The Mixed procedure in the SAS System™ (SAS Institue, Cary, NC, USA) was used for the analyses, using the default method to compute error degrees of freedom. Normality of the residuals was checked with the normality tests in Univariate procedure in the SAS System™ and with quantile-quantile (Q-Q) plots.
4. Discussion
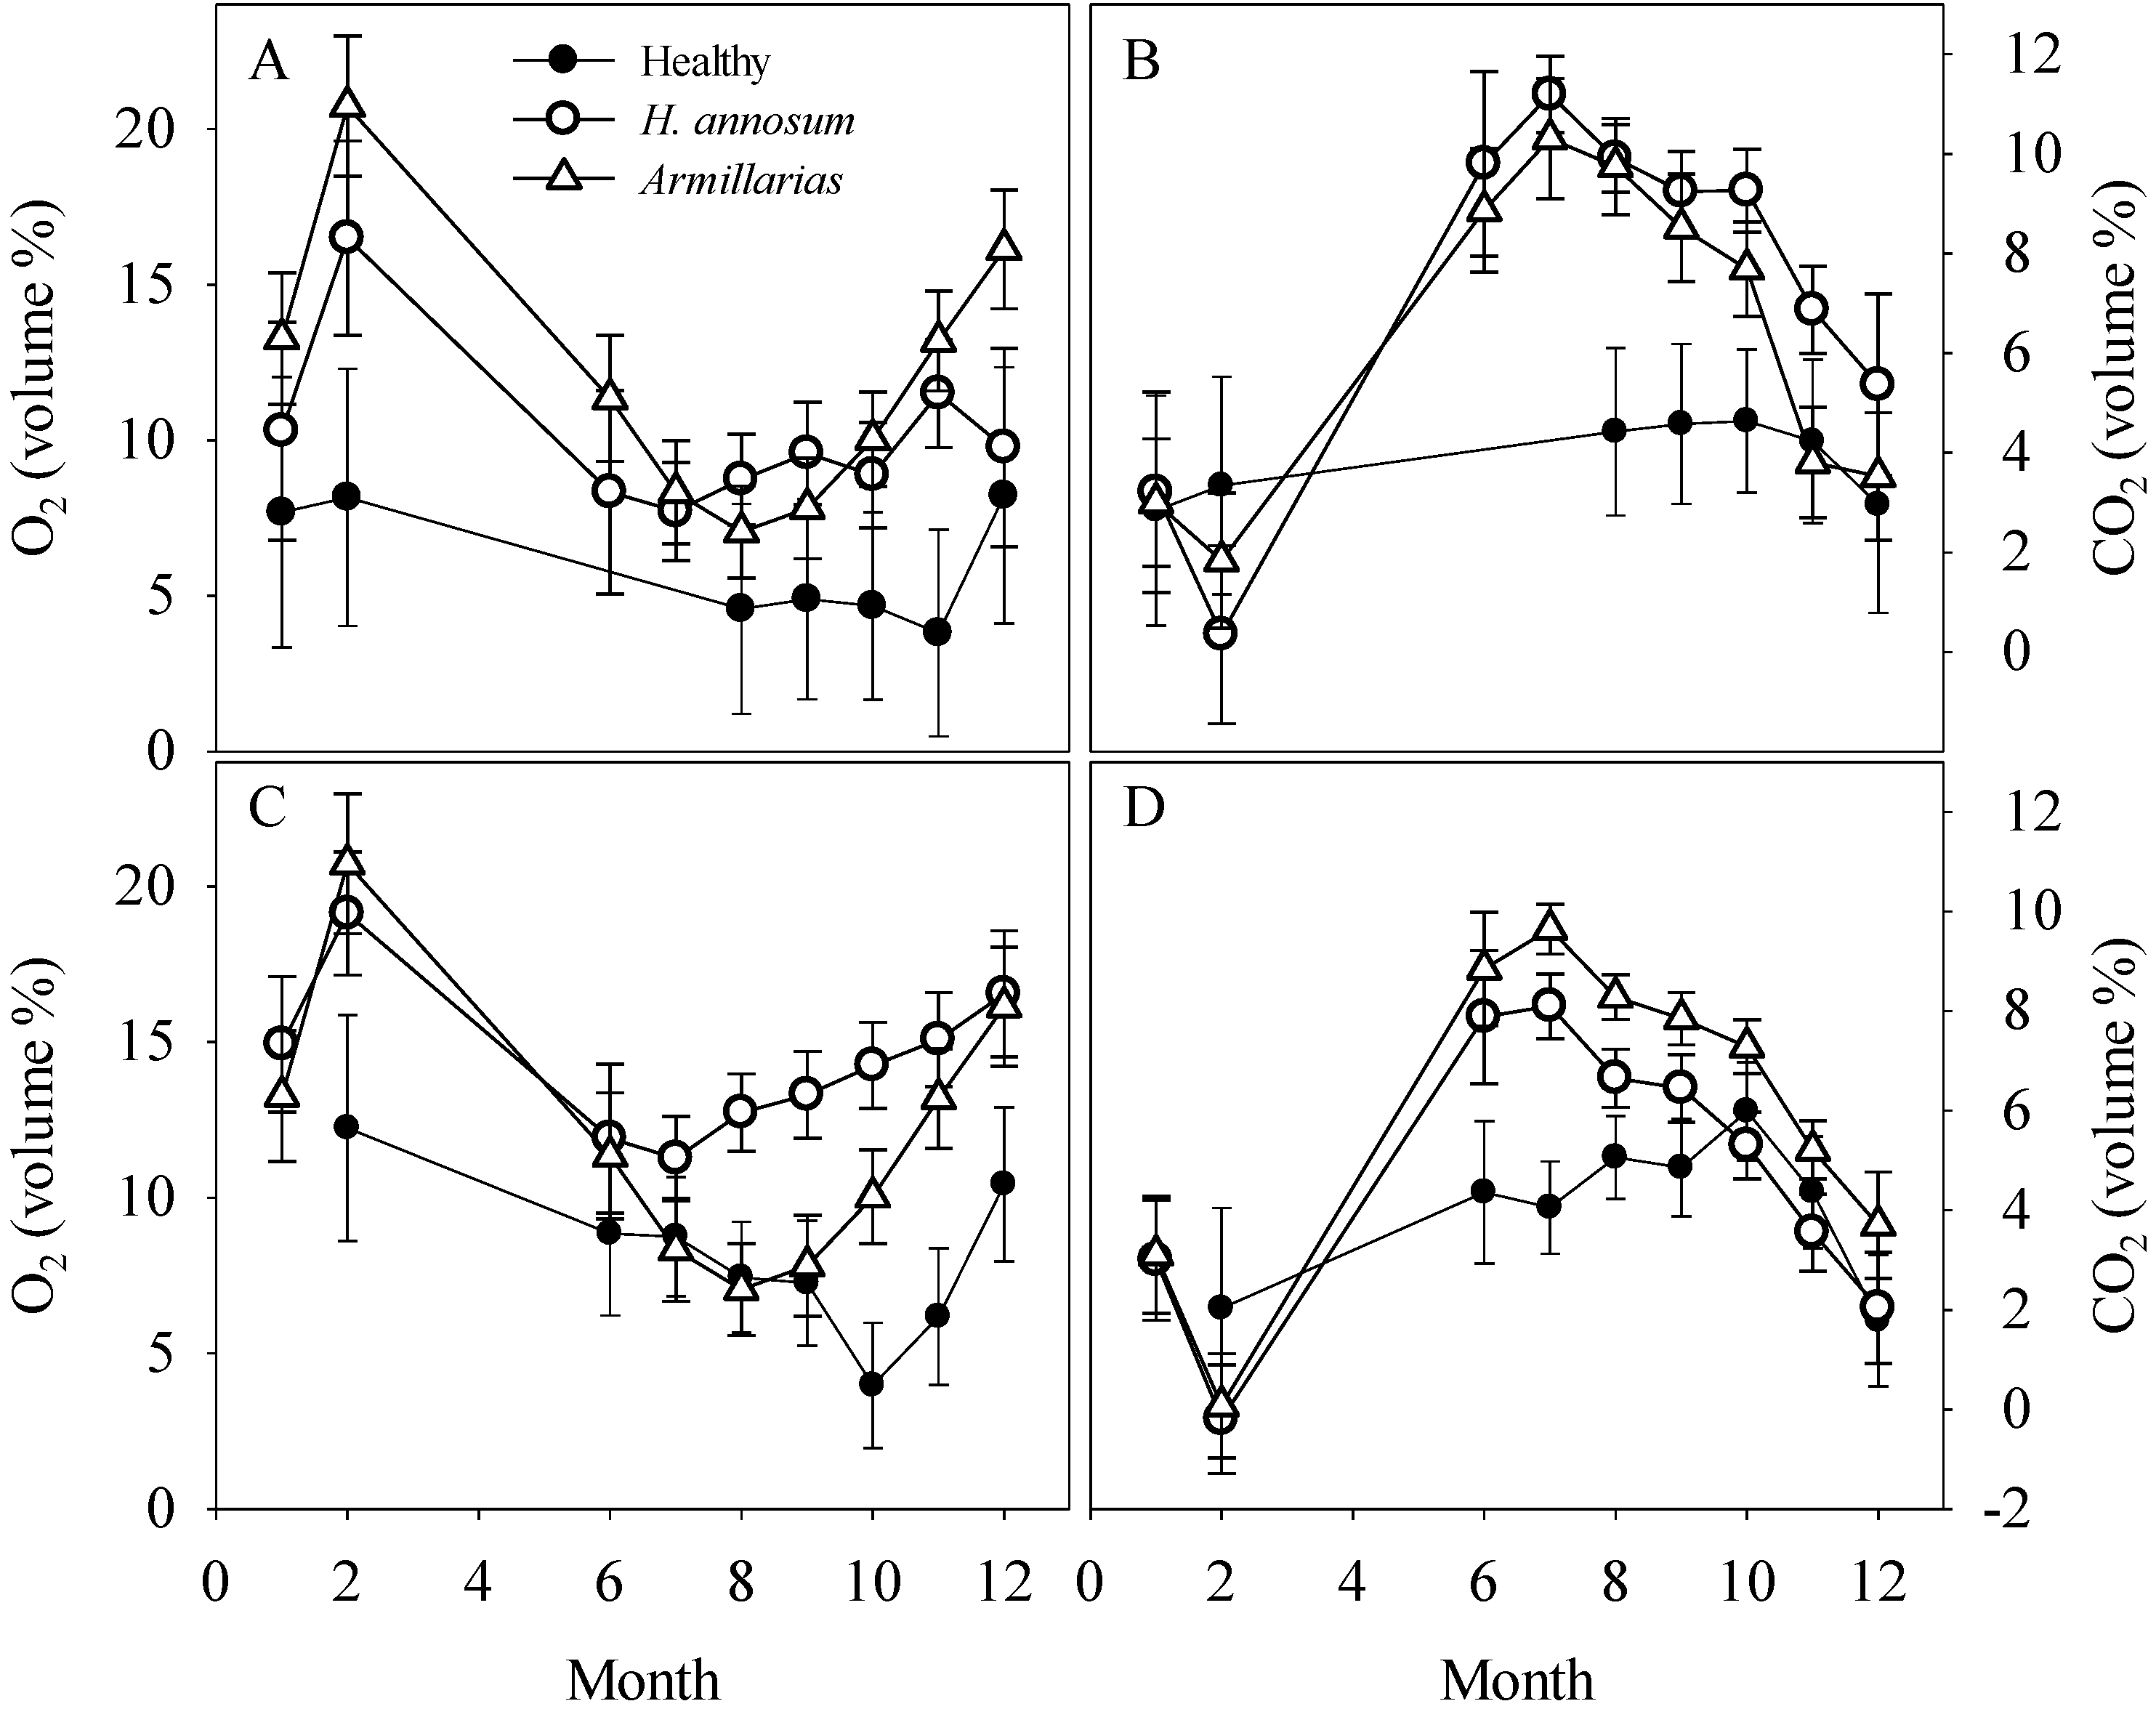
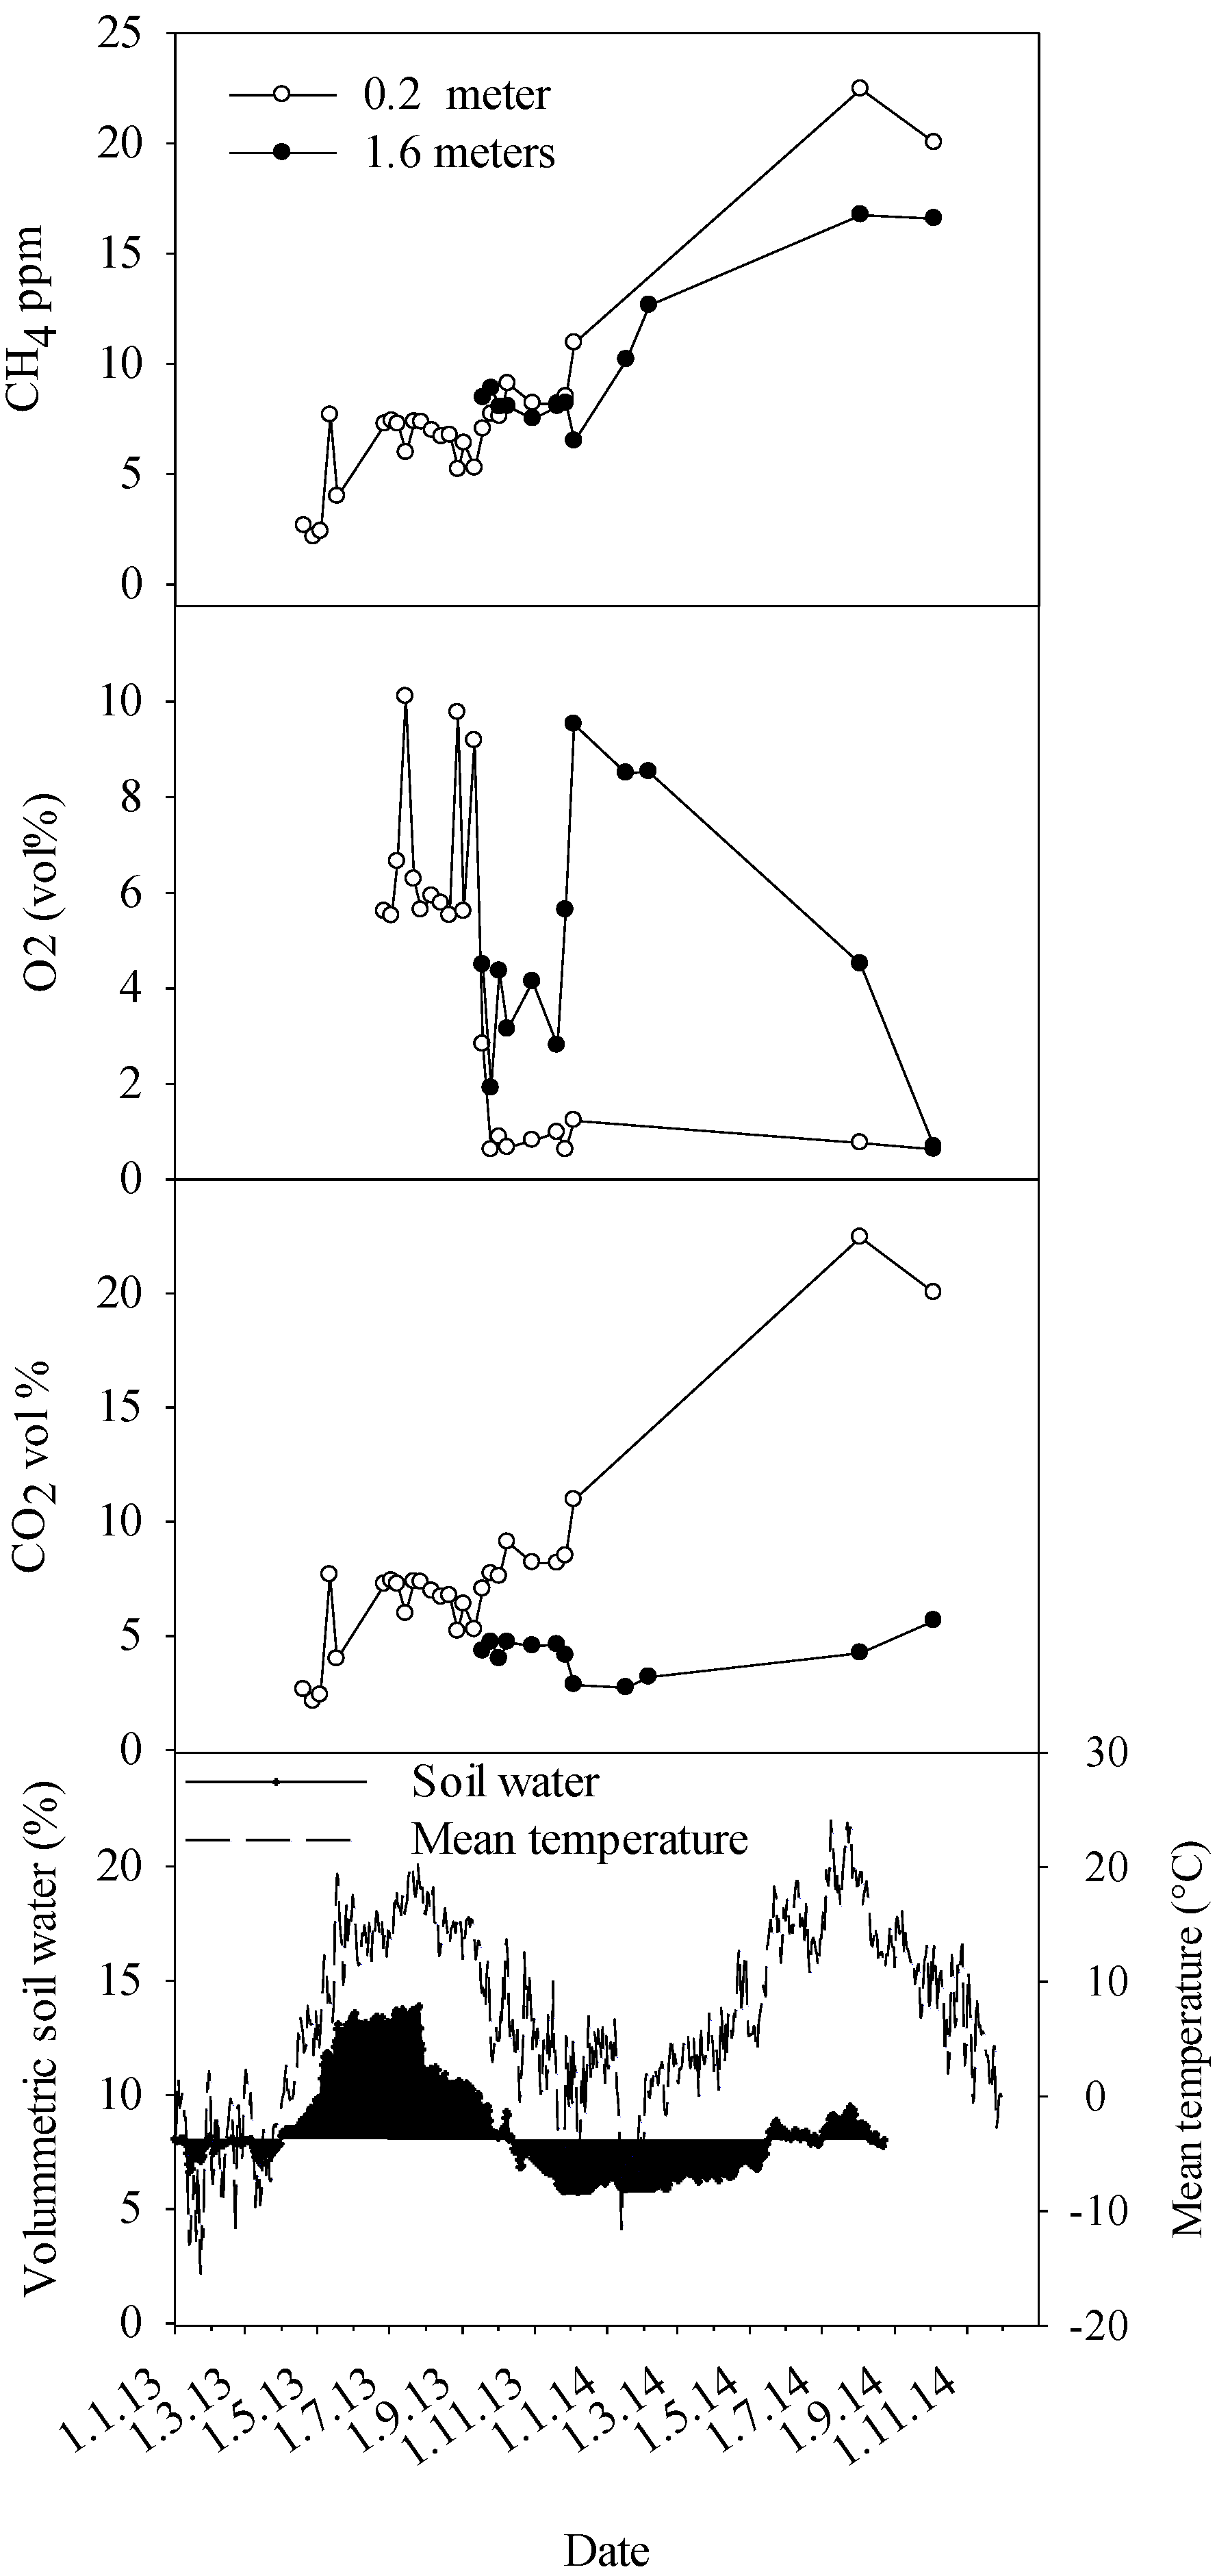
As a result of CO
2 released by respiring living cells and barriers to diffusion of gases in bark and xylem, the concentration of CO
2 in tree stems is strongly elevated above ambient [
28]. The stem concentrations of CO
2 and the seasonal dynamics now recorded in healthy trees are in line with previous studies for Norway spruce [
29] and other tree species [
28]. For trees infected by
Heterobasidion annosum s.l. and
Armillaria species, the most common white-rot fungi associated with heartwood of Norway spruce in boreal forests, the stem concentrations of CO
2 in spring and summer were generally two times higher than those observed for trees without any decay in heartwood. To the best of our knowledge, this is the first report about seasonal fluctuation in gas concentrations in stems of living trees affected by decay. The maximum stem concentrations of CO
2 now recorded for decaying trees, >20%, are two-fold higher than those observed in summertime for saprotrophic fungal species associated with wood logs and stumps [
30].
While the source of the stem gases was not identified by isotope analysis in our study, most of the surplus of CO
2 in stems of trees with heartwood decay obviously resulted from microbial respiration and mineralization of wood; white-rot fungi are the only organisms that are able to efficiently degrade all structural components of wood, the recalcitrant lignin included [
31]. However, during the early phase of host/pathogen interaction, when an antifungal polyphenol-rich host defense tissue forms at the interface between sapwood and pathogen colonized heartwood [
32], part of the excess CO
2 could also be derived from increased use of tree’s energy reserves to build and reinforce this reaction zone. Another point worth noting is the seasonally earlier peaking of stem CO
2 concentrations in the decaying trees in comparison to healthy trees. Considering that heartwood is probably thermally insulated by bark and sapwood, and the fact that the optimal growth temperature of
Heterobasidion species and many other heartwood associated decay fungi is above 20 °C [
13], we presume this difference is due to peaking of fungal respiration during the warmest time of the summer.
When considering the impact of heartrot in living trees on carbon sequestration and emission at tree and stand level, several factors need to be taken into account. First, the growth of the tree may be reduced as a result of root decay and reduction of the conductive sapwood in stem due to extensive heartrot, these eventually resulting in premature death of the tree. Secondly, the decay caused by white-rot fungi may not advance at a linear rate; the elevated O
2 levels observed at stump height in many of the trees with heartwood decay, originating either from increased diffusion of air into xylem due to breakage of decayed main roots by wind rocking and/or transport of oxygen to decomposing heartwood from soil by hyphae or rhizomorphs, can be expected to accelerate degradation of lignin, the rate limiting step during incipient wood decay. Finally, there is uncertainty about the efflux of CO
2 to the atmosphere, as part of the CO
2 formed within stems and branches can be fixed by bark or needle photosynthesis [
28].
Our CO
2 flux estimates amounted to about 70 percent of the values given in a recent study [
25] for healthy trees during the month July to November. There was large temporal variation in the estimates of radial CO
2 diffusion coefficients in the estimated fluxes, as shown by the large standard deviations. However the values of the coefficients (
Table S2) were generally within the range that has been determined experimentally [
23]. Experimental determination showed that the diffusion coefficients in the radial direction vary by four orders of magnitude mostly in response to wood water content. Thus, large variability in the fluxes from trees
in vivo is to be expected. The fairly close agreement with the data from a recent Norway spruce study [
25] suggest, that the method developed here could be suitable for estimating gas fluxes from stem mixing ratios.
It is noteworthy that the maximum decay frequency of 20% used in our models (
Figure 7) corresponds to the observed average decay frequency caused by
H. annosum s.l. in managed Norway spruce forests by the time of final harvest, and that in individual Norway spruce stands the decay frequency can be above 50% [
14,
15]. The up-scaling of CO
2 efflux from
Heterobasidion caused decay to the stand level based on aggregated data for decay frequency and annual volume growth from national forest inventories suggests that root and heartwood decay in living Norway spruce trees can cause a substantial loss of carbon. In stands with low annual growth and high decay frequency the carbon loss due to mineralization of lignocellulose to CO
2 could be sufficient to turn the trees from a carbon sink to a source. There are many uncertainties with the flux estimates and the assumptions about the infection and spread rates. For practical reasons, we could not start sampling at the same time at all sites, and some additional trees and heights were also included as the sampling progressed. To minimize the potentially confounding effects of differential sampling on the flux calculations, we chose to use samples only from the sites Ås and Hokksund and the months July to November in 2013. This half-year period is obviously a very limited time to make strong inferences about biological processes that can vary with temperature, humidity and other factors. The results from the flux based and the density based up-scaling differed considerably; the former suggested that wood decay has a large impact on net CO
2 fixation, while the latter suggested a minimal effect. The difference could be due to systematic errors in both methods or due to real variability between sites, years, and trees. Regarding the latter, Huse and Venn [
27] observed more than ten-fold difference in vertical spread of
H. annosum between different trees, and thus large variation in the biomass breakdown rate and CO
2 fluxes between trees is quite possible. Therefore the estimates presented in
Figure 7 serve above all as an illustration of a potential effect. It is worth noting that both the CO
2 flux based estimates and the wood density based estimates decline exponentially with the distance away from stem base where the infection is oldest, this implying that biomass loss accelerates with the duration of the infection. However, when most of the substrate in the heartwood has been consumed, the CO
2 flux should eventually decline. Consequently, to obtain reliable carbon budgets for young and mature forest stands, the frequency, type and stage of decay in living trees need to be taken into account.
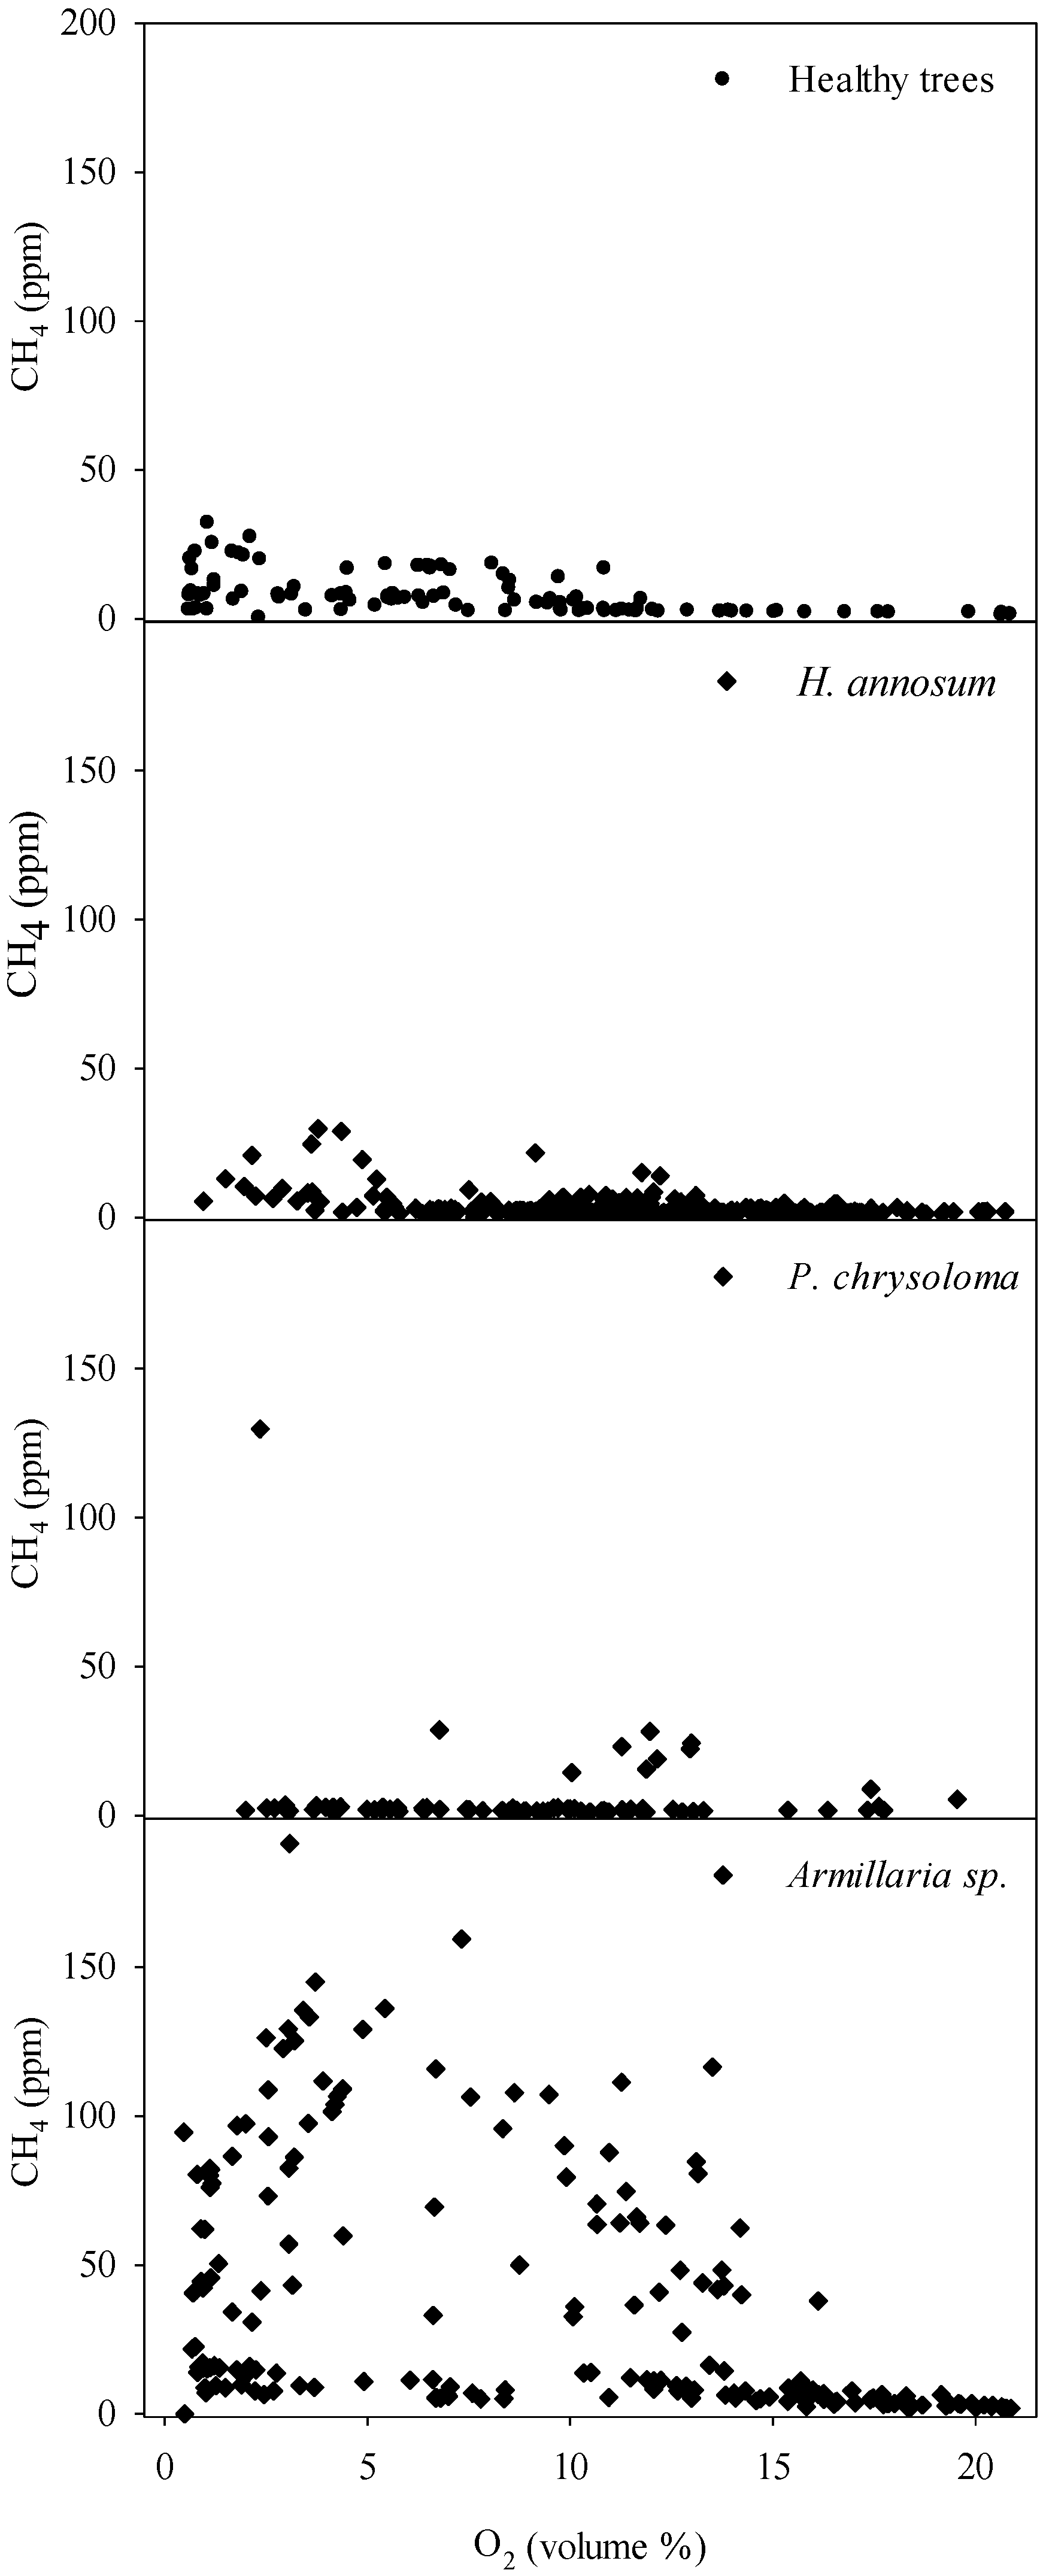
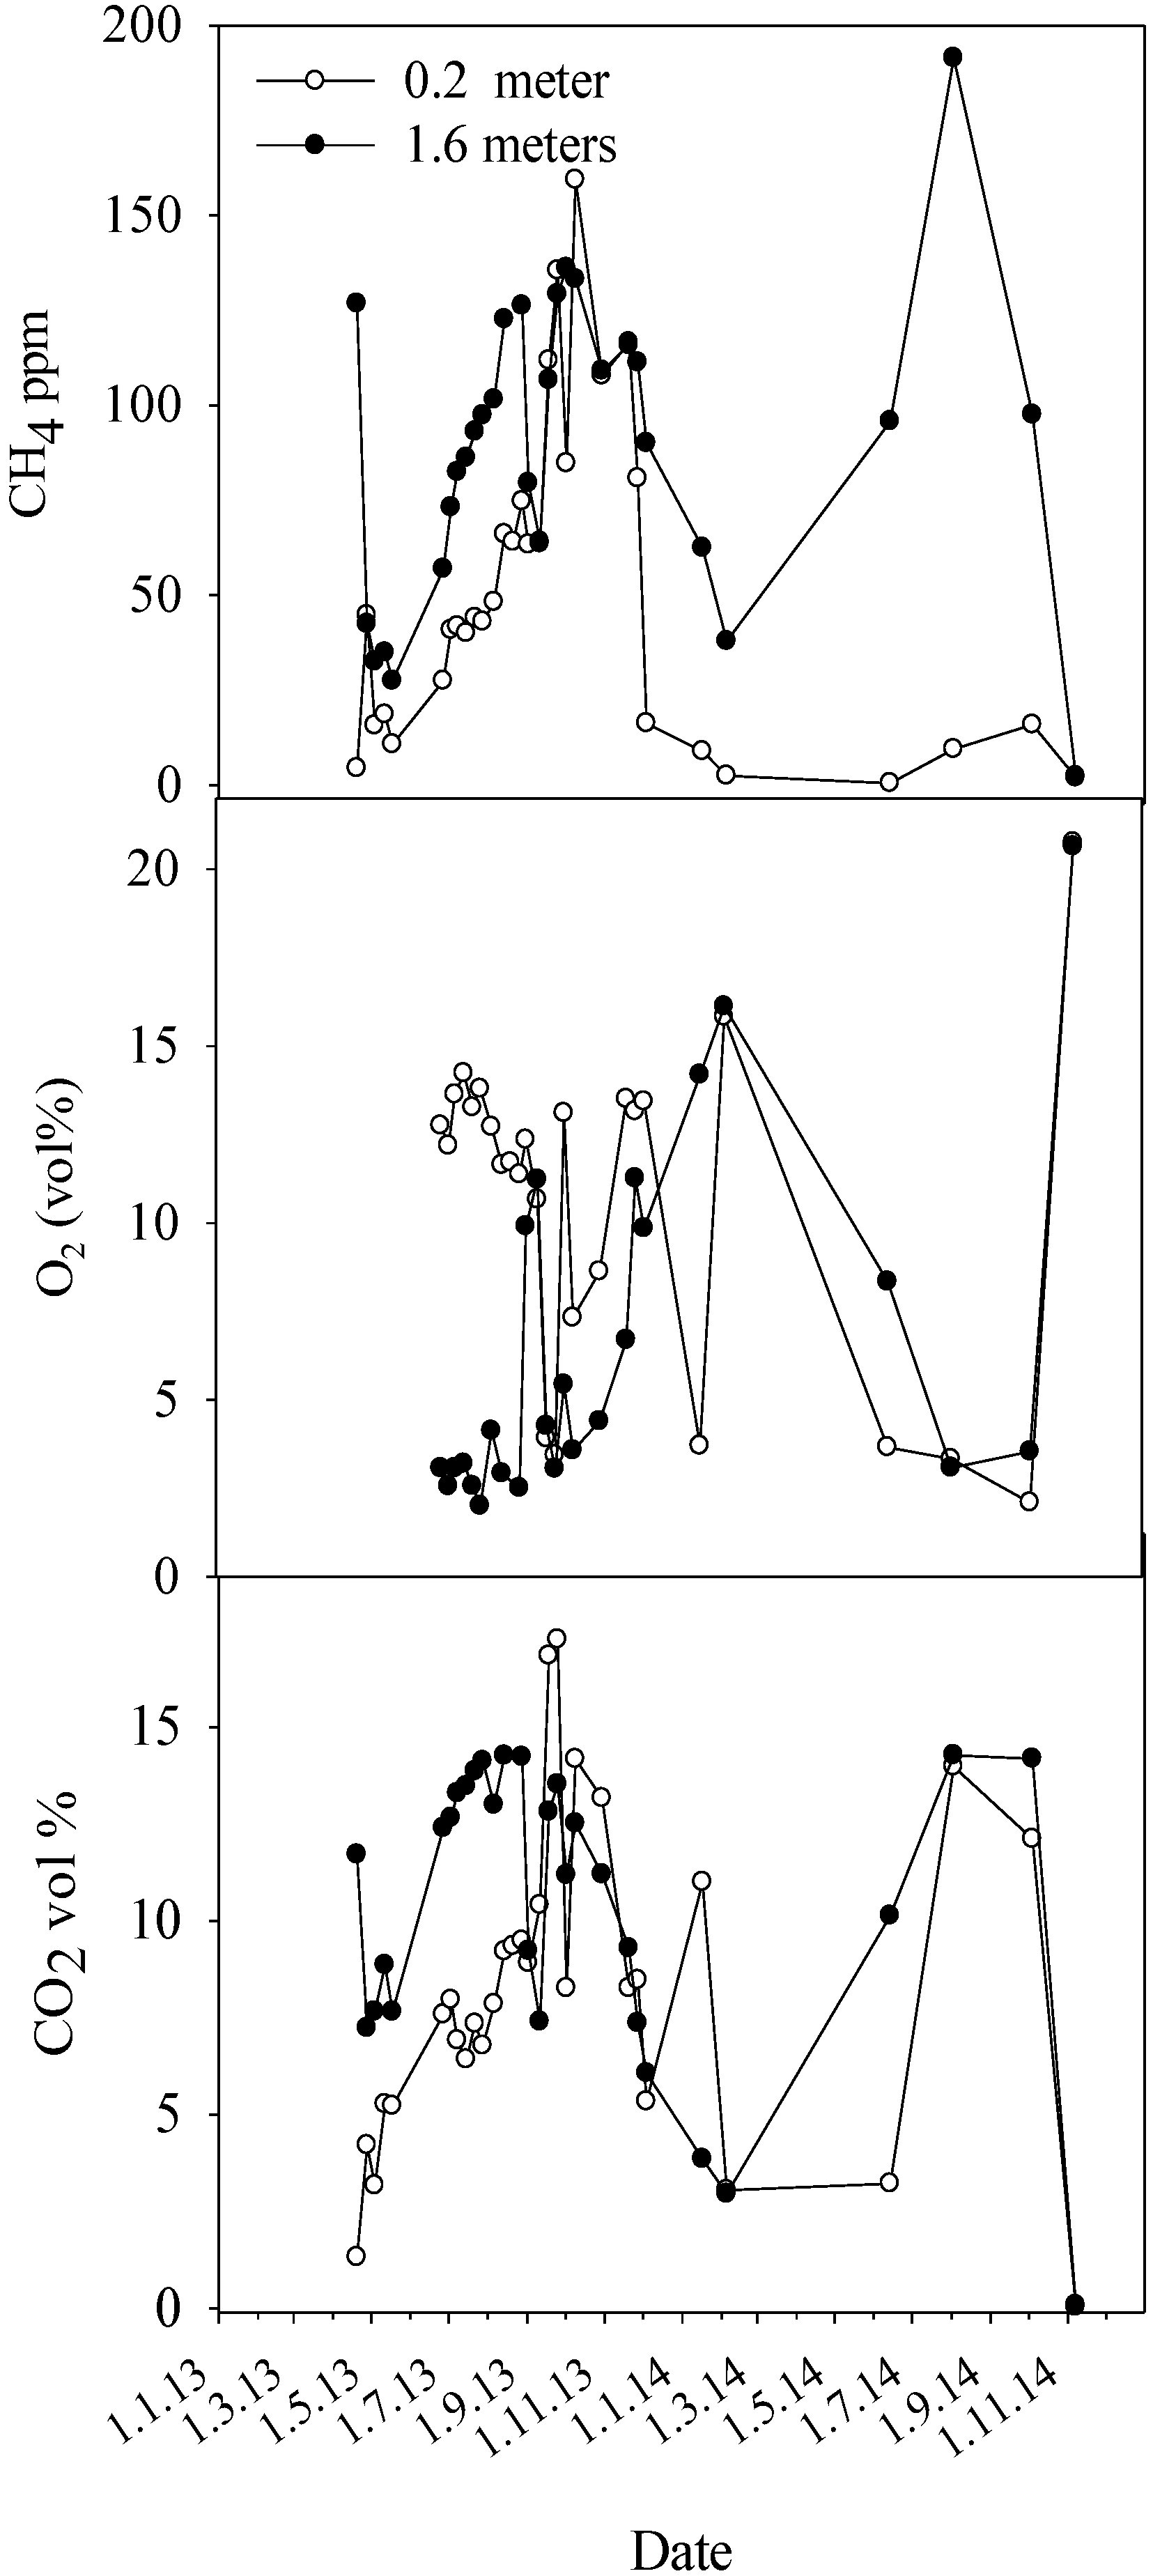
Regarding methane, healthy Norway spruce and trees with heartwood decay caused by
Heterobasidion annosum s.l. showed comparable stem concentrations of CH
4, around 30 ppm at maximum. Contrastingly, trees infected by
Armillaria species showed frequently 3–4 times as high CH
4 levels. We are not aware of any earlier reports about stem concentrations of CH
4 in Norway spruce or any other tree species infected by
Heterobasidion and
Armillaria spp., fungi able to infect a wide range of conifer and broadleaved trees. As proposed in earlier studies, under microaerobic or anaerobic conditions, intermediate degradation products from fungal degradation of lignocellulose may provide substrates for bacteria and archaea [
9,
10], which in turn can accelerate fungal growth by removing their metabolic waste products and by enriching the substrate through
N-fixation [
11]. The apparent lack of correlation between stem CH
4 and O
2 concentrations in trees with elevated CH
4 levels is noteworthy, and is probably due to the utilized point measurements, which profile the composition of gas diffusion stream that includes also the CH4 produced at anaerobic microsites. When comparing the differences in ecological range and behavior between
Armillaria and
Heterobasidion species, Shaw [
33] stressed that
Armillaria species are frequently associated with water-logged trees, have the ability to transport oxygen in the air channels of rhizomorphs that are commonly formed in decayed heartwood, and that their mycelial growth is highly stimulated by ethanol, an anaerobic microbial but also plant fermentation product. These features may suggest that
Armillaria species are better adapted to grow and feed under anaerobic conditions than
Heterobasidion species. The potential interplay between anaerobic bacteria and archaea, and
Armillaria species at anaerobic/aerobic sub-surfaces of wood tissues upon lignocellulose decomposition remains to be clarified.
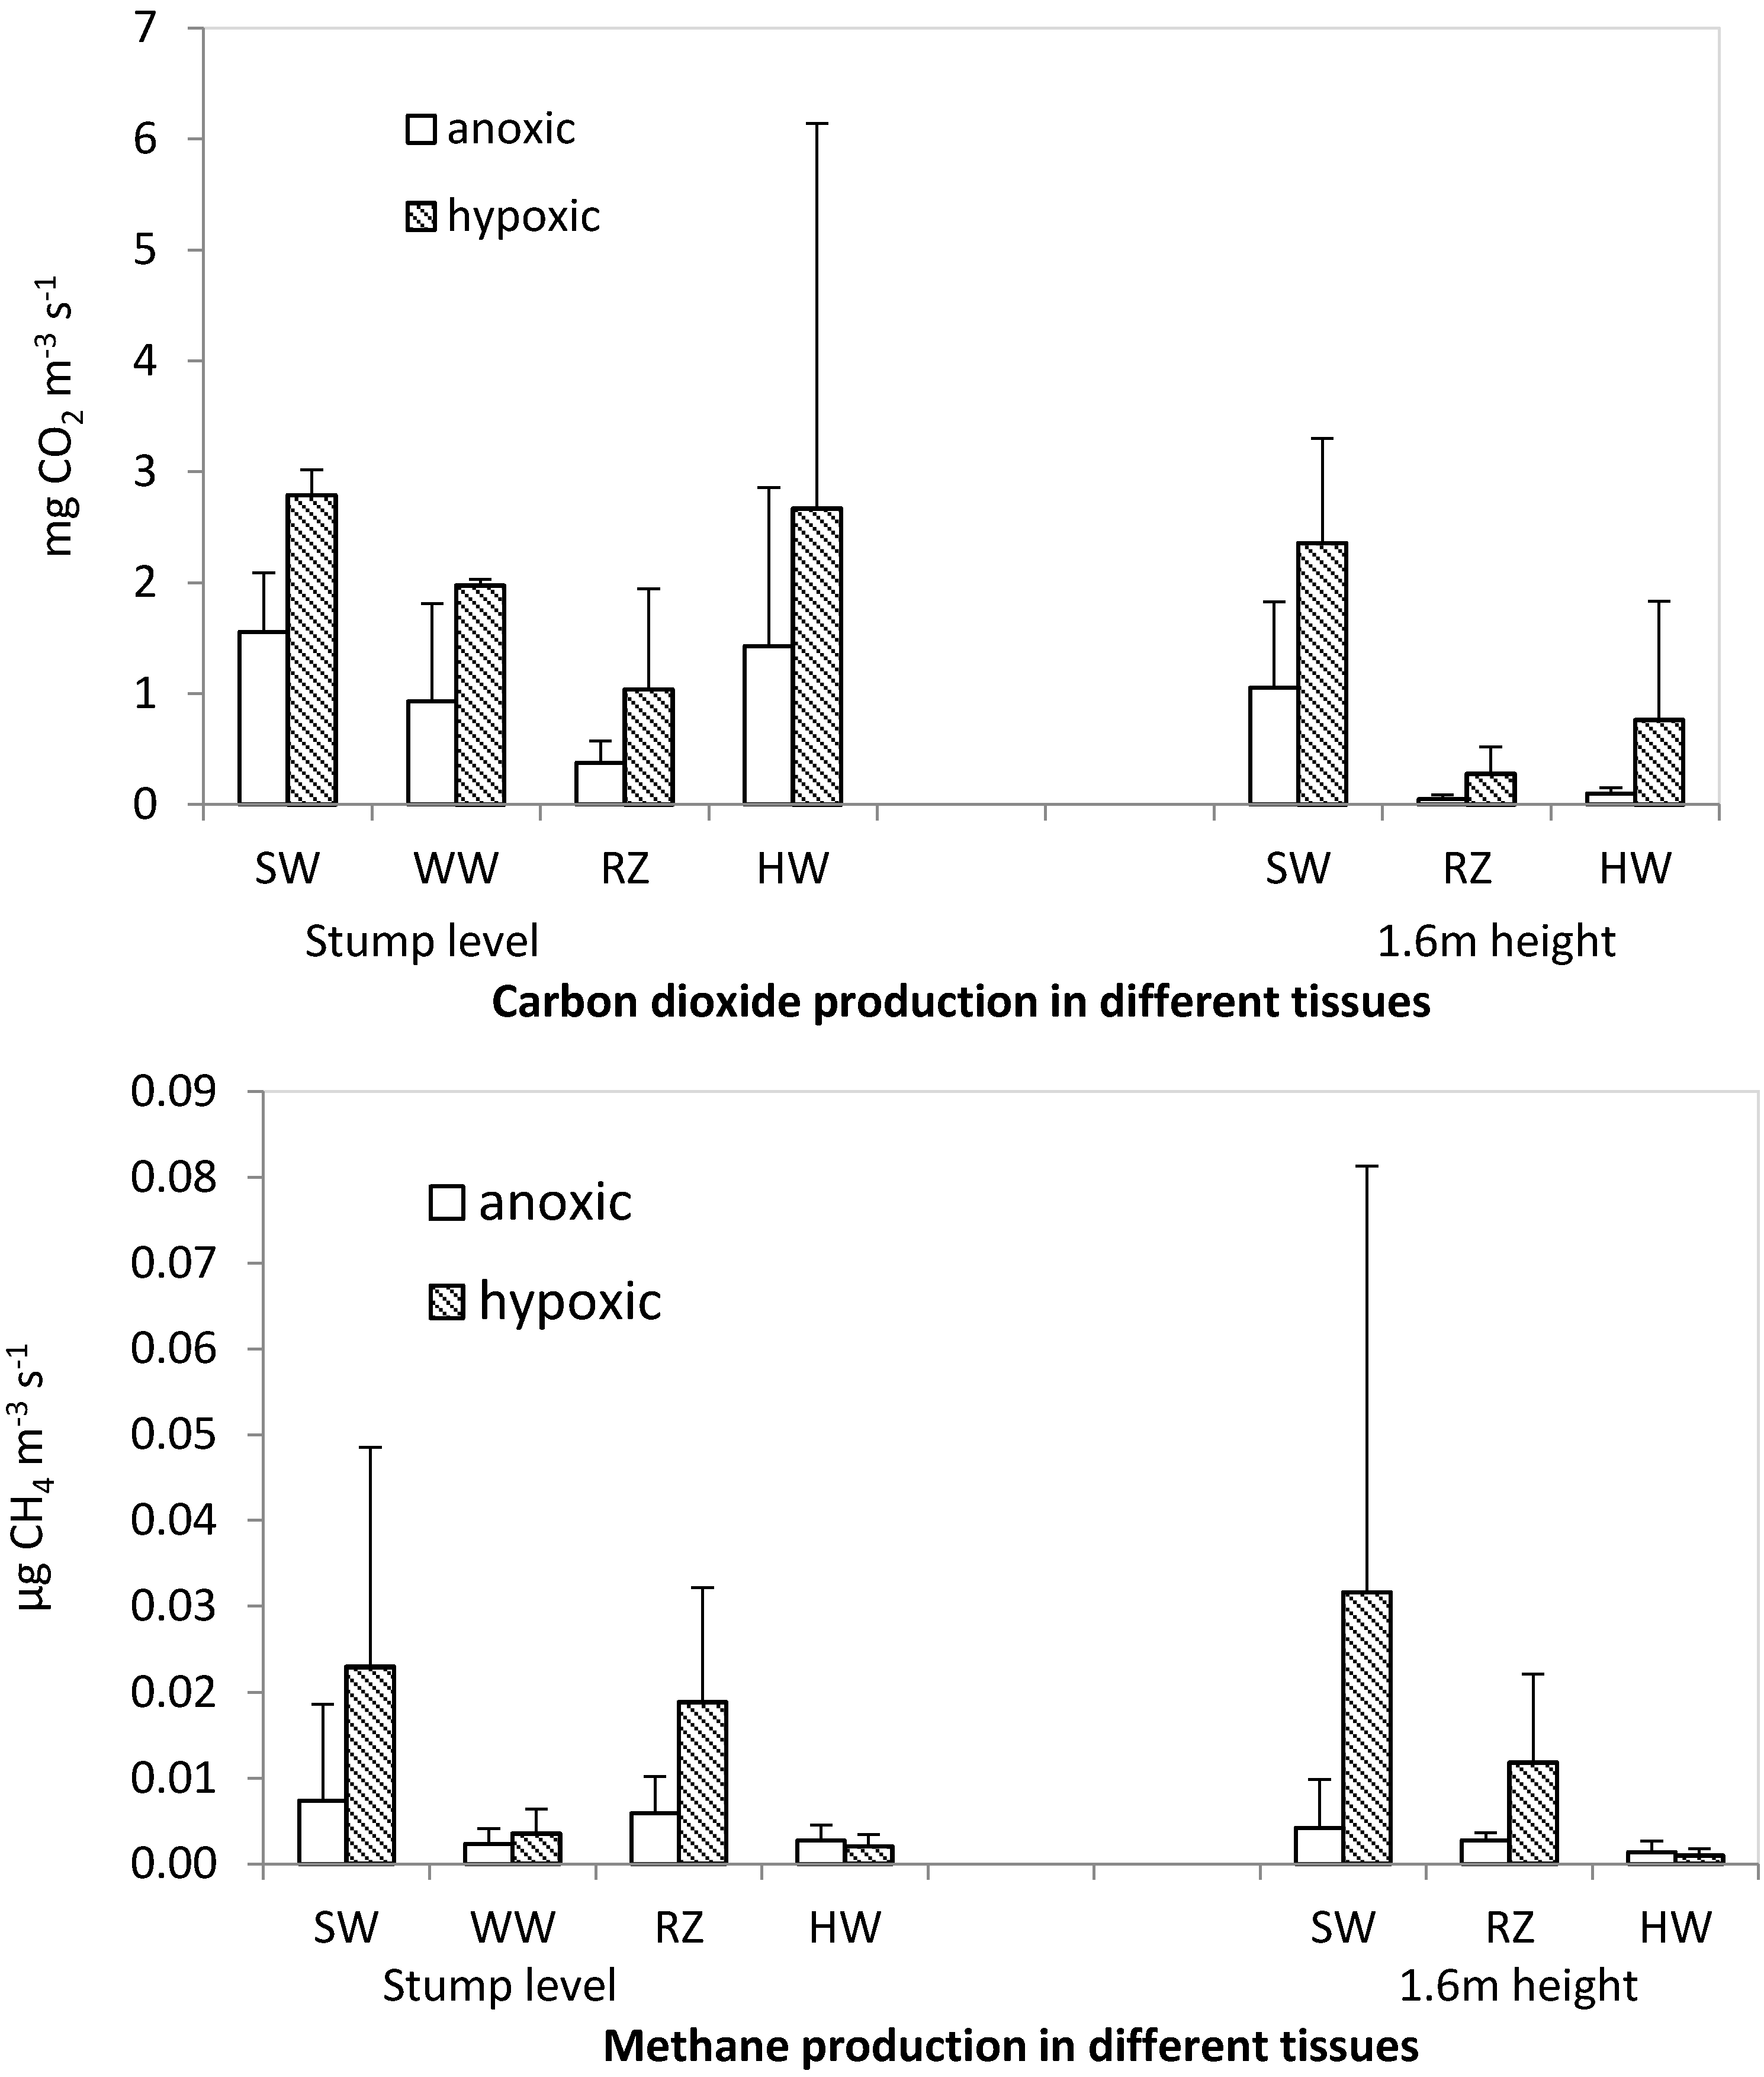
Similarly to the low mixing ratios of CH
4 and CO
2 recorded within Norway spruce stems, a low production rate of CH
4 in comparison to that of CO
2 was observed in the laboratory experiment, where selected tissue types were incubated under anoxic or hypoxic conditions. At an upland site in temperate forest, mean stem concentrations of CH
4 in three broadleaved trees (red maple, red oak, black birch) during the growing season were above 15,000 ppm, whereas the conifer
Pinus strobus showed only negligible stem concentrations of CH
4 and a mean production rate of 0.067 μg CH4 m
−3·s
−1 under laboratory incubation [
34], a level essentially similar to that observed for healthy Norway spruce wood in the present study. Covey and coworkers [
34] proposed that the high CH
4 levels in broadleaved trees originated from methanogenesis by archaea within the tree stem and that microbial infection of living trees might result in substantial biogenic production of CH
4 also in upland forests. In the study of Mukhin and Voronin [
35] substantially higher production rate of CH
4 from decaying birch and pine wood than those recorded for Norway spruce in the laboratory experiment of the current study, which they attributed to progressive wood degradation by decay fungi and anaerobic microbes. In contrast to these studies, our data does not indicate that Norway spruce, when growing on well-drained stands and whether healthy or showing heartwood decay caused by white-rot fungi, plays any significant role in biogenic
in situ production of CH
4, or in its transport from a biogenic source in soil. The reasons for the large variation in stem CH
4 concentrations between different tree species growing on well-drained soils remain to be clarified but this variation may relate to tree-species specific differences in the amount of xylem-associated anaerobic microsites that support methanogenic archaea.
Regarding the pattern of CH
4 production among different wood tissue types determined in the laboratory experiment, healthy sapwood and reaction zone produced clearly more CH
4 under hypoxic conditions than anoxic ones. The observed anoxic production of CH
4 in these tissues does not preclude a biogenic origin but the elevated CH
4 production rate under hypoxic conditions rather points towards production through a chemical mechanism. Several studies [
36,
37,
38] have shown production of CH
4 from plants under stress and provided evidence that it could be derived from action of free radicals on plant cell wall components such as pectin. A similar mechanism could account for the now recorded methane production from healthy sapwood. One could envisage that CH
4 generation from trees through such a mechanism could be the highest in timber logged during spring, summer and autumn when the wood is not frozen. However, if the magnitude of CH
4 production in logged timber is at a similar level as now observed in the laboratory experiment, the production rate of CH
4 through a biochemical mechanism in timber of Norway spruce can also be considered as insignificant.


