Article

Tree- and Stand-Level Thinning Effects on Growth of European Beech (Fagus sylvatica L.) on a Northeast- and a Southwest-Facing Slope in Southwest Germany

by
Daniela Diaconu
*,
Hans-Peter Kahle
and
Heinrich Spiecker
Chair of Forest Growth, Albert Ludwigs University Freiburg, Tennenbacher Str.4, D-79106 Freiburg, Germany
*
Author to whom correspondence should be addressed.
These authors contributed equally to this work.
Forests 2015, 6(9), 3256-3277; https://doi.org/10.3390/f6093256
Submission received: 7 August 2015 / Revised: 11 September 2015 / Accepted: 15 September 2015 / Published: 21 September 2015

Abstract

:
Anticipated changes in climate and research findings on the drought sensitivity of beech have triggered controversial discussions about the future of European beech. We investigated the growth response of beech on the tree- and stand-level in mature stands to three different thinning intensities (no thinning, strong thinning, very strong thinning) on a northeast- and southwest-facing slope in Southwest Germany. Linear mixed-effects models were formulated to describe effects on growth parameters on the tree- and stand-level (diameter, height, basal area, volume). At the stand-level, the stand basal area increment and stand volume increment were lower on the thinned plots. At the tree-level, the basal area increment significantly increased with increasing thinning intensity. The growth of individual trees was also influenced by initial tree size, the size-related rank of the tree within a stand, and by the aspect of the site. Our data indicate that growth of European beech is impaired on the southwest-facing slope with a warmer and drier climate and that a very strong thinning regime applied at advanced age can accelerate growth of European beech trees even on the warmer and drier site. Our findings, therefore, imply that in a warmer climate intensive thinning may also represent an important adaptive forest management measure in European beech stands.

1. Introduction

European beech (Fagus sylvatica L.) is the most abundant broad-leaved forest tree species in Central Europe [1,2]. Due to its high ecological and economic value it is one of the most favored hardwood tree species for forest management. The importance of beech for European forests demands profound research to examine its sensitivity and resilience to changing environmental conditions.
In its fifth assessment report the Intergovernmental Panel on Climate Change (IPCC) [3] states that in the last century the average global surface temperature has increased by approximately 0.7 °C. In the last 50 years the global warming rate has accelerated at approximately 0.13 °C per decade, almost double the rate of the previous 100 years [3]. Extreme climatic events, such as the dry years of 2002 and 2003, with 2004 reported as the warmest years since 1850 [4], are considered warning signals of climate change. In Central Europe climate change projections indicate an increase in winter precipitation, a decrease in summer precipitation and, consequently, a higher intensity, duration, and frequency of summer droughts [5]. Since weather and climatic conditions significantly affect tree growth [6,7,8] seemingly minor changes in air temperatures and precipitation can seriously impact forest growth. Moreover, the anticipated increase in extreme events will most likely lead to a reduction in forest growth and yield, and cause higher mortality rates, with major consequences for the forest industry sector [9,10,11,12]. Several studies provide evidence for low tolerance of European beech to drought [2,13,14,15,16]. Hence, there is a potential risk of habitat loss for this tree species under climate change projections.
Whereas climate change effects on growth of European beech have been investigated quite intensively [10,12,13,17], uncertainties remain concerning the potential of silvicultural treatments to increase adaptive capacity of European beech forests to the anticipated climate changes. Previous research on growth of beech on medium elevation sites in Southwestern Germany [18] has shown higher growth rates on northeast (NE) than on southwest (SW) facing slopes. Analyses of wood formation, wood density, and radial growth demonstrated that drought is a major growth-limiting factor for beech [19]. Furthermore, eco-physiological studies, which investigated carbon isotope sequestration or water and nitrogen status on opposite slopes, confirmed that beech trees on SW-exposed sites are impaired in growth and water balance during periods with low rainfall [20,21].
Stem dimension and stem quality are decisive criteria for valuable timber production. Consequently, forest stand management practices and, especially, thinning are important for the production of high-quality timber. It is well known that thinning has a significant effect on forest growth and yield [22,23,24]. At high competition levels trees show higher sensitivity to changes in water balance, whereas through thinning growth limitation by water and nutrient availability is reduced [25]. Particularly for European beech, the intensity of competition has a strong effect on growth patterns and climate-growth responses of individual trees [26,27]. Furthermore at low stand density, wood formation in European beech stands extends over longer growing periods [19,28,29].
Knowledge of the interactive effect of thinning and climate on the growth response becomes crucial for the selection of appropriate silvicultural treatments under projected global warming [27]. The question is where, how, and when to intervene with silvicultural measures in European beech valuable wood production systems in order to minimize the effect of droughts, and to increase the resilience of the stands. Moreover, questions regarding the appropriate thinning methods and thinning intensities for increasing the adaptive capacity of beech stands need to be evaluated in the light of anticipated climate change. Will thinning have the same effect of accelerating tree growth in a more extreme climate? Do we have to change the thinning regime?
In this study we analyzed the growth response of European beech at tree- and stand-levels in respect to different thinning intensities and tested whether the growth response is modified by aspect. Our hypotheses are that (1) the thinning effect differs between NE- and SW-aspect; (2) although a strong crop-tree thinning regime will considerably reduce stand basal area, it will promote growth of the crop-trees and would be a favorable option for high-quality timber production; and that (3) in a more extreme climate with longer seasonal drought, intensive thinning from above is a forest management measure which can increase the stability and adaptive capacity of European beech stands.

2. Materials and Methods

2.1. Description of the Experimental Site

The study area is located in a beech-dominated forest in the Swabian Alb, a low mountain range in Southwestern Germany (longitude 8°40′ E; latitude 48°00′ N). Experimental sites are situated on two opposite-exposed slopes: NE and SW aspects of a narrow valley. The research sites are not more than 1000 m apart. The regional climate in the area is semi-continental, with mean annual air temperature of about 7.0 °C, and annual precipitation of 900 mm (over the period 1961–1990) [30,31]. Rainfall does not vary significantly across the valley [32]. On the NE facing slope net incoming radiation is significantly lower than on the SW facing slope [30]. At both sites, the soil profiles are characterized as Rendzic Leptosols (WRB-classification, ISSS 1998). The soil layer is shallow on both sites. On the SW facing slope the soil profile is particularly rocky (Table 1) [33,34].
Table 1. Characteristics of the research sites.
SlopeElevation (m a.s.l.)Inclination (°)Aspect (°)Soil Profile (% of Rocks)
<0.2 m>0.5 m
NE82023601530
SW7603024020–4580
On both aspects European beech is the dominant tree species (>90% of species composition). The stands are mature, naturally-regenerated stands with an average age of 80–100 years [28]. The site index of the stands on the NE aspect is higher than on the SW aspect. Mean annual volume increment (MAI) at base age 100 years is 6.0 m3/ha/year on the NE and 4.2 m3/ha/year on the SW aspect (ranging from 4.1 to 6.8 m3/ha/year on the NE, and 2.8 to 4.7 m3/ha/year on the SW aspect). MAI values refer to 2012 (values for 1999 are given in Spiecker [18]). Radiation interception at the canopy layer is higher on the SW facing slope, causing higher temperatures, higher evapotranspiration and, therefore, lower water availability [35]. The study area resembles a model ecosystem where the current climate typical for the majority of beech forests in central Europe is represented by the relatively cold and wet NE aspect, and the SW aspect is considered an analogue to the climate projected for the next 50 to 100 years [31].

2.2. Thinning Treatments

The experimental plots were established in the winter of 1998–1999 and the applied thinning type was crop-tree thinning. The crop-trees were pre-dominant to dominant trees selected according to vitality, i.e., stem diameter in relation to neighboring trees, and stem quality. The thinning was conducted with regard to the removal of competing trees in favor of the crop-trees. The experimental design includes three different thinning treatments on each aspect: a very strong thinning (VT) which reduced stand basal area (G) to 10 m2/ha, a strong thinning (ST) which reduced G to 15 m2/ha, and no thinning (control, CT). Each treatment is replicated twice on the SW aspect and three times on the NE aspect. The experimental layout is a randomized block design. With the exception of two plots on the SW aspect (ST and VT plots) with an area of 0.7 ha, all experimental plots have an area of 0.53 ha each. During the analyzed period (1999 to 2012) only one thinning has been applied, at the beginning of the experiment (1999). At this stage, the mean stand diameter at breast height, the mean stand height, and the mean stand basal area before the thinning were 25.6 cm, 26.6 m, and 25.4 m2/ha on the NE aspect and 21.5 cm, 21.0 m, and 22.4 m2/ha on the SW aspect, respectively (Table 2).
Table 2. Stand parameters—number of trees per hectare (N), quadratic mean diameter (dg), diameter of dominant trees (dg dom), height of the tree with mean basal area (hg), height of dominant trees (hg dom), stand basal area (G) and stand volume (V) with standard deviation before and after the thinning (BT, AT) and at the end of the analyzed period for all treatments, control (CT), strong thinning (ST), and very strong thinning (VT).
AspectParameterYearCTSTVT
NEN (trees/ha)1999 (BT)464 (43)484 (112)537 (129)
1999 (AT)464 (43)216 (30)145 (29)
2012453 (45)214 (29)140 (23)
dg (cm)1999 (BT)26.2 (0.60)25.6 (2.15)25.0 (3.01)
1999 (AT)26.2 (0.60)29.7 (2.38)30.6 (3.85)
201230.7 (0.72)37.1 (2.56)39.9 (2.91)
dg dom (cm)1999 (BT)34.0 (0.11)34.5 (2.10)33.8 (0.21)
1999 (AT)34.0 (0.11)33.3 (2.10)30.5 (0.21)
201239.9 (0.72)41.3 (2.17)40.4 (0.56)
hg (m)1999 (BT)26.1 (1.21)27.1 (1.47)26.9 (3.42)
1999 (AT)26.1 (1.21)28.3 (1.51)28.2 (3.27)
201229.4 (0.78)31.0 (1.47)30.7 (2.25)
hg dom (m)1999 (BT)28.3 (1.80)29.3 (1.53)26.9 (0.20)
1999 (AT)28.3 (1.80)29.2 (1.53)26.8 (0.20)
201231.7 (0.45)32.0 (1.32)29.9 (0.45)
G (m2/ha)1999 (BT)25.1 (1.75)25.0 (3.10)26.1 (4.09)
1999 (AT)25.1 (1.75)14.6 (0.43)10.3 (0.30)
201233.4 (1.70)22.4 (0.50)16.9 (0.78)
V (m3/ha)1999 (BT)328.5 (17.65)342.9 (49.03)355.3 (95.01)
1999 (AT)328.5 (17.65)207.4 (19.84)145.7 (23.44)
2012504.7 (20.72)357.0 (17.95)264.5 (12.62)
SWN (trees/ha)1999 (BT)653 (60)567 (60)594 (58)
1999 (AT)653 (60)348 (55)196 (4)
2012626 (66)347 (57)194 (4)
dg (cm)1999 (BT)21.1 (0.42)21.8 (1.76)22.0 (1.06)
1999 (AT)21.1 (0.35)23.2 (2.26)25.5 (1.13)
201225.2 (0.56)29.8 (2.96)33.7 (1.13)
dg dom (cm)1999 (BT)27.6 (0.56)28.3 (1.83)29.1 (0.98)
1999 (AT)27.6 (0.56)27.7 (1.83)27.8 (0.98)
201233.3 (0.91)35.1 (2.12)36.3 (0.98)
hg (m)1999 (BT)20.1 (1.27)21.4 (2.19)21.5 (0.56)
1999 (AT)20.1 (1.34)21.7 (2.61)22.4 (0.77)
201223.1 (0.21)24.3 (1.06)24.3 (0.77)
hg dom (m)1999 (BT)21.9 (2.12)22.3 (3.11)22.9 (0.84)
1999 (AT)21.9 (2.12)22.3 (3.11)22.8 (0.84)
201224.7 (1.06)25.4 (1.34)24.9 (0.84)
G (m2/ha)1999 (BT)23.7 (0.36)20.9 (1.18)22.6 (0.13)
1999 (AT)23.7 (0.36)14.4 (0.60)9.7 (0.49)
201231.3 (1.66)23.5 (0.87)16.6 (0.57)
V (m3/ha)1999 (BT)232.8 (18.87)217.3 (37.75)238.6 (6.43)
1999 (AT)232.8 (18.87)152.5 (26.23)106.1 (9.47)
2012354.8 (23.19)282.1 (26.94)200.1 (14.28)

2.3. Measurements

All trees on the experimental plots were numbered and marked at 1.3 m stem height for repeated diameter measurements. The analyzed period of observation is 13 growth years and covers the period between the first and second measurement (March 1999 and February 2012 respectively). Periodic annual increment was calculated as the difference between successive measurements divided by the number of growth years between the measurements.
The height of randomly-selected 20 trees per experimental plot has been measured in 1999, as well as in 2012. The mean stand height of each plot was calculated based on stand height curves, i.e., diameter-height relationships in order to estimate the height of the non-measured trees. The diameter measurements were assessed with a caliper and tree height measurements with a digital hypsometer (Forestor Vertex type III). The measurements were recorded to an accuracy of 0.1 cm for tree diameter and 0.1 m for tree height.
Table 2 shows the stand values per hectare of all investigated growth parameters per treatment and aspect for all inventories (1999 before thinning, 1999 after thinning, and 2012).
Before thinning, there were differences in tree size and age between aspects (Table 3), which directly imply differences in tree productivity.
Table 3. Tree parameters in 1999 before treatment.
ParameterNE AspectSW Aspect
MinMean (st.dev.)MaxMinMean (st.dev.)Max
Age (years)6573 (4)797383 (5)90
Diameter (cm)7.424.5 (7.1)47.99.821.0 (4.6)52.2
Height (m)14.924.2 (4.5)34.016.020.8 (2.5)27.5

2.4. Data Processing

To determine stand growth the data have been quality checked and processed with the Forest Research Plot Assessment software (Version 1.3.39) developed by the Forest Research Station Baden-Württemberg. The software follows standardized procedures and uses form factors to calculate tree volume and aggregates tree data at the stand-level. For instance, it calculates the diameter and height of the tree with the mean basal area, as well as stand basal area and stand volume per each individual plot (treatment replication per aspect) based on the yield tables of Schober [36], and estimates the values per hectare as presented in Table 2.

2.5. Statistical Analysis

All statistical analyses were performed in R version 3.1.2 [37]. To test significance of the effects of thinning treatment and aspect on each of the measured growth parameters analysis of variance (ANOVA) was conducted. Since we were interested in estimates of tree- and plot-level variability, in addition to differences between treatments and aspects, a mixed-effects model ANOVA was conducted for the analysis using the lme function of package nlme [38].
For estimating the effects of thinning and aspect and their interaction on growth, we generated mixed-effects models for the growth parameters at both, the individual tree- and the stand-level. The mixed-effects modeling approach provides a flexible tool for the analysis of grouped data, giving the possibility to incorporate fixed as well as random effects within one model. Fixed effects parameters are common to all subjects, whereas random effects parameters are specific to each subject [39]. Fixed effects have an influence on the mean of the dependent variable, while random effects influence the variance of the dependent variable [40]. The effect of plot was treated as a random effect to properly account for its random variability.
The mixed-effects models on the stand-level have been estimated based on data from all experimental plots (ntotal = 15, nNE = 9, nSW = 6), and the tree-level models were based on data from all measured trees (n = 2458). Estimation followed the restricted maximum likelihood approach as implemented in the nlme package. Effects of thinning and aspect on basal area increment were simultaneously tested using the glht function of package multcomp [41].
Construction of the models consisted in the selection of relevant predictor variables, and in the development of multiple model variants. Since forest growth is affected by several potentially interacting factors [42], the selection of the most appropriate components represented an important step in model development. The choice of the “best” model with its uncertainties [43] is a trade-off between accuracy and applicability [44] and adhered to the law of parsimony.
Akaikes Information Criterion (AIC) was used to assess the relative quality of the models and as a means for model selection. As measures of goodness-of-fit a coefficient of determination (R2) based on Wald’s statistic and the root mean squared error (RMSE) were calculated for each mixed-effects model with the function lmmR2W from lmmfit package [45].

2.5.1. The Stand-Level Growth Models

Concerning the stand-level models we were interested in examining whether differences in site aspect effectively capture differences in growth parameters (e.g., diameter, height, volume) after accounting for treatment effects. Therefore, in the final models stand growth is estimated as a function of treatment and aspect and their interaction, whereas the plot (treatment replication) is included as random effect. As dependent variables we considered the mean annual stand diameter and stand height increment, as well as the annual stand basal area and stand volume increment (idg, ihg, iG, and iV, respectively), as well as the mean annual diameter and height increment of the stand component of dominant trees (idg dom, ihg dom). Thus, the developed models were:
yijk = α1 + α2 Treatmenti + α3 Aspectj + α4 Treatmenti:Aspectj
with yijk being idg, ihg, iG, iV, idg dom, or ihg dom, of the kth plot, jth aspect, and ith treatment, and the αn are coefficients to be estimated.

2.5.2. The Individual Tree-Level Growth Model

For the individual tree-level model the basal area increment of individual trees (ig) is formulated as a function of tree size, competition, release effect, and site [46,47,48,49,50]:
ig = f(tree size, competition, release intensity, site)
In our individual tree-level model the variable size is represented by the initial tree size, i.e., the basal area of each individual tree at the beginning of the experiment (gi).
Effects of stand-level competition for light, moisture, and nutrients were incorporated into the model through the stand basal area after the treatment (target stand density) which was 10 m2/ha for the very strong thinning, 15 m2/ha for the strong thinning regime, and 24.5 m2/ha for the control plots as the average between unthinned plots on both aspects.
Release intensity was estimated with a distance-independent competition index, i.e., basal area of larger trees (BALi), which is the sum of the basal area of trees larger than the subjected tree as proposed by Wykoff [51]. The BAL represents the size ranking of a tree within a forest stand [46,52]. The difference in basal area of larger trees before and after the thinning (ΔBALi) was used as a proxy for the release intensity of individual trees. For the control plots ΔBALi takes the value of zero (Figure 1). The release intensity was included in the model as an interaction term with initial basal area (giBALi). In this way we allow the magnitude of the release intensity effect on the basal area increment to vary with initial tree size [46]. For example a large diameter tree will experience lower competition from its neighbors compared with a small diameter tree, provided both trees have the same ΔBAL [49].
Figure 1. Basal area of larger trees (BAL) before and after thinning (BT, AT) and change in basal area of larger trees after thinning (ΔBALi) versus initial tree basal area (gi) for the different treatments: control (CT), strong thinning (ST), and very strong thinning (VT). The shaded areas indicate the standard errors of the estimates.
Forests 06 03256 g001
Two variables associated with tree competition have been included in the model because we expect that the growth of the sample trees will respond to target stand density represented by the stand basal area (stand-level density effect), as well as to changes in local density (tree-level release effect).
Considering the differences in local climatic conditions between NE and SW facing slopes, aspect was included in the model as an indicator of site quality. The tree size, the target stand density, the aspect, the release intensity, and the interaction between aspect and target stand density were specified as fixed effects, while the plot (treatment replication) was specified as a random effect. A significant interaction between two main effects indicates that the effect of each variable depends on the level of the other [53]. A square root transformation was applied to igi because the residuals of the mixed-effects model indicated strong heteroscedasticity. Thus, the final mixed model for the periodic annual basal area increment is:
sqrt(igi) = α1 + α2 gi + α3·Target stand density + α4 Aspect + α5 giBALi + α6·Target stand density:Aspect
where igi is the periodic mean annual basal area increment of tree i (m2/year) during the observation period, gi is the initial basal area of tree i (m²), target stand density is the stand basal area after the treatment (m²/ha), ΔBALi is the change in basal area of larger trees after the thinning, and αi are coefficients to be estimated.
The interaction term between aspect and target stand density was included in the individual tree-level model to permit the effect of stand basal area on basal area increment to vary with aspect.

3. Results

3.1. Stand-Level Models

The growth response to thinning according to aspect is illustrated in Figure 2. The results represent the changes in different growth parameters 13 years after the thinning. Diameter increment of dominant trees significantly increased with decreasing stand density. The differences between the treatments in the mean diameter increment of all trees per plot were of lower magnitude but showed the same trend as for the dominant trees and were significant when compared with the control plots. Stand basal area increment decreased with increasing thinning intensity, but the difference was significant only for the SW aspect. On both aspects, annual stand volume increment decreased with increasing thinning intensity, but the effect was significant only between the control and the very strong thinning treatment.
Figure 2. Growth response to thinning according to aspect for all treatments: control (CT), strong thinning (ST), and very strong thinning (VT). Measured parameters: mean stand diameter increment (idg), mean stand diameter increment of dominant trees (idg dom), stand basal area increment (iG) ,and stand volume increment (iV).
Forests 06 03256 g002
The estimates of the model parameters (Equation (1)) for each growth variable are listed in Table 4. The models explain 93% of the total variance with a RMSE of 0.3572 mm/year for the mean stand diameter (0.3029 mm/year for idg dom) and 61% of the variance with a RMSE of 0.0471 m²/ha/year for the stand basal area increment (respectively 76% and 0.9291 m³/ha/year for iV). The stand-level models indicate that the treatment had a significant effect on diameter increment, stand basal area increment, and volume increment. In addition, the diameter increment of the dominant trees and the stand volume increment were also significantly affected by aspect. At this level no significant interaction effect between treatment and aspect was found. Regarding tree height, neither treatment nor aspect showed a significant influence on mean nor dominant height increment (see supplementary material, Table S1 and Figure S1, even so stand height on the NE-aspect was substantially higher than on the SW-aspect (see Table 3).
Table 4. Parameter estimates and error statistics for the stand level models.
Modelidgidg dom
Fixed ParametersEstimateSEt-Valuep > |t|EstimateSEt-Valuep > |t|
Intercept3.50610.255513.71910.00004.68510.202523.13040.0000
Treatment ST2.35340.24619.56060.00001.53860.22096.96320.0001
Treatment VT3.46160.246114.06250.00002.65990.236611.23960.0000
Aspect SW−0.24630.2176−1.13210.2868−0.49260.2005−2.45640.0395
St.Dev.St.Dev.
Random intercept0.29120.1803
Residual error0.38920.3493
R20.93010.9300
RMSE0.35720.3029
ModeliGiV
Fixed ParametersEstimateSEt-Valuep > |t|EstimateSEt-Valuep > |t|
Intercept0.69820.035019.90830.000013.76880.579023.77720.0000
Treatment ST−0.05600.0305−1.83600.0995−1.62000.6774−2.39140.0405
Treatment VT−0.17200.0305−5.63930.0003−4.12000.6774−6.08200.0002
Aspect SW0.04040.02711.48710.1712−2.43520.5812−4.18960.0023
St.Dev.St.Dev.
Random intercept0.04450.4058
Residual error0.04821.0710
R20.61390.7608
RMSE0.04710.9291

3.2. Tree-Level Models

At the individual tree-level, basal area increment of thinned trees was significantly larger than that of unthinned trees on both aspects. For the ST treatment, the average basal area increment was 0.0386 (±0.0135) m2/tree/year on the NE and, respectively, 0.0268 (±0.0107) m2/tree/year on the SW aspect. For the VT treatment the basal area increment was on average 0.0503 (±0.0138) m2/tree/year on the NE aspect and 0.0382 (±0.0106) m2/tree/year on the SW aspect. The difference between the two aspects was noticeable for all thinning treatments (Figure 3).
The most significant predictor at the individual tree-level was tree size at the beginning of the experiment, followed by the target stand density, and the interaction between initial basal area and change in basal area of larger trees. Moreover, the interaction between target stand density and aspect was also significant (Table 5).
The model explains 73% of the total variance with a RMSE of 0.02686 m²/tree/year. The parameter estimates, standard errors, and p-values of the parameters for the basal area increment model are listed in Table 6. With the exception of the coefficient for aspect as the main effect, all coefficients were statistically significant and indicate plausible relationships with respect to biological interpretation. The plot of the obtained residuals against the predicted values did not indicate any systematic deviation (see supplementary material, Figure S2).
Figure 3. Annual tree basal area increment (igi) according to target stand density (CT: 24.5 m2/ha, ST: 15 m2/ha, and VT: 10 m2/ha), and aspect (NE, SW). Basal area increments marked with the same letter are not significantly different (p > 0.05).
Forests 06 03256 g003
Table 5. Analysis of variance of the individual tree-level model.
numDFdenDFF-Valuep-Value
(Intercept)124471027.239<0.0001
gi124474852.517<0.0001
Target stand density22447921.102<0.0001
Aspect124472.6930.1993
gi:ΔBALi1244772.950<0.0001
Target stand density: Aspect224472.8570.0576
Table 6. Model output of the individual tree level model for basal area increment.
Fixed ParametersEstimateSEt-Valuep > |t|
Intercept0.05480.00648.47760.0000
gi1.43610.028350.64910.0000
Target stand density150.02670.002510.30200.0000
Target stand density100.04680.003115.08820.0000
Aspect SW0.01170.00991.18000.3230
gi:ΔBALi0.14510.01768.21170.0000
Target stand density15: Aspect SW0.00200.00260.77230.4400
Target stand density10: Aspect SW−0.00570.0030−1.91640.0554
St.Dev.
Random intercept0.0107
Residual error0.0264
R20.7344
RMSE0.0268
Figure 4 illustrates that the basal area increment of individual trees is positively influenced by tree size, the larger the tree the higher its increment.
Figure 4. Relation between initial basal area (gi) and basal area increment (igi) of individual trees.
Forests 06 03256 g004
The significant interaction between giBALi indicates that the effect of release intensity on the basal area increment depends on initial size. If the competitive position of a tree within a stand improves, BAL will be reduced, ΔBAL will increase and, therefore, igi will increase as well. The second interaction term (target stand density:aspect) was significant only for the VT treatment, showing that the effect of the very strong thinning regime on basal area increment of individual trees was smaller on the SW than on the NE aspect (Table 5).

4. Discussion

Our results quantify the growth response of European beech on the tree- and stand-level to different thinning intensities on two sites with opposite aspects in Southwest Germany. We could show that the thinning effect is influenced not only by thinning intensity and initial tree size, but also by the status of a tree within a stand and by site aspect.

4.1. Model Quality

We developed stand- and tree-level growth models for European beech to evaluate whether the growth response to thinning depends on aspect. The model fit that is the R2 and RMSE values are comparable to other tree-level basal area increment models for European beech [47,48]. Even though Laubhann [48] and Monserud and Sterba [47] used different explanatory variables (e.g., diameter at breast height and crown ratio for expressing tree size, BAL and crown competition factor for competition effects and for site effects, besides aspect, included elevation and slope), the comparison is meaningful due to the similarity of methods.

4.2. Effect of Tree Size

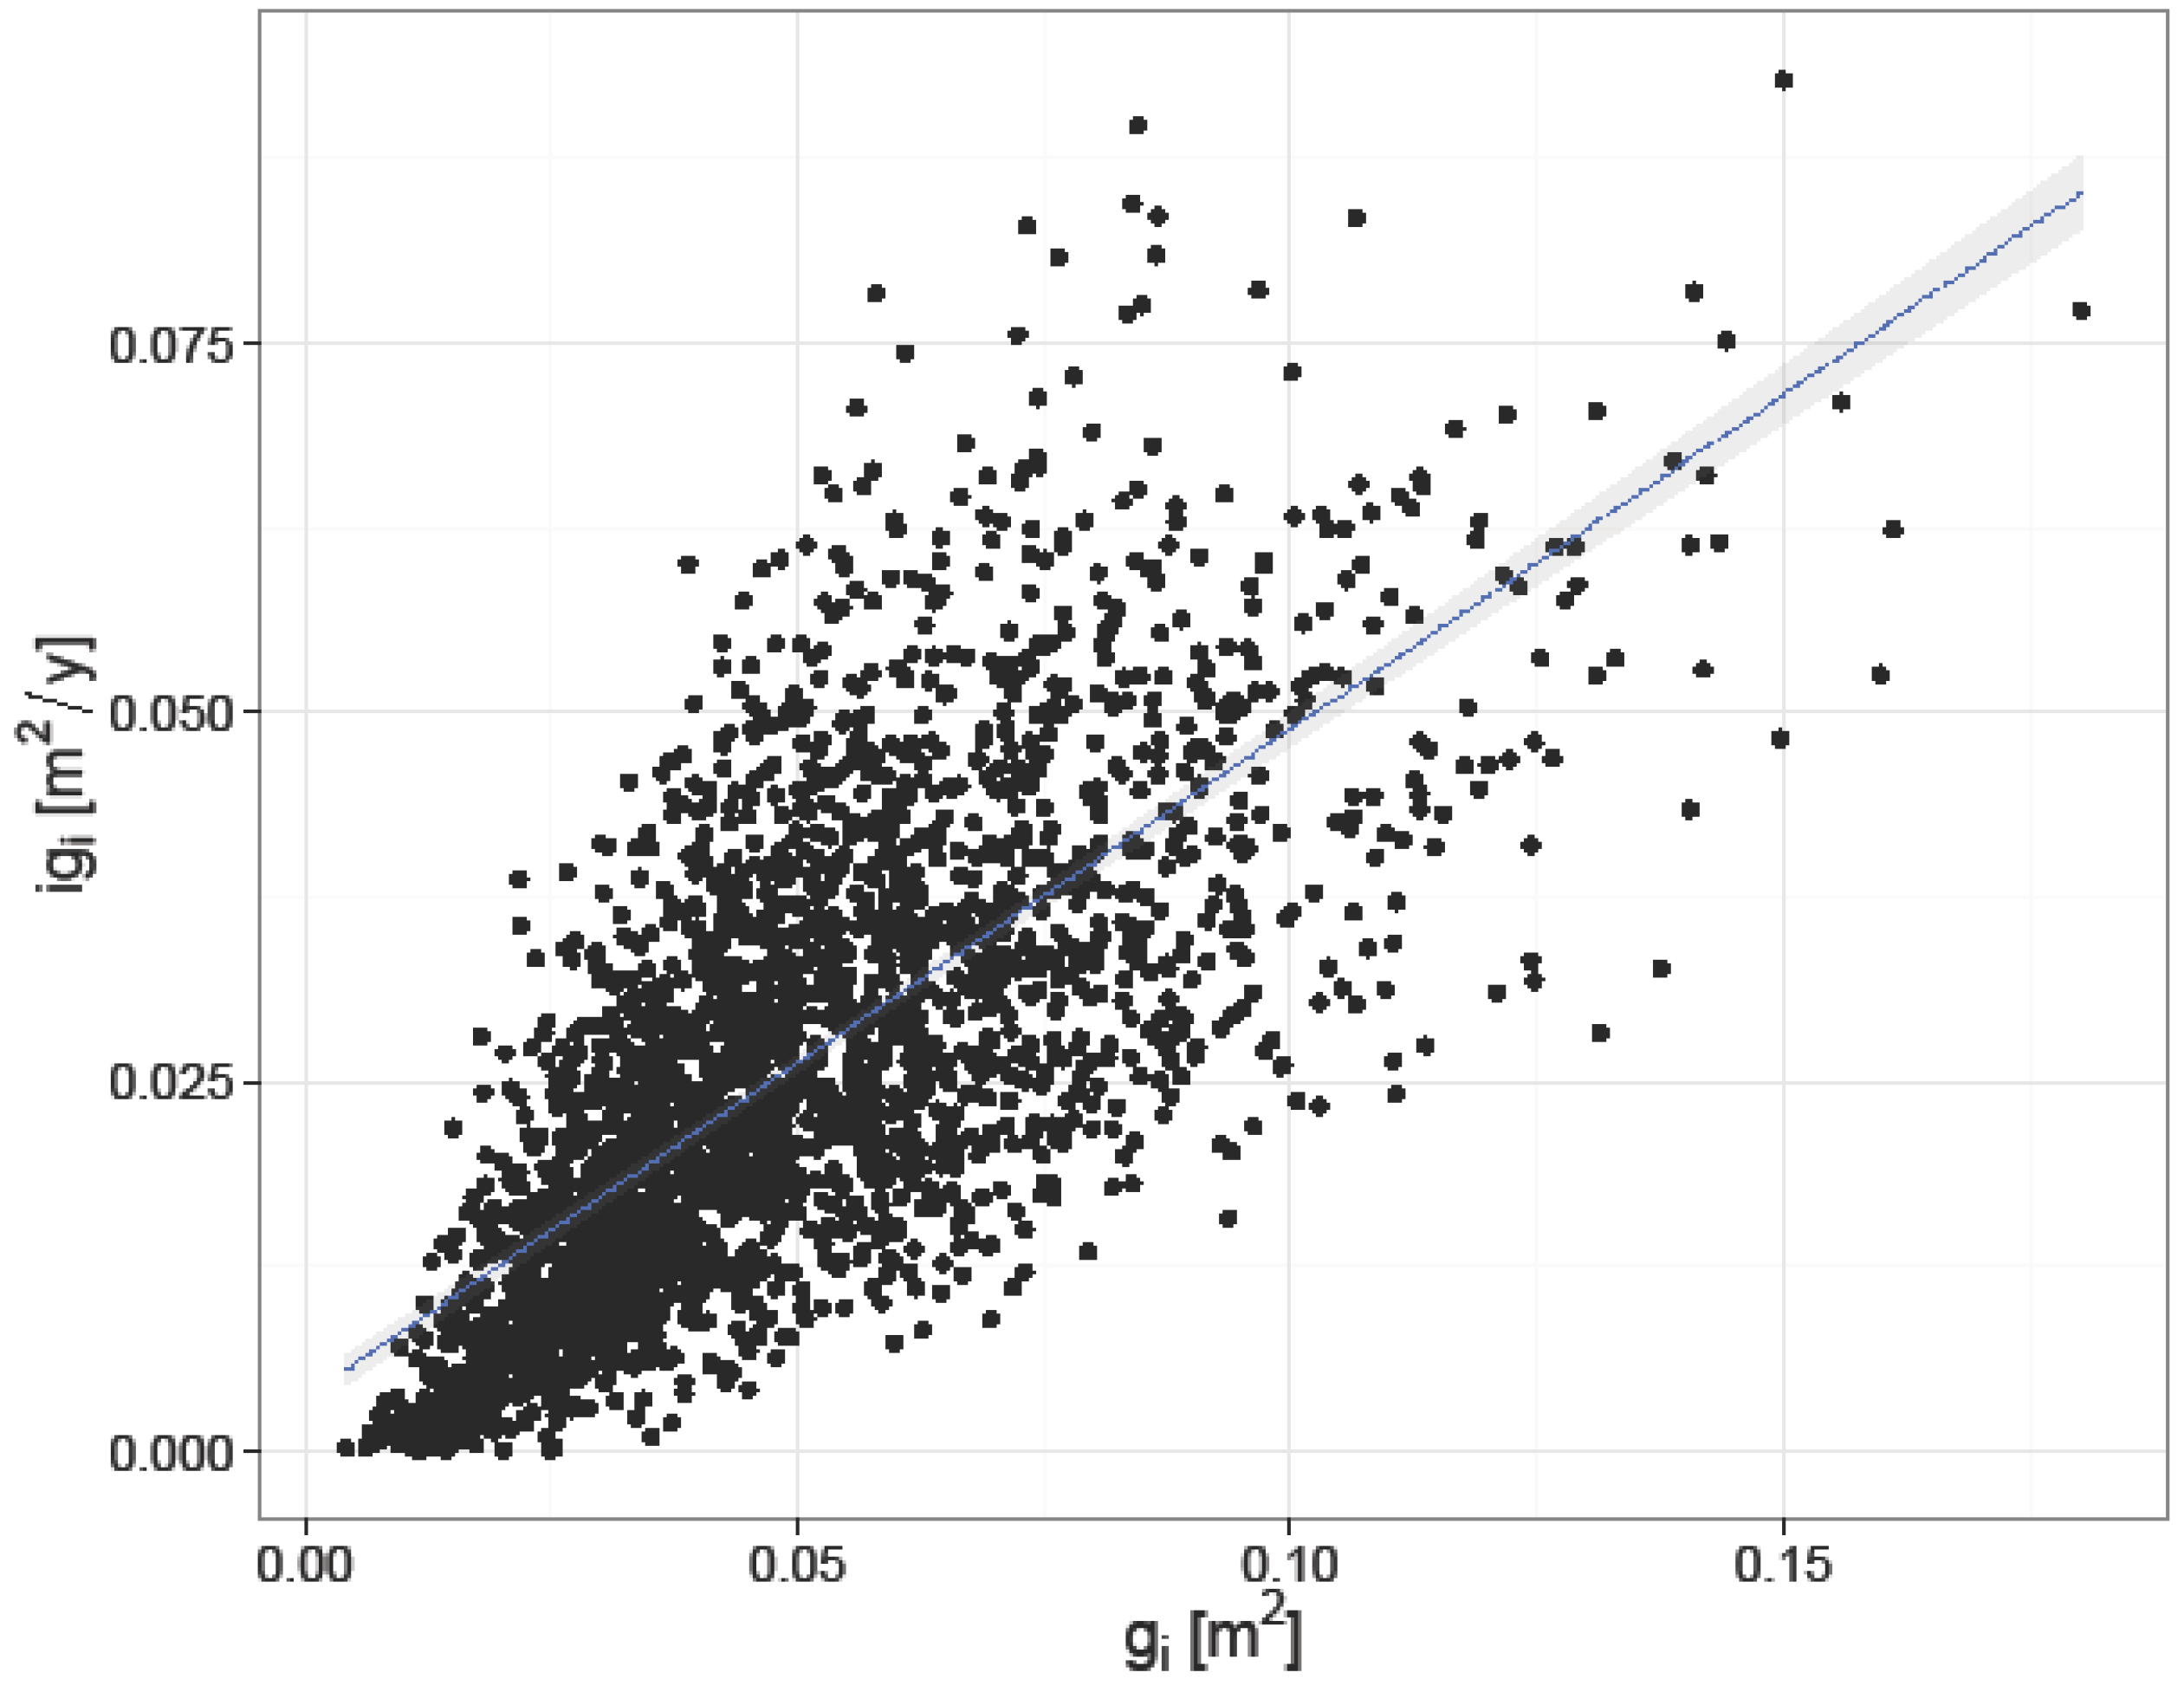
For the individual tree-level model, most of the variance was explained by initial tree size (Table 5). Tree size at the beginning of the experiment represents the starting point in any growth modeling according to Assmann [54] and Wykoff [46]. The relation is positive, i.e., the larger the initial basal area was, the higher the basal area increment. The relationship between gi and igi followed a linear model (Figure 4). Our results are in agreement with those of Monserud and Sterba [47] and Cescatti and Piutti [27], who found that most of the variance in their basal area increment models for individual trees was explained by size factors.
Pretzsch and Dieler [55] found a steeper slope of the linear size-growth relationship on fertile sites than on infertile sites. Our results correspond to Pretzsch and Dieler [55], in that the size-growth relationship is represented by a straight line and that the increment is higher on more fertile sites (in our case, NE aspect). An interaction term between initial basal area and aspect was not included in our final model due to a lower AIC value; therefore, our results do not differentiate between aspects. Nevertheless, the three thinning treatments (CT, ST, VT) may cause the size-growth relationship to change in case of stands with different competition levels. Moreover, for the current analyses a three-way interaction term (i.e., interaction between competition indexes, tree size, and aspect) was not included due to the different objectives we had.

4.3. Effect of Competition

At the stand-level the competition factor represented by the thinning treatment had the most significant effect on stand growth. This is in agreement with many other studies which highlight the importance of competition effects on growth patterns and climate sensitivity of European beech stands under different silvicultural treatments [19,24,26,27] and shows that the average stand diameter increment consistently increased with increasing thinning intensity (Figure 2). The mean diameter increment was also calculated for the 100 largest trees in diameter per hectare as differences in average stand diameter increment between differently thinned plots can be caused by the different number of stems per hectare [56]. The results showed the same trend of higher increment in plots where stronger thinning has been applied, which is in accordance with findings from van der Maaten [19], Le Goff and Ottorini [26], and Klädtke [57], who report that the radial increment of European beech increases with the intensity of thinning and follow similar patterns for different thinning intensities. Likewise, work by Mäkinen and Isomäki [56] and Çiçek et al. [58] found that larger trees are also capable to increase their diameter after thinning.
With respect to height growth, the larger height increment on the NE aspect was a clear indication of a higher site index. However, we found that the height increment was not significantly different between treatments and aspects and assume that this is due to the relatively low sample size and the high error probability during the assessment of tree height in the field. Similar results regarding the thinning effect on tree growth were found for various broadleaved species [59,60,61] where stand density had a significant effect on diameter growth but not on height growth.
Our focus was to analyze the effect of wide spacing on growth of European beech trees in order to increase the production of high quality timber. Regarding the loss in volume increment, our results are similar to the results of Badoux [62] and Assmann [54], who investigated the growth response of European beech in long-term thinning experiments. They concluded that a very strong thinning regime decreases the volume increment of European beech stands by 20% and only occasionally, and for short phases, can it lead to a temporary acceleration of current volume increment. In our study no such growth-stimulating effect has been found on NE or SW aspects, and a higher reduction in volume increment has been registered. This effect could be explained by the intensity of thinning, as most of the thinnings in the Badoux [62] and Assmann [54] studies were less intensive (stand basal area after thinning 25–35 m2/ha for heavily thinned stands) than those in this study (10 and 15 m2/ha). The stand basal area in our thinned plots was reduced by 41% on the NE and 31% on the SW aspect with strong thinning, and up to 60% in very strong thinning. In addition to this, the volume increment of the thinned plots may be, to some extent, overestimated as the thinning accelerates the radial increment at 1.3 m more than at other heights within the tree [63].
Changes in stand basal area increment in response to different thinning intensities it is often not noticeable on the stand-level but on the individual tree-level [64]. Additionally, in our study, the positive effect of thinning on basal area increment was captured only at the individual tree-level.
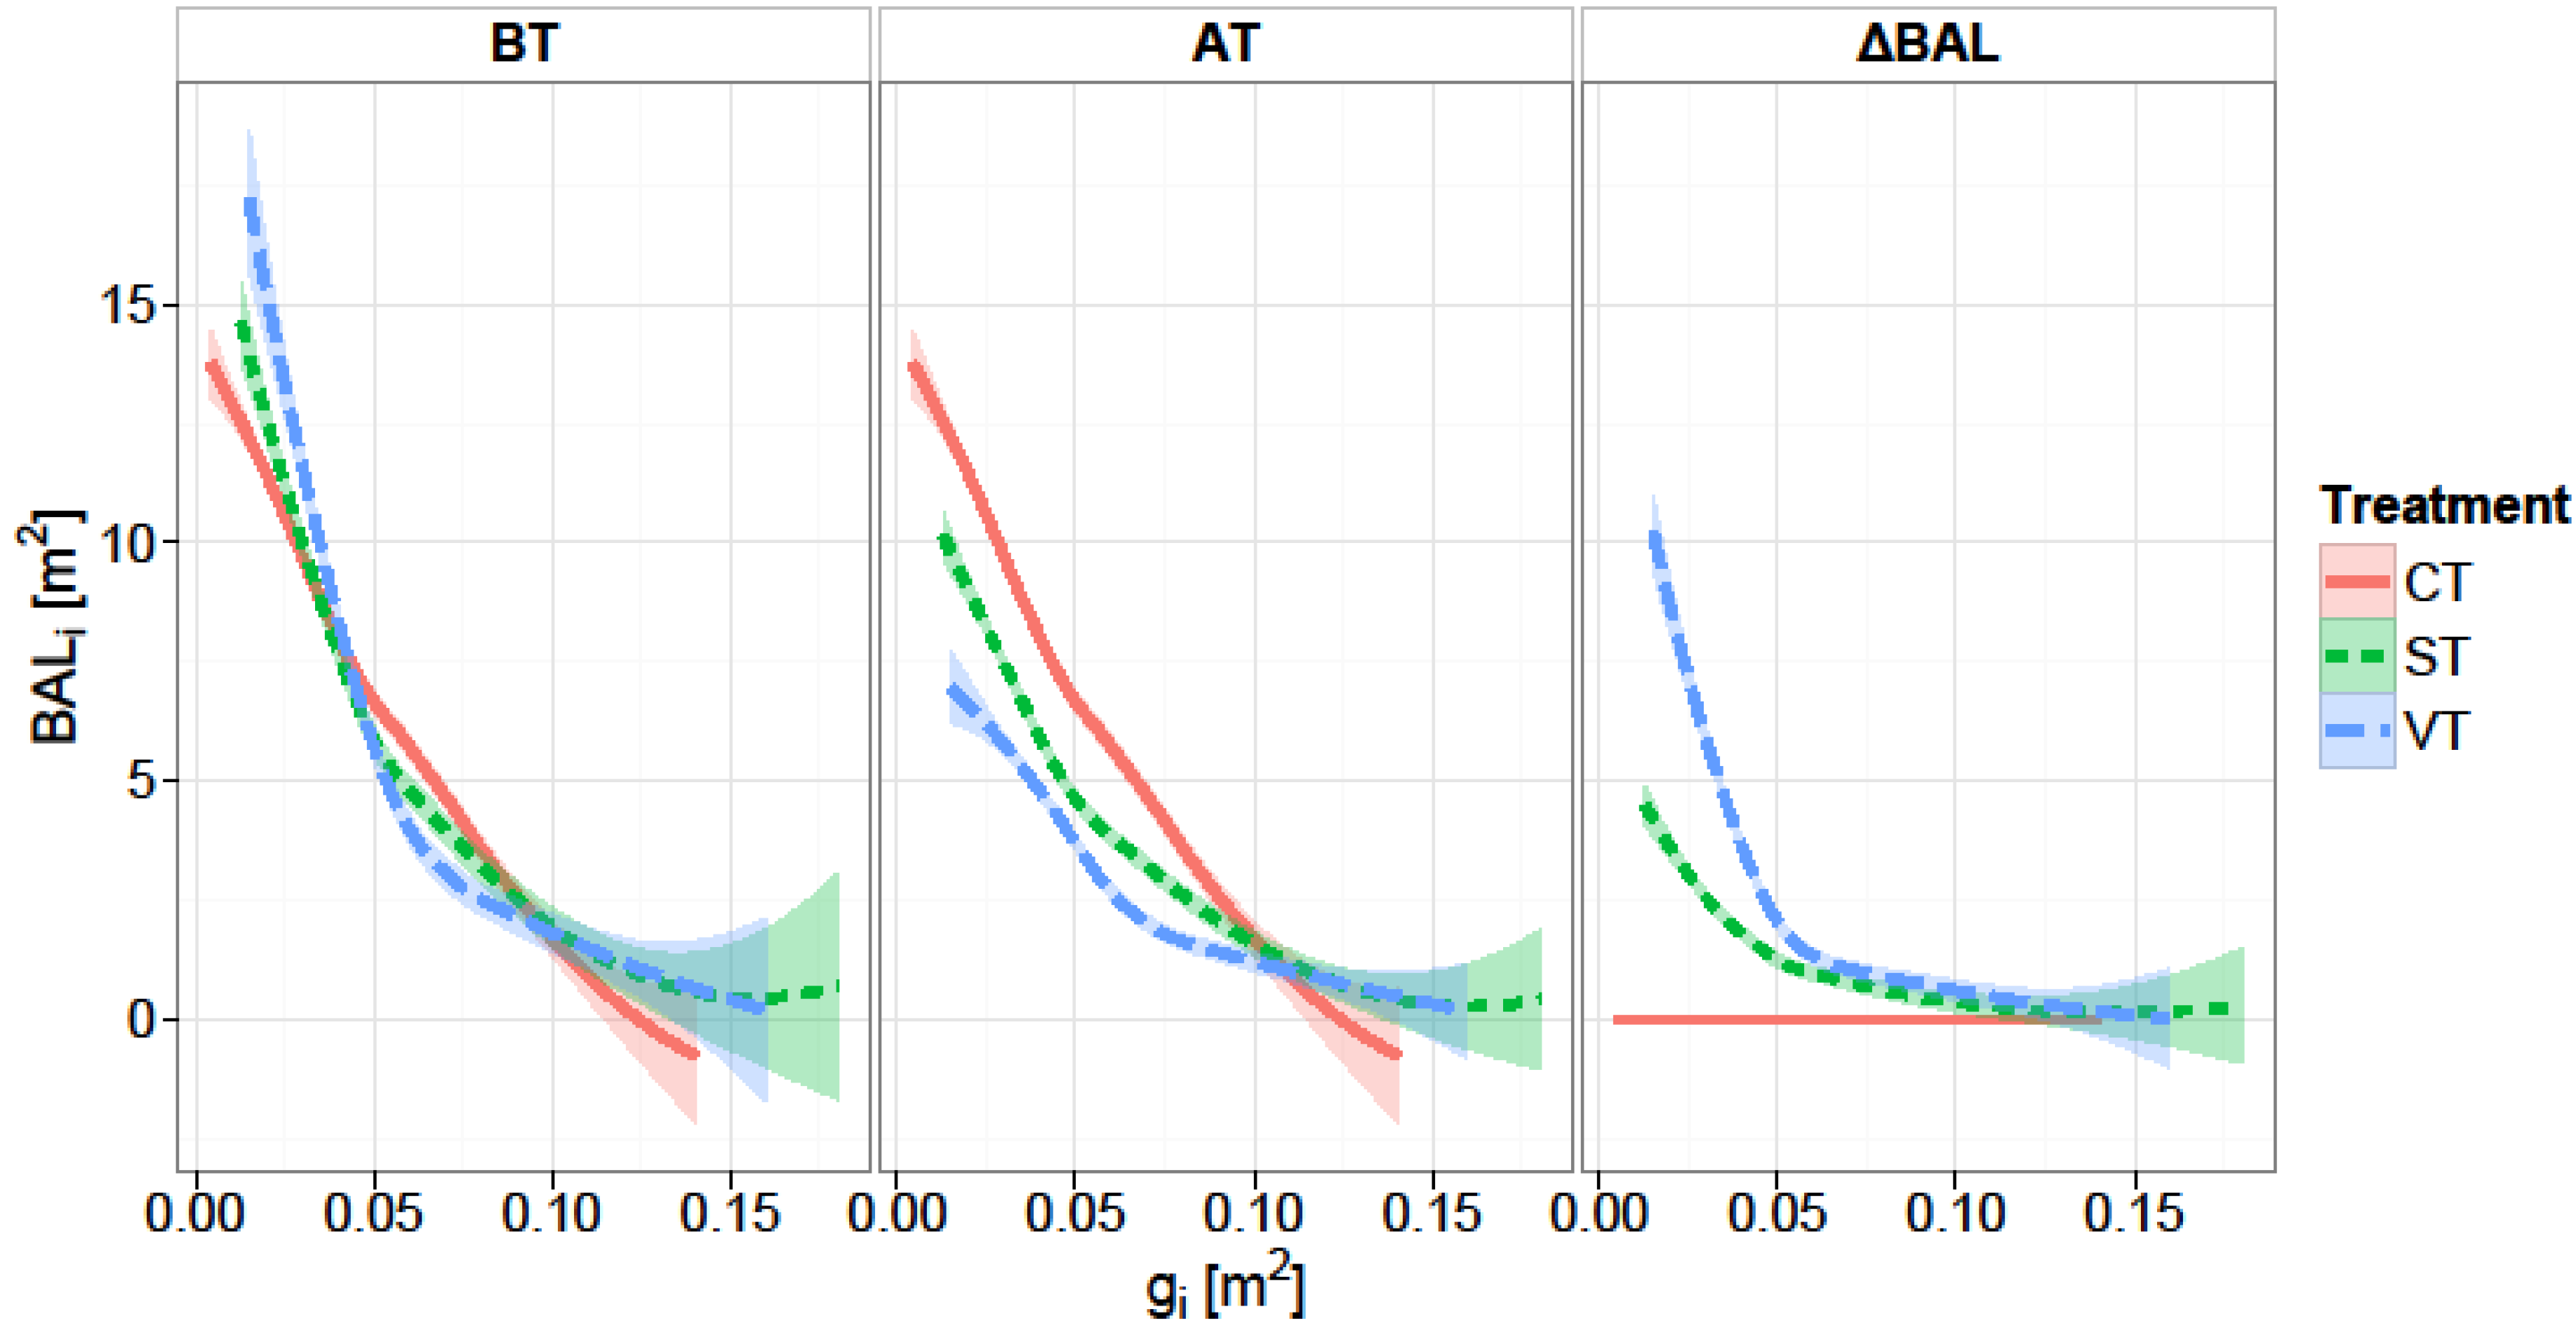
We used a distance-independent competition index, the ΔBALi. Basal area of larger trees is commonly used as a measure of competition in individual-tree growth models [46,47,52]. In a study concerning the effect of competition on individual tree basal area growth Rivas [65] compared competition indexes, and concluded that distance-independent competition indexes performed as well as distance-dependent ones. In a similar study predicting basal area increment of individual trees, Ledermann [66] used a semi-distance-independent competition indices (a distance independent competition measure calculated in very small sample plots including the subjected tree) and found that the semi-distance-independent competition indices explain as much variation as any of the analyzed distance-dependent ones. The significant interaction effect of initial basal area and release intensity on the increment of individual trees clearly indicates that the initial size of a tree determines its potential to respond to thinning. A significant influence of BAL and different formulations of BAL on basal area increment of individual trees has been found also by Wykoff [46], Monserud and Sterba [47], Laubhann [48], and Stage and Ledermann [67].
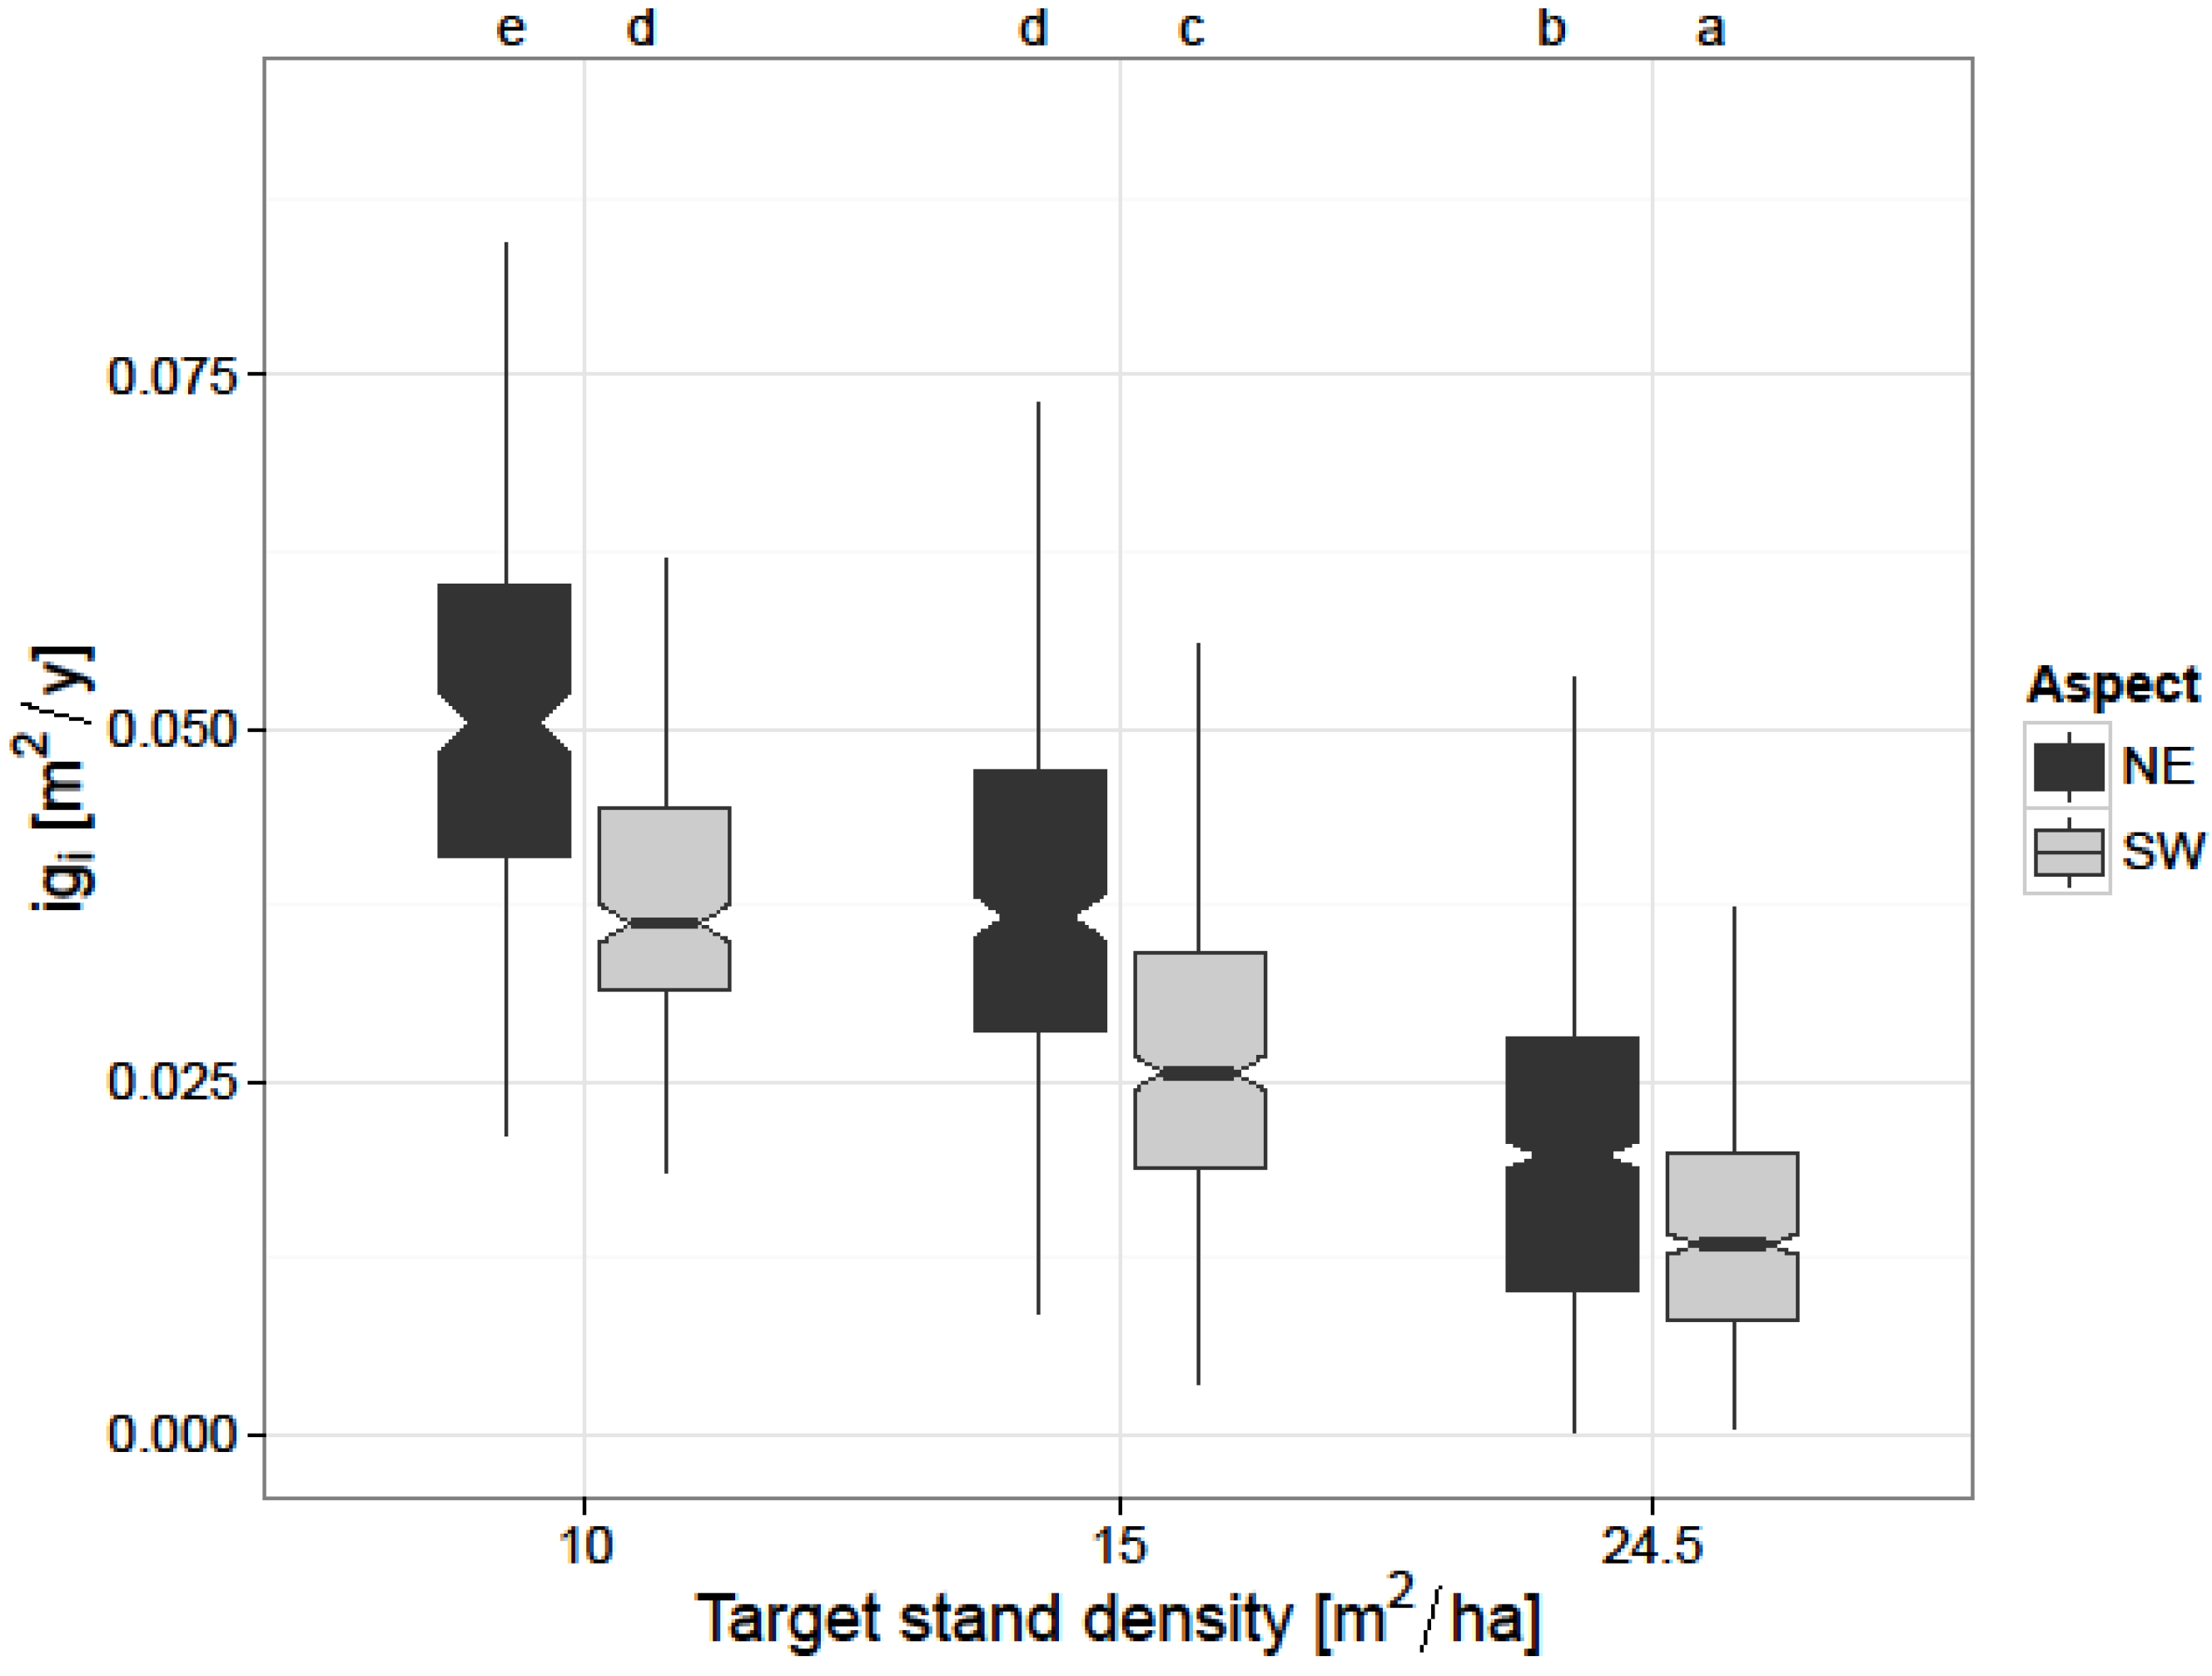
The second competition-related factor included in the model—target stand density—provided a major influence on basal area increment of individual trees, as well. This is in accordance with other authors who studied the effect of thinning on European beech stands [24,57,68,69]. It also corresponds with van der Maaten [19], who found similar results in the study area regarding radial growth for the shorter time period 2001–2006. The increase in igi was larger for the plots with a target basal area of 10 m2/ha as compared to the control plots. Our results are similar with the results of Le Goff and Ottorini [26] and Boncina [24], who found larger growth on the individual tree-level with increasing thinning intensity in European beech stands. The large influence of target stand density on individual tree growth (Table 5) highlights the importance of resource limitation within a stand. Contrary to Geßler [21] who found that reducing stand density can negatively affect individual tree growth of European beech through increased soil evaporation and transpiration of understory vegetation, our results show that a reduction in stand basal area per hectare stimulates individual tree growth even under the warmer and drier climatic conditions on the SW aspect (Figure 3).
In the context of climate change adaptation, the future of European beech is controversially discussed [13,16,70,71]. Our results show that a high intensity crop-tree thinning regime, which reduces the stand basal area to 15 and 10 m2/ha, respectively, at the age of 80–100 years, can still increase the growth of European beech in a warmer and drier climate.

4.4. Effect of Aspect

The site represents a major component influencing tree growth [72]. This was also visible in our study at both levels of the analysis. At the stand-level, besides treatment the aspect had a significant influence on volume and diameter growth of dominant trees, on the SW aspect being significantly lower than that on the NE. This highlights the importance of site conditions, and suggests that warmer climatic conditions could represent a limiting factor for European beech growth. However, potential confounding effects could compromise this finding. This is due to the fact that in our study, aside from local climatic conditions, soil structure and soil depth also differed between aspects. Our findings are contrary to the results of van der Maaten [73], whose study on seasonal stem growth patterns of European beech was conducted in the same study area. He did not find a significant effect of aspect on the growth response to thinning. This might be related to differences in the length of the study period (six versus 13 years). In a recent study assessing the effects of competition on climate tree-growth relationships of European beech trees growing in contrasting ecological conditions, Lebourgeois [74] did not find significant differences between sites on north- and south-facing slopes.
One of the most interesting findings in our study corresponds to the quantitative insights into the competitive relationships of individual trees growing on two different aspects. These insights were assessed by evaluating the interaction effect between aspect and target stand density at the tree-level, and between aspect and treatment at the stand-level. The relationship was significant (p ≤ 0.05) only at the individual tree-level; the basal area increment of trees on the SW facing slope under VT treatment was significantly lower than on the opposite slope. The relationship was not significant at the stand-level and we assume that this is due to compensatory stand-level effects and, therefore, might not have been detected due to the restricted sample size (n = 15) compared with the larger sample size at the individual tree-level (n = 2458). It is interesting to note that trees growing at very low stand density produce a significantly larger increment on sites with less irradiation and more favorable moisture conditions. The results are in agreement with Assmann [54] and Pretzsch [25], who found that the thinning response of European beech is larger on favorable sites than on unfavorable sites. This significant interaction between aspect and stand density on tree growth response to thinning implies that, under warmer and drier climatic conditions, thinning can stimulate tree growth but to a smaller extent as it does on more favorable site conditions. The site-specific thinning response present in our results is probably a consequence of the sensitivity of beech to changes in water supply. In our study we studied site effects on the growth response to thinning by comparing sites differing in aspect without considering other site characteristics (e.g., elevation, slope steepness, soil structure, soil depth) and climate variability (e.g., temperature, precipitation, drought), which are also relevant for growth. These aspects were considered in previous studies done by Hildebrand et al. [33], Mayer et al. [35] and van der Maaten [73]. Moreover, since our study is not replicated at other sites our findings are valid only for the conditions in our study region and for a generalization of our results broader analyses need to be carried out.

5. Conclusions

Our results provide comprehensive insight into the stand- and tree-level growth response of European beech to different thinning intensities on a northeast- and southwest-facing slope in Southwestern Germany. The developed models quantitatively describe the effect of different thinning intensities on the periodic annual diameter, basal area, and volume increment of beech. In this study we have shown that growth rates of European beech are lower under the warmer and drier climatic conditions of the southwest facing slope. We have proven that thinning increases tree growth on both aspects, i.e., on sites with northeast and southwest facing slopes and that beech growth response to thinning is despite tree size and treatment also influenced by aspect.
The two level approach, stand- and individual tree-level, coupled with the long observation period, offer a robust indication of how the effects of selective thinning on European beech stands are influenced by the aspect of the site. Although high intensity crop-tree thinning results in a significant loss in stand basal area and stand volume increment, the crop-tree thinning regimes applied in our study significantly enhanced growth of individual beech trees in pure stands at the age of 80–100 years. This information can be used for the development of site specific stand management adaptation strategies and for the optimization of silvicultural treatments based on efficient and targeted thinning intensities.

Supplementary Files

Supplementary File 1

Acknowledgments

This study used material from the collaborative research project SFB 433 (“Buchendominierte Laubwälder unter dem Einfluß von Klima und Bewirtschaftung: Ökologische, waldbauliche und sozialwissenschaftliche Analysen”—Beech dominated deciduous forests under the influence of climate and forest management). Daniela Diaconu is funded by the project BuKlim within Waldklimafonds program of BMEL/BMUB (Bundesministerium für Ernährung und Landwirtschaft und des Bundesumweltministeriums). The article processing charge was funded by the German Research Foundation (DFG) and the Albert Ludwigs University Freiburg in the funding programme Open Access Publishing. The authors are thankful to Jonathan Sheppard for English revision and to the anonymous reviewers who helped improving an earlier version of this manuscript.

Author Contributions

Heinrich Spiecker and Hans-Peter Kahle conceived the study, and contributed to its design and coordination. Data analysis was performed by Daniela Diaconu under the supervision of Hans-Peter Kahle The manuscript was written by Daniela Diaconu with input from Hans-Peter Kahle and advices from Heinrich Spiecker All authors contributed to the interpretation and discussion of the results. Comments by two anonymous reviewers contributed to the improvement of the manuscript.

Conflicts of Interest

The authors declare no conflict of interest.

References

  1. Bohn, U.; Gollub, G.; Hettwer, C.; Weber, H.; Neuhäuslová, Z.; Raus, T.; Schlüter, H. Karte der Natürlichen Vegetation Europas; Map of the Natural Vegetation of Europe; Landwirtschaftsverlag: Münster-Hiltrup, Germany, 2000. [Google Scholar]
  2. Ellenberg, H. Vegetation Mitteleuropas mit den Alpen in Ökologischer, Dynamischer und Historischer Sicht. 170 Tabellen; 5, stark veränd. und verb; Aufl; Ulmer: Stuttgart, Germany, 1996. [Google Scholar]
  3. IPCC. Climate Change 2014: Synthesis Report. Contribution of Working Groups I, II and III to the Fifth Assessment Report of the Intergovernmental Panel on Climate Change; Core Writing Team, Pachauri, R.K., Meyer, L.A., Eds.; IPCC: Geneva, Switzerland, 2014. [Google Scholar]
  4. Trenberth, K.E.; Jones, P.D.; Ambenje, P.; Bojariu, R.; Easterling, D.; Klein, T.A.; Parker, D.; Rahimzadeh, F.; Renwick, J.A.; Rusticucci, M.; et al. Observations: Surface and Atmospheric Climate Change. In Climate Change 2007: The Physical Science Basis. Contribution of Working Group I to the Fourth Assessment Report of the Intergovernmental Panel on Climate Change; Solomon, S., Qin, D., Manning, M., Chen, Z., Marquis, M., Averyt, K.B., Tignor, M., Miller, H.L., Eds.; Cambridge University Press: Cambridge, UK; New York, NY, USA, 2007. [Google Scholar]
  5. Christensen, J.H.; Hewitson, B.; Busuioc, A.; Chen, A.; Gao, X.; Held, I.; Jones, R.; Kolli, R.K.; Kwon, W.T.; Laprise, R.; et al. The Physical Science Basis. Contribution of Working Group I to the Fourth Assessment Report of the Intergovernmental Panel on Climate Change; IPCC: Geneva, Switzerland, 2007. [Google Scholar]
  6. Schweingruber, F.H. Der Jahrring: Standort, Methodik, Zeit und. Klima in der Dendrochronologie; Paul Haupt: Bern und Stuttgart, Germany, 1983; p. 234. [Google Scholar]
  7. Methods of Dendrochronology: Applications in the Environmental Sciences; Cook, E.R.; Kairiukstis, L.A. (Eds.) Springer: Dordrecht, The Netherlands, 1990.
  8. Fritts, H.C. Tree Rings and Climate; Academic Press: London, UK, 1976; Volume 12. [Google Scholar]
  9. Eilmann, B.; Rigling, A. Tree-growth analyses to estimate tree species’ drought tolerance. Tree Physiol. 2012, 32, 178–187. [Google Scholar] [CrossRef] [PubMed]
  10. Charru, M.; Seynave, I.; Morneau, F.; Bontemps, J.D. Recent changes in forest productivity: An analysis of national forest inventory data for common beech (Fagus sylvatica L.) in north-eastern France. For. Ecol. Manag. 2010, 260, 864–874. [Google Scholar] [CrossRef]
  11. Allen, C.D.; Macalady, A.K.; Chenchouni, H.; Bachelet, D.; McDowell, N.; Vennetier, M.; Kitzberger, T.; Rigling, A.; Breshears, D.D.; Hogg, E.; et al. A global overview of drought and heat-induced tree mortality reveals emerging climate change risks for forests. For. Ecol. Manag. 2010, 259, 660–684. [Google Scholar] [CrossRef]
  12. Gillner, S.; Rüger, N.; Roloff, A.; Berger, U. Low relative growth rates predict future mortality of common beech (Fagus sylvatica L.). For. Ecol. Manag. 2013, 302, 372–378. [Google Scholar] [CrossRef]
  13. Geßler, A.; Keitel, C.; Kreuzwieser, J.; Matyssek, R.; Seiler, W.; Rennenberg, H. Potential risks for European beech (Fagus sylvatica L.) in a changing climate. Trees 2007, 21, 1–11. [Google Scholar] [CrossRef]
  14. Dittmar, C.; Zech, W.; Elling, W. Growth variations of common beech (Fagus sylvatica L.) under different climatic and environmental conditions in Europe—A dendroecological study. For. Ecol. Manag. 2003, 173, 63–78. [Google Scholar] [CrossRef]
  15. Fotelli, M.N.; Rennenberg, H.; Geßler, A. Effects of drought on the competitive interference of an early successional species (Rubus fruticosus) on Fagus sylvatica L. seedlings: 15N uptake and partitioning, responses of amino acids and other N compounds. Plant Biol. 2002, 4, 311–320. [Google Scholar] [CrossRef]
  16. Rennenberg, H.; Seiler, W.; Matyssek, R.; Geßler, A.; Kreuzwieser, J. Die Buche (Fagus sylvatica L.) ein Waldbaum ohne Zukunft im südlichen Mitteleuropa? AFJZ 2004, 175, 210–244. [Google Scholar]
  17. Scharnweber, T.; Manthey, M.; Criegee, C.; Bauwe, A.; Schröder, C.; Wilmking, M. Drought matters—Declining precipitation influences growth of Fagus sylvatica L. and Quercus robur L. in north-eastern Germany. For. Ecol. Manag. 2011, 262, 947–961. [Google Scholar] [CrossRef]
  18. Spiecker, H.; Kahle, H.P.; Hauser, S. Klima und Witterung als Einflußfaktoren für das Baumwachstum in Laubwäldern: Retrospektive Analysen und Monitoring. In Buchendominierte Laubwälder unter dem Einfluß von Klima und Bewirtschaftung: Ökologische, waldbauliche und sozialwissenschaftliche Analysen—Vorcharakterisierung der Untersuchungsflächen; Abschlußbericht des SFB 443; Rennenberg, H., Ed.; Eigenverlag der Universität Freiburg: Freiburg, Germany, 2001; pp. 307–333. [Google Scholar]
  19. Van der Maaten, E. Intra- and Interannual Growth Responses of European Beech (Fagus sylvatica L.) to Climate, Aspect and Thinning in the Swabian Alb—Southwestern Germany. Ph.D. Thesis, Albert-Ludwigs-Universität Freiburg, Freiburg im Breisgau, Germany, 2013. [Google Scholar]
  20. Fotelli, M.N.; Rienks, M.; Rennenberg, H.; Geßler, A. Climate and forest management affect 15 N-uptake, N balance and biomass of European beech seedlings. Trees Struct. Funct. 2004, 18, 157–166. [Google Scholar] [CrossRef]
  21. Geßler, A. Water shortage affects the water and nitrogen balance in Central European beech forests. Plant Biol. 2004, 6, 289–298. [Google Scholar] [PubMed]
  22. Utschig, H.; Küsters, E. Wachstumsreaktionen der Buche (Fagus sylvatica (L.)) auf Durchforstungen? 130-jährige Beobachtung des Durchforstungsversuches Elmstein 20. Forstwiss. Cent. 2003, 122, 389–409. [Google Scholar] [CrossRef]
  23. Spiecker, H. Zur Steuerung des Dickenwachstums und der Astreinigung von Trauben- und Stieleichen: (Quercus petrea (Matt.) Liebl. und Quercus robur L.). Schriftenreihe der Landesforstverwaltung Baden-Württenberg, 72: Stuttgart, Germany, 1996. [Google Scholar]
  24. Boncina, A.; Kadunc, A.; Robic, D. Effects of selective thinning on growth and development of beech (Fagus sylvatica L.) forest stands in south-eastern Slovenia. Ann. For. Sci. 2007, 64, 47–57. [Google Scholar] [CrossRef]
  25. Pretzsch, H. Stand density and growth of Norway spruce (Picea abies (L.) Karst.) and European beech (Fagus sylvatica L.): Evidence from long-term experimental plots. Eur. J. For. Res. 2005, 124, 193–205. [Google Scholar] [CrossRef]
  26. Le Goff, N.; Ottorini, J.M. Effects of thinning on beech growth. Interaction with climatic factors. Rev. For. Fr. 1999, 51, 355–364. [Google Scholar]
  27. Cescatti, A.; Piutti, E. Silvicultural alternatives, competition regime and sensitivity to climate in a European beech forest. For. Ecol. Manag. 1998, 102, 213–223. [Google Scholar] [CrossRef]
  28. Hauser, S. Dynamik Hochaufgelöster radialer Schaftveränderungen und des Dickenwachstums bei Buchen (Fagus sylvatica L.) der Schwäbischen Alb unter dem Einfluss von Witterung und Bewirtschaftung. Ph.D. Thesis, Albert-Ludwigs-Universität Freiburg, Freiburg im Breisgau, Germany, 2003. [Google Scholar]
  29. Skomarkova, M.V.; Vaganov, E.A.; Mund, M.; Knohl, A.; Linke, P.; Boerner, A.; Schulze, E.D. Inter-annual and seasonal variability of radial growth, wood density and carbon isotope ratios in tree rings of beech (Fagus sylvatica) growing in Germany and Italy. Trees 2006, 20, 571–586. [Google Scholar] [CrossRef]
  30. Holst, T.; Rost, J.; Mayer, H. Net radiation balance for two forested slopes on opposite sides of a valley. Int. J. Biometeorol. 2005, 49, 275–284. [Google Scholar] [CrossRef] [PubMed]
  31. Rennenberg, H. Buchendominierte Laubwälder unter dem Einfluß von Klima und Bewirtschaftung: Ökologische, waldbauliche und sozialwissenschaftliche Analysen—Vorcharakterisierung der Untersuchungsflächen; Eigenverlag der Universität Freiburg: Freiburg, Germany, 1998. [Google Scholar]
  32. Geßler, A.; Schrempp, S.; Matzarakis, A.; Mayer, H.; Rennenberg, H.; Adams, M.A. Radiation modifies the effect of water availability on the carbon isotope composition of beech (Fagus sylvatica). New Phytol. 2001, 150, 653–664. [Google Scholar] [CrossRef]
  33. Hildebrand, E.; Augustin, S.; Schack-Kirchner, H. Bodenkundliche Charakterisierung der Kernflächen. In Buchendominierte Laubwälder unter dem Einfluß von Klima und Bewirtschaftung: Ökologische, waldbauliche und sozialwissenschaftliche Analysen—Vorcharakterisierung der Untersuchungsflächen; Rennenberg, H., Ed.; Eigenverlag der Universität Freiburg: Freiburg, Germany, 1998; pp. 7–12. [Google Scholar]
  34. Geßler, A.; Jung, K.; Gasche, R.; Papen, H.; Heidenfelder, A.; Börner, E.; Metzler, B.; Augustin, S.; Hildebrand, E.; Rennenberg, H. Climate and forest management influence nitrogen balance of European beech forests: Microbial N transformations and inorganic N net uptake capacity of mycorrhizal roots. Eur. J. For. Res. 2005, 124, 95–111. [Google Scholar] [CrossRef]
  35. Mayer, H.; Holst, T.; Schindler, D. Microclimate within beech stands - Part I: Photosynthetically active radiation. Forstwiss. Centr. 2002, 121, 301–321. [Google Scholar] [CrossRef]
  36. Schober, R. Buchen-Ertragstafel für mäßige und starke Durchforstung. In Die Rotbuche 1971; Schober R, 1972; Sauerländer: Frankfurt am Main, Germany, 1967. [Google Scholar]
  37. R Core Team. R: A Language and Environment for Statistical Computing; R Foundation for Statistical Computing: Vienna, Austria, 2014. [Google Scholar]
  38. Pinheiro, J.; Bates, D.M.; DebRoy, S.; Sarkar, D.; R Core Team. Nlme: Linear and nonlinear mixed effects models; R package version 3.1-122. Available online: http://CRAN.R-project.org/package=nlme (accessed on 20 January 2015).
  39. Pinheiro, J.C.; Bates, D.M. Mixed-Effects Models in S and S-PLUS; Springer: New York, NY, USA, 2000. [Google Scholar]
  40. Crawley, M.J. The R Book; Wiley: Chichester, UK; Hoboken, NJ, USA, 2007. [Google Scholar]
  41. Hothorn, T.; Bretz, F.; Westfall, P. Simultaneous inference in general parametric models. Biom. J. 2008, 50, 346–363. [Google Scholar] [CrossRef] [PubMed]
  42. Yue, C.; Kohnle, U.; Kahle, H.P.; Klädtke, J. Exploiting irregular measurement intervals for the analysis of growth trends of stand basal area increments: A composite model approach. For. Ecol. Manag. 2012, 263, 216–228. [Google Scholar] [CrossRef]
  43. Yue, C.; Kohnle, U.; Hein, S. Combining tree- and stand-level models: A new approach to growth prediction. For. Sci. 2008, 54, 553–566. [Google Scholar]
  44. Levin, S.A. Mathematical and computational challenges in population biology and ecosystems science. Science 1997, 275, 334–343. [Google Scholar] [CrossRef] [PubMed]
  45. Maj, A. Goodness-of-Fit-Measures for Linear Mixed Models with One-Level-Grouping, R Package Version 1.0; Available online: https://cran.r-project.org/web/packages/lmmfit/index.html (archived on 1 July 2015).
  46. Wykoff, W.R. A basal area increment model for individual conifers in the Northern Rocky Mountains. For. Sci. 1990, 36, 1077–1104. [Google Scholar]
  47. Monserud, R.A.; Sterba, H. A basal area increment model for individual trees growing in even- and uneven-aged forest stands in Austria. For. Ecol. Manag. 1996, 80, 57–80. [Google Scholar] [CrossRef]
  48. Laubhann, D.; Sterba, H.; Reinds, G.J.; de Vries, W. The impact of atmospheric deposition and climate on forest growth in European monitoring plots: An individual tree growth model. For. Ecol. Manag. 2009, 258, 1751–1761. [Google Scholar] [CrossRef]
  49. Pokharel, B.; Dech, J.P. Mixed-effects basal area increment models for tree species in the boreal forest of Ontario, Canada using an ecological land classification approach to incorporate site effects. Forestry 2012, 85, 255–270. [Google Scholar] [CrossRef]
  50. Shen, G.; Moore, J.A.; Hatch, C.R. The effect of habitat type and rock type on individual tree basal area growth response to nitrogen fertilization. Can. J. For. Res. 2000, 30, 613–623. [Google Scholar] [CrossRef]
  51. Wykoff, W.R. Predicting basal area increment for individual northern Rocky Mountain conifers. In Forest Growth Modelling and Simulation; Pollanschütz, J., Ed.; Mitteilungen der Forstlichen Bundesversuchsanstalt: Vienna, Austria, 1983. [Google Scholar]
  52. Ledermann, T.; Eckmüllner, O. A method to attain uniform resolution of the competition variable Basal-Area-in-Larger Trees (BAL) during forest growth projections of small plots. Ecol. Model. 2004, 171, 195–206. [Google Scholar] [CrossRef]
  53. Dormann, C.F. Parametrische Statistik. Verteilungen, Maximum Likelihood und GLM in R; Springer Spektrum: Berlin, Germany, 2013. [Google Scholar]
  54. Assmann, E. The Principles of Forest Yield Study; Pergamon Press: Oxford, UK, 1970. [Google Scholar]
  55. Pretzsch, H.; Dieler, J. The dependency of the size-growth relationship of Norway spruce (Picea abies (L.) Karst) and European beech (Fagus sylvatica (L.)) in forest stands on long-term site conditions, drought events, and ozone stress. Trees 2011, 25, 355–369. [Google Scholar] [CrossRef]
  56. Mäkinen, H.; Isomäki, A. Thinning intensity and growth of Scots pine stands in Finland. For. Ecol. Manag. 2004, 201, 311–325. [Google Scholar] [CrossRef]
  57. Klädtke, J. Wachstum großkroniger Buchen und waldbauliche Konsequenzen. Forstarchiv 2002, 73, 211–217. [Google Scholar]
  58. Çiçek, E.; Yilmaz, F.; Özbayram, A.; Efe, M.; Yilmaz, M.; Usta, A. Effects of thinning intensity on the growth of narrow-leaved ash (Fraxinus angustifolia subsp. oxycarpa) plantations. Turk. J. Agric. For. 2013, 37, 97–104. [Google Scholar]
  59. Graham, J.S. Thinning increases diameter growth of paper birch in the Susitna Valley, Alaska: 20 year results. North. J. Appl. For. 1998, 15, 113–115. [Google Scholar]
  60. Medhurst, J.L.; Beadle, C.L.; Nielson, W.A. Early-age and later-age thinning affects growth, dominance, and intraspecific competition in Eucalyptus nitens plantations. Can. J. For. Res. 2001, 31, 187–197. [Google Scholar] [CrossRef]
  61. Rytter, L.; Werner, M. Influence of early thinning in broadleaved stands on development of remaining stems. Scand. J. For. Res. 2007, 22, 198–210. [Google Scholar] [CrossRef]
  62. Badoux, E. On the effect of various methods and grades of thinning on pure Beech woods: Mitt schweiz. Anst. Forstl. Vers. 1939, 21, 59–146. [Google Scholar]
  63. Mitscherlich, G. Wald, Wachstum und Umwelt, Eine Einführung in die ökologischen Grundlagen des Waldwachstums, I. Band: Form und Wachstum von Baum und Bestand; Sauerländer: Frankfurt am Main, Germany, 1970. [Google Scholar]
  64. Zeide, B. Thinning and growth: A full turnaround. J. For. 2001, 99, 20–25. [Google Scholar]
  65. Rivas, J.J.C.; González, J.G.Á.; Aguirre, O.; Hernández, F.J. The effect of competition on individual tree basal area growth in mature stands of Pinus cooperi Blanco in Durango (Mexico). Eur. J. For. Res. 2005, 124, 133–142. [Google Scholar] [CrossRef]
  66. Ledermann, T. Evaluating the performance of semi-distance-independent competition indices in predicting the basal area growth of individual trees. Can. J. For. Res. 2010, 40, 796–805. [Google Scholar] [CrossRef]
  67. Stage, A.R.; Ledermann, T. Effects of competitor spacing in a new class of individual-tree indices of competition: semi-distance-independent indices computed for Bitterlich versus fixed-area plots. Can. J. For. Res. 2008, 38, 890–898. [Google Scholar] [CrossRef]
  68. Nagel, R.; Spellmann, H. Wachstum, Behandlung und Ertrag von Reinbeständen der Rotbuche (Fagus sylvatica L.) in Nordwestdeutschland. In Ergebnisse angewandter Forschung zur Buche; Beiträge aus der NW-FVA, Band 3; Univ.-Verl. Göttingen: Göttingen, Germany, 2008; pp. 221–265. [Google Scholar]
  69. Haywood, A. Growth of advanced European beech trees in the transformation phase in the southern Black Forest. Ph.D. Thesis, Albert-Ludwigs-Universität Freiburg, Freiburg im Breisgau, Germany, 2002. [Google Scholar]
  70. Ammer, C.; Albrecht, L.; Borchert, H.; Brosinger, F.; Dittmar, C.; Elling, W.; Ewald, J.; Felbermeier, B.; von Gilsa, H.; Huss, J.; et al. Zur Zukunft der Buche (Fagus sylvatica L.) in Mitteleuropa: Kritische Anmerkungen zu einem Beitrag von Rennenberg, H. et al. Allg. Forst- u. J.-Ztg. 2005, 176, 60–67. [Google Scholar]
  71. Kölling, C.; Walentowski, H.; Borchert, H. Die Buche in Mitteleuropa: Eine Waldbaumart mit grandioser Vergangenheit und sicherer Zukunft. AFZ/Wald. 2005, 13, 696–701. [Google Scholar]
  72. Spiecker, H.; Hein, S.; Makkonen-Spiecker, K.; Thies, M. Valuable Broadleaved Forests in Europe; Brill: Leiden, The Netherlands, 2009. [Google Scholar]
  73. Van der Maaten, E. Thinning prolongs growth duration of European beech (Fagus sylvatica L.) across a valley in southwestern Germany. For. Ecol. Manag. 2013, 306, 135–141. [Google Scholar] [CrossRef]
  74. Lebourgeois, F.; Eberlé, P.; Mérian, P.; Seynave, I. Social status-mediated tree-ring responses to climate of Abies alba and Fagus sylvatica shift in importance with increasing stand basal area. For. Ecol. Manag. 2014, 328, 209–218. [Google Scholar] [CrossRef]

