Article

Comparing the Costs and Revenues of Transformation to Continuous Cover Forestry for Sitka Spruce in Great Britain

1
Howe Street, Glasinfryn, Bangor, Gwynedd, LL57 4UN, UK
2
Forest Research, Alice Holt Lodge, Farnham, Surrey, GU10 4LH, UK
*
Author to whom correspondence should be addressed.
Forests 2015, 6(7), 2424-2449; https://doi.org/10.3390/f6072424
Submission received: 24 March 2015 / Revised: 8 July 2015 / Accepted: 9 July 2015 / Published: 15 July 2015

Abstract

:
Recently continuous cover forestry (CCF) has become an accepted approach to forest management in Britain, but uncertainty about its economic consequences may be a barrier to its wider use. A study was carried out to examine the costs and revenues of transforming a stand of Sitka spruce (Picea sitchensis (Bong.) Carr.) to CCF. The main conclusion is that transformation to CCF need not be more costly than clearfelling and replanting if natural regeneration is successful and the aim is to produce a simple canopy structure. The long-term value of transformation to a more complex canopy structure, with three or more strata, is lower and the extra costs need to be justified in terms of management objectives. The main output from the study is an analysis spreadsheet that empowers practitioners and policy makers to investigate the effects of costs, revenues and discount rates on estimates of net present value over 20 years, 100 years and in perpetuity, to suit local conditions. This paper summarises the method and results of the study in a British context, sets these in a wider international context, and considers the merits, applications and possible further developments of the approach.

1. Introduction

The massive re-afforestation efforts of the twentieth century saw woodland cover in the United Kingdom increase from a low of 5% of the total land area to its current level of 13% [1], but the speed and nature of this plantation establishment, often on marginal agricultural land in the uplands, has had a profound effect on silviculture. The only commercially significant native conifer species in the British Isles is Scots pine (Pinus sylvestris L.), and this is largely unsuited to the wetter western parts of Britain. As a consequence, much afforestation was undertaken with introduced conifer species, and in the wet and windswept western uplands the most readily established and productive species was found to be Sitka spruce (Picea sitchensis (Bong.) Carrière), a native of the Pacific northwest of North America. Conifers now make up half of the woodland area of Great Britain, and half of the conifer area is made up of stands of Sitka spruce [1].
The establishment of large even-aged plantations in areas of relatively high windthrow risk, with rotations often shortened to avoid the risk of catastrophic windthrow above a “terminal” stand top height [2], resulted in many upland forests being managed by clearfelling and replanting. There is, however, a longstanding interest in Britain in the concept of continuous cover forestry (CCF) [3] and the potential benefits it may bring. Today, while it is generally accepted that clearfelling is likely to continue on the most extreme upland sites, a strong impetus for alternative silvicultural approaches where site conditions are allowed is enshrined in the UK Forestry Standard [4], the United Kingdom Government’s approach to sustainable forest management, and in the UK Woodland Assurance Standard [5], approved by the Forest Stewardship Council (FSC) and the Programme for the Endorsement of Forest Certification (PEFC). The history of British forestry in the twentieth century means that forest managers are now often faced with the challenge of transforming even-aged spruce monocultures, originally intended to be clearfelled, to CCF [6]. Two important points made in [6] are that CCF is an approach to forest management and not a silvicultural system, and its use is constrained by wind risk, soil nutrient regime, the suitability of a species on a site, and mammal browsing.
As an experience of silvicultural alternatives to patch clearfelling is limited in Britain, the consequences of transforming stands to CCF management, particularly in terms of costs, remain uncertain [7,8], and this uncertainty may be a significant barrier to implementation (Figure 1). Although a significant literature has built up around the economics of different silvicultural approaches, studies are often rather opaque in terms of the assumptions they are based upon, which makes it difficult for forest managers to judge how the results might apply in their own circumstances. Recognising this, the CCF Working Group of the Forestry Commission, the state forest service, commissioned a study with the following aims:
1. To quantify as accurately as possible the costs, timber yields and associated revenues for three realistic transformation scenarios, and to compare them with “standard practice”, i.e., clearfell and replant.
2. To produce an analysis spreadsheet that can be used by practitioners and policy makers to allow them to investigate the effects of local conditions on results.
The original study report [9] reflects Forestry Commission practices and terminology, in particular in terms of defining CCF [7] and describing potential silvicultural approaches and outcomes [6]. It aimed for complete transparency by detailing all of the sources of information and assumptions made. The aim of this paper is to summarise the method and results of the study in a British context, to set these in a wider international context, and to consider the merits, applications and possible further developments of the approach.
Throughout this paper, as in the original report, the unit of currency used for costs, revenues and net present values is the United Kingdom pound sterling (£). Dates of formal studies providing cost data are given in full in the original report. Personal communications providing other cost data and revenue data were gathered in 2010.
Figure 1. A forwarder extracting wood in the Clocaenog continuous cover forestry (CCF) Research Forest in northeast Wales. Recently CCF has become an accepted approach to forest management in Britain but uncertainty about its economic consequences may be a barrier to its wider use.
Forests 06 02424 g001

2. Material and Methods

2.1. Scenarios

It is important to stress from the outset that the context of this study meant that no attempt has been made to financially optimise the scenarios under consideration. The aim is not to find the management alternative that gives the highest net benefit but to establish whether silviculturally realistic alternatives to clearfelling are necessarily more expensive than standard practice, which may itself more often be optimised in terms of volume production than net revenues on the public forest estate in Britain. This should be borne in mind when considering the following scenarios and the interpretation of results.
Figure 2. Stand profile diagrams showing the height development of cohorts along with major events/interventions in the first 100 years of each scenario. Height curves are indicative only. For scenarios SS2 and SS4, NR indicates the occurrence of natural regeneration. For scenario SS4, broken lines in height curves indicate that each cohort occupies only part of the stand area.
Forests 06 02424 g002
The starting point for all of the scenarios is a stand of Sitka spruce planted at 2 m square spacing and growing at yield class 14, i.e., at a maximum mean annual increment of 14 cubic metres per hectare per year [10]. Establishment at 2 m spacing gives an initial stocking density of 2500 stems per ha, the minimum requirement in Forestry Commission guidance [11]. The yield class of 14 is the average for the species in Forestry Commission forests (Justin Gilbert, pers. comm.). Cash flows and yields are expressed on a per hectare basis, but some costs depend on total stand area, which affects, for example, the intensity of sampling required in monitoring operations. For these purposes, the total stand area is assumed to be 10 ha. Management of this initial stand is assumed to be identical for all four scenarios up to and including a first line thinning at age 23 years (removing one row in seven), so the detailed scheduling of operations and cash flows started at age 25 after which the scenarios begin to diverge. The first thinning age was chosen to coincide with the standard thinning age for yield class 14 Sitka spruce at 2 m spacing, i.e., the “earliest age at which thinning can take place without losing cumulative volume production” [12]. The terminology used to describe the transformation scenarios follows that of [6], where a simple stand structure has one or two canopy layers and a complex structure has three or more canopy layers. In all cases, site conditions are assumed to be sufficiently suitable for the growth and management of Sitka spruce that stands may be thinned without undue risk of wind damage, and that there is a reasonable expectation of successful natural regeneration.
The individual scenarios are described below, while the sequence of operations and the development of cohorts are visualised in the profile diagrams in Figure 2.

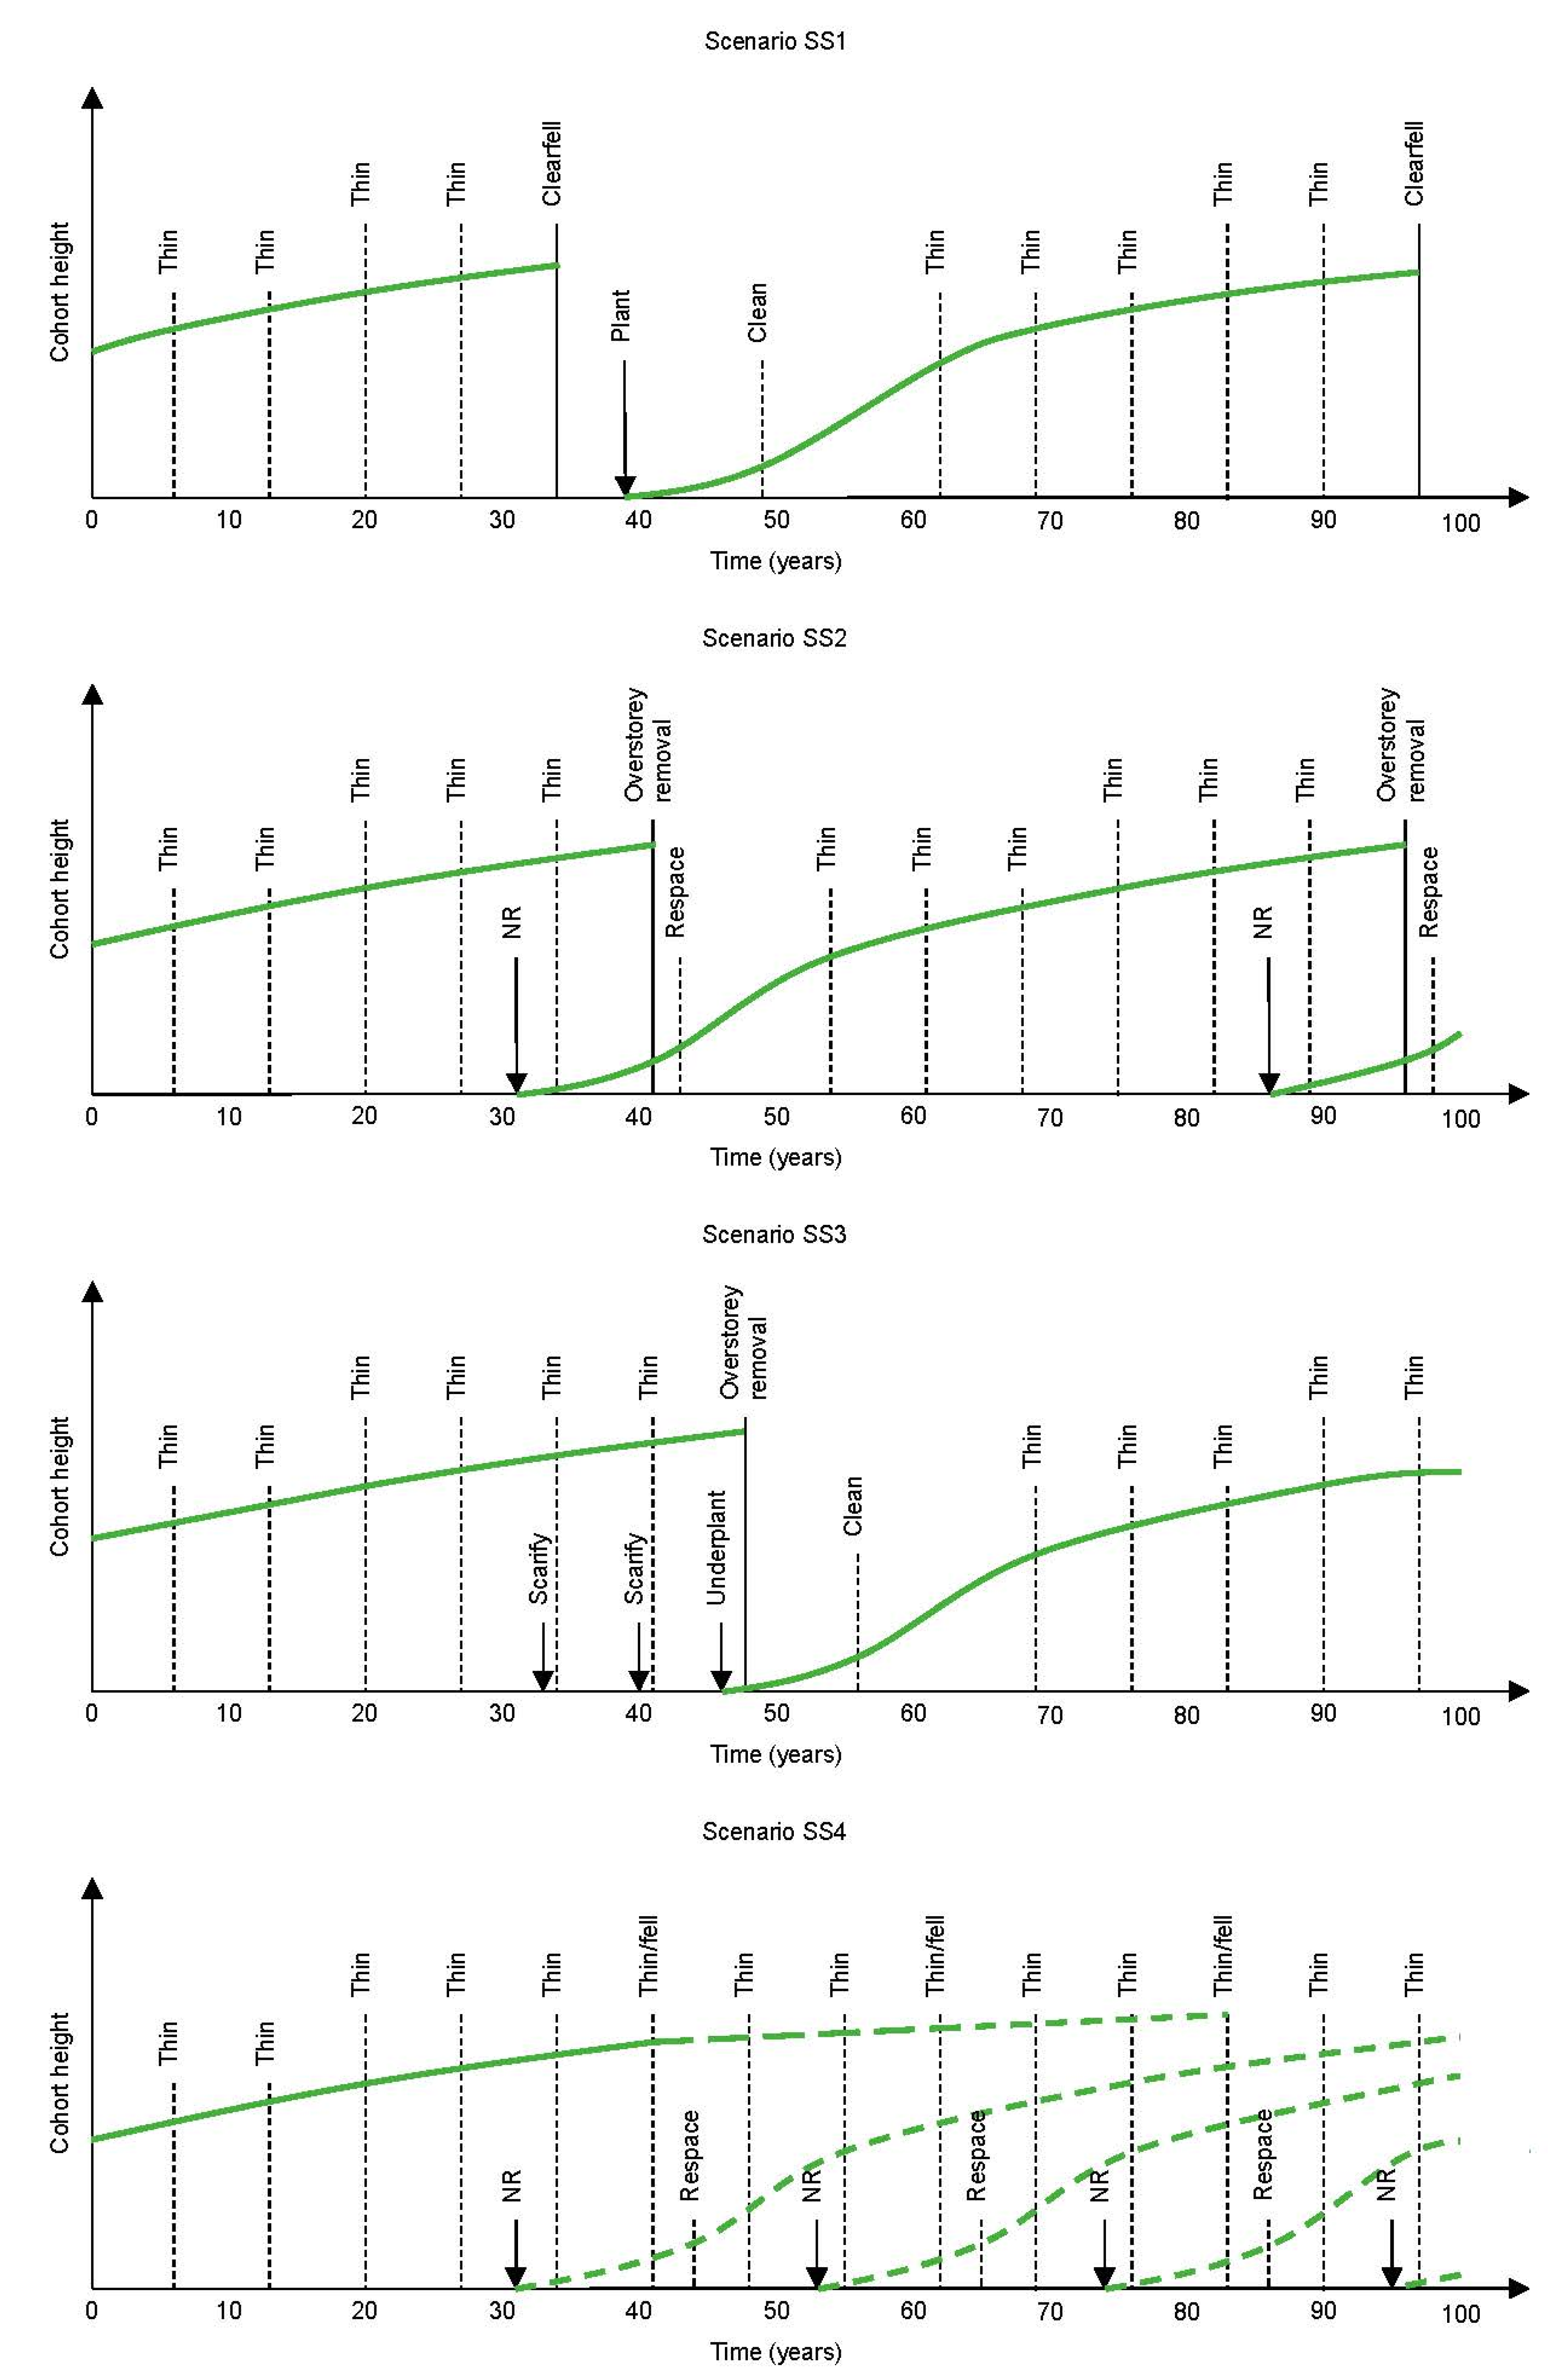
2.1.1. Scenario SS1—Clearfell and Replant

This is the baseline scenario representing current conventional practice. After the first thinning at age 23, thinning interventions are carried out on a seven-year cycle. This assumes that managers will aim for a five-year cycle but that various delays in planning and executing operations will effectively extend the thinning cycle. Thinnings at age 30, 37, 44 and 51 are intermediate in type and volume is removed at the marginal thinning intensity, i.e., the “maximum thinning intensity which can be maintained without causing a loss of cumulative volume production” [12]. Clearfelling occurs at age 58 when the stand reaches its maximum mean annual increment.
Restocking by planting occurs after a five-year fallow period primarily intended to minimise the risk of damage from the large pine weevil (Hylobius abietis L.) [13]. The fallow period means that there are no direct costs of weevil control, but there are issues with weed control. The restocking site receives an overall herbicide spray four years after clearfelling and is excavator mounded and manually planted the following year. Spot spraying around planted trees is carried out annually for the next three years. Beating up (replacing trees that have died shortly after planting) is carried out two years after planting [11], and cleaning (pre-commercial thinning) of the crop takes place ten years after planting. When the trees reach 23 years of age, the cycle of thinnings and other operations is repeated.

2.1.2. Scenario SS2—Transformation to a Simple Structure Using Natural Regeneration

Heavier thinning than in scenario SS1 is used to develop crowns and improve the likelihood of natural regeneration. After a brief period where the structure of the stand has two stories, the overstorey is removed and the natural regeneration is allowed to grow on to form a stand that is eventually regenerated in the same way; this scenario approximates a more or less uniform shelterwood [14].
After the first line thinning, thinnings are based on the guidance of [6] that early thinnings should be crown thinnings 10%–20% heavier than marginal intensity, aiming for 100–200 stems per ha at the start of regeneration. Thinnings at ages 30 and 37 are at 120% of marginal thinning intensity. To achieve reductions in basal area to or below the threshold of 30 m2 per ha which is assumed to admit sufficient understorey light for natural regeneration of Sitka spruce [15], the subsequent thinnings are increasingly heavy and, as the dominants are assumed to have been thinned to leave only desired seed trees by this stage, move from crown to intermediate to low in type.
Adequate levels of natural regeneration are assumed to be present at age 55, well beyond the age at which adequate levels of seeding can be expected [16]. Various levels of regeneration could be assumed which would have different consequences for future management. On the basis of experience in forests such as Clocaenog in North Wales, it is assumed that regeneration is dense and relatively uniform over the entire stand. This affects visibility in harvesting operations and also means that there is a requirement for respacing the regeneration. Felling of the overstorey at age 65 attracts a harvesting productivity (and therefore cost) penalty because of the restrictions on visibility and the extra care required to minimise damage to regeneration.
The respacing of regeneration occurs when the saplings reach age ten, at the upper limit of the likely optimal age range suggested by Forestry Commission guidance [17], having been delayed until after the final felling of the overstorey to allow any harvesting damage to be taken into account. Studies in dense Sitka spruce regeneration in British forests have shown that following one harvesting operation, there can still be around 1900 undamaged saplings greater than 2 m in height and around 12,000 undamaged seedlings and saplings between 0.5 and 2 m in height, alongside even greater numbers of damaged stems [18]. After respacing, the naturally regenerated crop is managed as per the initial stand.

2.1.3. Scenario SS3—Transformation to a Simple Structure Using Underplanting

This scenario is very similar to SS2 except that heavy thinning fails to result in adequate natural regeneration and, after unsuccessful attempts to encourage regeneration by spraying weeds and scarifying the ground, the stand is eventually underplanted. The overstorey is removed shortly afterwards to minimise damage to the underplanting.
Up to a crop age of 55 years, the schedule of operations is the same as for scenario SS2. As monitoring at this time shows that there is inadequate natural regeneration, weeds are sprayed off at age 56, and, at age 57, the ground is scarified to improve seed bed conditions [17]. Following thinning and further monitoring again showing inadequate regeneration, ground treatments are repeated, before a final thinning, cultivation and planting. Post-planting treatment is as per scenario SS1, except that sporadic natural regeneration is assumed to remove the necessity for beating up, and the overstorey is felled two years after underplanting with a productivity penalty. Management of the successor crop is as per the initial stand.

2.1.4. Scenario SS4—Transformation to a Complex Structure

The fourth scenario represents transformation to a complex structure that has three or more canopy layers. The development of such a structure is represented in a simplified way in this study, mainly because of the nature of the growth and yield model available. Where areas of felling and areas of regeneration are described below, no assumptions are made about their spatial arrangement, which may be in groups of various sizes. The crucial point is that, from the end of the transformation period, there are always at least three cohorts or canopy layers coexisting at the stand level. The precise spatial arrangement of cohorts might have an effect on harvesting efficiency, but it is hoped that this is accounted for by a productivity modifier, and, in any case, it is assumed that machines must travel the entire site to intervene in all size classes.
The initial stand is assumed to be managed on an extended rotation during the transformation period, with felling of final crop trees at 107 years. For this to be feasible, it is assumed that selective thinning favours individually windfirm trees. The seven year thinning cycle is retained, as experience in one of very few stands with a complex structure managed by the Forestry Commission, at Faskally in Scotland [19], has shown that this cycle gives an acceptable yield of log material in each intervention. Thinnings from age 30 to 72 aim to maintain stand basal area at around 30 m2 per ha, while crown thinnings from 79 to 100 years are intended to represent target diameter harvesting. Regeneration is assumed to occur at age 56, forming a second canopy layer, and 20% of the initial stand is felled at age 65 to accommodate this layer. A third canopy layer is assumed to establish when the initial stand is 77 years old, and a further 20% of the initial stand is felled when it is 86 years old. A fourth canopy layer arises at age 98, effectively completing the replacement of the initial stand. Thinning and felling from age 65 to final felling at 107 attract a harvesting productivity penalty.
Starting with the second cohort, a new cohort is recruited every 21 years, and, for modelling purposes, each is managed on a 79 year “rotation”. In reality, management would be on the basis of tree size, and the 79-year rotation simulates target diameter harvesting at approximately 55 cm DBH (diameter at breast height, 1.3 m). Regeneration is respaced 12 years after establishment. The first thinning at age 23 is intermediate rather than line on the assumption that respacing of regeneration and operations in other canopy layers would have maintained racks. Rather than establishing access to the stand, this thinning is assumed to remove poorly formed or damaged stems. Each canopy layer is assumed to be replaced by regeneration occurring at age 63. Thinning and felling from age 72 attract a harvesting productivity penalty.
From the establishment of the third canopy layer, there are always at least three layers present. Second and subsequent canopy layers are each taken to occupy 40% of the stand area, on the assumption that there will always be some overlap of younger layers into the understorey of older cohorts.

2.2. Growth and Yield Modelling

Previous attempts to model continuous cover forestry scenarios in Britain [20] have been limited by their reliance on the static yield tables available in Britain [10]. A recent step forward in modelling silvicultural scenarios more flexibly has been the development by Forest Research of the M1 growth and yield model [21]. Crucially this allows much greater flexibility in specifying growth rate (as yield class), initial spacing, and the timing, type and intensity of thinning operations. It is a stand level model, however, and cannot model the growth response of individual trees in irregular silviculture; this limitation is touched upon in the discussion. The standing volume data for all four scenarios are given in the original study report, and are summarised graphically in Figure 3; timber volume yields are given in the Results section.
Figure 3. Stand standing volume development over the first 100 years of all four scenarios. Note that the standing volumes of scenarios SS2 and SS3 are identical up to year 40, so that the SS3 line masks that for SS2. Note also that the M1 model does not produce volume figures until stands reach age 15, which accounts for breaks in data even when rotations overlap through natural regeneration (SS2) or underplanting (SS3) and for a longer break in the data than would be suggested by the five year fallow period in scenario SS1.
Forests 06 02424 g003

2.3. Costs

Costs were considered in four groups, namely monitoring and tariffing (stand assessments), establishment (regeneration), harvesting, and annual costs. Stand assessments included standard practices for monitoring establishment of planted trees and for assessing standing volumes before clearfelling in scenario SS1, as well as methods developed specifically for monitoring transformation [22], applied more intensively in the more complex scenario SS4. Establishment costs included those for excavator mounding (higher per hectare for underplanting than for clearfell restocking), plants, planting (higher per plant for underplanting and beating up), scarification, herbicide applications, cleaning and respacing. Harvesting costs for mechanised harvesting were calculated using yield data and work study results [23] which demonstrated relationships between mean tree volume and harvester productivity, and between mean tree volume, total volume extracted per hectare and forwarder productivity. Penalties were applied to both harvester and forwarder productivity in CCF situations where machine access or visibility were limited, or where operators had to avoid damage to underplanted trees [24,25]; in these cases, machine productivity (in m3 per standard hour) was reduced to 90% for harvesting and 76% for forwarding. In transformation scenarios with large tree sizes, additional motor manual felling costs were incurred on a proportion of trees too large for mechanised harvesting. Some costs which applied more or less constantly (mammal control), which could not be confidently attached to specific interventions (road maintenance), or for which there were no reliable sources (management overheads) were treated as annual costs. Mammal control and management overheads were considered higher for transformation scenarios SS2 and SS3 (150%), and higher still for SS4 (200%), when compared with the standard practice in SS1 (100%). In the case of management overheads, this was taken to represent the relative unfamiliarity of managers with CCF and the need for more active planning and supervision, but, as these figures were not based on hard data, they were included in the sensitivity analysis for results (see below).

2.4. Revenues

To estimate harvesting revenues, the volume yield was assigned to three product categories, namely sawlogs, bars and chipwood/pulpwood. Sawlogs were assumed to have a minimum top diameter overbark of 18 cm and a minimum length of 3 m; bars were assumed to have a minimum top diameter overbark of 14 cm and a minimum length of 2 m; chipwood and pulpwood were assumed to account for the remaining volume to 7 cm top diameter overbark. Assortments between these products were calculated using Tables 33 and 34 in [26], maximising the proportions of the larger products. Roadside prices were attached to the three product categories on the basis of recent sales figures but, recognising their potential variability, the effects of changing product prices were considered in the sensitivity analysis (see below).

2.5. Financial Comparisons

All financial comparisons between scenarios were made on the basis of net present values (NPVs), i.e., the sum of discounted revenues minus the sum of discounted costs using Equations (7.2a) and (7.5) from [27]. All comparisons use the same start point, i.e., Year 1 for discounting purposes is Year 25 in the life of the initial stand. Three timescales were used: in perpetuity, 100 years and 20 years. Comparisons made in perpetuity are a standard method for making comparisons between different silvicultural regimes that have different “rotations” [26]. However, one of the objectives of this study was to examine shorter-term financial implications. The 100-year timescale, representing the medium term, is twice the length of the time period stated to be covered by forestry strategies such as Woodlands for Wales [28]. The 20-year time period, equivalent to the period covered by the 2005 UK softwood production forecast [29], which guides investment decisions in the sawmilling industry, provides an indication of short-term consequences.
The context of the study was the public forest estate and therefore the choice of discount rate was based on recommendations in the Treasury Green Book [30], the guidance used by the UK central government in evaluating policies. The Green Book specifies that a declining rate is appropriate when considering long-term investments, justifying this in terms of uncertainty about the future [29] (p. 98); the rates applied according to the time period under consideration are shown in Table 1.
Declining discount rates are handled in the analysis spreadsheet by calculating a “time adjusted discount rate” for each year, which is the product of 1 + r for the year in question and every previous year, where r is the decimal discount rate. This time adjusted rate takes the place of (1 + r)t in conventional calculations with a fixed discount rate, where t is the year. The discount rate declines until year 301, at which point it no longer changes. The extent of each scenario worksheet in the analysis spreadsheet is therefore determined by the fact that every cash flow must occur once from year 301, at which point its present value in perpetuity (PV) can be calculated as follows:
P V = P V 301 × ( 1 + r 301 ) T ( 1 + r 301 ) T 1
where PV301 is the present value of the cash flow at the first occurrence from year 301, r301 is the decimal discount rate from year 301, and T is the duration of the cash flow in years.
Annual costs are a simplified case where (1 + r)1 = 1 + r.
Table 1. Declining discount rate according to time period.
Time Period (years)Discount Rate (%)
0–303.5
31–753.0
76–1252.5
126–2002.0
201–3001.5
301+1.0

2.6. Sensitivity Analysis

To examine the sensitivity of the results to some of the main assumptions, the following factors were varied:
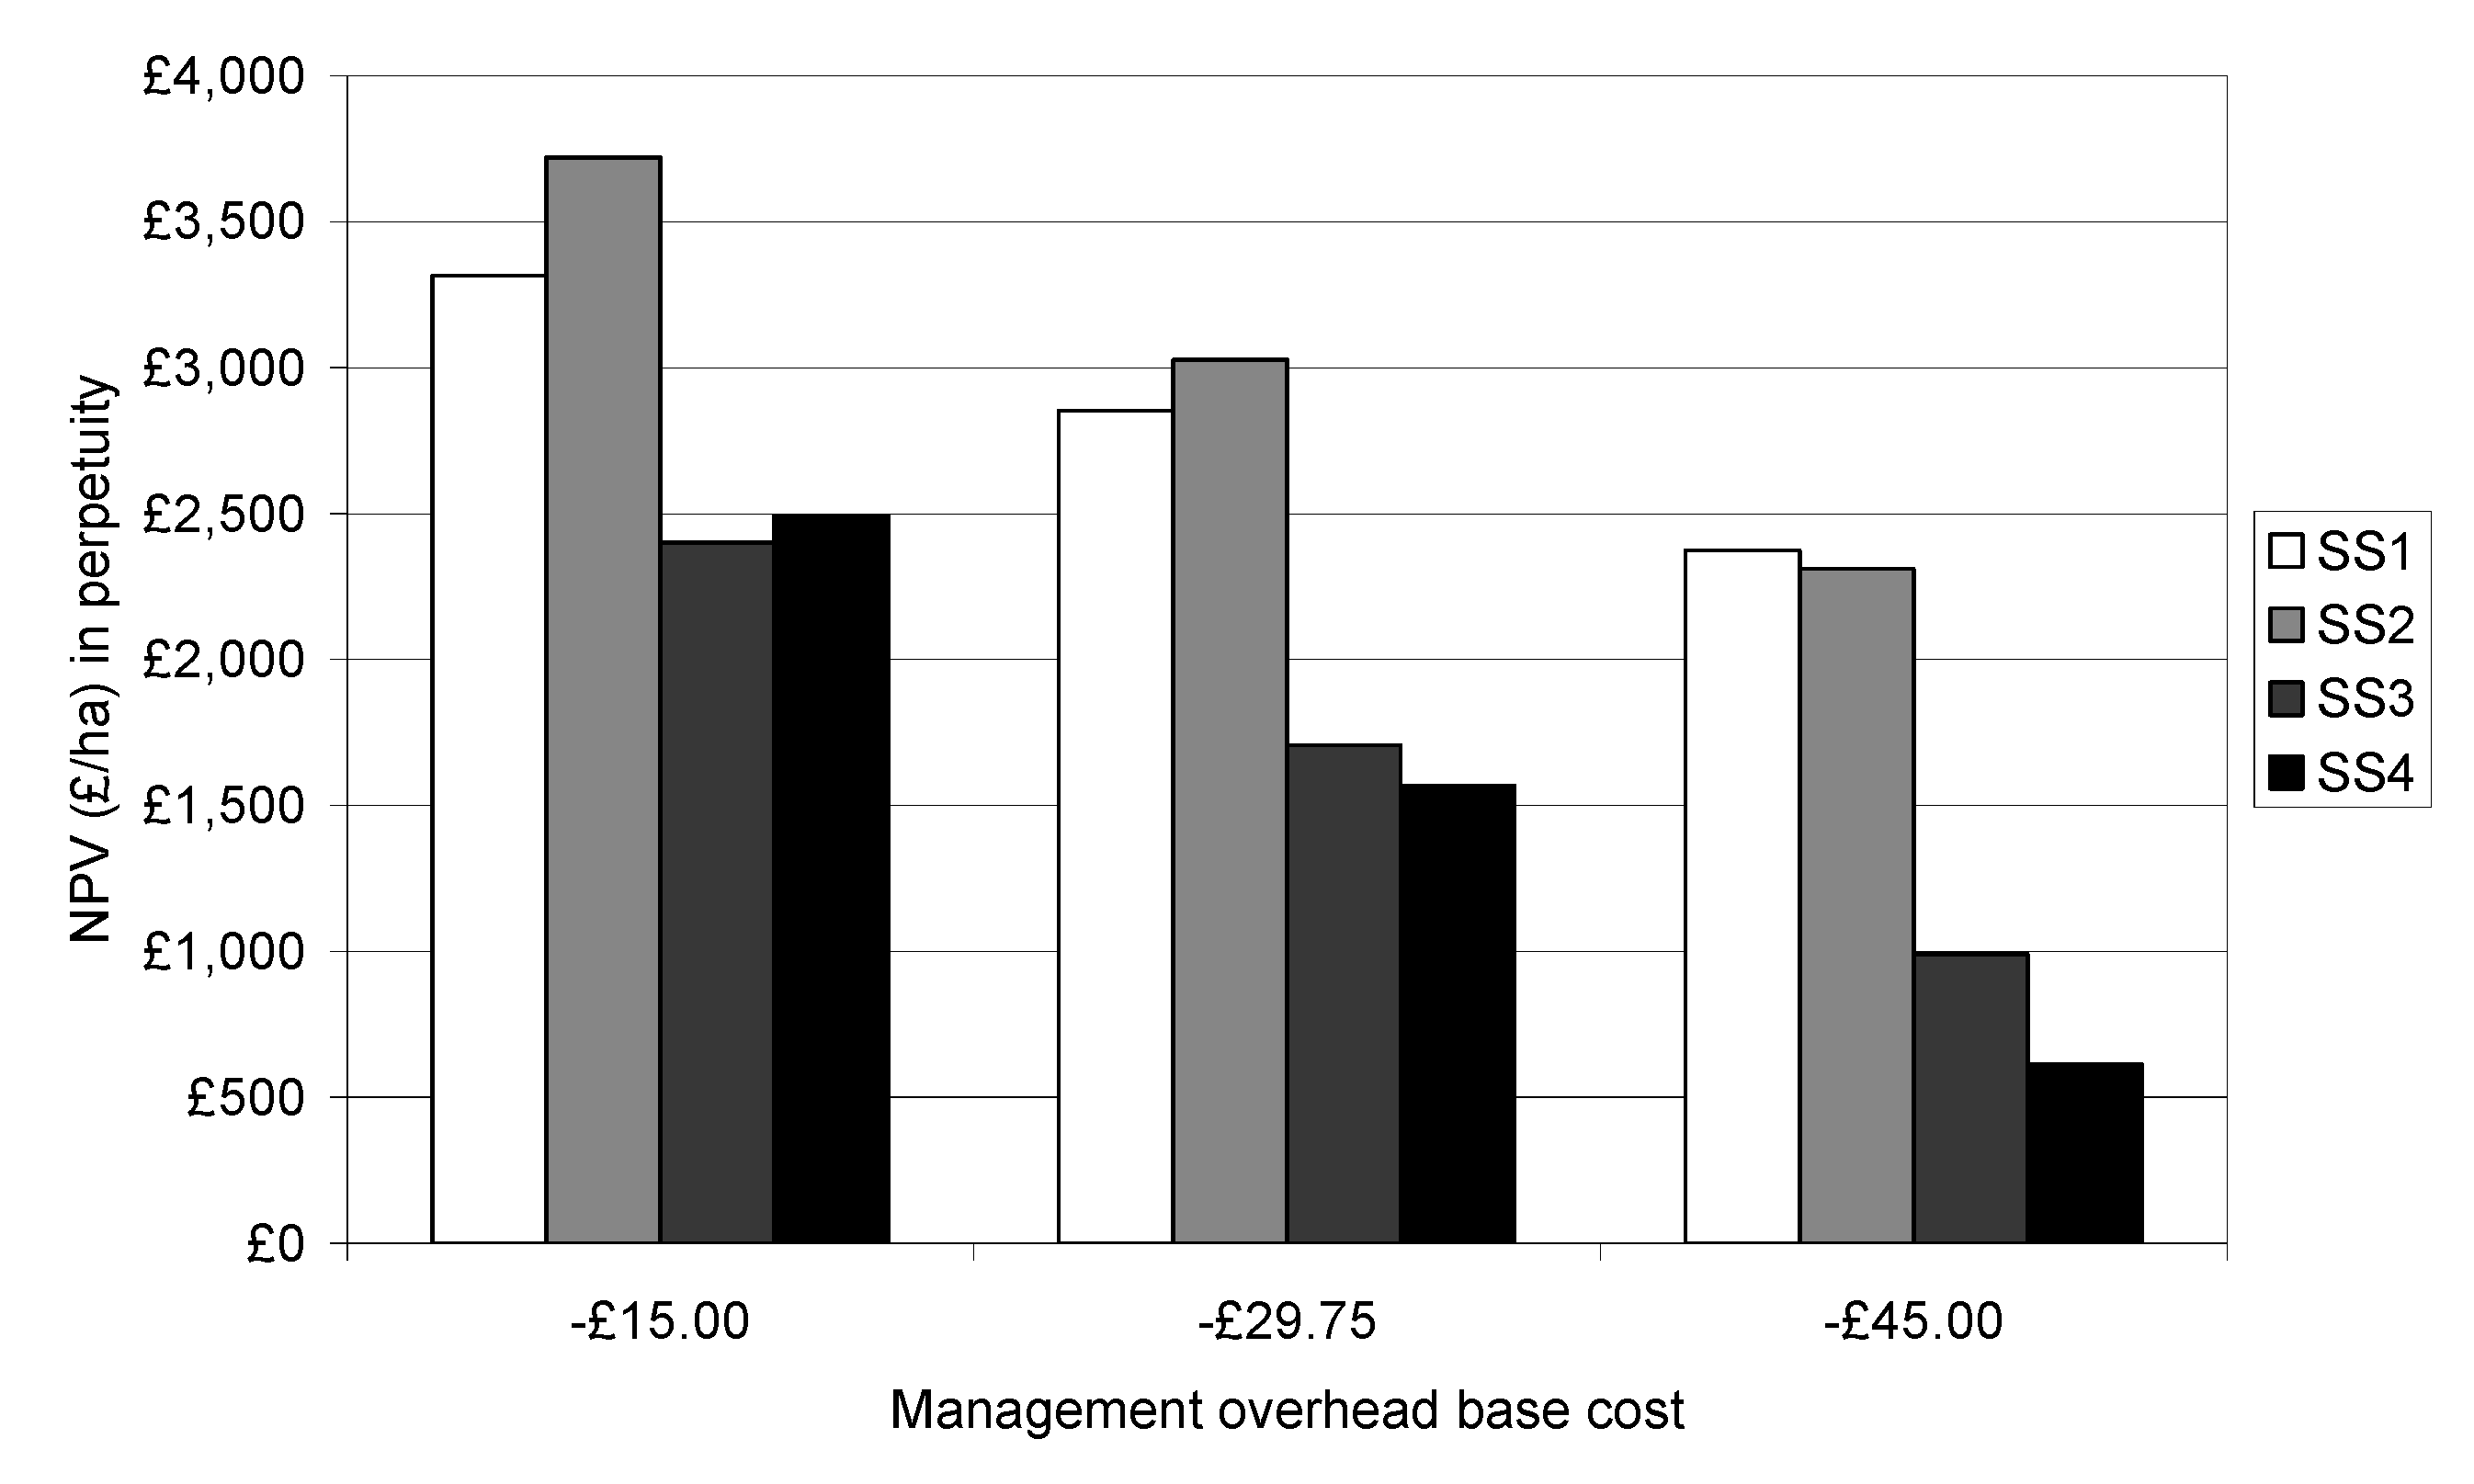
  • Management overhead costs—in addition to the baseline cost of £29.75 per hectare per year, a reduced overhead of £15 and an increased figure of £45 were used. Note that these changes in the absolute management overhead cost do not alter the relative costs, which remain at 150% for scenarios SS2 and SS3 and at 200% for scenario SS4.
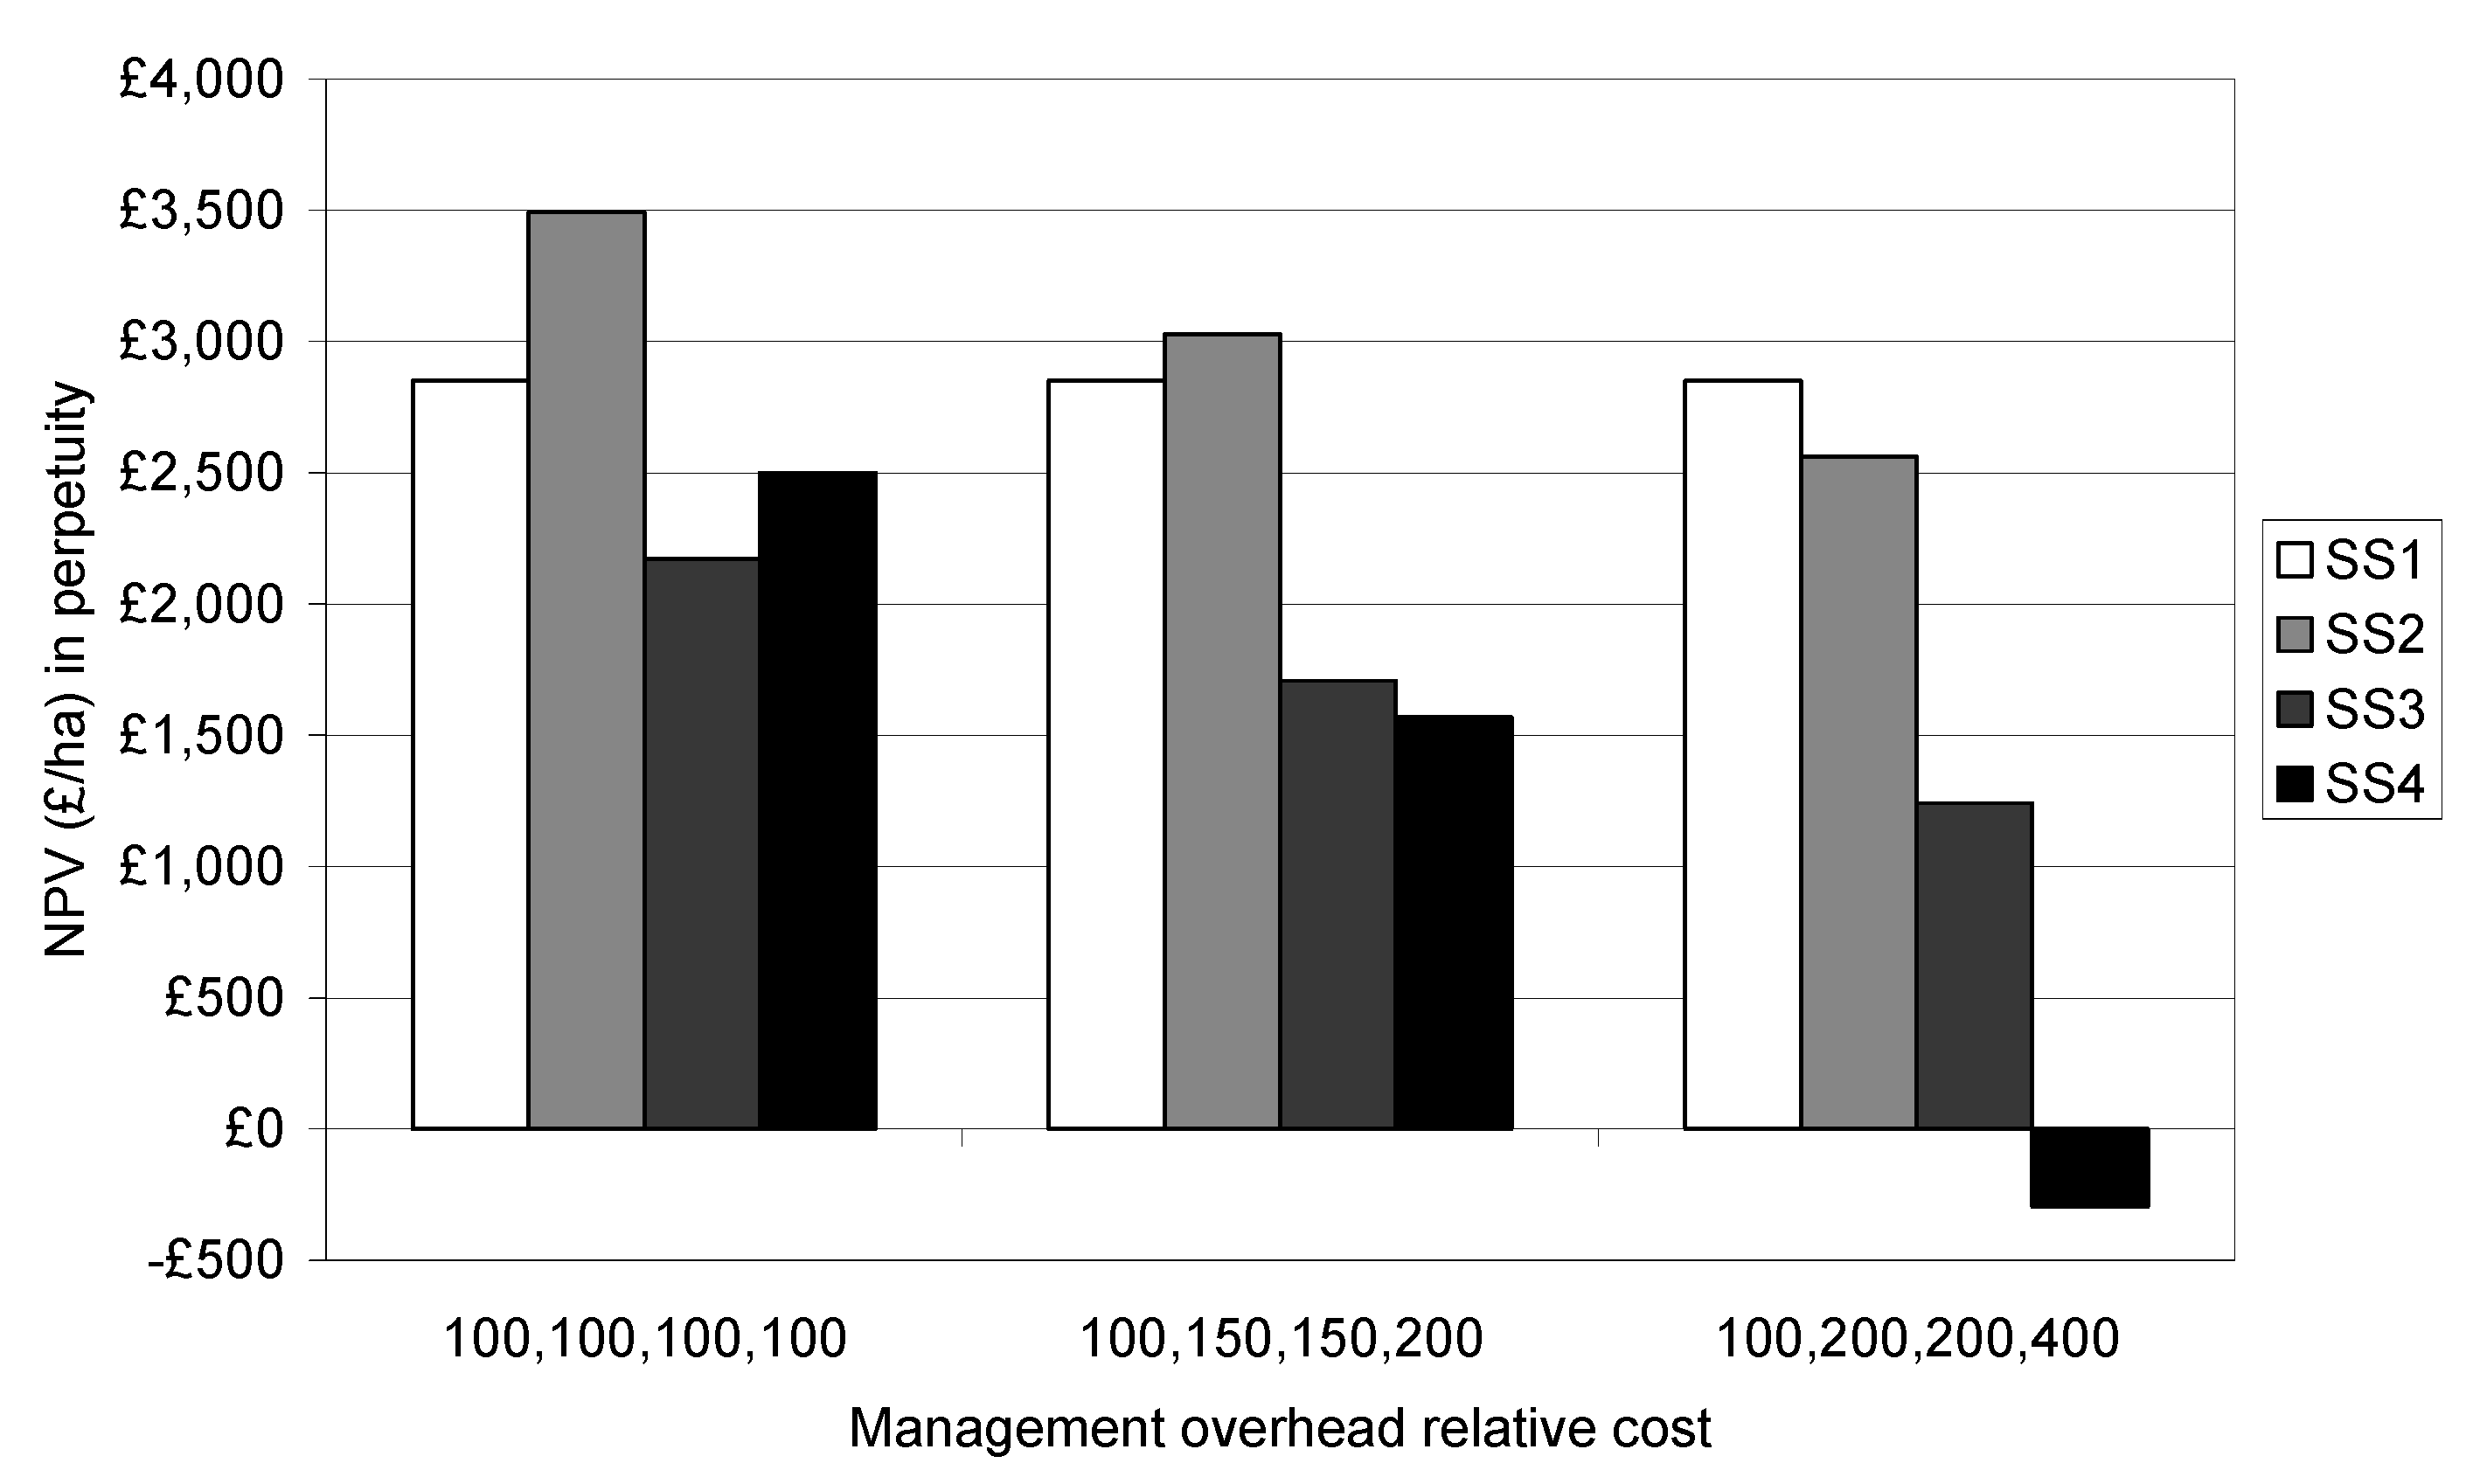
  • Relative management overhead costs for the four scenarios—in addition to the baseline of 100%/150%/150%/200% for the four scenarios, comparisons were made with no differentiation in cost between scenarios (100% for all four regimes) and with a greater differentiation in cost (100% for SS1, 200% for SS2 and SS3, and 400% for SS4).
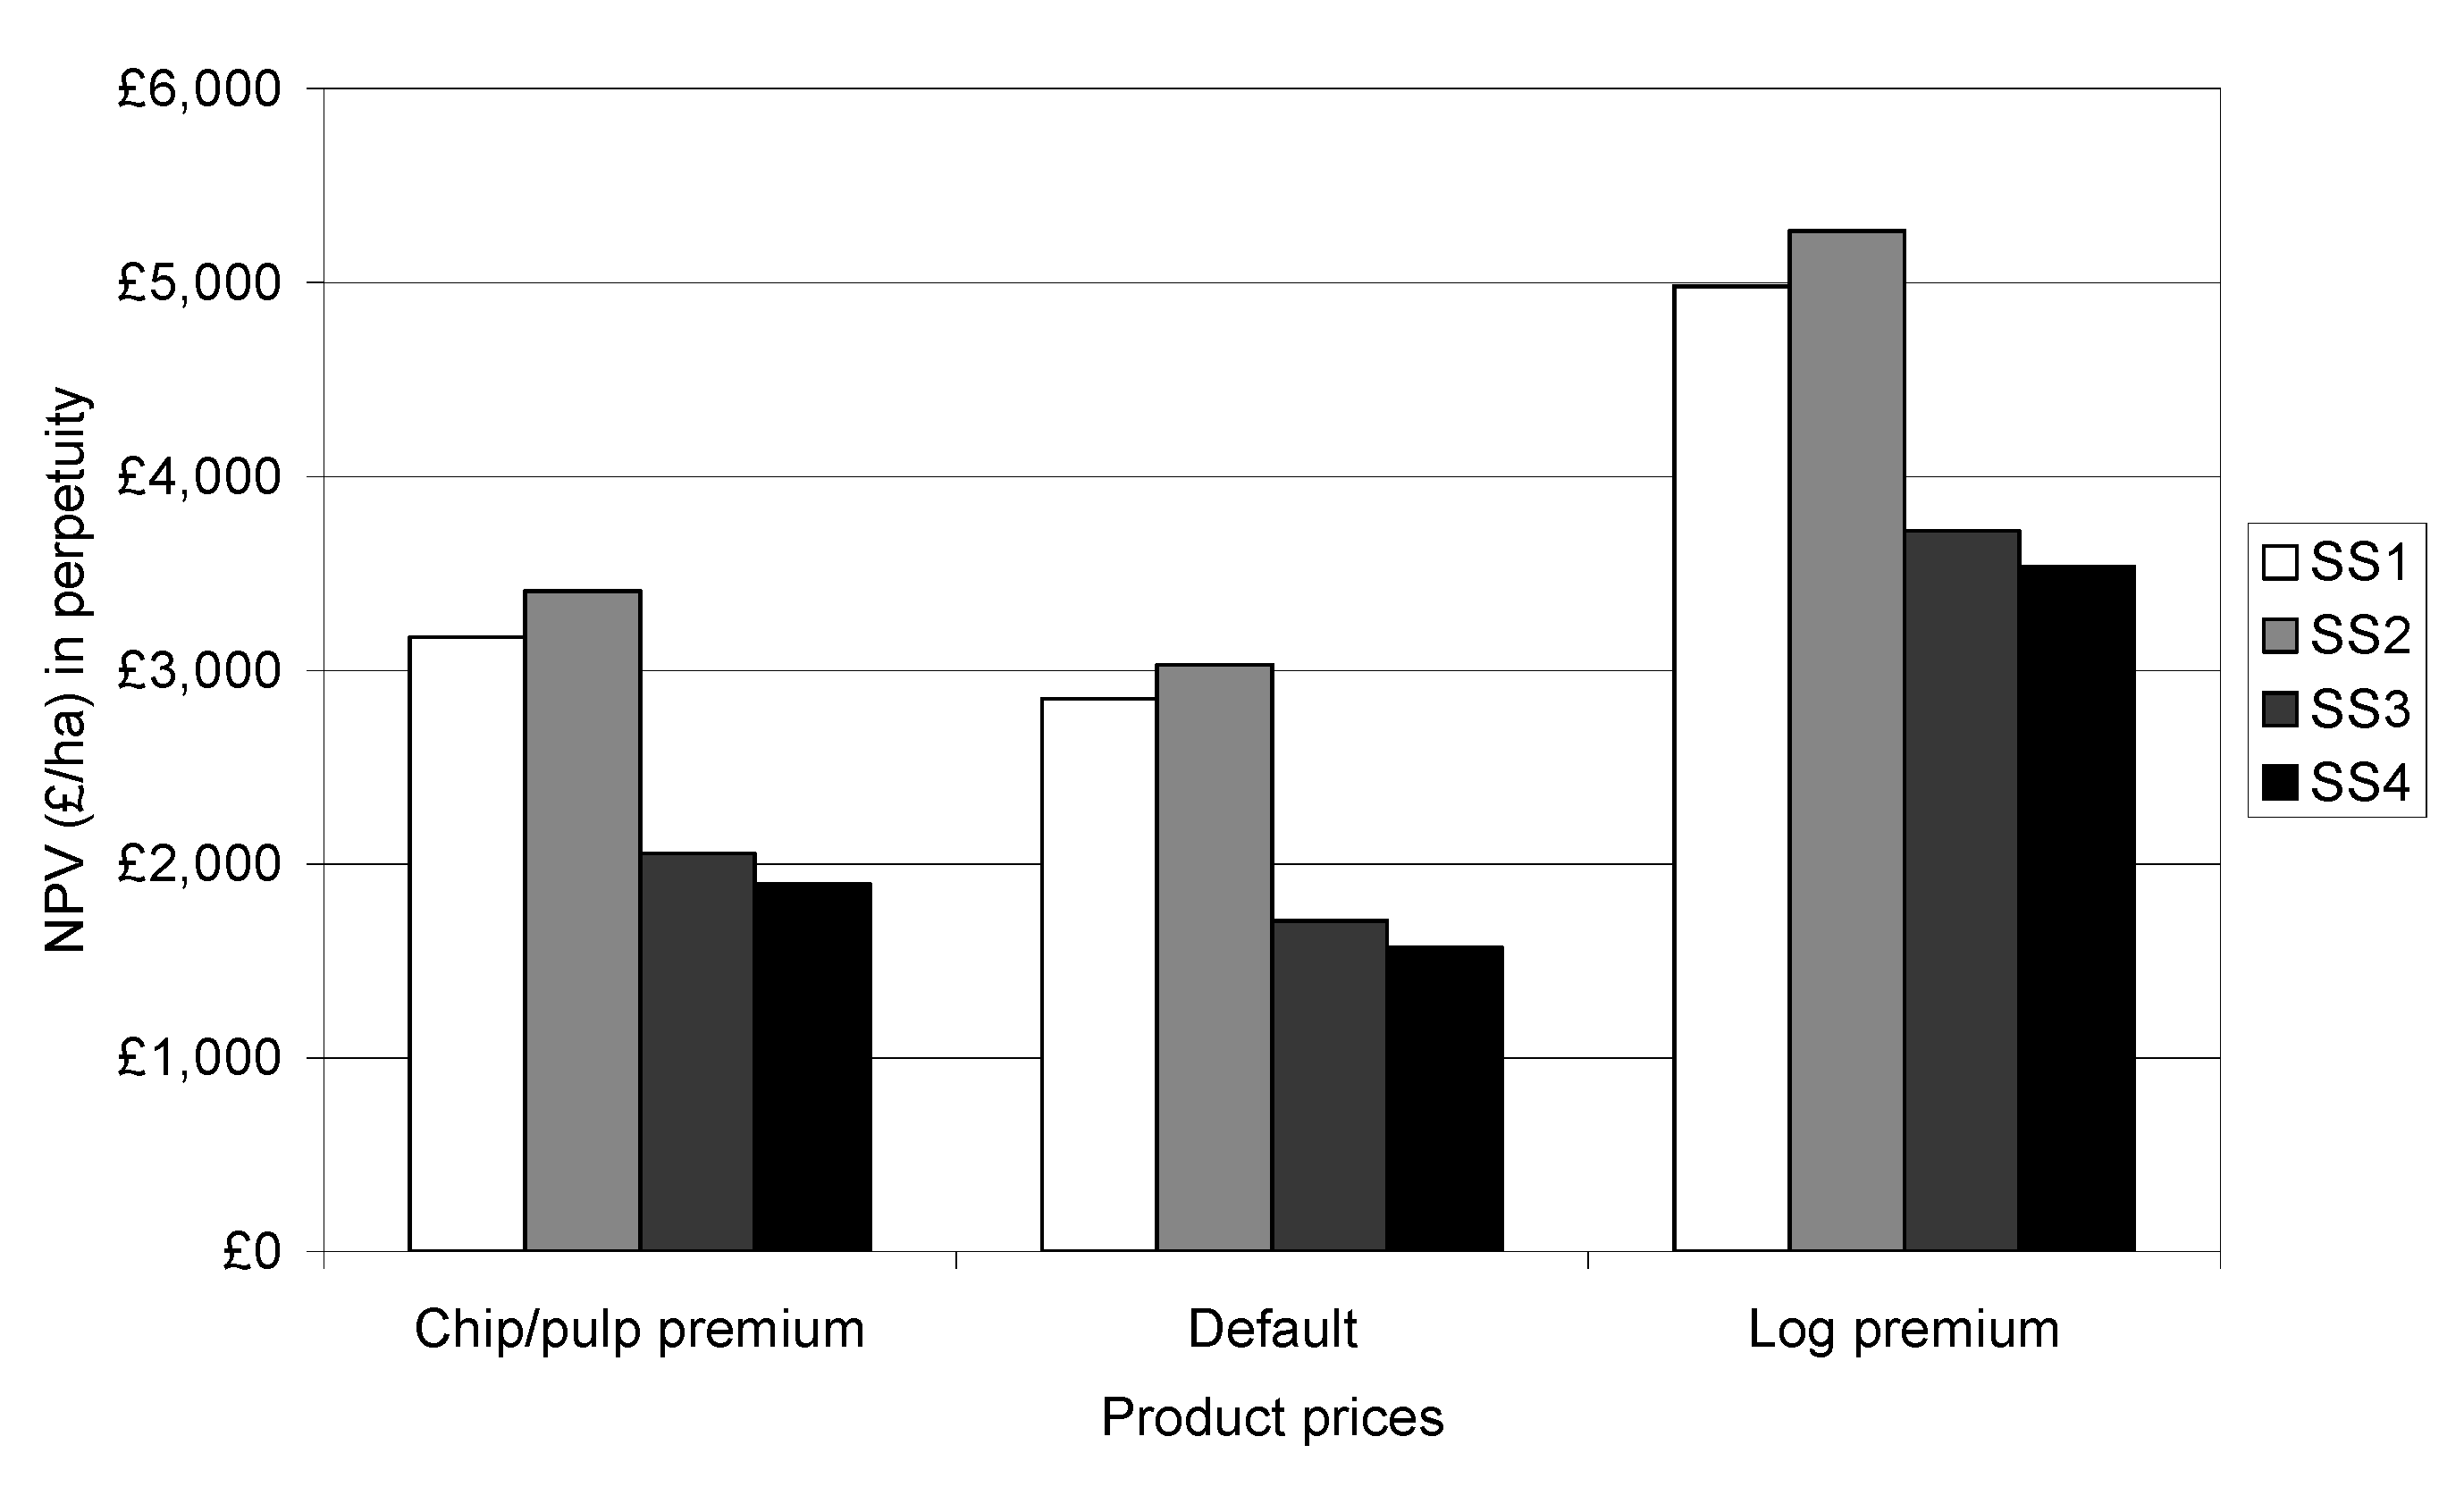
  • Product prices—in addition to the baseline, one option assumed a higher value for chipwood/pulpwood of £20 m−3 (in a British context representing potentially increased demand for biofuel) and another option assumed an enhanced value of £40 m−3 for sawlogs.
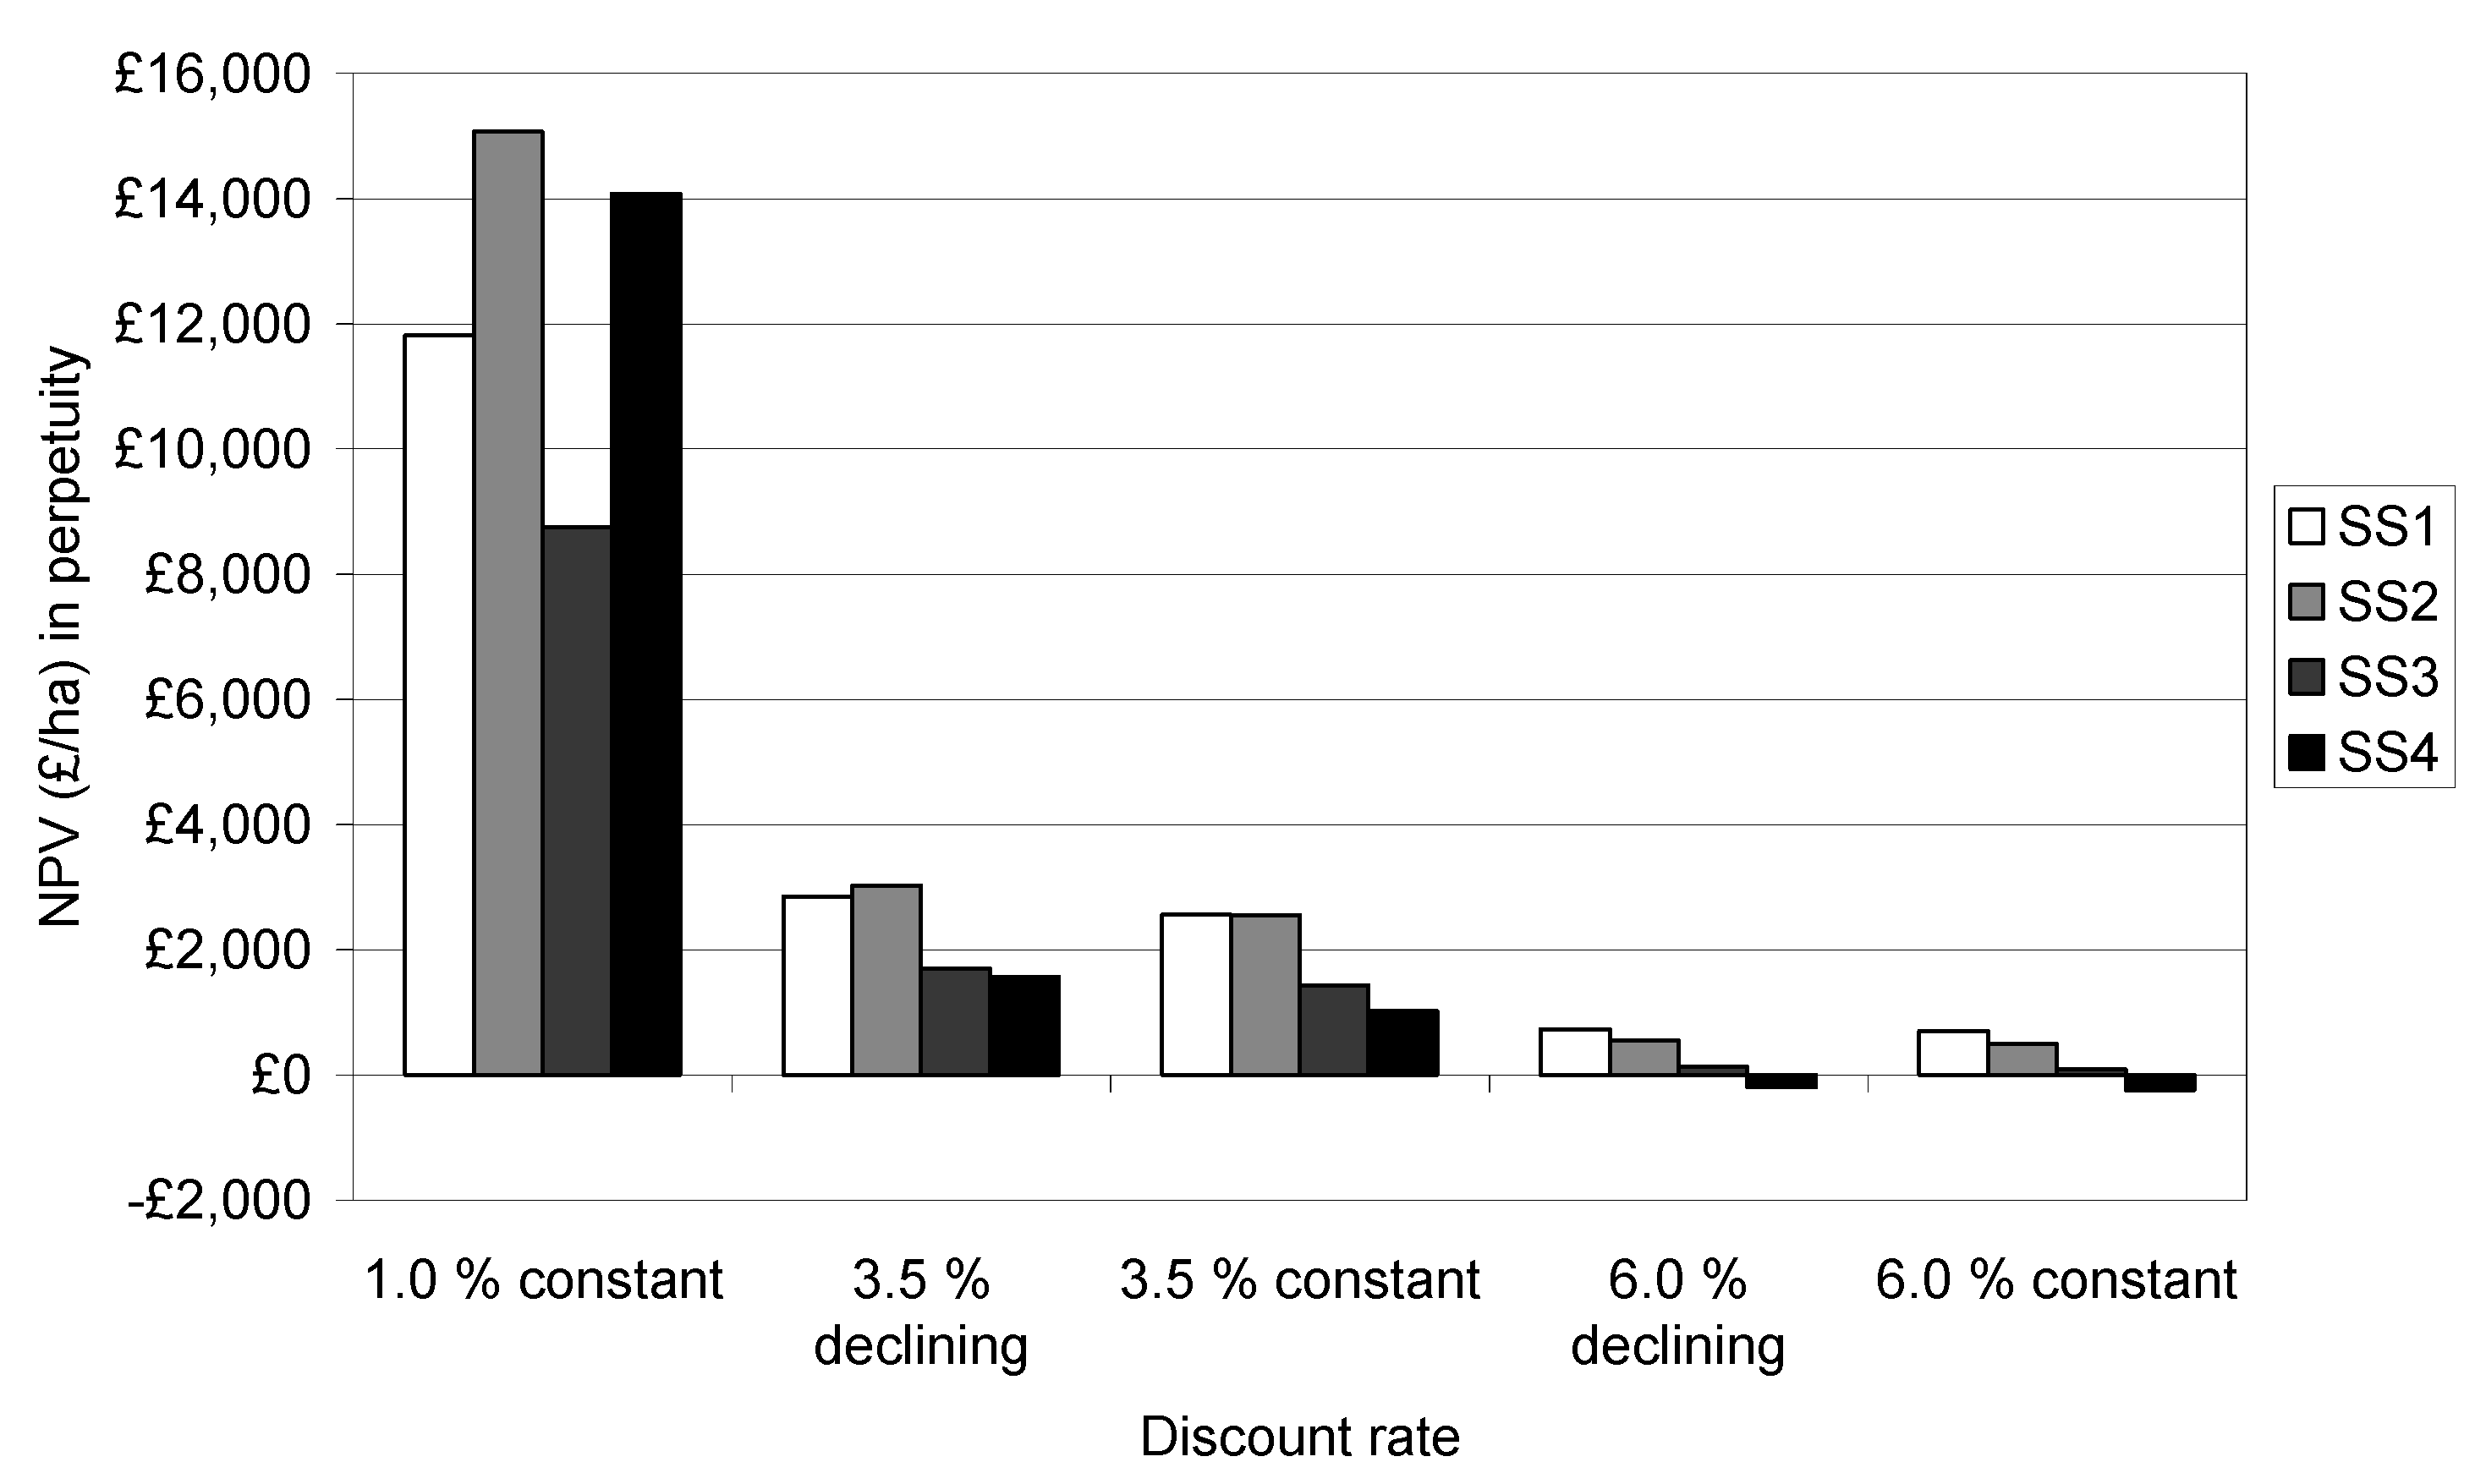
  • Discount rate—the following rates were investigated: 1.0% constant, 3.5% declining (the baseline rate), 3.5% constant, 6.0% declining, and 6.0% constant.
Absolute and relative management costs were included in the sensitivity analysis because of the absence of hard data; it was deemed necessary to establish whether the estimated costs had an undue effect on the financial comparisons. Product prices were also investigated because, as timber revenues were the only sources of income considered and are in reality potentially highly variable, they might also have a pronounced effect on comparisons. Finally, discount rates were varied to account for different time preference behaviours of decision makers.

3. Results

3.1. Net Present Values Using Baseline Assumptions

The net present values derived using the baseline assumptions are shown in Table 2. Immediately evident is the fact that none of the scenarios breaks even over the first 20 years. The management in scenarios SS2 and SS3 does not differ over this period so their NPVs are identical; they are also the least costly scenarios over this time period. For longer time horizons, all scenarios have positive values, but the ranking changes over 100 years with SS1 showing the highest net present value. Considering cash flows in perpetuity alters the ranking once again, with scenario SS2 showing the highest NPV. Both SS3 and SS4 have higher NPVs when considered on this timescale than over a 20- or 100-year timescale.
On the basis of these net present values, scenario SS2, transformation to a simple structure with successful natural regeneration, is the least costly option in the short term, roughly equally as valuable as current standard practice over the medium term, and the most valuable option in the long term. Scenario SS4, transformation to a complex structure, yields the lowest net returns over the medium term and in perpetuity. This diminution in financial value should be considered in the light of any increase in ecosystem service provision, which might be attributed to this management type.
Table 2. Net present values using baseline assumptions.
ScenarioNet Present Value per Hectare Considering Cash Flows…
to 20 yearsto 100 yearsin perpetuity
SS1−£724 (−100.0%) a£2,875 (100.0%)£2,852 (100.0%)
SS2−£600 (−82.9%)£2,822 (98.1%)£3,027 (106.1%)
SS3−£600 (−82.9%)£1,398 (48.6%)£1,706 (59.8%)
SS4−£651 (−89.9%)£988 (34.3%)£1,568 (55.0%)
a The relative performance of scenarios is shown with the negative or positive NPV of scenario SS1 taken as 100%.

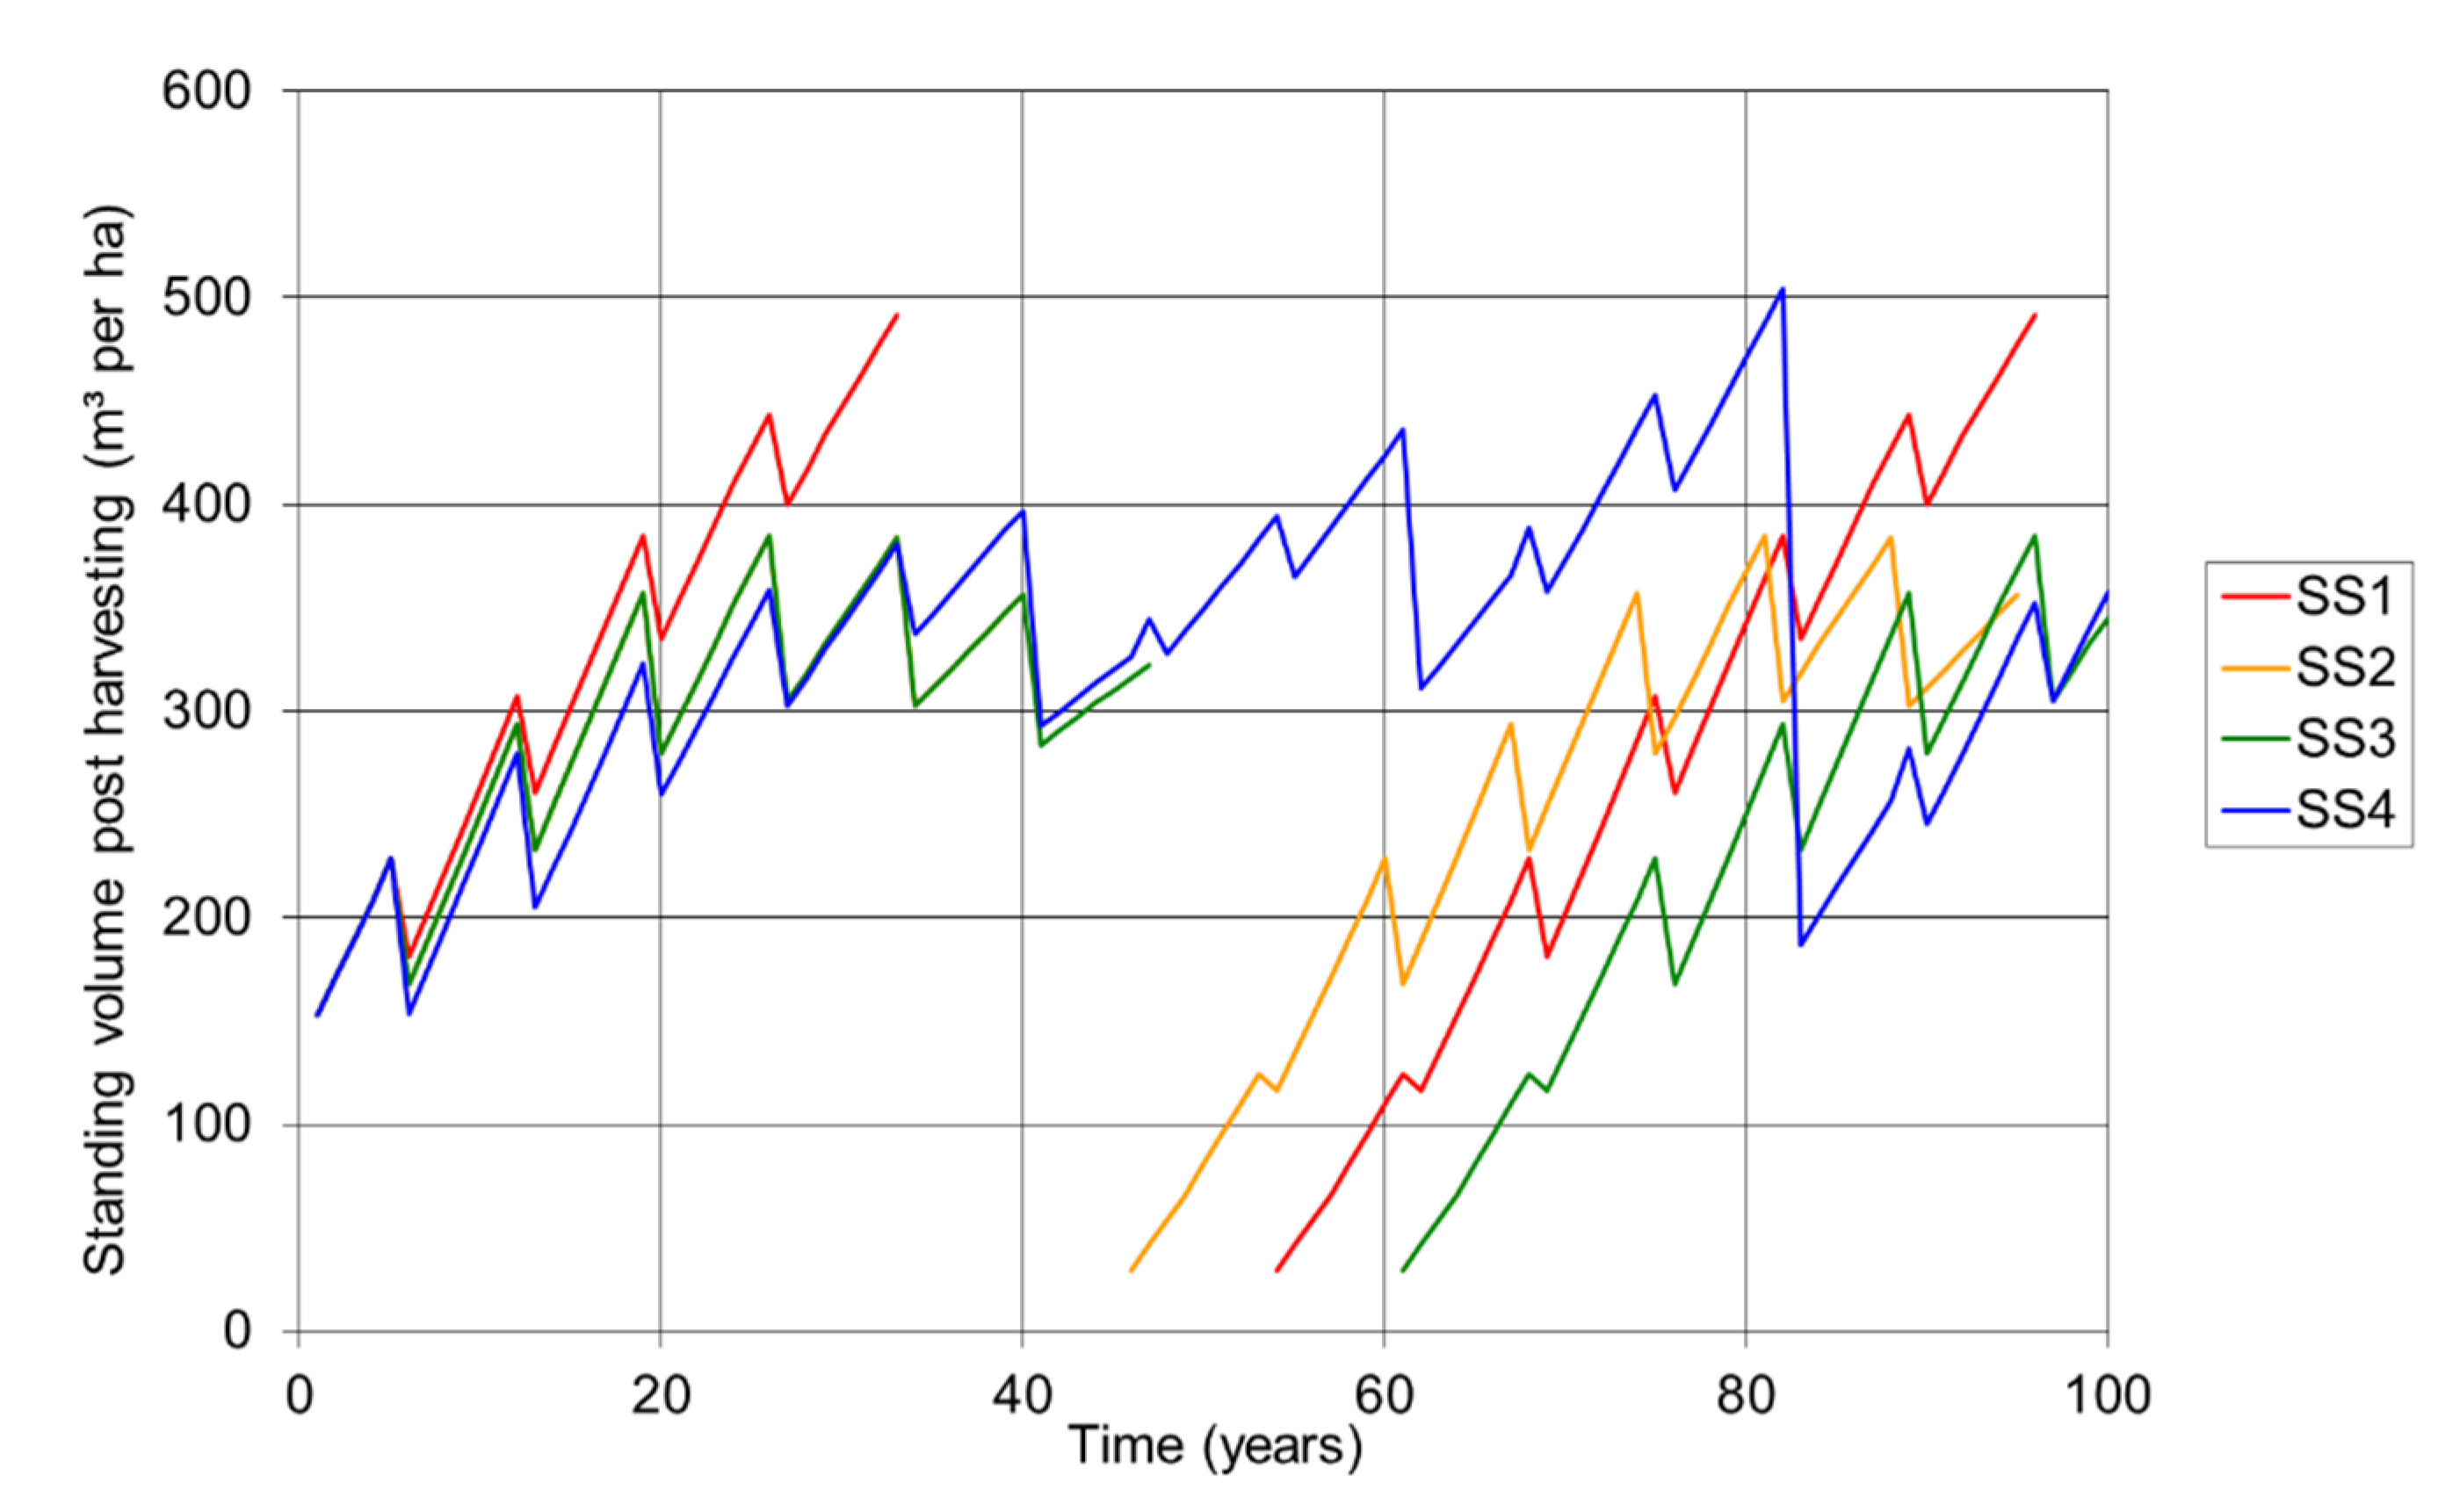
3.2. Volume Outturn Using Baseline Assumptions

The total volume outturn for each scenario is set by the growth and yield data, and the breakdown of that volume into individual products is determined by the product specification. Table 3 and Table 4 show the volume outturn over the first 20 and 100 years respectively of each scenario on the basis of the baseline product specifications. In the short term, scenario SS4 yields the greatest volume of timber and the highest proportion of log material because of initial heavy crown thinnings. The intermediate thinnings at marginal intensity in scenario SS1 yield the smallest total volume, the lowest proportion of log material and the highest proportion of chip and pulp. In the medium term (Table 4), the ongoing transformation to a complex structure in scenario SS4 yields a relatively low total volume but the highest proportion of logs. Scenario SS2, transformation to a simple structure with successful natural regeneration, yields both the greatest average annual volume outturn and the greatest volume of log material.
Table 3. Volume outturn over 20 years using baseline assumptions.
ScenarioMean Annual Volume Outturn (m3 per ha per year)
SawlogsBarsChip/pulpTotal
SS12.8 (27.3%)3.3 (32.3%)4.2 (40.3%)10.3
SS24.0 (31.1%)4.0 (30.6%)5.0 (38.3%)13.0
SS34.0 (31.1%)4.0 (30.6%)5.0 (38.3%)13.0
SS44.8 (35.3%)4.2 (31.0%)4.6 (33.8%)13.7
Table 4. Volume outturn over 100 years using baseline assumptions.
ScenarioMean Annual Volume Outturn (m3 per ha per year)
SawlogsBarsChip/pulpTotal
SS111.1 (70.5%)2.3 (14.4%)2.4 (15.0%)15.7
SS211.8 (71.3%)2.2 (13.3%)2.5 (15.3%)16.6
SS38.0 (64.1%)2.0 (16.3%)2.4 (19.7%)12.4
SS49.2 (71.9%)1.6 (12.4%)2.0 (15.8%)12.9

3.3. Sensitivity Analysis

In reporting the results of the sensitivity analysis, it is assumed that it is any change in the relative performance of the four scenarios that is of interest. Changes in the absolute performance of scenarios are noted only when they involve a change from a positive to a negative net present value.

3.3.1. Management Overheads

Net present values in perpetuity for all four scenarios at the three management overhead base costs tested are illustrated in Figure 4. It may be noted that, for all three costs, scenarios SS1 and SS2 have substantially higher NPVs than SS3 and SS4. If overheads are lower (i.e., £15 per hectare per year), scenarios SS3 and SS4 swap rankings between third and fourth. If overheads are higher (i.e., £45 per hectare per year), the net present value of scenario SS1 slightly exceeds that of SS2, while the relative difference in NPV between SS3 and SS4 increases. The lower cost also favours scenario SS4 over shorter time horizons [9], particularly over the first 20 years when the rank of the scenario improves from second most costly to least costly. The higher cost of £45.00 worsens the performance of SS4 from second most costly to most costly over 20 years but does not affect the ranking of scenarios over 100 years.
Changes in relative management cost (Figure 5) primarily affect the relative performance of scenario SS4. With no differences in relative cost between the scenarios, SS4 is ranked third in terms of NPV, but in the other comparisons it is fourth and clearly affected by overheads at 400%. Despite the favourable management cost assumptions for SS1, it only outperforms SS2 when the relative cost for SS2 rises to 200%. Over shorter time horizons, equal relative costs favour scenario SS4, increasing its rank from second most costly to least costly over 20 years, while higher costs for transformation scenarios naturally favour scenario SS1, increasing its NPV from most costly to least costly over 20 years [9].
Figure 4. Changes in net present value of scenarios with different management overhead base costs. Note that these changes in the absolute management overhead cost do not alter the relative costs, which remain at 100% for scenario SS1, 150% for scenarios SS2 and SS3 and at 200% for scenario SS4; for the effect of changes in relative management costs, see Figure 5.
Forests 06 02424 g004
Figure 5. Changes in net present value of scenarios with different management overhead relative costs.
Forests 06 02424 g005

3.3.2. Product Prices

Changes to product prices, even a very substantial premium on sawlogs, do not affect the ranking of scenarios by NPV in perpetuity (Figure 6). Nor do they affect the ranking of scenarios over 100 years, and over 20 years the only effect of the log premium is to greatly improve the performance of scenario SS4, which becomes the least costly option in the short term [9].
Figure 6. Changes in net present value of scenarios with different product prices.
Forests 06 02424 g006

3.3.3. Discount Rate

The effects of different discount rates on net present values in perpetuity are shown in Figure 7. Compared to the default 3.5% declining rate, a 1.0% rate improves the relative performance of scenario SS4, making it the second most valuable option. At a rate of 6.0% (declining or constant) the relative values of scenarios SS2 and SS4 greatly diminish so that SS1 (clearfelling and replanting) becomes the most valuable option and SS4 fails to achieve a positive NPV. Overall, SS2 performs best at low rates, SS1 rises from second to first place in terms of NPV at higher rates, and SS3 performs relatively poorly throughout.
Over shorter time horizons, a change in discount rate has a smaller effect [9]. The ranking of scenarios at 100 years only changes from that for baseline assumptions (where SS1 gives the highest NPV and SS4 the lowest) at a 1.0% rate, when SS2 becomes the most valuable and SS3 the least valuable. Over 20 years, scenarios SS2 and SS3 always give the lowest overall cost and only the relative ranking of SS1 and SS4 changes; at 1.0% or 3.5% SS1 is the most costly, and at 6.0% SS4 is the most costly.
Figure 7. Changes in net present value of scenarios with different discount rates.
Forests 06 02424 g007

4. Discussion

4.1. Scope of the Study and Issues Not Addressed

In interpreting the results of this study, it is important to understand its scope. It was never intended to be a comprehensive assessment of the cost and revenue streams arising from continuous cover forest management in comparison with conventional practice, for the simple reason that the actual costs incurred and revenues accrued following a large-scale change in management practice cannot be meaningfully predicted, given the variability of the public forest estate in Great Britain in terms of factors such as crop and site conditions, potential silvicultural approaches, local markets and costs, and events such as windthrow or disease outbreaks. The results are specific to the scenarios described, and while some generalisations may be made, these should be treated with the caution they deserve.
In practical terms, the full schedules of operations in the original study report, along with the details of the assumptions made, lay bare the range of cost and revenue implications which must be considered by forest managers and other decision makers in assessing the consequences of transformation. Although the assumptions made are reasonable, it is of course unlikely that the exact schedules of operations or cash flows described for the four scenarios would be realised in every detail in practice. While it is hoped that the scenarios are realistic, they are idealised in as much as operations follow a rigid timetable, yields are exactly according to models, and there is no stochastic disruption to the orderly development of each stand. The results are indicative, and simply compare the relative performance in terms of net present value of the four specific scenarios described.
The study presents a strictly financial cost-benefit analysis, and no attempt has been made to quantify the changes in the provision of ecosystem services [31], which may arise from the various scenarios, which could be positive or negative [32,33], and which may be the justification for changes in management. In addition, the issues in the following sub-sections were beyond the scope of the original study and should be borne in mind when interpreting the results.

4.1.1. Genetic Changes

A great deal of effort has been put into selective breeding of Sitka spruce in Great Britain [34], and scenarios SS1 and SS3 could be reformulated using genetically improved stock for replanting or underplanting. This could lead to substantial increases in volume production [35] without any apparent decrease in timber quality [36]. An increased cost is likely to be associated with genetically improved plants, particularly if the highest quality of vegetatively propagated stock is used, which would increase short term restocking and underplanting costs. However, the more rapid growth of the resulting stand, which has been represented in the past by an increase in yield class [37], has the effect of both increasing and bringing forward in time all future harvesting revenues. Unless a high discount rate has the effect of unduly increasing the significance of the early costs at the expense of the more distant revenues, the planting of improved Sitka spruce is likely to increase the net present value of scenarios SS1 and SS3.
It has been suggested that dysgenic effects of selective felling during the transformation process may have a negative effect on the growth and yield of future cohorts [20,32]. This assumes the early removal of the most vigorous trees in single-tree selection systems, thereby eliminating them as future potential parent trees. However, in the transformation scenarios presented in this study, early crown thinnings are intended to favour the best-formed and most vigorous trees [6,38,39] rather than remove them. Although these trees do represent the ultimate crop trees in each scenario, they are expected to persist long enough to contribute seeds to natural regeneration. By removing exceptionally coarse trees or those most lacking in vigour, early thinnings should improve the overall genetic quality of successor crops. There is as yet no evidence available in Britain to indicate whether the potential genetic gains of well-managed natural regeneration are equivalent to those arising from selective breeding, but the achievement of natural regeneration may at least give some indication of the site adaptation of the established individuals [38].

4.1.2. Timber Quality, Products and Changing Prices

No attempt was made in the study to quantify the effects of management on timber quality in the different scenarios, although understanding of the effects of silviculture on timber quality continues to increase [40,41,42]. Explicitly modelling the effects on quality might facilitate more sophisticated modelling of product assortments and therefore revenues. The current approach to product assortments is basic and is designed simply to maximise the proportion of logs. This will obviously lead to sub-optimal financial results if other products command higher prices, as is occasionally the case in Britain, for example, when agricultural grants increase demand for fencing material.
Timber prices may vary considerably over time [43] and there is currently much uncertainty about the future value of large dimension Sitka spruce logs in Britain. No attempt was made to predict future trends in timber prices, any more than an attempt was made to predict future trends in costs, but it must be recognised that this is a major uncertainty; as discussed below, however, the sensitivity analysis on product prices had surprisingly little effect on the relative performance of scenarios.

4.1.3. Risk and Stochastic Events

Uncertainty extends beyond product prices to rising fuel costs, changes in harvesting technology, policy limitations on practices, the effects of climate change, the depredations of insects, wind damage and other such largely unpredictable factors. These factors have not been taken into account in this study, and no attempt has been made to model stochastic events such as disease outbreaks or windthrow. The work of [43] contended that the failure to take into account risk is acceptable only if the risks are equal among alternatives, and that if they are not equal comparisons of alternatives may be misleading. This must be borne in mind when interpreting results, as not only are the risk factors themselves unpredictable, but, in addition, the relative susceptibility of stands under different management is largely unknown.
There is no need to enumerate the pests and diseases which threaten forests worldwide, but major outbreaks in British forests are topical issues at present, with ramorum disease (Phytophthora ramorum Werres, De Cock & Man) severely affecting larches (Larix spp.) in western Britain and Chalara dieback (Chalara fraxinea T. Kowalski) affecting ash (Fraxinus excelsior L.) in the east, for example. It has been suggested that the risk of such outbreaks may be increased by climate change [44], and the potential economic effects are substantial [45]. Crucially for this study, however, there is very little evidence to indicate how the management of monocultures may influence the risk of damage. The limited information on the effects of different regeneration strategies on the susceptibility of seedlings to damage by Hylobius abietis [13] has already been taken into account in formulating the scenarios. Research findings suggest that the green spruce aphid (Elatobium abietinum Walker) infests spruce seedlings more densely when they are grown in shade rather than in the open [46], which may have implications for the success of natural or artificial regeneration under a canopy. The consequences of continuous cover forestry for infection by Heterobasidion annosum (Fr.) Bref. butt rot are unclear. While it is currently extremely difficult to quantify these risks, they must be considered when comparing silvicultural alternatives.
The potential for wind damage is a risk that must be borne in all forests, particularly in Britain, which has a relatively severe wind climate [47]. Even if site conditions are assumed to be such that endemic windthrow is minimal, the threat of catastrophic windthrow remains [2]. However, it appears that there is little difference in windthrow risk between regular and irregular Sitka spruce stands on relatively sheltered sites [48]. Guidance on the selection of sites suitable for continuous cover forestry is generally to avoid areas of high wind risk [6]. Therefore, while it is unrealistic to assume that there is no wind risk, there may at least be some basis for assuming that there are no substantial differences between scenarios in the susceptibility of the stands to wind damage if they are assumed to occupy sheltered sites. The effects of climate change on wind risk are still uncertain, though the risk seems likely to increase [44], but, given the assumption of a relatively sheltered site, there does not appear to be any reason to expect a greater increase in risk for any scenario in particular.
While changes in the suitability of the local climate for Sitka spruce, for example in terms of moisture deficit [44], might be expected to affect all scenarios equally, there is a suggestion that the more equable climate within stands managed under continuous cover, particularly in terms of humidity, may be advantageous [49].

4.2. Comparison of Scenarios

The comparison of net present values using baseline assumptions (Table 2) shows that transformation need not be costly relative to conventional British clearfelling management. In fact, in all of the transformation scenarios modelled, the higher efficiencies and greater yields of heavy early thinnings lead to lower net costs over the first twenty years. Thus, there appears to be a short-term financial argument for a change in thinning practice even if there is no intention to transform to CCF; the economic benefits of thinning from above have also been noted by [50].
With successful natural regeneration in transformation to a simple structure (scenario SS2), stand replacement costs are lower and future rotations are brought forward, so that in the medium to long term, the NPV per hectare is similar to or greater than that for clearfelling and replanting. However, if natural regeneration is not successful (scenario SS3), the costs and delays arising from attempts to encourage it may be serious. In the context of the scenarios investigated, it seems best to resort to underplanting sooner rather than later, otherwise any financial benefits of transformation are lost; also, anecdotally in Britain, the disturbance associated with planting has often been found to stimulate natural regeneration. If sites and crops are correctly selected as being suitable for transformation, at least some regeneration should be a reasonable assumption. If regeneration does not occur uniformly across a site, some beating up may be required, or pruning of stems established at wider than standard spacings, which would increase costs. Alternatively, the silvicultural approach could be modified to accept a more irregular successor crop, which would probably have the effect of extending the rotation and deferring future cash flows, thus decreasing NPV in perpetuity. In reality, therefore, the NPV of a stand transformed to a simple structure is likely to be lower than that indicated for scenario SS2, but almost certainly not as low as that for SS3.
As scenario SS4, transformation to a complex structure, does not depend on uniform regeneration it is hoped that the proposed transformation trajectory is realistic, although there remains much uncertainty about the growth and yield of complex stands. After the short term financial gains arising from heavy thinnings, this approach to transformation is more costly than any other scenario, achieving an NPV in perpetuity which is only 55% of that for conventional management, so that substantial ecosystem service benefits would need to arise from this stand structure to balance this possible decrease in value of 45%, although it should be remembered that this scenario includes relatively pessimistic assumptions regarding management and harvesting costs.
A Swiss study [51] found that selection systems were on average more profitable than shelterwood systems, the opposite of the relationship between SS2 and SS4 found in the current work, but the authors noted that increased mechanisation, which is reflected in this study, would disadvantage selection systems. A study on beech silviculture in Denmark [52] gave similar results to the present work, in that even-aged management (simple structure) with natural regeneration was more profitable than even-aged management with artificial regeneration and uneven-aged management (complex structure) with natural regeneration. The work of [53] found that the net present value of clearfelling was consistently higher over a range of assumptions than for group felling or single-tree selection, both of which may be closer to SS4 than SS2 in this study, in which case the results of this study are similar.
Transformation practice in reality must be based on a consideration of the current state of a stand, and it may be financially optimal to clearfell and replant a mature stand with a view to transforming the successor crop [50].
As an alternative to the conventional management represented by scenario SS1, early costs could be avoided by adopting a no-thin regime. This is likely to result in earlier clearfelling, bringing revenues for the first and all subsequent rotations forward, but a smaller mean tree size, leading to lower harvesting productivity and log outturn. However, the consequences of this approach in terms of non-market benefits should be considered.
One particular economic benefit which has been claimed for CCF, namely the potential for continuous yield at a stand level [54] which may minimise the risks associated with volatile markets [43], may be relevant only for smaller forest holdings; in large forest estates, the development of a normal age structure managed under a clearfelling system is potentially equally robust. Nevertheless, the importance of a relatively stable cash flow for smaller holdings should not be underestimated, and may well be more significant than the overall net present value.
Over the short term (Table 3), volume yields are higher for all transformation scenarios than for conventional management, and, over the medium term (Table 4), successful transformation to a simple structure (scenario SS2) yields a greater total volume and a greater log volume per hectare per year than conventional management. Over a 20-year time period, the transformation scenarios produce more timber than standard practice because of heavier and higher thinnings. Over a 100-year time period, scenario SS4 suffers in comparison with scenario SS1, despite occupancy of the site by multiple strata, presumably because of the long delay in harvesting the initial cohort and establishing some of the later cohorts as a consequence of aiming for a complex structure.
That thinning at greater than marginal intensity should increase total volume yields is not entirely consistent with the concept of marginal thinning intensity (given that thinning at marginal intensity supposedly optimises volume production over a rotation) but may be at least partly explained by the overlap of rotations that occurs in CCF compared with their separation by a fallow period in conventional practice. However, thinning from above in Norway spruce stands in Sweden has been found to give consistently higher volume increment than thinning from below [55], an effect not necessarily reflected in the figures used in this study, so it is possible that CCF volume yields may be higher than the figures in this study suggest.

4.3. Sensitivity Analysis

Changes to the details of costs and revenues show that NPVs in perpetuity are relatively insensitive to variation in the less certain or potentially more volatile assumptions tested in the sensitivity analysis. Scenario SS2 remains the most valuable and scenarios SS3 or SS4 the least valuable with changes to the base management overhead cost and in most cases with changes to relative cost. If relative costs are assumed to be equal for all scenarios, which might eventually be the case when CCF management is firmly embedded in forestry practice in Britain, the difference in profitability between standard clearfelling practice and transformation to and management of a complex structure diminishes considerably. The greater effects of base and relative management costs on SS4 are not surprising, as changes in base cost are magnified by default relative costs, and changes in relative cost (from 200 to 100, or 200 to 400) are greater than for scenarios SS2–3 (from 150 to 100, or 150 to 200).
The different product prices investigated do not alter the ranking of scenarios by NPV in perpetuity at all. This is notable, given that these are the only sources of income, though [54] also found that stumpage had a minimal effect on economic comparisons. It appears that the details of yield data are more critical to the performance of scenarios. Interestingly, the authors of [43] have suggested that, in reality, stumpage values are far more variable than management costs, which is encouraging in terms of the insensitivity of results to the potentially more variable factor.
Discount rate can have a pronounced effect, particularly on scenario SS4, but, unless the rate is very high, scenario SS2 remains the most valuable. Generally, relative indifference of decision makers to time (low discount rate) favours SS2 and SS4, while pronounced time preference (high discount rate) favours SS1. This effect of time preference presumably occurs because a higher discount rate gives proportionally greater weight to the relatively early clearfell revenues in scenario SS1 than to substantial revenues delayed to a greater or lesser extent in other scenarios, although other work has shown that higher rates favour transformation because of higher early thinning revenues [56]. The baseline discount rate used in this study (with a rate of 3.5% declining beyond 30 years) is derived from UK Treasury guidance [30], where it is taken to represent social time preference, i.e., the time preference of society as a whole. The discount rates applied by individuals or enterprises tend to be higher than social discount rates as they expect quicker returns; this more pronounced time preference may in part explain the reluctance of many private sector forest managers to embrace continuous cover forestry, especially in its more complex forms.
As noted previously, in all discussion of the sensitivity of results to variations in inputs it has been assumed that it is only the relative performance of scenarios that matters, not the absolute NPVs achieved. The work of [57] noted that the potential variability within the scenarios they investigated was greater than the differences between them, and this can be seen to be the case in this study too. For example, the NPV in perpetuity of individual scenarios varies by up to around £14,000 per ha at discount rates between 1% and 6% (Figure 7), whereas the maximum difference between scenarios using the default assumptions is only around £2,800. The fact that scenario rankings remain relatively constant, however, is taken to indicate that the comparison of scenarios is robust, even if absolute NPVs must be treated with caution.

4.4. Advantages and Disadvantages of the Study Approach

The authors consider the chief advantage of the study approach, as expressed in full in the original report [9], to be the complete transparency of assumptions and calculations, in comparison with some other studies which have provided varying levels of detail of cost, revenue, growth and yield assumptions, for example [58], where very limited information is presented on the assumptions relating to harvesting costs, even though these have a significant effect on results, and [53], where assumptions are generally very clear but no explanation of regeneration costs is given beyond planting rates. (In one of the fullest and most explicit treatments to date of the economics of CCF in a British context [20], the authors noted that they did not have information from time studies on the management of regeneration in alternatives to clearfelling, a gap that the present study has attempted to fill.) This advantage is twofold, both in terms of practical guidance for managers and decision makers who may appreciate the full range of factors to consider, and also in terms of debating the results, as individual assumptions may be challenged rather than the outcomes of the entire study being dismissed. An element of this transparency is the provision of the analysis spreadsheet (see Supplementary Material), which may be useful for practitioners to explore and understand changes in inputs relevant to their particular circumstances.
The spreadsheet results do require interpretation in the light of the limited set of scenarios represented, however, and this tool should not be used in isolation as a decision support system; indeed, the original study report includes an explicit warning regarding the use of the growth and yield data. This highlights the fact that “Considerable uncertainties remain about the growth of stands of complex structure—the treatment of which in this study is necessarily abstract and simplified—and these uncertainties will only be definitively resolved on the basis of long-term field measurements under a wide range of circumstances” [9]. While the growth and yield modelling, especially for scenario SS4, is imperfect, until such time as the more sophisticated models currently under development are available, the M1 model used in this study remains the best and most flexible model parameterised for Sitka spruce in Britain. One notable disadvantage of the economic analysis spreadsheet, though not of the overall approach, is that there is no direct link between the spreadsheet in which operations are scheduled and the growth and yield model, which means that the schedules of operations are fixed.

4.5. Applications of the Study Approach

The study approach may, with caution, be used for specific sites to compare alternative scenarios, using real crop data and planned schedules of operations. As with any such stand level financial cost benefit analysis, results could never be definitive and would always come with provisos, particularly given the stochastic events and inevitable deviations from plans and yield data that occur in real life. In this respect, the level of detail of the analysis model would probably count against it, as there are so many respects in which reality may deviate from expectation.
The approach could be used, as in Britain, to reassure sceptics that, in favourable conditions, transformation need not necessarily be excessively expensive, or to demonstrate to decision makers the potential scale of costs which may be incurred to achieve particular stand structures and resulting ecosystem services. This would probably require the drawing up of a set of representative scenarios for a number of major forest types, and, as ever, would be accompanied by a number of provisos; this analysis alone is certainly not sufficient basis for large scale budgeting for the consequences of policy or practice changes, for instance.
Suitably adapted for local conditions, the study approach certainly has merit as an educational resource for all involved from forest management to policy making regarding factors to consider during transformation.

4.6. Further Developments of the Approach

There is certainly scope for improvement and expansion of the approach. Most obviously, different silvicultural (species, site, system etc.) and technological (e.g., harvesting method) scenarios may be constructed to suit particular local conditions or interests. Site-specific effects could be factored in, such as ground damage, perhaps taking account of soil type, extraction distances, machine type and weight, and brash availability; this would require extensive work study data, however. As noted above, establishing a dynamic link between the economic analysis and the model or models providing growth and yield data would yield great benefits in terms of being able to alter scenarios on the fly.
For some species, it may be possible to model the effects of silviculture on timber quality as well as quantity, and to optimise product assortments in a more sophisticated way.
Perhaps the greatest scope for expanding the analysis approach is in the incorporation of stochastic events such as windthrow, pest outbreaks and fire. In a British context, for instance, explicit links could be made with the ForestGALES wind hazard model [59]. In many cases, however, such stochastic modelling is likely to be limited by a lack of data, particularly in terms of how risks and impacts vary with silvicultural approach.

5. Conclusions

The comparison of a small number of scenarios shows that, in relatively common circumstances in a British context, the net present value of Sitka spruce stands transformed to continuous cover forest management can vary greatly relative to the current standard practice of clearfelling and replanting. Where transformation to a simple structure is achieved with successful natural regeneration, the net present value in perpetuity may actually be higher. Without successful regeneration, or with transformation to a more complex structure, the net present value may be substantially lower, and would have to be justified by commensurate gains in ecosystem services. There are some general silvicultural lessons to be drawn from the data and results, such as the yield benefits of early crown thinnings as compared with low thinnings. Sensitivity analysis shows these results to be relatively robust.
The transparency of the method used in this study, making explicit all input data and assumptions, bring advantages in terms of a broader message for forest managers to consider the full range of factors relevant to transformation, and also in terms of challenging and refining individual assumptions. There is scope for the approach to be used more widely, suitably adapted to local conditions, for education and for exploring the potential consequences of decisions at various levels, though always subject to provisos.
Wider and more comprehensive use of the approach would depend on improvements in growth and yield modelling, preferably dynamically linked to the economic analysis and the collection of work study data and information on the hazards associated with different silvicultural approaches, to allow the refinement of existing assumptions and to take into account other consequences of forest management.

Supplementary Materials

The analysis spreadsheet used to calculate net present values is available as supplementary material.

Acknowledgments

As in the original study report, the authors wish to thank several members of the Forestry Commission and Forest Research staff: Bill Mason, Martin Price and Duncan Ireland for their crucial inputs to this work; Colin Edwards, Sophie Hale, Jens Haufe, Hamish Mackintosh and Victoria Stokes for their contributions to the early development of the study; all providers of personal communications for their contributions to quantifying costs and revenues; and Gregory Valatin and members of the Forestry Commission’s GB CCF working group for comments on the text of the report. The lead author also wishes to thank Colin Price, formerly of Bangor University, for his education in cost benefit analysis and the theory and practice of discounting but freely admits that any errors in this paper are the responsibility of the student and not the teacher.

Author Contributions

Owen Davies and Gary Kerr jointly formulated and defined the scope and methods of the project; Owen then carried out most of the work supervised by Gary.

Conflicts of Interest

The authors declare no conflict of interest.

References

  1. Forestry Commission. Forestry Facts and Figures 2013; Forestry Commission: Edinburgh, Scotland, 2013.
  2. Miller, K.F. Windthrow Hazard Classification. In Forestry Commission Leaflet No. 85; HMSO: London, England, 1985. [Google Scholar]
  3. Troup, R.S. Dauerwald. Forestry 1927, 1, 78–81. [Google Scholar]
  4. Forestry Commission. The UK Forestry Standard, 3rd ed.Forestry Commission: Edinburgh, Scotland, 2011.
  5. UKWAS. United Kingdom Woodland Assurance Standard (UKWAS), 3rd ed.; Version 3.1; UKWAS: Edinburgh, Scotland, 2012. [Google Scholar]
  6. Mason, B.; Kerr, G. Transforming even-aged conifer stands to continuous cover management. In Forestry Commission Information Note No. 40. (Revised); Forestry Commission: Edinburgh, Scotland, 2004. [Google Scholar]
  7. Mason, B.; Kerr, G.; Simpson, J. What is continuous cover forestry? In Forestry Commission Information Note No. 29; Forestry Commission: Edinburgh, Scotland, 1999. [Google Scholar]
  8. Kerr, G. Managing Continuous Cover Forests. In Operational Guidance Booklet No. 7.; Version 3.0; Forestry Commission: Edinburgh, Scotland, 2008. [Google Scholar]
  9. Davies, O.; Kerr, G. The Costs and Revenues of Transformation to Continuous Cover Forestry; Version 2; Forest Research: Farnham, England, 2014.
  10. Edwards, P.N.; Christie, J.M. Yield models for forest management. In Forestry Commission Booklet No. 48; Forestry Commission: Edinburgh, Scotland, 1981. [Google Scholar]
  11. Forestry Commission. Plant density: Right first time. In Operational Guidance Booklet No. 4; Version 2.0; Forestry Commission: Edinburgh, Scotland, 2010. [Google Scholar]
  12. Rollinson, T.J.D. Thinning control. In Forestry Commission Booklet No. 54; HMSO: London, England, 1985. [Google Scholar]
  13. Moore, R. Managing the threat to restocking posed by the large pine weevil, Hylobius abietis. The importance of time of felling of spruce stands. In Forestry Commission Information Note No. 61; Forestry Commission: Edinburgh, Scotland, 2004. [Google Scholar]
  14. Matthews, J.D. Silvicultural Systems; Clarendon Press: Oxford, England, 1989. [Google Scholar]
  15. Hale, S. Managing light to enable natural regeneration in British conifer forests. In Forestry Commission Information Note No. 63; Forestry Commission: Edinburgh, Scotland, 2004. [Google Scholar]
  16. Matthews, J.D. Production of seed by forest trees in Britain. In Report on Forest Research for the Year Ending March, 1954; HMSO: London, England, 1955; pp. 64–78. [Google Scholar]
  17. Nixon, C.J.; Worrell, R. The potential for the natural regeneration of conifers in Britain. In Forestry Commission Bulletin No. 120; Forestry Commission: Edinburgh, Scotland, 1999. [Google Scholar]
  18. Stokes, V.; Kerr, G.; Ireland, D. Seedling height and the impact of harvesting operations on advance regeneration of conifer species in upland Britain. Forestry 2009, 82, 185–198. [Google Scholar] [CrossRef]
  19. Cameron, A.D.; Hands, M.O.R. Developing a sustainable irregular structure: An evaluation of three inventories at 6-year intervals in an irregular mixed-species stand in Scotland. Forestry 2010, 83, 469–475. [Google Scholar] [CrossRef]
  20. Price, M.; Price, C. Creaming the best, or creatively transforming? Might felling the biggest trees first be a win-win strategy? For. Ecol. Manag. 2006, 224, 297–303. [Google Scholar] [CrossRef]
  21. Jenkins, T.; Arcangeli, C.; Henshall, P.; Matthews, R. M1. Yield Model: Research Interface User Guide; Version 1.2.0.10; Forest Research: Farnham, England, 2012.
  22. Kerr, G.; Mason, B.; Boswell, R.; Pommerening, A. Monitoring the transformation of even-aged stands to continuous cover management. In Forestry Commission Information Note No. 45; Forestry Commission: Edinburgh, Scotland, 2002. [Google Scholar]
  23. Price, M.H. Aspects of the economics of transformation. Harvesting Productivity: A Case Study of Different Intervention Types in the Conversion of Welsh Sitka Spruce to Continuous Cover Forestry. Ph.D. Thesis, Bangor University, Bangor, UK, 2007. [Google Scholar]
  24. Ireland, D. Transformation thinning in CCF with advanced natural regeneration. Case study: Clocaenog, North Wales. In Internal Project Information Note No. 21/07; Technical Development; Forest Research: Alice Holt Lodge, Farnham, England, 2008. [Google Scholar]
  25. Ireland, D. CCF operational best practice: Final overstorey removal in uniform shelterwood. In Internal Project Information Note No. 45/08; Technical Development; Forest Research: Alice Holt Lodge, Farnham, England, 2009. [Google Scholar]
  26. Matthews, R.W.; Mackie, E.D. Forest Mensuration: A Handbook for Practitioners; Forestry Commission: Edinburgh, Scotland, 2006.
  27. Price, C. The Theory and Application of Forest Economics; Blackwell: Oxford, England, 1989. [Google Scholar]
  28. Welsh Assembly Government. Woodlands for Wales: The Welsh Assembly Government’s Strategy for Woodlands and Trees; Welsh Assembly Government: Cardiff, Wales, 2009.
  29. Halsall, L.; Gilbert, J.; Matthews, R.; Fairgrieve, M. New forecast of softwood availability in the UK. For. Br. Timber 2006, 35, 14–23. [Google Scholar]
  30. Treasury, H.M. The Green Book: Appraisal and Evaluation in Central Government; The Stationery Office: London, England, 2003. [Google Scholar]
  31. Krieger, D.J. The Economic Value of Forest Ecosystem Services: A Review; The Wilderness Society: Washington, USA, 2001. [Google Scholar]
  32. Price, C. The economics of transformation from even-aged to uneven-aged forestry. In Recent Accomplishments in Applied Forest Economics; Helles, F., Strange, N., Wichmann, L., Eds.; Kluwer: Amsterdam, The Netherlands, 2003. [Google Scholar]
  33. Rook, D.A. Super Sitka for the 90s. In Forestry Commission Bulletin No. 103; HMSO: London, England, 1992; p. 75. [Google Scholar]
  34. Price, C.; Price, M. Cost-benefit analysis of continuous cover forestry. In Proceedings of the Biennial Meeting of the Scandinavian Society of Forest Economics, Lom, Norway, 6–9 April 2008.
  35. Lee, S.; Matthews, R. An indication of the likely volume gains from improved Sitka spruce planting stock. In Forestry Commission Information Note No. 55; Forestry Commission: Edinburgh, Scotland, 2004. [Google Scholar]
  36. Mochan, S.; Lee, S.; Gardiner, B. Benefits of improved Sitka spruce: Volume and quality of timber. In Forestry Commission Research Note No. 3; Forestry Commission: Edinburgh, Scotland, 2008; p. 6. [Google Scholar]
  37. Lee, S.J. Likely increases in volume and revenue from planting genetically improved Sitka spruce. In Super Sitka for the 90s. Forestry Commission Bulletin No. 103; Rook, D.A., Ed.; HMSO: London, England, 1992. [Google Scholar]
  38. Davies, O.; Haufe, J.; Pommerening, A. Silvicultural Principles of Continuous Cover Forestry: A Guide to Best Practice; Bangor University: Bangor, Wales, 2008. [Google Scholar]
  39. Kerr, G.; Haufe, J. Thinning Practice: A Silvicultural Guide; Forestry Commission, 2011; p. 54.
  40. Macdonald, E.; Hubert, J. A review of the effects of silviculture on timber quality of Sitka spruce. Forestry 2002, 75, 107–138. [Google Scholar] [CrossRef]
  41. Moore, J.R.; Lyon, A.J.; Searles, G.J.; Vihermaa, L.E. The effects of site and stand factors on the tree and wood quality of Sitka spruce growing in the United Kingdom. Silva Fenn. 2009, 43, 383–396. [Google Scholar] [CrossRef]
  42. Macdonald, E.; Gardiner, B.; Mason, W. The effects of transformation of even-aged stands to continuous cover forestry on conifer log quality and wood properties in the UK. Forestry 2010, 83, 1–16. [Google Scholar] [CrossRef]
  43. Knoke, T.; Moog, M.; Plusczyk, N. On the effect of volatile stumpage prices on the economic attractiveness of a silvicultural transformation strategy. For. Policy Econ. 2001, 2, 229–240. [Google Scholar] [CrossRef]
  44. Broadmeadow, M.S.J.; Webber, J.F.; Ray, D.; Berry, P.M. An assessment of likely future impacts of climate change on UK forests. In Combating Climate Change—A Role for UK Forests. An Assessment of the Potential of the UK’s Trees and Woodlands to Mitigate and Adapt to Climate Change; Read, D.J., Freer-Smith, P.H., Morison, J.I.L., Hanley, N., West, C.C., Snowdon, P., Eds.; HMSO: London, England, 2009. [Google Scholar]
  45. Price, C. Tree disease—The economic impacts of it all. Q. J. For. 2010, 104, 224–230. [Google Scholar]
  46. Bertin, S. Physiological Ecology of Understorey Trees in Low Impact Silvicultural Systems. Ph.D. Thesis, University of Edinburgh, Edinburgh, UK, 2009. [Google Scholar]
  47. Quine, C.P.; Coutts, M.P.; Gardiner, B.A.; Pyatt, D.G. Forests and wind: Management to minimise damage. In Forestry Commission Bulletin No. 114; HMSO: London, England, 1995. [Google Scholar]
  48. Mason, W.L. Are irregular stands more windfirm? Forestry 2002, 75, 347–355. [Google Scholar] [CrossRef]
  49. Kirby, K.J.; Quine, C.P.; Brown, N.D. The adaptation of UK forests and woodlands to climate change. In Combating Climate Change—A Role for UK Forests. An Assessment of the Potential of the UK’s Trees and Woodlands to Mitigate and Adapt to Climate Change; Read, D.J., Freer-Smith, P.H., Morison, J.I.L., Hanley, N., West, C.C., Snowdon, P., Eds.; HMSO: London, England, 2009. [Google Scholar]
  50. Tahvonen, O.; Pukkala, T.; Laiho, O.; Lähde, E.; Niinimäki, S. Optimal management of uneven-aged Norway spruce stands. For. Ecol. Manag. 2010, 260, 106–115. [Google Scholar] [CrossRef]
  51. Mohr, C.; Schori, C. Femelschlag oder Plenterung—Ein Vergleich aus betriebswirtschaftlicher Sicht. Schweiz. Z. Forst. 1999, 150, 49–55. (In German) [Google Scholar] [CrossRef]
  52. Tarp, P.; Helles, F.; Holten-Andersen, P.; Larsen, J.B.; Strange, N. Modelling near-natural silvicultural regimes for beech—An economic sensitivity analysis. For. Ecol. Manag. 2000, 130, 187–198. [Google Scholar] [CrossRef]
  53. Andreassen, K.; Øyen, B.-H. Economic consequences of three silvicultural methods in uneven-aged mature coastal spruce forests of central Norway. Forestry 2002, 75, 483–488. [Google Scholar] [CrossRef]
  54. Knoke, T.; Plusczyk, N. On economic consequences of transformation of a spruce (Picea abies (L.) Karst.) dominated stand from regular into irregular age structure. For. Ecol. Manag. 2001, 151, 163–179. [Google Scholar] [CrossRef]
  55. Lundqvist, L.; Chrimes, D.; Elfving, B.; Mörling, T.; Valinger, E. Stand development after different thinnings in two uneven-aged Picea abies forests in Sweden. For. Ecol. Manag. 2007, 238, 141–146. [Google Scholar] [CrossRef]
  56. Hanewinkel, M. Economic aspects of the transformation from even-aged pure stands of Norway spruce to uneven-aged mixed stands of Norway spruce and beech. For. Ecol. Manag. 2001, 151, 181–193. [Google Scholar] [CrossRef]
  57. Hubert, J.; Savill, P.S.; Pryor, S.N. The Economic Implications of Continuous Cover Forestry: A Report for Woodland Heritage; Oxford Forestry Institute: Oxford, England, 2000. [Google Scholar]
  58. Hanewinkel, M. Comparative economic investigations of even-aged and uneven-aged silvicultural systems: A critical analysis of different methods. Forestry 2002, 75, 473–481. [Google Scholar] [CrossRef]
  59. Gardiner, B.; Suárez, J.; Achim, A.; Hale, S.; Nicoll, B. ForestGALES: A PC-Based Wind Risk Model for British Forests. User’s Guide; Version 2.0; Forestry Commission: Edinburgh, Scotland, 2004.

