Article

Effects of Temporal Dynamics, Nut Weight and Nut Size on Growth of American Chestnut, Chinese Chestnut and Backcross Generations in a Commercial Nursery

by
Cornelia C. Pinchot
1,*,†,
Stacy L. Clark
2,†,
Scott E. Schlarbaum
3,
Arnold M. Saxton
4,
Shi-Jean S. Sung
5 and
Frederick V. Hebard
6
1
Department of Agriculture, Forest Service, Northern Research Station, 359 Main Rd, Delaware, OH 43015, USA
2
Department of Agriculture, Forest Service, Southern Research Station, Rm 274 Ellington Plant Science Building, Knoxville, TN 37996, USA
3
Department of Forestry, Wildlife, and Fisheries, The University of Tennessee Rm 274 Ellington Plant Science Building, Knoxville, TN 37996, USA
4
Department of Animal Science, The University of Tennessee, 232 Brehm Animal Science Building, Knoxville, TN 37996, USA
5
Department of Agriculture, Forest Service, Southern Research Station, 2500 Shreveport Highway, Pineville, LA 31360, USA
6
The American Chestnut Foundation, 29010 Hawthorne Dr, Meadowview, VA 24361, USA
*
Author to whom correspondence should be addressed.
These authors contributed equally to this work.
Forests 2015, 6(5), 1537-1556; https://doi.org/10.3390/f6051537
Submission received: 2 February 2015 / Revised: 22 April 2015 / Accepted: 27 April 2015 / Published: 30 April 2015

Abstract

:
Blight-resistant American chestnut (Castanea dentata) may soon be commercially available, but few studies have tested methods to produce high quality seedlings that will be competitive after planting. This study evaluated the performance of one American, one Chinese (C. mollissima), one second-generation backcross (BC3F2), and 10 third-generation backcross chestnut families (BC3F3). We examine growth over one year in a commercial tree nursery in east Tennessee. We examined relationships among nut size and weight and seedling growth, between germination timing and seedling survival, and between germination percentage and growth. Across the population tested, a 1 g increase in nut weight corresponded to a 6 cm increase in seedling height, a 0.5 mm increase in root collar diameter and one additional first order lateral root, but models had low predictive power. BC3F3 chestnuts grew similarly to American chestnuts, with substantial differences in growth among chestnut families within generation. Nuts that germinated by 23 April had greater than 1955 odds of surviving the first growing season than nuts that germinated in late May. American and backcross chestnut growth slowed in late June, presumably due to exhaustion of their cotyledons before leaf expansion. These results will help nursery managers refine cultural practices to maximize growth of backcross chestnuts.

1. Introduction

The American chestnut (Castanea dentata (Marsh.) Borkh) was a dominant forest tree in the eastern United States until two nonnative pathogens virtually eliminated it as a canopy species. Phytophthora cinnamomi Rands, a soil-borne oomycete that causes ink disease, was likely introduced into the US in the mid-19th century and is credited with eradicating chestnut in bottomland and poorly drained soils in the southern states [1]. Chestnut blight fungus (Cryphonectria parasitica (Murr.) Barr), which arrived in the late 19th century, killed most mature chestnuts throughout the tree’s range by the 1950s. The tree was once ecologically important as a source of mast for wildlife [2,3,4], and economically valuable for its rot-resistant lumber, high tannin content and edible nuts cf. [5,6]. The predominant strategy to develop a blight-resistant American chestnut uses blight resistance from Chinese (C. mollissima Blume) or Japanese (C. crenata Sieb. & Zucc.) chestnuts in a backcross breeding approach [6,7,8]. This approach incorporates an initial cross between a Chinese or Japanese chestnut and an American chestnut (F1), followed by a series of backcrosses to American chestnuts (BC1F1, BC2F1, and BC3F1) and an intercrossing generation (BC3F2). Each generation is screened for resistance and timber form. The final cross in the breeding scheme is among third generation backcross trees (BC3F2) to reach the BC3F3 generation. In theory, this final generation will have the growth habit of American chestnut and blight resistance of an Asian chestnut species [6,7,8].
Blight-resistant American chestnut hybrids suitable for reforestation may become widely available from The American Chestnut Foundation’s (TACF) breeding program after further testing of selections is conducted [9]. However, restoration will require more than blight resistance. Success of planting will require artificial regeneration of seedlings that can compete with natural vegetation, persevere or escape deer browse pressure, and tolerate extreme abiotic conditions, such as drought. Only two studies, however, have examined nursery production of high quality sensu [10] American chestnut seedlings [11,12], and few studies have examined the effect of seedling quality on chestnut in forested settings [12,13,14,15]. While the effect of seedling quality on American chestnut establishment success and competitive ability has not been thoroughly assessed, the importance of seedling quality to oak (Quercus spp. L.) establishment has been tested for many decades [16]. As oak and chestnut are within the same taxonomic family, we can use the results of experiments with oak species to infer chestnut response.
Planting high quality northern red oak (Q. rubra L.) seedlings tends to result in increased survival and growth, as compared to planting smaller seedlings [16,17,18,19,20]. Clark et al. [14] found similar trends in planting high quality American, Chinese and hybrid chestnut seedlings. Rhoades et al. [13] found that larger American chestnut seedlings performed better in high-light harvest treatments, while seedling size did not affect performance in low light treatments. Many studies demonstrate a positive correlation between both number of first order lateral roots (FOLR) and root collar diameter (RCD) with growth and survival of northern red oak [16,19,20,21,22,23]. Both traits are highly correlated with root mass, an important characteristic affecting transplant shock [16]. Height is also an important factor in seedling survival and growth [16]. Tall seedlings have a better chance of escaping browsing by deer, a serious threat to seedling establishment throughout much of American chestnut’s range, and of competing with other vegetation for light [16].
In order to consistently produce high quality chestnut seedlings in bare-root nurseries, it is necessary to understand what factors affect chestnut seedling quality. Kormanik et al. [10] found that spacing, fertilization and irrigation are among the most important nursery cultural practices that influence oak seedling quality. The impacts of seed size, but not spacing and fertilization, on chestnut growth in the nursery have been tested. Clark et al. [
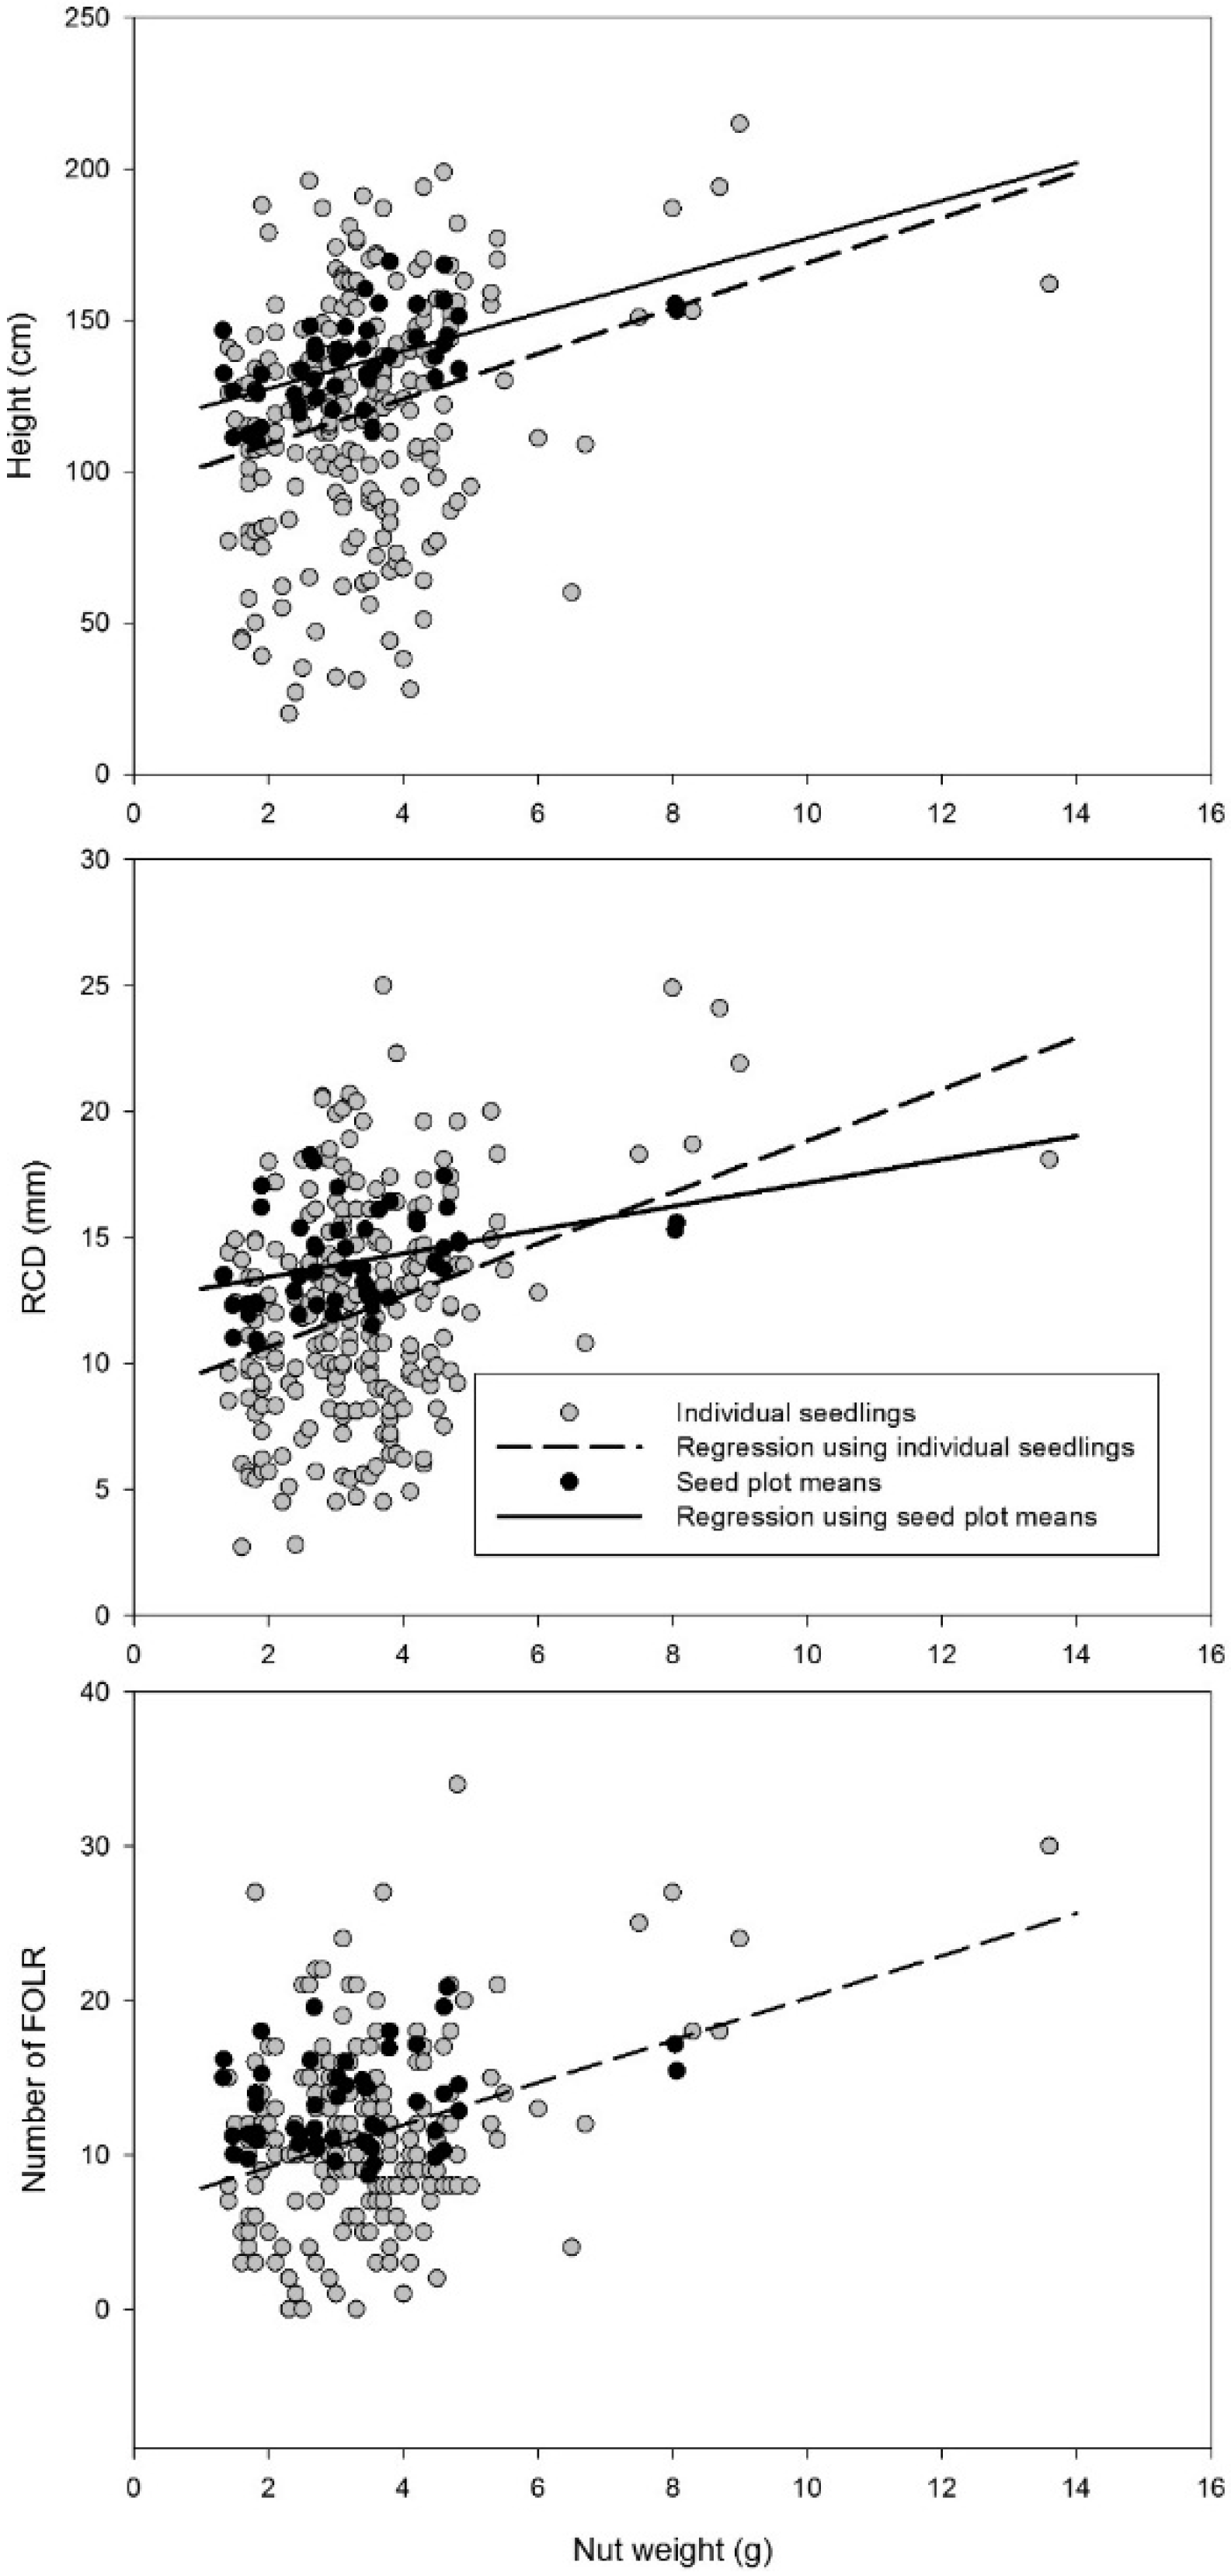
11] compared two nut size classes for differences in seedling quality for American, Chinese and hybrid chestnuts grown in two commercial nurseries. They found that the large nut size class produced taller seedlings than the small nut size class and that mean nut weight of family × nut size class treatment was strongly related to seedling height.
This study extends the study of Clark et al. [11] by testing additional families and using individual nut weight, in addition to the mean nut weight of the treatments, to predict seedling quality, and by comparing early growth of chestnut to that of northern red oak. The main goal of the study is to better understand factors affecting growth and survival of chestnuts in a nursery setting in order to develop methods for producing high quality backcross chestnuts that will lead to outplanting success for restoration of the species. The study has three primary objectives: (1) Nut weight and seedling growth: evaluates the relationships among nut size (classified visually), nut weight and seedling growth using both seed plot mean and individual seed or seedling data; (2) Germination patterns: evaluates the relationships among timing of germination, generation, family, survival and growth at lifting; and (3) Temporal growth patterns: examines the temporal height growth patterns among chestnut parental species, various breeding generations, and northern red oak from a bulked (multiple genetic families) seedlot.

2. Materials and Methods

2.1. Experimental Materials

Chestnuts sown came from one American family, one Chinese family, one BC3F2 hybrid family and ten BC3F3 hybrid families [7] (Table 1), all derived from open-pollinated crosses. American and Chinese chestnuts were included in this study in order to evaluate how the backcross chestnut families compare to their parental species in growth characteristics. The goal of the breeding programs is to produce a hybrid chestnut with the growth characteristics of the American chestnut, and with only blight-resistance traits from the Chinese chestnut parental species.
Table 1. Number of chestnut nuts sown and seedlings lifted within each parental species, breeding generation, and family. All chestnut families were used in the nut weight and growth and germination patterns experiments. Families noted with an asterisks (*) were used in the seasonal growth patterns study and counts in parentheses are the number of seedlings used in the seasonal growth patterns study at the date of the last measurement before lifting.
Parental Species or GenerationFamilyNumber of Nuts SownNumber of Seedlings at LiftingGermination by May 25 (Percent)Seedling Survival (Percent)
100% AmericanPlummer4 *356245 (120)9169
100% ChineseCD *374236 (138)6463
BC3F2 (94% American)CH283 *179136 (158)8476
BC3F3 (94% American)D3 *181140 (156)8177
D12 *180157 (174)9787
D131811448680
D141801237268
D15176623935
D16175714241
D17172603835
D181791056559
D19 *182163 (170)9090
D20176996056
All178211246763
Total chestnut 269117417064
Northern red oak (939)
The chestnuts were harvested at TACF’s Meadowview Research Farms, Meadowview, VA, USA, in the fall of 2009. As the fertilization and irrigation regime used in this study was originally developed to grow high quality northern red oak and because a considerable amount of research on hardwood artificial regeneration has focused on this species [16], we included northern red oak in the study to evaluate if these nursery practices produce similar results with chestnut. Additionally, northern red oak is one of the hardwood species most commonly planted in forested settings and is likely to be included in mixed species plantings with hybrid chestnuts; therefore, understanding how the two species differ in their early growth is of interest. The northern red oak came from a bulked seedlot from several mother trees at an east Tennessee seed orchard. Prior to sowing, nuts and acorns were stored in sealed plastic bags that contained peat moss in cold rooms at 1 °C. Chestnuts and acorns were manually sown at the East Tennessee State Nursery in Delano, TN, USA (35°14′27″ N, 84°34′21″ W) on 19 February 2010 at a density of 65 seeds m2. Within the nursery bed, chestnuts were sown in the inner two rows and northern red oaks in the outer two rows. Northern red oak served to shelter the chestnut seedlings from wind and to provide shade to the outer sides of the chestnuts to produce uniform growing conditions. Fertilization and irrigation of the seedlings followed guidelines developed by Kormanik et al. [10]. Prior to sowing, each chestnut family was visually separated into large and small nut size classes, each with the same number of nuts. Each size class per family was split into two replicates that were equal in number and in total weight, to the nearest 0.1 g (Table 2).
Table 2. Descriptive statistics (standard error in parenthesis) of mean chestnut nut weight, seedling growth characteristics for whole population and for two nut size classes. FOLR stands for first order lateral roots and RCD stands for root collar diameter.
Nut and seedling characteristicsTotal PopulationNut Size Class 1
MeanRangenLargenSmall
Nut weight (g)3.2 (0.03)0.6–14.913434.3 (0.03) a13483.0 (0.03) b
Height (cm)136 (1.06)7–259885141 (5.82) a856132 (5.82) b
RCD (mm)13.9 (0.12)1.4–35.288514.6 (0.39) a85613.3 (0.40) b
FOLR number 213 (0.16)0–3780313 (0.38) a78612 (0.42) b
Missing tap root (percent)9 (0.68)--8854 (0.01) a8563 (0.01) a
Stem forking (percent)2 (0.37)--8850.002 (0.03) a8560.4 (7.8) b
1 Nut size class means followed by same letter are not significantly different (Least significant difference < 0.05); 2 Only seedlings with taproots were assessed for FOLR number.

2.2. Experimental Design

The nuts were planted in a randomized complete block design, with a nested and split plot treatment arrangement. Generation treatments were whole plots. For the BC3F3 generation, family treatments were nested within the whole plot. Nut size class was the sub-plot. Each family × nut size class treatment was replicated twice and replicates were blocked to reduce bias from environmental variation within the planting beds. Samples from each seed plot were randomly chosen and used for individual nut measurements.

2.3. Measurements

Prior to sowing, each individual nut was weighed and used to calculate mean and variation of nut weights within each family × nut size class treatment for each replicate (hereafter referred to as the seed plot). Weights for each seed plot were recorded; individual nut weights were not. Additionally, a random sample of 86–92 nuts from each seed plot was individually weighed and assigned a unique number to maintain individual nut and seedling identities throughout the study. A small pin flag with a tag labelled with the assigned number was placed next to each of these individually identified nuts at sowing. The tag was transferred to the stem after the seedling grew approximately 10 cm in height to ensure proper identification.
Germination was tallied for each individually tagged nut and germination counts were made for all nuts within each seed plot on five dates: 23 April, 30 April, 4 May, 14 May and 25 May 2010. No new seedlings emerged after 25 May. Height of Chinese, American, BC3F2, three of the BC3F3 chestnut families and the associated northern red oak were measured on nine dates (17 May, 1 June, 14 June, 28 June, 6 July, 2 August, 23 August, 13 September and 4 October 2010) during the growing season.
All seedlings were lifted from the nursery on 8 March 2011. They were stored in a cold room (~1 °C) until measured. Height to the terminal bud and root collar diameter (RCD) of all seedlings were measured. The number of FOLR, lateral roots originating from the taproot and having at least 1 mm at the proximal end, for each chestnut seedling was counted. To reduce bias, the same person counted FOLR on all seedlings. Chestnut seedlings that lacked a taproot or had stem forks were recorded. By definition seedlings without taproots did not have FOLR. A stem fork was defined as a lateral branch beginning at or near the root collar and extending at least half the length of the main stem.

2.4. Statistical Analysis

Analyses for each objective below were processed using SAS software [24], and diagnostics such as normality and equal variance were monitored and corrected for all analyses. Pearson correlations were used to assess associations among variables.

2.4.1. Nut Weight and Seedling Growth

Seedlings with signs of disease caused by Phytophthora cinnamomi (such as presence of black roots), heavy insect damage on stems, or other disease symptoms were excluded from any analyses. Fewer than 10 trees total were removed from the study. Seedlings with missing taproots were excluded from FOLR analysis. T-tests were conducted to determine if pre-treatment differences in mean nut weight existed between replications within each family by nut size class treatment. Mixed model analysis of variance (ANOVA) and DandA.sas macros [25] were used to test nut size, generation and family, and their interaction effects on height, RCD and FOLR for all chestnut seedlings. Any significant main effects or interactions (α = 0.05) were further analyzed using Tukey’s mean separation method.
Indicator variable regression (PROC GLM) was used to test both the ability of the mean nut weight of the seed plot and, separately, the nut weights of sampled seeds, to predict seedling height, RCD and the number of FOLR [11].
Logistic regression (PROC LOGISTIC) was used to determine if the probability of having a missing taproot or stem fork was influenced by family, nut size class, or nut weight. Dummy variables were used for categorical independent variables [26] and the final model was selected by conducting chi-square tests on Akaike information criterion values. The most parsimonious model was selected as the final model. Hosmer-Lemeshow goodness of fit statistic was used to test that the model adequately explained the variation in the data.

2.4.2. Germination Patterns

Seed plot means were used in indicator variable regression (PROC GLM) to determine if nut weight within family could predict final percentage of germination on 25 May 2010, and if final percentage of germination of the seed plot influenced height, RCD and number of FOLR of resulting seedlings. Odds ratios were produced to compare seedlings from each family with those from the Chinese chestnut family. An odds ratio of 1 or greater indicates that the family had a greater chance of germination compared to the Chinese chestnut family, while a ratio of less than 1 indicates the family had a lower chance of germination compared to the Chinese chestnut family. Indicator variable regression was also used to determine if growing-degree days at the time of germination could predict seedling height, RCD or number of FOLR. The five germination dates were converted to growing-degree days using daily temperature data from the National Climatic Data Center for the two weather stations closest to the nursery, stations 13,891 and 13,882 [27]. Daily maximum and minimum temperatures for each day starting from 1 January 2010 were used to calculate growing-degree days for each weather station (then averaged) using the formula:
[ T m a x + ( T m i n ÷ 2 ) T b a s e ]
where Tmax was maximum daily temperature, Tmin was minimum daily temperature and Tbase was set to 10 °C. Tmax and Tmin were set to 10 °C if less than the Tbase.
Logistic regression was used to determine if growing-degree days at the time of germination, nut weight, nut size class and family could be used to predict seedling survival until lifting, and final (25 May) percent germination.

2.4.3. Temporal Growth Patterns

Mixed model ANOVA and DandA.sas macros with an autoregressive covariance structure for repeated measures were used to test family, nut size and growth period effects on daily height growth. Differences among treatment means were examined if main effects and interactions were significant (α = 0.05) using Tukey’s mean separation method.

3. Results

3.1. Nut Weight and Seedling Growth

3.1.1. Nut Weight and Seedling Survival

Pre-sowing differences between replications in nut weight were not significant (p > 0.38), indicating we did not have bias when splitting nuts into replications within each family. All families except the D15, D16 and D17 had greater than 50 percent seedling survival at lifting, and overall survival was 65 percent (Table 1). The BC3F2 generation had the best survival (76 percent) among the generations and parental species. The D19 family of the BC3F3 generation had the best survival (90 percent) for the whole population tested.
Average nut weight across all generations, families and size classes was 3.2 g (Table 2). Nuts ranged from 0.6 to 14.9 g; the lightest nut was from a BC3F3 family (D16) and the heaviest nut was from the Chinese parental species. All main effects and their interactions were significant sources of variation for nut weight (Table 3), indicating we were successful at visually distinguishing two size classes of nuts that differed in weight. Nuts in the large size class weighed 1.3 g more than nuts in the small size class (Table 2). Interactions occurred because the small nut size class of some BC3F3families was heavier than the large nut size class of other BC3F3 families. For example, the largest nut in the small size class weighed 4.8 g (family D18), and the smallest nut in the large size class weighed 1.3 g (family D16).
All generations/parental species differed among each other in nut weight; nuts from the Chinese parental species were heavier and nuts from the BC3F2 generation were lighter than all other generations/parental species (Table 4). Nuts from the American parental species were heavier than nuts from BC3F3 generation families except for D12 and D18. None of the BC3F3 families were similar in nut weight to the Chinese or the BC3F2 families.
Table 3. Analysis of variance to determine differences and interactions among breeding generations, families, and nut size classes for nut weight (n = 2691), height (n = 1741), root-collar diameter (RCD) (n = 1741) and number of first-order lateral roots (FOLR) (n = 1589).
DFF-Statisticp-ValueF-Statisticp-ValueF-Statisticp-ValueF-Statisticp-Value
Source of variationNut weightHeight RCDNumber of FOLR
Generation *31934.82<0.00016.950.024.910.039.29<0.01
Family(Generation)91134.30<0.00013.860.029.31<0.000110.61<0.0001
Size11722.02<0.00016.790.0312.29<0.0112.99<0.01
Size * Generation379.92<0.00011.060.421.120.402.000.18
Size * Family(Generation)95.25<0.010.900.541.850.101.890.11
* Generation denotes both breeding generation and parental species.
Table 4. Least squares means differences in nut weight (n = 2691), height (n = 1741), root-collar diameter (RCD) (n = 1741), and number of first-order lateral roots (FOLR) (n = 1589) for each breeding generation/parental species and genetic family.
Generation or Parental SpeciesNut weightHeightRCD meanNumber of FOLRFamilyNut weightHeightRCDNumber of FOLR
American4.0 (0.02) B144 (6.7) AB13.4 (0.4) B11 (0.7) BPlummer44.0 (0.02) C144 (6.7) ABC13.4 (0.4) DE11 (0.7) EF
Chinese6.3 (0.07) A *148 (6.9) A15.1 (0.5) A15 (0.7) AChinese6.3 (0.07) A148 (6.9) AB15.1 (0.5) BC15 (0.7) BC
BC3F22.0 (0.03) D119 (7.4) C13.2 (0.6) B11 (0.8) BCH2832.0 (0.03) I119 (7.4) D13.2 (0.6) EF11 (0.8) EF
BC3F32.9 (0.01) C135 (5.4) B14.1 (0.4) B14 (0.3) AD33.0 (0.03) F131 (7.3) CD13.5 (0.6) DE12 (0.7)DEF
D124.0 (0.03) C135 (7.2) BCD14.1 (0.5) CDE11 (0.7) DEF
D133.0 (0.03) F144 (7.1) ABC14.2 (0.6)CDE13 (0.7) CD
D141.6 (0.02) J119 (7.5) D11.7 (0.6) G11 (0.8) EF
D153.6 (0.03) D147 (8.6) ABC15.0 (0.8) BCD16 (1.2) BC
D161.5 (0.02) K129 (8.1) CD12.6 (0.8) EFG15 (0.9) BC
D172.2 (0.04) H133 (7.7) BCD17.5 (0.8) A17 (1.2) AB
D184.2 (0.03) B156 (7.7) A15.7 (0.6) B19 (0.9) A
D193.2 (0.03) E124 (7.2) D12.1 (0.5) FG10 (0.7) F
D202.7 (0.03) G131 (7.5) CD14.3 (0.6) BCDE13 (1.0) CDE
* Means followed by same letter within columns are not significantly different (Least significant difference p < 0.05).
Both individually weighed nuts and the seed plot nut weight means could be used to explain variation in seedling height and RCD (Figure 1). Intercepts were larger for the models using the seed plot means, but models were generally similar in their predictions of height and RCD. The slope interaction terms between generation/parental species and nut weight were not significant for any variable and were not included in any of the regression models. The seed plot means for nut weight had higher R2 values and would therefore be stronger predictors of height compared to the model using individually weighed seedlings. The regression model using seed plot means predicted an increase of 6 cm in height for every 1 g increase in mean nut weight, and had the highest predictive power of any model (R2 = 0.32, p = 0.0001, Figure 1). Regression models using seed plot means or individually weighed nuts predicted an increase of 0.5 and 1.0 mm in RCD for every 1 g increase in mean nut weight, respectively (R2 = 0.12, p = 0.01 and R2 = 0.11, p < 0.001, respectively, Figure 1); however, both models had low predictive power. Only data using individually weighed nuts could explain the variation in number of FOLR. Using the individually weighed nuts, seedlings were predicted to gain one FOLR with every 1 g increase in nut weight, although this model also had low predictive power (R2 = 0.12, p = 0.001).
Figure 1. Scatter plots and associated linear regressions between nut weight and height, root collar diameter (RCD), and number of first-order lateral roots (FOLR) for individual seedlings and for seed plot means.
Forests 06 01537 g001

3.1.2. Seedling Growth and Morphology

Seedlings were highly variable in size, ranging from 7 to 259 cm in height, 1.4 to 35.2 mm in RCD, and 0 to 37 in number of FOLR (Table 2). The strongest correlation coefficients were between height and RCD, and correlations involving number of FOLR were also strong (Table 5). Height and RCD had weak and negative correlations with both missing taproot occurrence and stem forking. Missing taproot occurrence was not correlated to stem forking.
Table 5. Pearson correlation coefficients for height, root-collar diameter (RCD), number of first-order lateral roots (FOLR), and occurrence of missing taproot (MTR) and stem forks (Fork), (n = 1589 for correlations with number of FOLR and n = 1741 for the remaining of correlations).
VariablesCorrelation Coefficient
Height-RCD0.85 ****
RCD-FOLR0.68 ****
Height-FOLR0.66 ****
Height-MTR−0.13 ****
Height-Fork−0.11 ****
RCD-MTR−0.11 ****
RCD-Fork−0.07 **
FOLR-Fork−0.01
MTR-Fork0.04
**** Value is significant at p < 0.0001; ** Value is significant at p < 0.01.
Differences between nut size classes were significant for height, RCD and number of FOLR in the ANOVA (Table 3), and interactions with generation/parental species and family were not significant (Table 3). Seedlings in the large nut size class had 9 cm taller heights, 1.3 mm larger RCD and one more FOLR than seedlings in the small nut size class (Table 2). Compared to the occurrence of missing taproot, seedlings of both nut size classes had low occurrence of stem forks (<0.5%).
Generation/parental species affected height, RCD growth and number of FOLR. The American and Chinese parent species did not differ in height growth; the former had smaller RCD and fewer FOLR than the latter (Table 4). Seedlings of the BC3F2 generation were the shortest among all generations/parental species tested (Table 4). The BC3F2 generation had similar RCD and number of FOLR to the American parent. The BC3F3 and the American parental species were similar in height and RCD, but the former had three more FOLR than the latter (Table 4).
The BC3F3 generation was 13 cm smaller in height and 1 mm smaller in RCD compared to the Chinese parental species, but had a similar number of FOLR. Five of the BC3F3 families were similar to the Chinese parental species, eight were similar to the American parental species, and seven were similar to the BC3F2 generation in height growth (Table 4). For RCD growth, five BC3F3 families were similar to the Chinese parental species, six similar to the American parental species, and six similar to the BC3F2 generation in RCD growth. Seedlings of family D20 had a similar number of FOLR to all other generation/parental species. Nut weight was not a significant predictor of missing taproot (p = 0.06) or stem forking (p = 0.67).
Using data from all nursery seedlings lifted, nut size class did not affect the occurrence of missing taproot (p = 0.43), and was dropped from the logistic regression model. Family did affect missing taproot occurrence. Model fit was good according to the Hosmer-Lemeshow goodness of fit test statistic (p > 0.0001). Missing taproots were more likely in all but two BC3F3 families, compared to the Chinese parental species (Table 6). The D17 and D20 families had particularly high levels of missing taproots, and each had greater than 30 times higher odds of having missing taproots than the Chinese parent. All but one BC3F3 family (D12) had a higher occurrence of missing taproots compared to the American parent (model not shown). The American parent had a similar odds of missing taproot compared to the Chinese parent. Nut size class could not be used as a significant predictor for occurrence of stem forks (p = 0.12).
Table 6. Logistic regression model for probability of missing tap-roots using all data (n = 1741), comparing all families to the Chinese parent.
Predictor VariableParameter Estimatep-ValueOdds Ratio Estimate
Intercept−4.3524<0.0001
American−0.03790.960.96
BC3F2 2.017<0.017.52
D32.2322<0.0019.32
D120.9380.22.56
D131.86<0.016.42
D142.3783<0.00110.79
D152.5794<0.00113.19
D161.5340.054.64
D173.4244<0.000130.71
D182.6364<0.000113.96
D191.9875<0.017.30
D203.4219<0.000130.63

3.2. Germination Patterns

Across all families, germination by May 25 averaged 70 percent and seedling survival at lifting was 64 percent (Table 1). Six percent of nuts that germinated died before lifting. The American parent had the largest loss in seedlings between germination and lifting (22 percent; Table 1). Mean nut weight for seed plots did not affect percent germination (p = 0.22). The interaction between family and nut weight was a significant predictor of percent germination, according to the indicator regression analysis (p = 0.0004; R2 = 0.90). Slopes of the regression line were significantly different from zero for Family D16 only, with a strong positive relationship with percent germination for this BC3F3 family. Percent germination of the seed plot did not affect height (p = 0.52), but did affect RCD (p = 0.01). A 10-percent increase in germination of the seed plot decreased RCD by 0.3 mm; however, this regression equation did not have strong predictive power, explaining only 12 percent of the variation in RCD. A 10-percent increase in germination of the seed plot decreased number of FOLR by 0.8 (p < 0.001). Interactions with family or nut size class were not significant for predicting height, RCD, or number of FOLR (p ≥ 0.20).
Nut weight and nut size class were not significant predictors of germination of individual nuts according to the logistic regression analysis (p ≥ 0.18). Family did significantly affect germination (Table 7). The Chinese family had 7.7 times lower odds of germination compared to the American parent, and five BC3F3 families had 4.2 to 33.3 times lower odds of germination than the American family. No families had higher odds of germinating than the American parent. Compared to the Chinese family, four BC3F3 families (D3, D12, D13, D19) had higher odds, and one (D17) had lower odds in germination (data not shown). The BC3F2 family was not significantly different from the American parent in the probability of germination, but this family was 3.4 times more likely to germinate than the Chinese family.
Table 7. Logistic regression model for probability of germination using individually weighed nuts with corresponding seedling measurements. The model is comparing all families to the American family.
Predictor VariableParameter Estimatep-ValueOdds Ratio Estimate
Intercept2.270.0002
Chinese−2.020.00410.13
BC3F2−0.800.28910.45
D3−0.320.68970.72
D120.440.64351.55
D13−0.320.68970.72
D14−1.420.05010.24
D15−2.92<0.00010.05
D16−2.330.00090.10
D17−3.54<0.00010.03
D18−1.000.17970.37
D19−0.730.33480.48
D20−1.620.02260.20
Growing-degree days for 23 April, 30 April, 6 May, 14 May and 25 May were 302.4, 351.1, 427.7, 507.9 and 640.7, respectively. By 23 April, 45 percent of nuts had germinated, followed by 57 percent by 30 April, 59 percent by 6 May, 64 percent by 14 May and 70 percent by 25 May 2010. Growing-degree day at the time of germination was a significant predictor of number of FOLR, but the R2 value was low, explaining only about 2 percent of the variation (p = 0.02):
[ Y = 0.03 X + 19.2 ]
The regression equation predicted 11.5, 10.3, 8.4, 6.4 and 3.0 as number of FOLR of resulting seedlings if a nut germinated by April 23 and 30 and May 6, 14 and 25, respectively. Growing-degree days could not be used to predict height (p = 0.20) or RCD (p = 0.10), and interactions between growing-degree days and family, and between growing-degree days and nut size class were not significant for predicting height, RCD or number of FOLR (p ≥ 0.14). Seedlings that germinated after 14 May did not survive to lifting; therefore, predictions of growth using growing-degree days are limited.
The higher the number of growing-degree days at the time of germination, the lower the probability of seedling survival (p < 0.0001). Growing-degree days had to be transformed to the third power divided by 106 to improve linearity. The parameter estimate for this transformed variable was −0.0322 with an odds ratio estimate of 0.968. Nuts that germinated on 23 April with 302.4 growing-degree days had 1955 times higher odds of producing live seedlings than nuts that germinated on 25 May with 640.7 growing-degree days. Seedling survival by lifting time did not depend on family (p > 0.15) or nut weight (p = 0.10). Goodness of fit for this logistic model was good according to the Hosmer-Lemeshow goodness of fit statistics (p = 0.08).

3.3. Temporal Growth Patterns

Daily height growth differed between nut sizes (p = 0.015; F = 6.48), family (p = 0.008; F = 9.23) and date (p < 0.0001; F = 261.08). Chestnut seedlings of all species and generations grew more on average than did northern red oak seedlings (Table 8). Seedlings from large nuts grew an average of 0.81 cm daily, compared to growth of 0.77 cm daily for seedlings from small nuts. The greatest daily growth was achieved between 7 July and 2 August for all except the BC3F2 family (Figure 2). Family × measurement date interaction was significant (p < 0.0001; F = 5.01), indicating that families grew at different rates through the growing season. American and BC3F3 chestnut families decreased in height growth between 15 and 28 June, while Chinese and BC3F2 chestnuts and NRO continued to increase in height over this period (Figure 2). Nut size class × family interaction was also significant (p = 0.0179; F = 2.95). Differences in daily growth between small and large chestnuts were found in BC3F2 (small = 0.66 cm; large = 0.83 cm) and American (small = 0.75 cm; large = 0.90 cm) families. Size classes did not differ significantly in daily growth for the other generations. Neither size × date interaction (p = 0.28; F = 1.27) nor family × size × date interactions were significant (p = 0.95; F = 0.63).
Table 8. Least squares means differences in daily height growth (cm) for each breeding generation/parental species and genetic family. Standard errors are in parentheses.
Generation or Parental SpeciesFamilyDaily Height Growth
ChineseCD0.9 (0.05) A*
AmericanPlummer 40.8 (0.06) AB
BC3F2CH2830.7 (0.05) B
BC3F3D30.8 (0.05) AB
D120.9 (0.05) AB
D190.8 (0.05) AB
NROBulk0.5 (0.05) C
* Means followed by same letter are not significantly different (Least significant difference p < 0.05).

4. Discussion

4.1. Nut Weight and Seedling Growth

Results from the nut weight and seedling growth study and the temporal growth pattern study show that seed plots with larger chestnut seeds produced higher-quality seedlings compared to seed plots with smaller nuts. Seedling quality includes growth variables such as daily height growth, end of season height and RCD growth and number of FOLR. These results generally agree with Clark et al.’s [11] findings. Improvements in seedling quality were reliably made across all breeding generations and parental species through a course visual grade based on nut size. However, predictions for increases in seedling quality from individual nuts were not reliable, as indicated by the low R2 values. These findings indicate that managers will see improvements if grading nuts by distinguishable size class groupings, and not by relatively small gradations within a seedlot. However, as suggested by Clark et al. [11], selecting only the largest nuts may lead to indirectly selecting individuals with additional Chinese chestnut traits, as Chinese chestnuts have larger seeds than Americans.
Our findings were similar to a previous study that found seedlings with larger height and RCD were produced from large size-class chestnut seed plots and found a 3 cm increase in height and no significant relationship with RCD for every 1-gm increase in nut weight [11]. The similarity of results is particularly meaningful because different families were used in each study, indicating a general trend among backcross chestnut hybrids, not just certain families. Our results also agree with several studies that have found a relationship between acorn size and seedling development [28,29]. Our results suggest that the occurrences of missing taproots and stem forking reduced height and RCD. Missing taproots and forking are presumably caused, in part, by damage to young radicle tips by biotic (insects) or abiotic factors. These seedlings then develop adventitious roots that look like lateral roots from the base of remaining radicles. Sung et al. [30] reported more white oak (Q. alba L.) seedlings had forking root systems after half or whole radicles were surgically removed before sowing, suggesting forked root systems are caused by loss of the radicle. Like white oak, emergence of the radicle tip can occur with chestnuts even during cold storage of the nuts. Planting nuts before radicle emergence, therefore, is important to reduce the occurrence of forking or missing taproots.
The stronger relationship between seed plot mean nut weight and growth variables compared to individual nut weights and growth variables was expected given that variability among individual nuts/seedlings is higher than variability among seed plots. However, the lower explanatory power of individual nuts/seedlings could also be due to the fact that we marked individual nuts with pin flags. These flags flapped against the seedlings as they sprouted from nuts, noticeably injuring many of them and presumably reducing their growth, which would weaken a relationship between nut size and growth. Nonetheless, results do indicate that a high degree of variability could be expected in American chestnut nursery seedlings within the same family with similar nut sizes, or weights or both, grown in relatively uniform conditions of a commercial nursery bed. The large variation within families may have occurred partially because these nuts were from open-pollinated trees or because of damage to nuts from weevils [31].

4.2. Species and Family Treatments

After the growth period between 2 and 14 June, Chinese chestnuts outperformed other species/generations. Clark et al. [11] also reported better growth by Chinese chestnut. Although Chinese chestnut is generally not a good competitor after outplanting [32], the ideal growth conditions in the nursery beds may be conducive to superior growth of this Asian species due in part to its larger nut size. Families of the BC3F3 generation and American chestnuts were similar in growth including a slow growth period between 15 and 28 June. These results support the expectations of TACF’s backcross breeding program. The differences in mean height and RCD of some BC3F3 families compared to the American family indicate the importance of genetic influence on growth, and that genetic selection of superior families in the nursery may eventually be possible. Significant family differences were also reported in other studies for backcross chestnut families [11,12].
In general, the BC3F2 family, CH283, yielded inferior growth results compared to the other chestnut families tested. Although the BC3F2 generation might be expected to behave similarly to the BC3F3 generation, the same BC3F2 family, CH283, grew less in height and RCD compared with BC3F3, American and Chinese families in Clark et al.’s 2012 chestnut nursery study [11]. These results suggest a genetic effect, but because only one BC3F2 family was tested, we cannot determine if the inferior growth is related to a family traits as opposed to a generational (i.e., breeding). Nevertheless, these shared results indicate uniformity in growth patterns between years. Daily growth rate was greater for all chestnut families than for northern red oak. Northern red oak, which was planted in the outer nursery rows, may have been stunted due to high wind conditions of the nursery; however, several other studies have demonstrated its inferior growth as compared to American chestnut [33,34]. Northern red oak, a mid-shade tolerant species [35], has been found to have a low growth potential in high-resource environments [36], compared to shade-intolerant species such as trembling aspen (Populus tremuloides Michx.) [37]. Chestnut, however, is most productive in high-light, high-nutrient environments [13,15]. These results suggest the need for nursery protocols designed specifically for chestnut, such as increasing fertilization rates to enhance growth.

4.3. Germination Patterns

This study found no relationship between nut size or weight and percent germination among the chestnuts, except for BC3F3 family D16, which also had the lowest nut weight of any family in the study. This outcome suggests that germination may be reduced for families with small chestnut seeds, but more research is needed before strong inferences can be made.
Regardless of generation and family, seed plots with higher germination averaged fewer FOLR and smaller RCD than those with lower germination, suggesting chestnuts in seed plots with lower germination faced less competition and therefore had greater amounts of resources, such as light, soil water and nutrients. The American parental species had both the best germination rate and the greatest mortality between germination and lifting. The higher mortality may have been caused by tighter spacing, and therefore increased competition, from high germination. Furthermore, the later into the spring a chestnut germinated, the less chance it had to survive and the fewer FOLR it developed, suggesting that those that germinated later faced more intense competition. If we had started measuring germination earlier in the season, (before 23 April), we may have seen a relationship between growing-degree days and height and RCD growth, and an improved relationship with number of FOLR.
This study found differences in probability of germination among chestnut generations and families, with the Chinese chestnut having lower germination compared to the American family, but the BC3F3 families having generally similar germination compared to the American chestnut. Differences may be due to generation or family effects; for instance, perhaps weevils prefer Chinese chestnuts to American chestnuts, decreasing the Chinese chestnut germination rate. Differences in germination, however, may be related to other factors. For example, unknown differences in seed collection or handling practices, such as variation in the amount of time seeds sat on the ground before collection, could be a contributing factor. Because percent germination did affect the growth of the seedlings, specifically RCD and FOLR, future studies should take germination rate into account when looking at differences in growth among species or families.

4.4. Temporal Growth Patterns

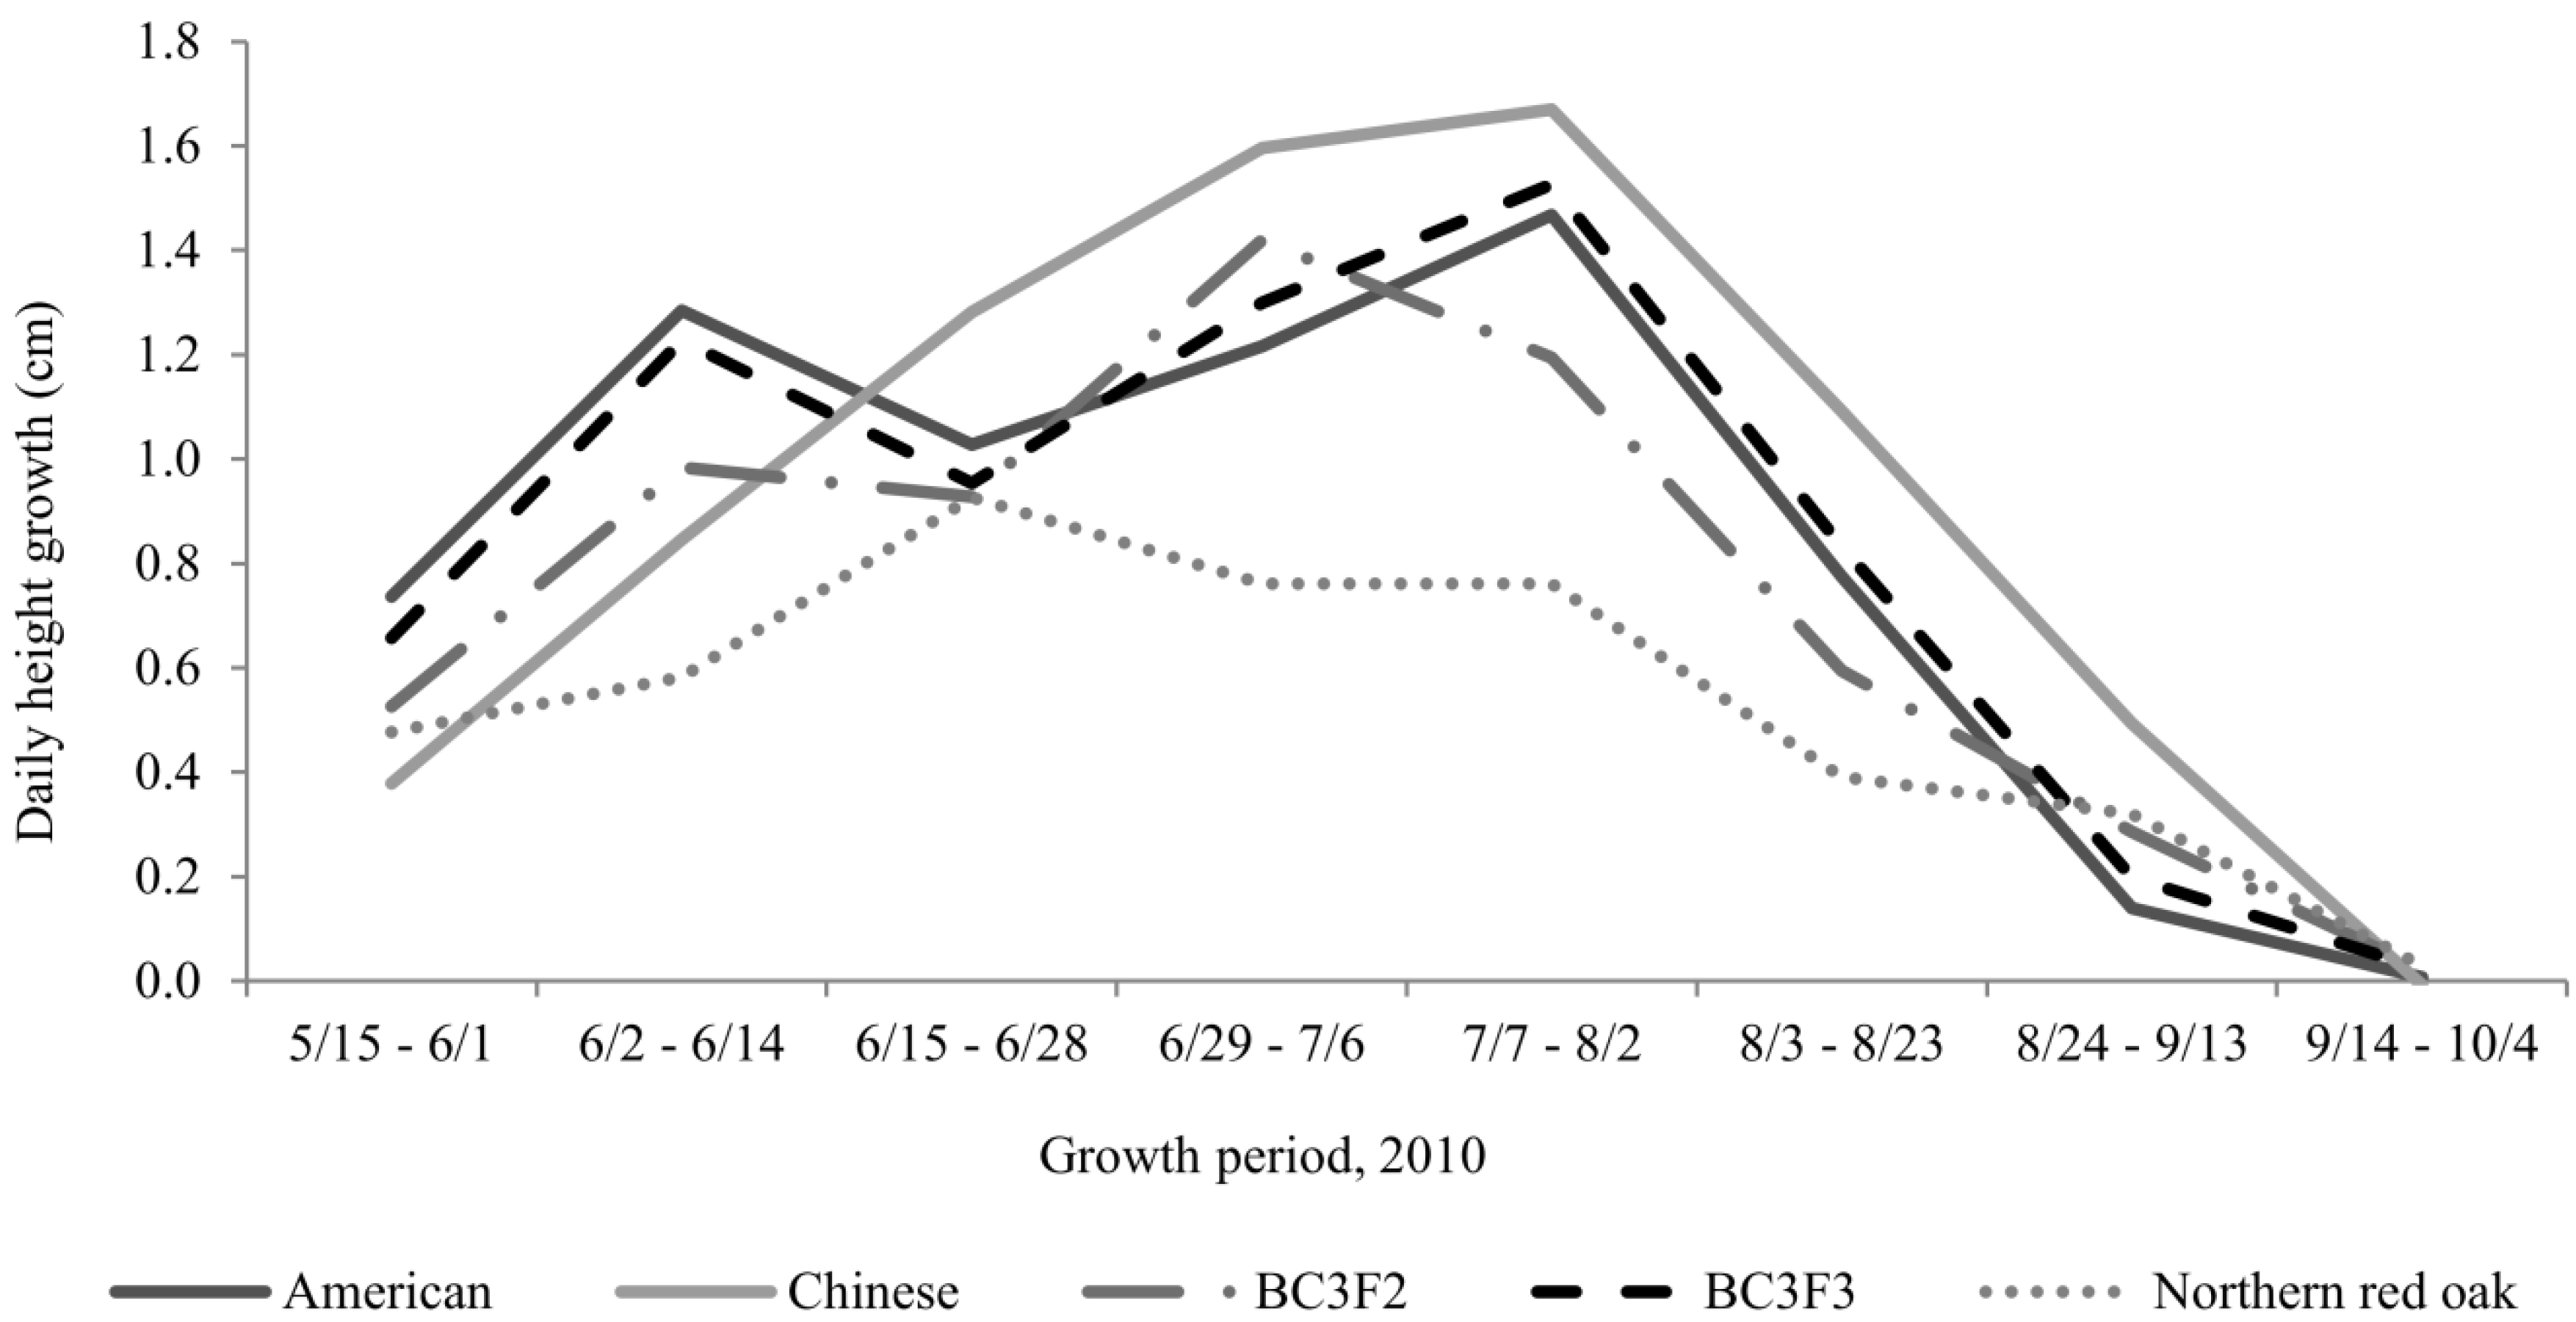
Daily growth rate did not display a consistent pattern from date to date (Figure 2). The highest growth rates for American and BC3F3 families took place between 7 July and 2 August with a distinct drop in growth rate between 15 and 28 June, whereas Chinese chestnut seedlings did not show the same drop in growth rate for this period. No environmental conditions can be directly connected with the decreased growth rate for the American and four BC3F3 chestnut families. Seedlings were irrigated and fertilized regularly and temperatures were not abnormal during this period. It is possible that the variation in daily growth rates between Chinese chestnuts and American and backcross chestnuts over the growing season can be explained by the distribution of carbohydrate from sources to sinks. We hypothesize that American and backcross chestnut seedlings had exhausted most of the carbohydrate stored in their seed cotyledons by 28 June, causing a distinct decrease in daily growth. Chinese chestnuts, however, have larger seeds, which presumably continued to function as a source of carbohydrates. After June, we hypothesize the carbohydrate available from photosynthesis was greatly increased as the first flush of leaves matured and started to export photosynthate. No drop in growth was found in Chinese chestnuts, presumably because by the time the carbohydrates from their seeds was exhausted, they had already begun exporting large amounts of photosynthate from newly matured leaves.
Figure 2. Family × period interaction for daily height growth. Values for BC3F3 were means of D2, D12 and D19 families. Growth among families differed for all periods except 9/14–10/4.
Forests 06 01537 g002
Except for the drop in daily height growth among American and backcross families between 15 and 28 June, and the steady drop in daily height growth among all chestnut families after July, chestnut families exhibited fairly smooth growth patterns over their first growing season (see Figure 2). In contrast, northern red oak exhibited several small increases in growth over the growing season, possibly associated with periods of episodic flushing. Northern red oak is a determinate species, meaning it exhibits distinct flushes of shoot expansion, followed by periods of growth lag [38], whereas American chestnut is an indeterminate species.

5. Conclusions

Successful restoration of American chestnut will require the production of high quality seedlings that can overcome multiple challenges to seedling establishment, including competition from sprouts and other seedlings and browsing by deer [39]. Poor-quality seedlings and direct seeded chestnuts have been found to be less successful than high quality seedlings in withstanding the competition present in recently-harvested sites [39]. This study aimed to refine methods for producing high quality bare-root chestnut seedlings in nurseries. Results corroborate findings by Clark et al. [11] that larger chestnuts generally produced larger chestnut seedlings. This should not, however, lead nursery managers to discard smaller chestnuts before planting, as this practice may indirectly select for trees with greater Chinese heritage. More testing is needed to link field performance for desired American traits to nut size class before specific recommendations can be made.
The results of this study suggest that, overall, chestnuts from the BC3F3 generation grow similarly to American chestnuts. There is, nonetheless, substantial variation in growth variables among and within BC3F3 chestnut families. Chestnut breeders should keep track of family differences, and use these data to select superior performing families with good blight resistance for outplanting.
Results suggest that chestnuts that germinated earlier in the season have a better chance of survival than those that germinate later than mid-May. The late germinating seedlings may be shaded by the early germinating seedlings, or the early germinating seedlings may have more space to grow. The results also suggest that wider spacing in a nursery bed leads to larger chestnut seedlings, based on the number of FOLR and RCD. Further research is needed to refine seed spacing for chestnut growth.
Daily growth patterns showed that growth in American and backcross chestnuts slowed in the latter part of June. It may pay for nursery managers to adjust their fertilization regime to maximize mid-season growth in chestnuts.

Acknowledgments

We thank the staff of the Tennessee Division of Forestry’s East Tennessee State Nursery for growing the seedlings for this research, and David Griffin, Ami Sharp, Tracy Powers and John Johnson (all University of Tennessee employees) for their assistance with data collection and seedling lifting. We thank Shivanand Hiremath and Daniel Dey of the Northern Research Station and two anonymous reviewers for greatly improving earlier versions of this manuscript.
This work was supported by the USDA Forest Service, Northern Research Station, Southern Research Station; and by a Joint Venture Agreement between the University of Tennessee and the Forest Service, Southern Research Station (10-JV-11330134-066).

Author Contributions

Cornelia C. Pinchot, Stacy L. Clark, and Scott E. Schlarbaum conceived and performed the experiments, and, with Arnold M. Saxton, designed the study. Arnold M. Saxton, Stacy L. Clark, and Cornelia C. Pinchot performed the statistical analysis. Shi-Jean S. Sung assisted with interpretation of the data analysis. Frederick V. Hebard produced and provided the hybrid chestnuts used in the study. Cornelia C. Pinchot and Stacy L. Clark wrote the paper.

Conflicts of Interest

The authors declare no conflict of interest.

References and Notes

  1. Crandall, B.S.; Gravatt, G.F.; Ryan, M.M. Root disease of Castanea species and some coniferous and broadleaf nursery stocks, caused by Phytophthora cinnamomi. Phytopathology 1945, 35, 162–180. [Google Scholar]
  2. Schlarbaum, S.E. Returning the American chestnut to eastern North America. In Proceedings of the Southern Appalachian Mast Management Workshop, Knoxville, TN, USA, 14–16 August 1989; University of Tennessee Press: Knoxville, TN, USA, 1989; pp. 66–70. [Google Scholar]
  3. Diamond, S.J.; Giles, R.H.; Kirkpatrick, R.L.; Griffin, G.J. Hard mast production before and after the chestnut blight. South J. Appl. For. 2000, 24, 196–201. [Google Scholar]
  4. Paillet, F.L. Chestnut and wildlife. In Proceedings of the Restoration of American Chestnut to Forest Lands Conference, Asheville, NC, USA, 4–6 May 2004; Steiner, K.C., Carlson, J.E., Eds.; National Park Service, The US Department of Interior: Washington, DC, USA, 2004; pp. 41–52. [Google Scholar]
  5. Moss, A.E. Chestnut and its demise in Connecticut. Conn. Woodland. 1973, 38, 7–13. [Google Scholar]
  6. Burnham, C.R. The restoration of the American chestnut: Mendelian genetics may solve a problem that has resisted other approaches. Am. Sci. 1988, 76, 478–487. [Google Scholar]
  7. Hebard, F.V. Backcross breeding program produces blight-resistant American chestnuts (Virginia). Ecol. Restor. 2001, 19, 252–254. [Google Scholar]
  8. Anagnostakis, S.L. Connecticut Chestnut Research: Breeding and Biological Control. Available online: http://www.ct.gov/caes/cwp/view.asp?a=2815&q=376908 (accessed on 22 January 2015).
  9. Hebard, F.V. The American Chestnut Foundation Breeding Program. In Proceedings of the Fourth International Workshop on the Genetics of Host-Parasite Interactions in Forestry: Disease and Insect Resistance in Forest Trees, Eurgene, OR, USA, 31 July–5 August 2011; Sniezko, R.A., Yanchuk, A.D., Kliejunas, J.T., Palmieri, K.M., Alexander, J.M., Frankel, S.J., Eds.; Southwest Research Station; US Forest Service; US Department of Agriculture: Albany, CA, USA, 2012; pp. 221–234. [Google Scholar]
  10. Kormanik, P.P.; Sung, S.-J.S.; Kormanik, T.L. Toward a single nursery protocol for oak seedlings. In Proceedings of the 22nd Southern Forest Tree Improvement Conference, Atlanta, GA, USA, 14–17 June 1993; Lantz, C.W., Moorhead, D., Eds.; Southern Forest Tree Improvement Committee: Springfield, VA, USA, 1994; pp. 89–98. [Google Scholar]
  11. Clark, S.L.; Schlarbaum, S.E.; Saxton, A.M.; Hebard, F.V. Nursery performance of American and Chinese chestnuts and backcross generations in commercial tree nurseries. Forestry 2012, 85, 589–600. [Google Scholar] [CrossRef]
  12. Clark, S.L.; Schweitzer, C.J.; Schlarbaum, S.E.; Dimov, L.D.; Hebard, F.V. Nursery quality and first-year response of American chestnut (Castanea dentata) seedlings planted in the southeastern United States. Tree Planter’s Notes 2009, 53, 13–21. [Google Scholar]
  13. Rhoades, C.; Loftis, D.; Lewis, J.; Clark, S. The influence of silvicultural treatments and site conditions on American chestnut (Castanea dentata) seedling establishment in eastern Kentucky, USA. For. Ecol. Manag. 2009, 258, 1211–1218. [Google Scholar] [CrossRef]
  14. Clark, S.; McNab, H.; Loftis, D.; Zarnoch, S. American chestnut growth and survival five years after planting in two silvicultural treatments in the southern Appalachians. Forests 2012, 3, 1017–1034. [Google Scholar] [CrossRef]
  15. Clark, S.L.; Schlarbaum, S.E.; Saxton, A.M.; Hebard, F.V. Making history: Field testing of Blight-Resistant American Chestnut (Castanea dentata) in the Southern Region. In Proceedings of the 17th Central Hardwood Forest Conference, Lextinton, KY, USA, 5–7 April 2010; Fei, S., Lhotka, J.M., Stronger, J.W., Gotchalk, K.W., Miller, G.W., Eds.; USDA Forest Service: Newtown Square, PA, USA, 2011; pp. 656–657. [Google Scholar]
  16. Dey, D.C.; Jacobs, D.F.; McNabb, K.; Miller, G.; Baldwin, V.; Foster, G. Artificial regeneration of major oak (Quercus) species in the eastern United States—A review of the literature. For. Sci. 2008, 54, 77–106. [Google Scholar]
  17. Johnson, P.S. Perspectives on the Ecology and Silviculture of Oak-Dominated forests in the Central and Eastern States; General Technical Report NC-135; United States Department of Agriculture; US Forest Service: St. Paul, MN, USA, 1992; p. 28.
  18. Dey, D.C.; Parker, W.C. Overstory density affects field performance of underplanted red oak (Quercus rubra L.) in Ontario. North Appl. For. 1997, 14, 120–125. [Google Scholar]
  19. Kormanik, P.P.; Sung, S.-J.S.; Kass, D.J.; Schlarbaum, S.E. Effect of seedling size and first-order-lateral roots on early development of northern red oak on mesic sites. In Proceedings of the Ninth Biennial Southern Silvicultural Research Conference, Clemson, SC, USA, 25–27 February 1997; Waldrop, T.A., Ed.; United States Department of Agriculture; US Forest Service; Southern Research Station: Asheville, NC, USA, 1998; pp. 227–233. [Google Scholar]
  20. Jacobs, D.F.; Salifu, K.F.; Seifert, J.R. Relative contribution of initial root and shoot morphology in predicting field performance of hardwood seedlings. New For. 2005, 30, 235–251. [Google Scholar] [CrossRef]
  21. Stroempl, G. Grading northern red oak planting stock. Tree Planters’ Notes 1985, 36, 15–18. [Google Scholar]
  22. Teclaw, R.M.; Isebrands, J.G. An artificial regeneration system for establishing northern red oak on dry-mesic sites in the Lake States, USA. Ann. Sci. For. 1993, 50, 543–552. [Google Scholar] [CrossRef]
  23. Thompson, J.R.; Schultz, R.C. Root system morphology of Quercus rubra L. planting stock and 3 year field performance in Iowa. New Forest 1995, 9, 225–236. [Google Scholar] [CrossRef]
  24. SAS Institute Inc. SAS/STAT© 9.3 User’s Guide, Version 9.3; SAS Institute, Inc.: Cary, NC, USA, 2011; 2340.
  25. Design and Analysis Web Guide. Available online: http://www.webcitation.org/6VnylVakI (accessed on 23 January 2015).
  26. Hosmer, D.W.; Lemeshow, S. Applied Logistic Regression, 2nd ed.; John Wiley & Sons, Inc.: Hoboken, NJ, USA, 2000; p. 383. [Google Scholar]
  27. National Climatic Data Center. Available online: http://www.webcitation.org/6VnzCHe4o (accessed on 23 January 2015).
  28. Bonfil, C. The effects of seed size, cotyledon reserves, and herbivory on seedling survival and growth in Quercus rugosa and Q. laurina (Fagaceae). Am. J. Bot. 1998, 85, 79–87. [Google Scholar] [CrossRef] [PubMed]
  29. Kormanik, P.P.; Sung, S.S.; Kormanik, T.L.; Schlarbaum, S.E.; Zarnoch, S.J. Effect of acorn size on development of northern red oak 1–0 seedlings. Can. J. For. Res. 1998, 28, 1805–1813. [Google Scholar] [CrossRef]
  30. Sung, S.-J.S.; Kormanik, P.P.; Zarnoch, S.J. White oak epicotyl emergence and 1–0 seedling growth from surgically altered germinating acorns. In Proceedings of the 14th Biennial Southern Silvicultural Resaerch Conference, Athens, GA, USA, 27 February–1 March 2007; Stanturf, J.A., Ed.; United States Department of Agriculture; US Forest Service; Southern Research Station: Asheville, NC, USA, 2010; pp. 185–190. [Google Scholar]
  31. Dalgleish, H.J.; Shukle, J.T.; Swihart, R.K. Weevil seed damage reduces germination and seedling growth of hybrid American chestnut. Can. J. For. Res. 2012, 42, 1107–1114. [Google Scholar] [CrossRef]
  32. Schlarbaum, S.; Anagnostakis, S.; Morton, M.C. Evaluation of experimental chestnut plantings in eastern North America. In Proceedings of the International Chestnut Conference, Morgantown, WV, USA, 10–14 July 1992; Double, M.L., MacDonald, W.L., Eds.; West Virginia University Press: Morgantown, WV, USA, 1994; pp. 52–56. [Google Scholar]
  33. Jacobs, D.F.; Severeid, L.R. Dominance of interplanted American chestnut (Castanea dentata) in southwestern Wisconsin, USA. For. Ecol. Manag. 2004, 191, 111–120. [Google Scholar] [CrossRef]
  34. Latham, R.E. Co-occurring tree species change rank in seedling performance with resources varied experimentally. Ecology 1992, 73, 2129–2144. [Google Scholar] [CrossRef]
  35. Burns, R.M.; Honkala, B.H. Silvics of North America, Volume 2: Hardwoods; United States Department of Agriculture; US Forest Service: Washington, DC, USA, 1990; p. 877.
  36. Farmer, R.E., Jr. Comparative analysis of 1st-year growth in six deciduous tree species. Can. J. For. Res. 1980, 10, 35–41. [Google Scholar] [CrossRef]
  37. Kaelke, C.M.; Kruger, E.L.; Reich, P.B. Trade-offs in seedling survival, growth, and physiology among hardwood species of contrasting successional status along a light-availability gradient. Can. J. For. Res. 2001, 31, 1602–1616. [Google Scholar] [CrossRef]
  38. Dickson, R.E. Height growth and episodic flushing in northern red oak. In Biology and Silviculture of Northern Red Oak in the North Central Region: A Synopsis; Isebrands, J.G., Dickson, R.E., Eds.; United States Department of Agriculture; US Forest Service: St. Paul, MN, USA, 1994; pp. 1–9. [Google Scholar]
  39. Clark, S.L.; Schlarbaum, S.E.; Pinchot, C.C.; Anagnostakis, S.L.; Saunders, M.R.; Thomas-Van Gundy, M.; Schaberg, P.; McKenna, J.; Bard, J.F.; Berrang, P.C.; et al. Reintroduction of American Chestnut in the National Forest System. J. For. 2014, 112, 502–512. [Google Scholar]

