Abstract
The southern region of the U.S. uses prescribed fire as a management tool on more of its burnable land than anywhere in the U.S., with ecosystem restoration, wildlife habitat enhancement, and reduction of hazardous fuel loads as typical goals. Although the region performs more than 50,000 prescribed fire treatments each year, evaluation of their effects on wildfire suppression resources or behavior/effects is limited. To better understand trends in the use and effectiveness of prescribed fire, we conducted a region-wide survey of 523 fire use practitioners, working on both public and private lands. A 1–2 year prescribed fire interval was consistently viewed as effective in decreasing wildfire ignitions, behavior, and severity, as well as reducing suppression resources needed where wildfire occurred. Yet fewer than 15% of practitioners viewed burn intervals of 3–4 years as effective in reducing ignitions, underscoring the importance of high-frequency burning in vegetation communities where fuel recovery is rapid. Public lands managers identified limited budget and staffing as major institutional impediments to prescribed fire, in contrast to private individuals, more of whom chose liability as a key challenge. Differences in responses across ownership type, state, and vegetation type call for a broader perspective on how fire managers in the southern U.S. view prescribed fire.
1. Introduction
The forests, savannas, and grasslands of the southern U.S. (i.e., Region 8 of the U.S. Department of Agriculture (USDA) Forest Service) have a long and well-established history of fire [1,2], whether from lightning, Native American ignitions, or Anglo-European ignitions. However, anthropogenic fire use has decreased during the last 200 years due to increased population and development, as well as a cultural shift towards the suppression of wildfires. During the 19th and early 20th centuries, the southern U.S. was heavily logged, and today only approximately 3%–5% of the upland pine-grassland communities remain intact [3]. Population growth-related shifts in land use and land cover have led to increased fragmentation and substantive alteration of the spatial and temporal components of fire regimes [1].
Prescribed burning across North America attempts to restore or replicate historical fire regimes in ecosystems where its occurrence has been disrupted due to fragmentation, land use change, expansion of the wildland-urban-interface, or fire suppression [4]. While prescribed burning is used throughout the United States, it is most commonly employed in the southern U.S. [5] where the majority of extant ecosystems are adapted to frequent (recurring less than every 10 years) fires [5]. Prescribed fire can be applied across large areas for relatively low cost and can be used where topography or lack of access would limit mechanical fuels reduction. In addition to its fuel-reduction effects, prescribed fire drives key ecosystem processes (e.g. nutrient cycling, seed scarification, stimulation of food plants for wildlife) and maintains fire-adapted biological communities [6,7]. Together, these attributes make prescribed burning a popular tool for southern land managers, who in 2011 reported burning over 2.4 million ha [5]. Although a recent survey of state forestry agency officials suggests that prescribed burning is increasing in the region, key impediments have been identified including limited capacity (e.g. staffing, funding), liability concerns, and air quality/smoke management concerns [5]. The future of prescribed fire use depends on overcoming these challenges and improving our understanding of benefits compared to costs.
In addition to reducing fuel loads and providing ecological benefits, prescribed burning can reduce the risk and potential severity of subsequent wildfires, as has been shown empirically across a diversity of vegetation communities (e.g. [8,9,10,11]). However, assessments of trends in prescribed burning effectiveness across the southern U.S. are surprisingly limited to a few mostly case-based studies. In an analysis of wildfire and prescribed fire from 1981 to 1990 conducted by the Florida Forest Service, Koehler reported contrasting trends in hectares authorized for prescribed fire use and hectares burned by wildfire over time in three northern Florida locations [12]. The author showed that consistent prescribed burn programs with higher percent of total area burned corresponded to fewer hectares burned in wildfire [12]. Butry et al. [13] also analyzed the relationships between prescribed fire authorizations and wildfire ignitions in Florida to find that areas without prescribed burning were co-located with 75% of the wildfire ignitions, compared to 4% of ignitions where one or more prescribed burn authorization permits were issued. In contrast, Mercer et al. [14] reviewed the relationships between wildfire hectares burned during the 1998 wildfire season with previous prescribed burns and previous wildfires, to find that little correlation existed with prescribed fires. Rather, previous wildfires played a significant role in subsequent wildfire attenuation. The authors suggested that wildland fire use should therefore be given more attention and potential support in the region [14]. These studies suggest that the relationship between prescribed fire and wildfire may be more nuanced than a simple negative correlation.
Effects of prescribed fire on wildfire severity have also been explored, but are limited to a few studies focused on pine dominated ecosystems. In the Osceola National Forest and two state forests in north Florida, Outcalt and Wade [15] documented that increased prescribed fire frequency and more-recent burns led to reduced pine mortality following the complex of wildfires in 1998. Differences were evident when sites burned 1.5 years prior to the wildfire were compared to those burned 2 years prior, signifying the critical importance of time-since-burn for evaluating prescribed fire effectiveness [15]. Also in the Osceola National Forest, Malone et al. conducted a remote sensing-based spatial analysis of over 200 fires, finding that prescribed fires appeared effective in reducing subsequent wildfire severity, but only if burning more frequently than every five years [11]. The five year “tipping point” was also reported in a case study in North Florida by Davis and Cooper [16]. Each of these studies suggests that recent prescribed fire is likely effective in reducing wildfire severity, but the studies are limited in geographic scope and pertain almost entirely to pine-dominated communities.
As the limitations in scope and consistency described above suggest, assessing the relationship between prescribed burning and wildfire in the southern U.S. is challenging for a number of reasons. First, record-keeping of prescribed burn authorizations differs across states and even within states where county governments have authorization responsibility. Exact locations of burns are usually unknown, as most authorizations only record that burns were authorized somewhere within a 2.6 square km area. Hence, whether wildfires and prescribed burns are co-located is uncertain. Second, no state in the region tracks whether the hectares permitted for prescribed fire use are actually burned, so that comparisons of hectares authorized against wildfire hectares may suffer from being founded on fundamentally imprecise data. Remote sensing analyses are limited by the small sizes of many burns, and the expedient recovery of vegetation following burns. In some cases, burned areas are not identifiable even one month following a low-severity, understory burn [17]. Finally, differences across vegetation types and the wide range of agency affiliations in the region have yet to be examined; it is likely that both influence perceptions of prescribed fire effectiveness and trends in use [18,19].
Given these challenges, and the limited existing assessments, we looked to the first-hand knowledge of a wide range of wildland fire practitioners to help characterize the relationship between prescribed fire and wildfire in the southern U.S. Although inherently subjective, the extensive experience of these practitioners integrates institutional memory across a broader geographic and temporal scope than can be documented via case studies. Unlike previous studies (e.g. [5,18]) our survey was not limited to managers in senior positions, but includes a wide variety of active wildland fire practitioners. Our survey was designed to explore trends, impediments, effects, and longevity of prescribed burning efficacy across landowner type, state, and vegetation type across the southern U.S. Because of the region’s high primary productivity and frequent fire return intervals, the effects of prescribed fire on wildfires can be readily observed over the span of a single manager’s career. Despite the southern U.S. burning more acreage than any other region in the U.S., this is the first regional survey to address these questions using first-hand knowledge about prescribed fire.
2. Methods
The survey was conducted from the fall of 2011 to early 2012, and was distributed via the email list-serve of voluntary members of the Southern Fire Exchange (SFE), one of the Joint Fire Science Program’s regional consortia dedicated to fire science knowledge and exchange. Members of the list include private fire use practitioners, managers, scientists, contractors, governmental agencies, and non-governmental agency personnel across the 13 states of the USDA Forest Service Southern Region (Region 8). The survey targeted self-defined prescribed fire practitioners regardless of their positions, jurisdictions, or reasons for using prescribed fire. Only respondents using prescribed fire for non-agricultural purposes were included.
2.1. Survey Design
The survey following the basic tenets of Dillman’s Tailored Design Method [20] and was designed to be distributed, completed, and returned electronically. The 2800 people on the SFE listserv were sent an email one week prior to the actual survey, in late September of 2011, alerting them of the upcoming survey and its purpose. The following week the survey was distributed; two weeks later a follow-up reminder was sent out for those who had yet to fill out the survey. Members were given three full months to complete the survey, with two additional reminder emails sent in the interim. The survey closed in late January of 2012.
2.2. Survey Questions
Respondents first were asked to provide information on lands they managed, including total number of hectares under management, average number of hectares burned by prescribed fire annually, the top three vegetation communities managed, and the target and actual fire-return intervals for each vegetation type. For the remainder of the survey, respondents were asked to provide information based on the dominant vegetation type under their management.
The second part of the survey focused on prescribed fire use. Respondents were asked to rank the relative importance of 11 possible objectives of prescribed fire use (backlogged burns (returning fire regimes to the desired fire return interval), control competition, fuel reduction, maintenance of fire return interval, meeting acreage quotas, reduce pests/pathogens, restoration, site preparation, wildland urban interface, wildlife habitat, other/fill in the blank). Further questions asked how prescribed fire use had changed over time, and to determine drivers of these changes, respondents were asked to rank the importance of a number of potential institutional (i.e., not including weather) explanatory factors.
The final section concerned the relationship between prescribed fire and wildfire. The survey asked how often recently-burned areas were useful in initial-attack efforts given a range of time-since-burn. Next, the survey assessed how long prescribed fire was effective in reducing wildfire risk and attenuating wildfire behavior/severity in the dominant vegetation type. Additional questions addressed whether respondents noticed a change in fire behavior variables where a wildfire occurred in an area that had been subjected to a prescribed burn; and whether a difference was noticed in the suppression complexity and resources required for wildfires. The final set of questions documented demographic information. A general comments section was also provided.
2.3. Data Analysis
This survey consisted of a sample of self-identified prescribed fire practitioners from the southern U.S. In some cases, to make comparisons when sample sizes for particular agencies was below 10 individuals, agencies were aggregated to Federal (i.e., National Park Service, United States Forest Service, United States Fish and Wildlife Service, Department of Defense), State (i.e., State Forest Service, State Water Management District, State Fish and Wildlife Service, Department of Environmental Protection), Local (County Extension, County Fire and Resource Management), and Private (non-commercial, commercial, and contractor). Because not every question was answered by every respondent, data are presented as percent of respondents per question, to illustrate patterns, trends, and discrepancies amongst categories like agency and state. Where sample sizes were above n = 30, data were analyzed for significant differences using Chi-square goodness-of-fit tests. To determine potential relationships between continuous data and categorical data, ANOVA was used (e.g. the relationship between a respondent’s age and whether prescribed fire use was increasing, decreasing, or remained the same).
3. Results
Of 2800 Southern Fire Exchange list serve members who were invited to take the survey, a total of 523 fire practitioners and land managers from the southern U.S. initiated the survey, and 80% of this group completed all 25 survey questions. The rate of response was 19%, with 5785 cumulative years of experience represented by the surveyed population. Responses varied across state, by agency/employer, and by predominant vegetation type managed. Average experience using prescribed fire was 20 years, and number of years of experience was not significantly correlated to differences in responses. Overall, most respondents (75%) were employed by public agencies such as State or Federal forest or wildlife agencies, with the remainder being commercial or noncommercial private landowners or contractors (Table 1). The U.S. Forest Service (USFS) had the highest total number of respondents (n = 66). The most responses by state were from Florida (n = 147), followed by North Carolina (n = 78) and Georgia (n = 38; Table 1). Most respondents had either a Bachelor’s degree or a Master’s degree (Table 1), and identified as a Natural Resource Manager (Table 1). Results from Arkansas, Virginia, Tennessee, and Kentucky were lower than those from other states (n < 15). Similarly, responses aggregated to the “county” level were limited by low sample sizes.

Table 1.
Demographics (number of respondents) of survey population, including state where employed, employer, job title, and level of education.
| *Agency (366) | Count | State (405) | Count |
|---|---|---|---|
| USFS | 66 | Florida | 147 |
| State Forestry Agency | 57 | North Carolina | 73 |
| Other Agency | 54 | Georgia | 38 |
| State Fish & Wildlife | 51 | South Carolina | 30 |
| Private, non-commercial | 31 | Alabama | 29 |
| Private, contractor | 27 | Mississippi | 23 |
| Private, commercial | 25 | Texas | 16 |
| NGO | 23 | Louisiana | 15 |
| USFWS | 18 | Arkansas | 10 |
| NPS | 17 | Virginia | 10 |
| DEP | 16 | Tennessee | 9 |
| DoD | 15 | Kentucky | 5 |
| County Fire | 10 | ||
| State Water Mgmt Dist. | 8 | ||
| County Extension | 2 | ||
| Highest Education (414) | Count | Job Title (353) | Count |
| Bachelors degree | 181 | Natural Resource Manager | 165 |
| Masters degree | 100 | Other Position | 72 |
| A.A. degree | 39 | Fire Management Officer | 68 |
| Some college | 28 | Prescribed Fire Burn Boss | 59 |
| Doctorate | 12 | Ranger | 16 |
| High school diploma | 11 | Technician | 14 |
| Some high school | 0 | Educator | 6 |
| Engine Boss/ Operator | 2 | ||
| Firefighter | 1 |
*Abbreviations are as follows: USFS is U.S. Forest Service; NGO is non-governmental organization; USFWS is U.S. Fish and Wildlife Service; NPS is National Park Service; DEP is Department of Environmental Protection; DoD is Department of Defense.
3.1. Reasons for Burning
Based on percentage of respondents who answered the question, fuels reduction was the primary goal of prescribed burning in nearly all pine-dominated ecosystems, while in TN, AR, and KY burning in oak-dominated or oak-pine/hickory mixed habitats was aimed at restoration, wildlife habitat, or fuels reduction (Table 2). Most frequently chosen reasons for prescribed fire use differed across management entities. “Fuels Reduction” was the most frequent response for federal, state, county, private non-commercial, and private contractor prescribed fire users, while non-governmental organizations (NGOs) chose “Restoration” and private commercial landowners selected “Control Competition” (Table 3).
3.2. Trends in Area Burned Over Time and Impediments to Burning
Most managers at the state level identified burning 405 or more hectares annually (Table 2). Federal agencies (i.e., USFS, U.S. Fish and Wildlife Service (USFWS), National Park Service (NPS)) reported annual prescribed fire hectares greater than those reported by state or local agencies (Table 2). Respondents who were responsible for properties over 40,470 hectares burned a range of area per year, usually over 4047 hectares. Private non-commercial and commercial fire practitioners reported burning less than 40.5 hectares annually, while private contractors reported burning 203–405 hectares annually (Table 2). Federal agency respondents reported burning a higher percentage of total hectares managed than state forestry or water management districts (25.9% vs. 14.4% and 12.5%, respectively), while respondents falling under the three “Private” categories reported burning the lowest percentage (6.1%).
Table 2.
Summary of most frequently chosen response by state for prescribed burning objectives, impediments, hectares burned, and primary vegetation community managed.
| Ha year−1 prescribed burned/individual | Primary community managed with prescribed fire | Primary objective of prescribed fire | Top reasons of reported decline in prescribed fire | |
|---|---|---|---|---|
| AL | 405–4046 | Loblolly/Shortleaf | Fuels Reduction | Staffing |
| AR | 4047–12,140 | Loblolly/Shortleaf & Oak-Pine* | Restoration/Wildlife Habitat* | Budget |
| FL | 4047–12,140 | Longleaf Sandhill | Fuels Reduction | Staffing |
| GA | 41–203 | Longleaf/Slash Pine Uplands | Fuels Reduction | Liability |
| KY | 4047–12,140 | Oak-Hickory | Restoration | Budget |
| LA | 405–4046 | Longleaf/Slash Pine Flatwoods | Fuels Reduction | Liability/Staffing |
| MS | 405–4046 | Longleaf/Slash Pine Uplands | Fuels Reduction | Liability/WUI* |
| NC | 405–4046 | Loblolly/Shortleaf | Fuels Reduction | WUI |
| SC | 405–4046 | Loblolly/Shortleaf | Control Competition | Liability |
| TN | 0–40 | Oak-Pine | Wildlife Habitat/Restoration* | Staffing |
| TX | 405–4046 | Loblolly/Shortleaf | Fuels Reduction | Regulations |
| VA | 405–4046 | Oak-Hickory | Fuels Reduction | Staffing |
Note: *Rank results were equal. “Federal” includes U.S. Forest Service, U.S. Fish and Wildlife Service, Department of Defense, and the National Park Service; “State” includes State Forestry, State Fish and Wildlife Service, Water Management Districts, and State Dept. of Environmental Protection; Hectares per year burned are individual responses, representing the average number of hectares for which each respondent is involved in managing, planning, or conducting prescribed burns; Scientific nomenclature for common names in table is as follows: longleaf pine (Pinus palustris Mill.), loblolly pine (P. taeda L.), slash pine (P. elliottii Engelm.), shortleaf pine (P. echinata Mill.), oak includes various Quercus spp., hickory includes various Carya spp.
Table 3.
Summary of most frequently chosen response by land management entity/employer.
| Entity | Hectares year−1 prescribed burned/individual | Primary community managed with prescribed fire | Primary objective of prescribed fire |
|---|---|---|---|
| DEP | 405–4046 | Longleaf/Slash Pine Flatwoods | Restoration/Maintenance of fire (tie) |
| DoD | 405–4046 | Longleaf Sandhill | Fuels Reduction |
| USFS | 4047–12,140 | Oak-Pine/Longleaf/Slash Pine Flatwoods | Fuels Reduction |
| USFWS | 405–4046 | Longleaf/Slash Pine Flatwoods | Fuels Reduction |
| NGO | 4047–12,140 | Longleaf/Slash Pine Uplands | Restoration |
| NPS | 12,141–24,281 | Highly variable | Fuels reduction |
| State FWS | 405–4046 | Longleaf/Slash Pine Flatwoods | Wildlife habitat |
| State FS | 405–4046 | Longleaf/Slash Pine Flatwoods | Fuels Reduction |
| Private, Commercial | 0–40 | Loblolly/Shortleaf | Control Competition |
| Private, Non-Commercial | 0–40 | Loblolly/Shortleaf | Fuels Reduction |
| Private, Contractor | 202–404 | Longleaf/Slash Pine Flatwoods | Fuels Reduction |
At the state level, respondents indicated that prescribed fire use either increased or stayed the same over the last five years, with the notable exception of Mississippi, where roughly equal numbers of respondents identified decreases, increases, or no change (Figure 1a). When responding to decadal trends, managers were more likely to report increases in prescribed fire use across all states except Louisiana (Figure 1a). More federal, NGO, and private managers reported increases in fire use over the last decade than in the last five years, while the same number of State agency practitioners felt fire use had increased regardless of time period (Figure 1b). Private managers were more likely to report decreases than the other management entities (Figure 1b). Overall, most respondents (60%) reported that their use of prescribed fire is greater now compared to 10 years ago, while 21% indicated that it remained constant and 17% reported a decrease in the past decade.
The reported causes of reductions in prescribed fire use varied between employers/agency and state. North Carolina and Mississippi both identified wildland-urban interface (WUI) as limiting prescribed fire use; no other states or agencies noted this as a most frequently chosen limitation (Table 2). Among agencies, the most frequently chosen reason for reduction in prescribed fire use was either “budget” or “staffing”; however “WUI” was also a top consideration for state forestry and Dept. Environmental Protection respondents (Figure 2). Federal agencies were more likely to report “budget” as the primary limitation, which varies from all other agencies/employers. Every management entity/employer identified “staffing” as one of the top three issues responsible for any perceived decline in prescribed fire use (Figure 2). Only respondents identifying in one of the three “Private” landowner/manager categories listed “Liability” as their top perceived reason for any declines in fire use (Figure 2).
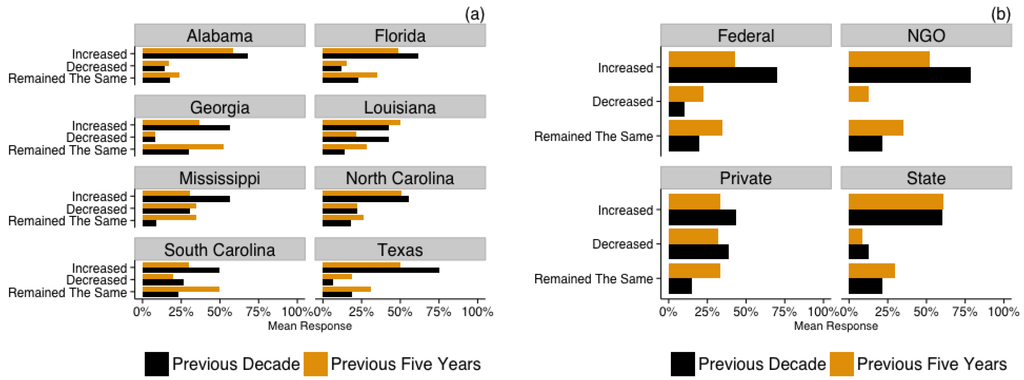
Figure 1.
Average response percent for perceived change in prescribed fire use during the previous decade and previous five years by state (a) and land management entity/type (b).
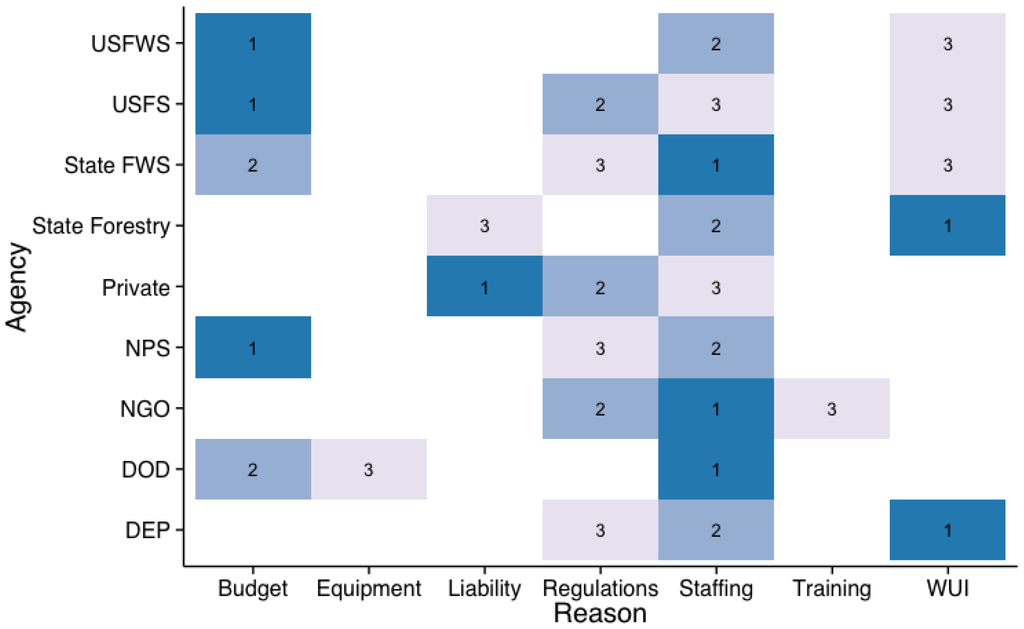
Figure 2.
Ranking of perceived non-weather impediments to the use of prescribed fire by most well-represented land management entity (1 is the highest, or most important, ranking). Note: Categories with fewer than 15 respondents were not included.
3.3. Fire Return Intervals and Wildland Fire Use
Actual (as achieved by respondents) and targeted (i.e., what respondents considered “historical” or “natural”) fire return intervals were assessed by community type based on respondents who self-identified working in those community types (Figure 3). Targeted fire return intervals varied by community type, and actual fire return intervals that exceeded the targeted fire return intervals were reported for some communities (i.e., scrub, pocosin). Somewhat surprisingly, in only half of the total ecosystems did a majority of respondents agree about the “target” fire return interval (Figure 2). These ecosystems included those dominated by longleaf (Pinus palustris Mill.), loblolly (P. taeda L.), or slash pine (P. elliottii Engelm.), and dry and wet prairies. Variability in perceived target fire return intervals was greatest in systems with a significant angiosperm component. Only in pine dominated ecosystems did a majority of respondents report that the chosen target return interval matched actual burn intervals.
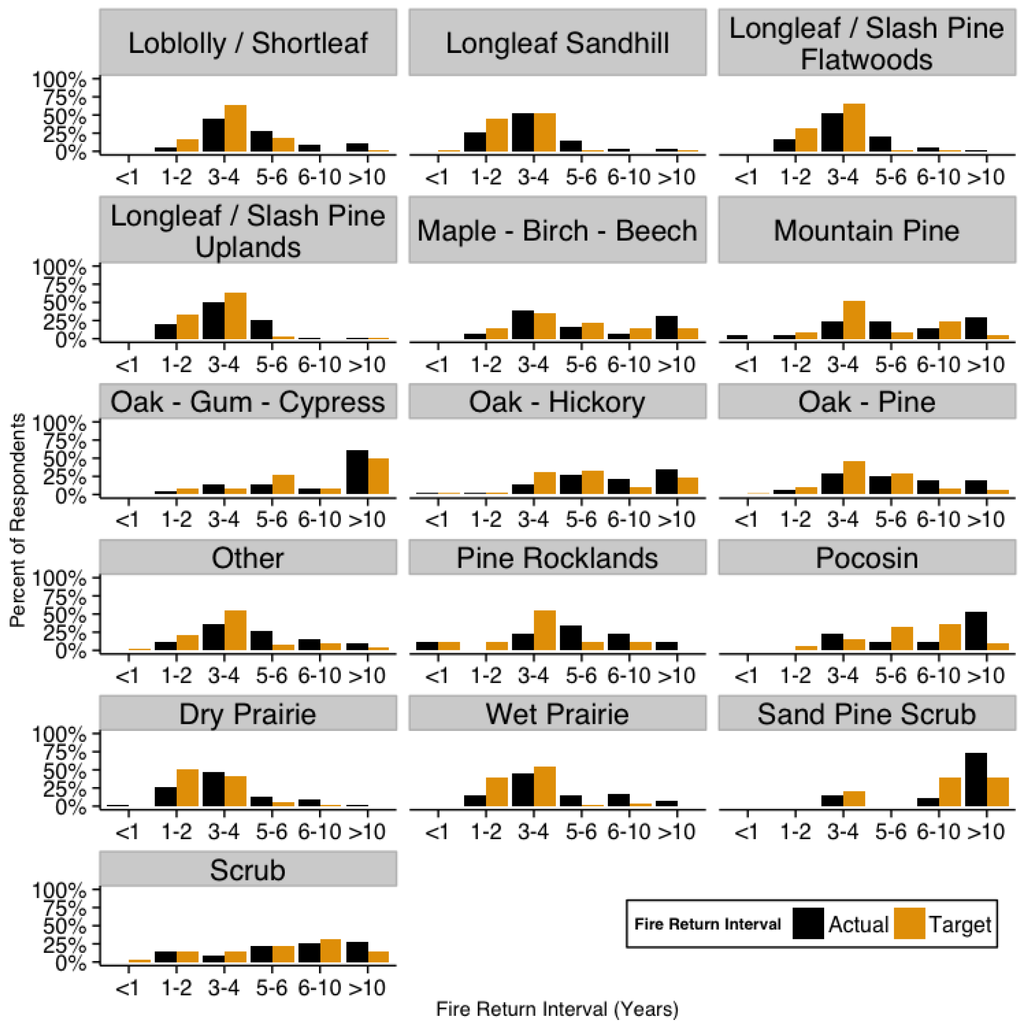
Figure 3.
Targeted vs. actual reported fire return intervals by community type, including all responses regardless of state or agency.
The management and use of wildfires for resource benefit [21] was not a frequently reported activity. The majority (56%) of respondents reported utilizing wildland fire use for less than 10% of wildfires, and that presence of nearby, recent prescribed burns “infrequently” or “never” affected whether wildland fire use was employed.
3.4. Prescribed Fire’s Effects on Wildfire Ignitions and Severity
Respondents considered prescribed fire to have a longer-term impact on wildfire behavior than on reduction of ignitions. The highest percentage of respondents reported that prescribed fire was effective in reducing wildfire ignitions within 1−2 years post-fire, with steadily decreasing effectiveness with time-since-burn (Figure 4). After seven years post-fire, less than three percent of respondents reported prescribed fire effectiveness in reducing wildfire ignitions or behavior. More respondents chose 2−3 years or 3−4 years over 1−2 years as the perceived longevity of effective reduction in wildfire behavior across all vegetation types (Figure 4). After five years, less than 10% of respondents reported a lasting effect of prescribed fire on wildfire behavior or ignitions. When vegetation types were analyzed independently, only maple/birch/beech, scrub, and sand pine had 5%−10% of respondents chose “7−10” years as the length of effectiveness in reducing ignitions. As this example illustrates, longevity of effectiveness was strongly correlated to individual vegetation type fire target return intervals (R2 = 0.77 and 0.74 for reducing wildfire behavior and ignitions, respectively; p < 0.01).
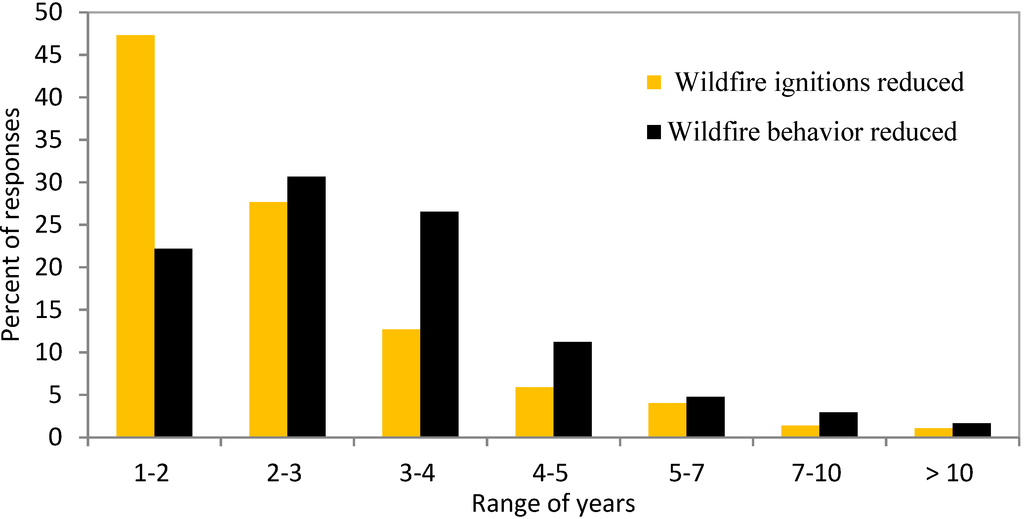
Figure 4.
Overall response rates depicting the role of prescribed fire in reducing wildfire ignitions or wildfire behavior (rate of spread, flame length, area burned) as a function of years since the most recent prescribed burn was conducted for a given area. Unequal categories were used because burn programs typically include the given ranges of years rather than exact intervals.
Where wildfires overlapped recently (within 3 years) prescribed burned locations, >60% of respondents reported “some” or “major” decreases in fire behavior and effects (Figure 5). Of all the fire effects surveyed, overstory tree mortality was identified by the largest percentage of respondents as the fire effect subject to “major” reduction due to recent prescribed fire (Figure 5). “Fuels consumption” was least affected by recent prescribed fires, and nearly 10% of respondents reported “some increase” in fuels consumption in recently burned areas, perhaps reflective of how frequently burned areas tend to promote fine fuels, open canopies, and potentially result in elevated fuel availability due to drying (Figure 4). Over 83% of respondents believed that flame length was reduced, which has relevance for crew safety during wildfire suppression.
Respondents reported that the cost and complexity of wildfire suppression decreased when an ignition occurred in an area managed with prescribed fire, specifically if the desired fire return interval was being met as part of the management burn program (Figure 6). When the desired fire return interval was exceeded, the majority of managers reported some or major increases in suppression cost, number of personnel needed, amount/complexity of equipment needed, and the duration of wildfire event (Figure 6). These relative increases or decreases were independent of the desired fire return interval or the vegetation type managed. Respondents also indicated that areas which had received prescribed burns in the years leading up to a wildfire were more likely to be utilized as part of an initial-attack strategy.
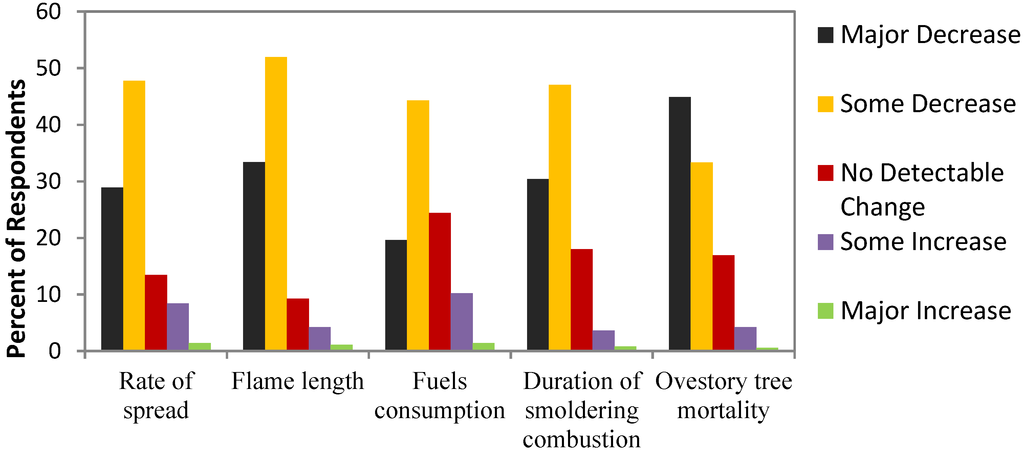
Figure 5.
Response rates answering the question, “Where a wildfire has occurred in a recently burned area (1–3 years), how have the following fire behavior variables and fire effects been changed (if at all)?”
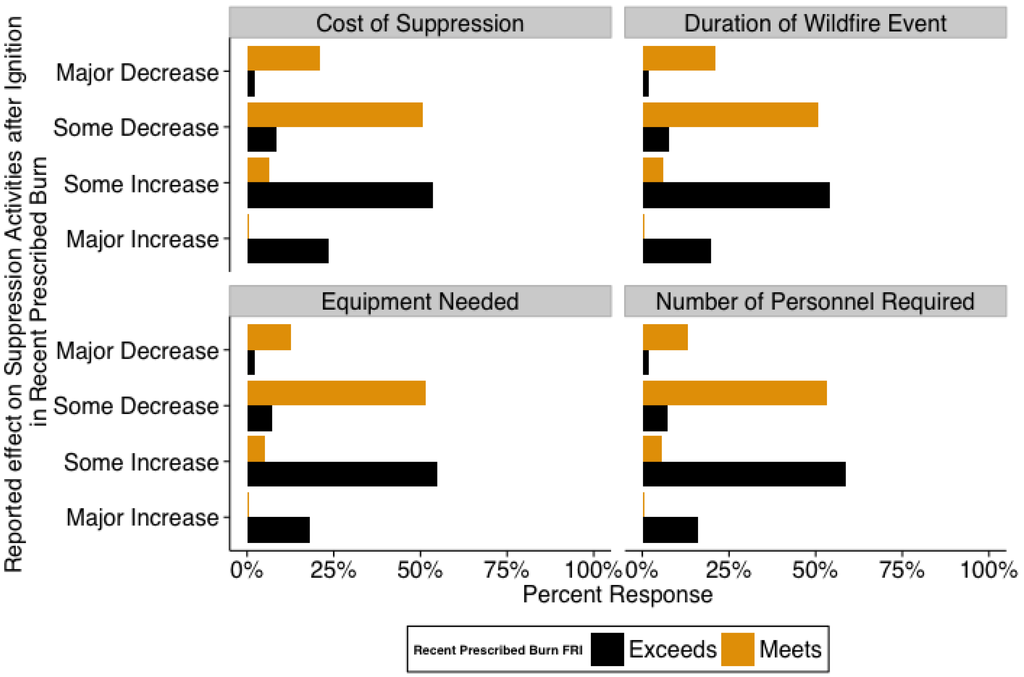
Figure 6.
Manager reported impact of deviation from desired fire return interval on wildfire suppression costs and complexity. Black bars show responses where prescribed burn interval has exceeded (i.e., not met) the desired return interval; yellow bars show responses for wildfires occurring where desired prescribed burn intervals had been maintained.
4. Discussion
This research was aimed at capturing the depth and breadth of primary knowledge of prescribed fire trends and effectiveness in the southern U.S., rather than relying on individual persons to act as representatives for their landowner type/agency. The results highlight the most frequently chosen responses to questions in an attempt to characterize a diversity of practitioner perspectives. In some cases, majority responses were not clearly identifiable, and conclusions could not be drawn. In addition, disproportionate responses across states should be considered when interpreting results-Florida, North Carolina, and Georgia responses comprised more than half of the total respondents. Although sample sizes were below 30 people in some of the states, these numbers still compare favorably with existing studies.
4.1. Trends in Prescribed Fire Use
Longer term trends in prescribed burning in the Southern Region can be evaluated by comparing results with the Haines et al. survey, which assessed burning in the Region for the years 1985–1994 to show that 14% of respondents believed fire use was increasing in state and private forests, compared to 71% in national forests [18]. Exceeding trends reported for 1985–1994, in this study over 30% and over 60% of respondents felt that prescribed fire use was increasing over the last 5–10 years in private and state ownerships, respectively. Our results for federal land managers were similar to those from Haines et al. with regards to the last decade (over 70%), but less than 50% felt that burning had increased over the last five years [18]. Together these data suggest that on federal lands especially, increases in prescribed burning are attenuating over time. In this study as well as in Haines et al. [18] a greater percentage of private land managers reported a decrease in hectares burned than did federal lands personnel. These differences may be related to growing populations and associated development and growth of the WUI. From 1990 to 2000, the Region’s population grew 13.9 percent and total population now makes up 32.5 percent of the national total [22]. This trend is unlikely to change, as projections for 2000 to 2020 estimate that population growth in the southern U.S. will increase by 23.8 million to total almost 114 million people by 2020 [23].
Compared to 3% in the western U.S., 26% of the southern U.S. land area is considered WUI, with 45% of homes located in WUI and predicted increases of 4.6 million housing units in the southern U.S. by 2030 [24]. Concerns about fire use in the WUI likely affect state and private entities more than federal managers, as state and private management units are much smaller on average and are therefore more likely to border private lands and smoke sensitive features like hospitals and highways. For example, a private non-commercial fire manager from North Carolina reflected a common sentiment (as captured by the comments section of the survey): “Control burns are vital to our management of our properties. It is getting increasingly harder and harder to burn because of urban migration and having to play the wind directions constantly to avoid neighbor complaints.” In contrast, federal managers are generally burning within larger land management units, where potential negative effects of prescribed fire may be more insulated from the more distant borders. Availability of personnel and equipment, liability concerns, and a greater emphasis on using herbicides or mechanical treatments to control fuels were also cited reasons for reductions in prescribed fire use amongst private land managers.
At the state level, the 2012 National Coalition of Prescribed Fire Council report showed Alabama, Mississippi, and Louisiana as “trending down” in number of hectares prescribed burned annually, with other states in the Region either increasing or staying the same [5]. Our respondents from Mississippi also reported significant decreases in hectares burned over the last five years, which may be associated with a limited state program for supporting for prescribed burning activities. The rapidly changing land use and demographics of the most rural of the 48 contiguous states may be an additional factor causing changes to prescribed fire use in Mississippi. Rapid settlement of exurban areas following Hurricane Katrina resulted in new residents whose expectations concerning fire may not match those of rural residents only a decade prior, while adding far greater vehicular traffic and potential for negative smoke impacts than in recent prior years. The reality of WUI and exurbanization’s influence on prescribed burning is captured by a fire manager from Mississippi: “The risk of using prescribed fire has just grown exponentially. You can be totally within the prescription, do everything 100 percent right, and then 12 hours later have a smoke-related incident because we have an increase in traffic we didn’t have 10–20 years ago” [23].
4.2. Impediments to Prescribed Fire Use
The Coalition of Prescribed Fire Council study identified “Capacity” as the primary limiting factor for prescribed fire use in the southern U.S., followed by liability and air quality/smoke management [5]. Also based on state agency officials’ responses, Haines et al. reported public opinion and liability as leading barriers to increased burning for state and private forests in the southern U.S. [18], in contrast to air quality/smoke and shortage of personnel at the federal level. Our survey results identified staffing and budget as the top reported factors limiting prescribed fire use overall; these responses are akin to “capacity” as reported by Melvin [5]. However, the variation in responses in this survey proves informative. Unlike Haines et al. [18] and Melvin [5], liability ranked third for state forestry personnel, while WUI, staffing, and budget were more frequently chosen and state wildlife personnel did not identify liability as a major impediment. Haines [18] grouped state and private forests, which may be why liability ranked so high. This observation is similar to our assessment of private land managers, as well as county-level managers, who both cited liability as the top impediment. Often, county land managers cooperate with private contractors for prescribed burning; this concern may be reflective of that partnership, as private entities are more susceptible to the economic challenges of protecting their liability during prescribed burning.
Results from this study and from those of Haines et al. [18] suggest that concerns regarding capacity (e.g. staffing, budget) have increased over the last 20 years. This may be due to state initiatives like Florida Forever and Preservation 2000, wherein monies were legislated for extensive land acquisition (e.g. 1 million hectares in the last decade) without commensurate increases in staffing for management of newly acquired lands. In the 2001 report, cost, funding, and personnel ranked far lower than public opinion and liability as state impediments [18]. Other differences may also be linked to state-specific characteristics. For example, fire practitioners in North Carolina, which has been identified as having the largest land area of wildland-urban interface in the region (WUI; [25]) identified the WUI as their primary limitation. “Regulations” was the top response in Texas, which may be related to the requirement (unique in the region) that anyone wishing to become a certified prescribed burn manager must purchase individual prescribed burning liability insurance coverage [26].
Georgia, Louisiana, Mississippi, and South Carolina identified liability as the top impediment to burning, supporting the 2001 assessment of the region by Haines et al.—despite each having state certified prescribed burn manager programs linked to state laws that provide at least some liability protection for certified burners [27]. Both Georgia and Florida afford certified burn managers gross negligence protection, whereby certified burn managers using prescribed fire are protected against liability unless gross negligence (demonstrating blatant disregard for life or property) can be unequivocally proven [26,27]. These are arguably some of the strongest legislative protections for prescribed fire users in the world, yet Georgia respondents still chose liability as the leading factor in reduced prescribed fire use. This might be reflective of the greater proportion of burning that is done by private entities (either private landowners or NGOs) in these states. For example, much of the prescribed burning in Georgia is conducted by private individuals, not state/federal agency personnel [28] while burning is more evenly distributed across landowner types in Florida (unpublished data). While agency personnel would have their court costs covered by their agency’s liability protection, private prescribed fire practitioners may cite liability as a major impediment because it can add expense and thus reduce the attractiveness of choosing fire over other fuels reduction techniques. Georgia and Florida statutes protecting prescribed burner liability were the first in the country, originally established in 1992 and 1990, respectively, and familiarity with fire laws and continued education are requisite components of the certification program. Still, liability ranked third in Florida, suggesting that knowledge of significant legal protection may not alleviate all prescribed burn practitioners’ concerns. Regardless of verdict, being subjected to a legal challenge can be costly to any individual. Even though over 99% of prescribed fires do not escape [29], landowners appear to remain concerned about this potential.
Insight into these results can be gleaned from a comparison with other regions of the U.S. In a recent survey of 70 fire managers in California, private lands managers ranked liability third of 13 possible constraints, compared to ninth for the public land managers [19]. As these authors argued, the differences between the two regions’ land ownership and distribution are both likely relevant. In the southern U.S., roughly 86% of forest land is held in private ownership, as compared to 33% along the Pacific Coast [30]. With average parcel sizes under 20 hectares for most of the southern states [30], prescribed burning is likely to border other private lands, population centers, and infrastructure including roadways, hospitals, schools, and airports. Prescribed burns on large, public lands areas in the Pacific region may be more buffered from public scrutiny, as well as direct impacts on major population centers and infrastructure. Recent prescribed fire smoke-related accidents on southern interstate highways (e.g. the 2000 Interstate-10 superfog event, killing five [31]; the 2008 Interstate 4 pileup, causing four fatalities and more than 20 hospitalizations; as well as the Interstate 75 pileup in 2012 causing 10 fatalities and 20 hospitalizations [32]) have inevitably increased managers’ concerns regarding liability related to prescribed fire use, regardless of how protective existing laws may be.
4.3. Prescribed Fire Effects on Wildfire
Although a number of respondents emphasized the importance of weather as an overriding factor in their comments, responses across land management entities and states indicated a consistent belief that prescribed fire was effective in reducing both the occurrence and severity of wildfire. As described by a USFS Ranger from Virginia, “Prescribed fire when introduced at the proper fire entry interval creates situations that reduce wildfire intensity…more defensible wildfire control lines, and lower intensity prescribed burns in the future.” Some respondents had quantitative examples specific to the areas they manage, including a Department of Defense Fire Manager from Georgia who reported, “As annual prescribed fire hectares have increased from approximately 3035 hectares in 1985 to 12,140 hectares today, the number of wildfires has decreased from over 202 to less than 41 annually. This relationship is presumably a result of fuel load reduction brought about by prescribed fire.” In contrast, as a state fish and wildlife agency manager from Florida stated, the benefits of prescribed burning may be most evident when wildfire burns in areas without an active burn program: “Rx fire is very useful in preventing destructive wildfires, which generally only occur in areas that have not been Rx burned (many examples…lightning fires go out by themselves in burned areas, or are long-lived and destructive in unburned areas).”
Still, respondents reached consensus that the benefits of burning are relatively short-lived, a characteristic which is also reflected by empirical studies in the published literature (e.g. [11,15]). In vegetation communities with longer manager-identified fire-return intervals, prescribed fire-induced reductions in wildfire ignition and severity were also longer, suggesting that fuel recovery takes longer in these systems (e.g. oak-gum-cypress, scrub, sand pine). However, in all vegetation types, managers reported the effectiveness of prescribed fire in reducing wildfire as shorter than the target fire return interval, and reduction of ignitions was even shorter than that of behavior. In other words, under conducive weather conditions, southern vegetation communities are susceptible to wildfires even if the target fire return interval is being met. Although managers also reported that suppression complexity was reduced and costs were lower where desired fire return intervals were achieved, weather may have an overriding effect on these factors as well. A Florida National Park Service land manager explained: “In extreme [weather] years (such as 2011) I’m not sure prescribed fire is effective…Several incident management teams were mobilized to suppress fires that occurred in 1–3 year rough. They spent 10 times the amount on the suppression as they did on the fuels treatments in areas they recently burned. In this case prescribed fire (and lots of it) didn’t reduce wildfire. In fact it likely increased it because of the increased fine fuels.”
Yet given the occurrence of a wildfire in a recently burned area, more than 75% of respondents reported some or major decreases in overstory tree mortality, duration of smoldering combustion, flame length, and rates of spread. The only empirical study to address any of these effects, (tree mortality), documented a difference in mortality rates even between sites with a 2 vs. 1.5 year time-since-burn [15]. It is clear that time-since-burn is critical, and that prescribed burn managers in the region have a nuanced and tempered view of prescribed fire effectiveness. Together, these results attest to the high flammability of many of these vegetation communities, the guaranteed frequency of ignitions (anthropogenic and lightning-initiated), and the rapid rate of fuel recovery following burning. For example, as a USFS Wildlife Biologist from Alabama explained, “Prescribed fire definitely lowers the intensity of wildfires but in some timber types (longleaf pine), a high prescribed burn frequency will increase the amount of fine fuels. If you increase the amount of available fine fuels you have a more receptive fuel bed to outside ignition. So you could actually have more fires but they would be of much lower intensity”. These sentiments were reflected in additional comments; this nuance is important and supported by the survey results. Reduced wildfire intensity is presumably linked to the reported decrease in suppression resources and increase in suppression effectiveness. Given that wildfire ignitions are primarily anthropogenic in the southern U.S., and populations and WUI are increasing, it may be that the effects of prescribed fire on reducing wildfire intensity and suppression complexity are not only more evident, but perhaps more dependable than reductions in ignitions.
Wildland fire use [21] implementation and planning appears rare in the states surveyed. We speculate that low implementation of these types of fire use may be the result of high rates of WUI or smaller administrative units when compared to regions with active programs (e.g. Yosemite National Park, CA). Analysis of the 1998 wildfires in Florida found that previous wildfires were more influential on wildfire hectares burned than were prescribed burns, suggesting that this management strategy deserves further consideration [14]. More in depth analysis of wildland fire use in the southern U.S. may improve our understanding of the relevance of this management strategy, which may become an increasingly important consideration if future regulations (e.g. air quality) restrict prescribed fire implementation.
5. Conclusions
Despite the southern U.S. burning more acreage than any other region in the U.S., this is the first regional survey to address these questions using first-hand knowledge about prescribed fire. The public and private fire practitioners who responded to this survey clearly indicated their beliefs that prescribed fire is a critical component of ecosystem management and, in most cases, wildfire behavior mitigation strategies in the southern U.S.. The diminishing attenuation of wildfire risk with increasing time since fire, with the majority of benefits lost beyond five years, is a reflection of the rapid recovery of the majority of vegetation communities and available fuels in this region. For ecosystems with a longer historical fire return interval, it was clear that managers reported beneficial effects of prescribed fire on wildfire behavior and effects to be considerably longer-lived.
Respondents to this survey use prescribed fire more often than they did a decade ago, and a smaller number are burning more now than five years ago. These findings indicate that while prescribed burning is still on the rise, its rate of increase is slowing, more so in certain states. Whether these observations indicate changes that may lead to the decline of prescribed burning is unclear. Certainly, two of the causes identified by managers who have decreased their prescribed burning–budget issues and staffing levels–have been exacerbated in recent years by national economic trends. Cause for tempered optimism is that few respondents identified equipment or experience limitations as causative agents affecting any reductions in burning. Surprisingly, increasing population and wildland-urban interface were listed behind most other factors in most states, perhaps indicating an increasing public acceptance of the role of fire in the ecosystems of the southern U.S., and/or the effectiveness of recent regional public education campaigns communicating the benefits of prescribed burning (e.g. “One Message, Many Voices” campaign in Florida and Georgia).
While studies have linked the use of prescribed fire with reductions in structure loss and wildfire severity (e.g. [15,33]), documenting the effects of prescribed fire on future wildfires should continue given the uncertain future of regulations and the need for increased support if prescribed fire is to remain a major management activity. These results clearly suggest that frequent prescribed burning is essential for reaping the benefits for wildfire risk and severity reduction. Given the reported concerns about liability, especially among private landowners, effective extension of these results to the public may ultimately be the best strategy to ensure a viable future for this fuels reduction and ecosystem maintenance tool.
Acknowledgments
We thank the survey respondents, who put significant time into answering the questions with care and insight. We are grateful to the Joint Fire Science Program’s support of the Southern Fire Exchange, which administered the survey and ensured we reached as many people as possible. The University of Florida’s School of Forest Resources and Conservation is also acknowledged for supporting the graduate degree program of one of the authors. Finally, we thank all prescribed fire managers in the southern U.S., who are among the world’s most successful fire practitioners.
Conflicts of Interest
The authors declare no conflict of interest.
References
- Fowler, C.; Konopik, E. The history of fire in the southern United States. Human Ecol. Rev. 2007, 14, 165–176. [Google Scholar]
- Frost, C.C. Presettlement fire frequency regimes of the United States: A first approximation. In Fire in Ecosystem Management: Shifting the Paradigm from Suppression to Prescription, Proceedings of the 20th Fire Ecology Conference, Tall Timbers Research Station, Tallahassee, FL, USA, 7–10 May 1996; pp. 70–81.
- Outcalt, K.W.; Sheffield, R.M. The longleaf pine forest: Trends and current conditions. In Resource Bulletin SRS-9; USDA Forest Service, Southern Research Station: Asheville, NC, USA, 1996; p. 23. [Google Scholar]
- Ryan, K.C.; Knapp, E.E.; Varner, J.M. Prescribed fire in North American forests and woodlands: History, current practice, and challenges. Front. Ecol. Environ. 2013, 11, 15–24. [Google Scholar] [CrossRef]
- Melvin, M. National prescribed fire use survey report. 2012. Available online: http://www.prescribedfire.net (accessed on 12 August 2014).
- Ecosystems of Florida; Myers, R.L.; Ewel, J.J. (Eds.) University Press of Florida: Gainesville, FL, USA, 1990; p. 765.
- Knapp, E.E.; Estes, B. L.; Skinner, C.N. Ecological Effects of Prescribed Fire Season: A Literature Review and Synthesis for Managers; General Technical Report No. PSW-GTR-224; USDA Forest Service, Pacific Southwest Research Station: Redding, CA, USA, 2009; p. 80.
- Pollet, J.; Omi, P.L. Effect of thinning and prescribed burning on crown fire severity in ponderosa pine forests. Int. J. Wild Fire 2002, 11, 1–10. [Google Scholar] [CrossRef]
- Finney, M.A.; McHugh, C.W.; Grenfell, I.C. Stand and landscape-level effects of prescribed burning on two Arizona wildfires. Can. J. For. Res. 2005, 35, 1714–1722. [Google Scholar] [CrossRef]
- Kobziar, L.N.; Stephens, S.L.; McBride, J.R. The efficacy of fire and fuels reduction treatments in a Sierra Nevada pine plantation. Int. J. Wild Fire 2009, 18, 791–801. [Google Scholar] [CrossRef]
- Malone, S.L.; Kobziar, L.N.; Staudhammer, C.L.; Abd-Elrahman, A. Modeling relationships among 217 fires using remote sensing of burn severity in southern pine forests. Remote Sens. 2011, 3, 2005–2028. [Google Scholar] [CrossRef]
- Koehler, J.T. Prescribed burning: A wildfire prevention tool? FMN 1993, 53, 9–13. [Google Scholar]
- Butry, D.T.; Pye, J.M.; Penstemon, J.P. Prescribed Fire in the Interface: Separating the People from the Trees; General Technical Report SRS-48; USDA Forest Service, Southern Research Station: Asheville, NC, USA, 2002; p. 5.
- Mercer, D.E.; Pye, J.M.; Prestemon, J.P.; Butry, D.T.; Holmes, T.P. Economic Effects of Catastrophic Wildfires; Forestry Sciences Laboratory: Research Triangle Park, NC, USA, 2000; p. 64. [Google Scholar]
- Outcalt, K.W.; Wade, D.D. Fuels management reduces tree mortality from wildfires in southeastern United States. SJAF 2004, 28, 28–34. [Google Scholar]
- Davis, L.S.; Cooper, R.W. How prescribed burning affects wildfire occurrence. J. For. 1963, 61, 915–917. [Google Scholar]
- Picotte, J.J.; Robertson, K.M. Validation of remote sensing of burn severity in southeastern US ecosystems. Int. J. Wild Fire 2011, 20, 453–464. [Google Scholar] [CrossRef]
- Haines, T.K.; Busby, R.L.; Cleaves, D.A. Prescribed burning in the South: Trends, purpose, and barriers. SJAF 2001, 25, 149–153. [Google Scholar]
- Quinn-Davidson, L.N.; Varner, J.M. Impediments to prescribed fire across agency, landscape and manager: An example from northern California. Int. J. Wild Fire 2012, 21, 210–218. [Google Scholar] [CrossRef]
- Dillman, D.A. Mail and internet surveys: The tailored design method. In Mail and Internet Surveys; Wiley: New York, NY, USA, 2000; p. 344. [Google Scholar]
- National Wildfire Coordinating Group. Glossary of Wildland Fire Terminology, PMS 205. National Wildfire Coordinating Group: Boise, ID, USA, 2014. Available online: http://www.nwcg.gov/pms/pubs/glossary/index.html (accessed 5 October 2014). [Google Scholar]
- Census 2000 Gateway; US Department of Commerce; Bureau of the Census. 2001. Available online: http://www.census.gov/main/www/cen2000.html (accessed on 1 September 2014).
- Macie, E.A.; Hermansen, L.A. Human Influences on Forest Ecosystems: the Southern Wildl and Urban Interface Assessment; General Technical Report GTR-SRS-55; USDA Forest Service, Southern Research Station: Asheville, NC, USA, 2002; p. 159.
- Hammer, R.B.; Stewart, S.I.; Radeloff, V.C. Demographic trends, the Wildland-Urban Interface, and wildfire management. Soci. Natur. Res. 2009, 22, 777–782. [Google Scholar] [CrossRef]
- Radeloff, V.C.; Hammer, R.B.; Stewart, S.I.; Fried, J.S.; Holcomb, S.S.; McKeefry, J.F. The wild and urban interface in the United States. Ecol. Appl. 2005, 15, 799–805. [Google Scholar] [CrossRef]
- Sun, C. State statutory reforms and retention of prescribed fire liability laws on US forest land. For. Policy Econ. 2006, 9, 392–402. [Google Scholar] [CrossRef]
- Yoder, J.; Engle, D.; Fuhlendorf, S. Liability, incentives, and prescribed fire for ecosystem management. Front. Ecol. Environ. 2004, 2, 361–366. [Google Scholar] [CrossRef]
- Sorrells, F. Georgia Forestry Commission. Personal Communication, 2015. [Google Scholar]
- Dether, D.; Black, A. Learning from escaped prescribed fires–lessons for high reliability. Fire Manage. Today 2006, 66, 50–56. [Google Scholar]
- Butler, B.J. Family Forest Owners of the United States, 2006; General Technical Report NRS-27; USDA Forest Service, Northern Research Station: Newtown Square, PA, USA, 2008; p. 72.
- Twilley, T. Pileup on fogbound I-10 leaves five dead. In The Sun Herald; Gulf Publishing: Gulfport, MS, USA, 2000; p. 221. [Google Scholar]
- Gainesville Sun. 10 dead in crashes; I-75 temporarily closed Monday morning. 2012. Available online: http://www.gainesville.com/article/20120129/ARTICLES/120129486 (accessed on 5 October 2014).
- Kennedy, M.C.; Johnson, M.C. Fuel treatment prescriptions alter spatial patterns of fire severity around the Wildland-urban interface during the Wallow Fire, Arizona, USA. For. Ecol. Manag. 2014, 318, 122–132. [Google Scholar] [CrossRef]
© 2015 by the authors; licensee MDPI, Basel, Switzerland. This article is an open access article distributed under the terms and conditions of the Creative Commons Attribution license (http://creativecommons.org/licenses/by/4.0/).