1. Introduction
Logging residues currently provide approximately 8 TWh of energy annually for Sweden [
1], and this amount could potentially be doubled [
2,
3]. This represents roughly 6% of the total amount of biofuels used in Sweden in 2012. Extraction of logging residues can be seen as a sustainable system since in today's levels neither threatens species [
4], biodiversity [
5], nutrient balance [
5], nor have a negative exchange with respect to the input energy [
6].
For energy purposes, logging residues can be gathered using several systems, the most common being comminution at landing [
7]. This accounts for roughly 90% of all logging residues harvested in Sweden [
2]. The extraction of logging residues starts with a fuel-adapted logging operation, meaning that the logging residues are placed in small harvester heaps, next to timber and pulpwood. The Swedish Forestry Agency currently recommends that logging residues should be kept in these harvester heaps over one summer, to facilitate drying and defoliation (needle fall-off) [
5], because there is a need to increase the spread of the needles after the extraction of logging residues in order to redistribute nutrients. The logging residues should then be extracted from the forest and stacked in larger windrows at landings. These windrows are often covered with cardboard to prevent precipitation increasing the moisture content [
8]. The logging residues are then stored until they are required at the designated energy-conversion plant. This method is often referred to as the dried-stacked method (dry-stacking).
However, an alternative known as fresh-stacked method (fresh-stacking) has been described by Nilsson
et al. [
9]. In this method, after the fuel-adapted logging operation, the logging residues are forwarded immediately after harvest to the landing, where drying and defoliation occur in windrows, instead of in small harvester heaps. In reality, it is even more difficult since dried-stacked logging residues often are more or less forwarded into a roadside pile earlier than is optimal. This due to, for example, faster regeneration of forest and logistical reasons (that the forwarders route is passing by the clear-felled area).
The moisture content of fresh logging residues is approximately 50%–60% on a fresh weight basis [
10,
11]. When the logging residues are left in small harvester heaps, the moisture content decreases; if stored for a whole summer, the moisture content can be lower than 20%–30% [
12,
13]. However, several studies have shown that the moisture content decreases, even if the logging residues are stored in roadside windrows [
9,
12,
14,
15]. Logging residues stored over a summer, regardless of stacking method, will have a moisture content between 30% and 40% [
9,
16]. Logging residues located in the center parts of the windrows show lower moisture content than the outside parts of the windrow [
17]. However, Nilsson
et.al. [
9] also reported that dried-stacked logging residues are generally somewhat drier than fresh-stacked logging residues, and concluded that differences among clear-felling areas and other variables affect the moisture content more than the extraction and storage method. The moisture content in logging residues is also affected by their particle size distribution, since the fine fractions absorb more moisture than the coarse fractions [
18].
Dry mass losses due to handling are of particular importance and can be affected by diverse factors. For example, Lehtikangas [
19] states that the size of the harvester heaps affects the amount of needle fall-off, which is expected to be considerably lower from large heaps than from smaller heaps. This is due to the greater compaction that occurs in a larger heap, when needles are accumulated in layers.
Some of the logging residues available within a stand will never reach the energy-conversion industry. Some will never even reach the harvester heaps, since some of the branches break off when the trees are felled and when branches are removed. Some of these losses due to the handling of the logging residues contribute to a more expensive fuel. According to Eriksson
et al. [
20], losses later in the supply chain imply a higher cost than early losses during the handling. With reference to a study by Mellström and Thörnlind 1981, Hakkila [
10] reported that in certain cases up to 50% of logging residues cannot be gathered. Nurmi [
21] showed that the 60%–80% of the logging residues can be extracted after harvest, depending on the effectiveness of the fuel adaptation. Peltola
et al. [
22] compared the measured dry weight of logging residues at an energy-conversion plant with the potential weight in the stand, using biomass models. They reported that at least a third of the logging residues remain at the clear-felled area, if stored in harvester heaps during the spring and summertime. Eriksson [
23] showed that 24% to 34% of the total amount of available biomass was left at the clear-felled area when fresh logging residues were forwarded. The time of year and time between harvest and forwarding will also affect how much of the residues will be available for the energy-conversion industry. The longer the logging residues are left at the clear-felling area, the harder it becomes to gather all the material without contamination, due to ground vegetation having time to grow amongst the logging residues [
24].
The defoliation (needle fall off) of logging residues depends on both how the material is handled during different operations, and the weather. In humid weather, the needles will stick to the wood chips and thus accompany the chips to the energy-conversion plant [
25]. Wall and Hytönen [
26] showed that dried-stacked extraction with the needles left on the clear-felled area does not reduce the long-term nutrient capital of the forest floor or the nutritional status of trees.
During storage in harvester heaps over a period of four months, Lehtikangas [
19] found that between 24% and 42% of needles fall off. Filipsson and Nordén [
25] reported that 18%–24% of the needles end up beneath the harvester heaps and 70%–77% in the roadside windrow. Filipsson and Nordén [
25] also found that 0.6%–2.2% of the needles fell off during the normal loading of logging residues, and that active shaking during forwarding increased this proportion to 3.1%–5.5%.
A number of studies performed in Sweden during the 1980s found that the composition of fresh logging residues from Norway spruce (
Picea abies (L.) Karst) was 33%–50% wood, 20%–30% needles, 10%–20% bark, 5%–15% branches and 5%–10% of fines [
27,
28]. After storage Nurmi and Hillebrand [
29] showed, in a study performed in southern Finland, a very low amount of needles, namely 2% in dried-stacked and 4% in fresh-stacked logging residues. Nilsson
et al. [
9] found that logging residues of Norway spruce in Southern Sweden have a needle content of 4% in dried-stacked and 8% in the fresh-stacked logging residues.
It has been previously thought that the traditional dried-stacked method leaves more needles at the clear-felling area than the fresh-stacked method. If the fresh-stacked method should be accepted, the opportunities for new technologies, reduced costs, shorter lead times, and increased withdrawal of logging residues from each clear-felled area would be possible. The aim of our study was to investigate and compare the traditional dried-stacked, and the fresh-stacked method from clear-felling until comminution at landing, regarding biomass losses (i), moisture content (ii), and fraction composition (iii). Another aim was to provide detailed information about the distribution of logging residues (iv) left in the clear-felled area and amounts of unusable logging residues that end up beneath the roadside windrow with the two systems.
2. Materials and Methods
2.1. The Stand
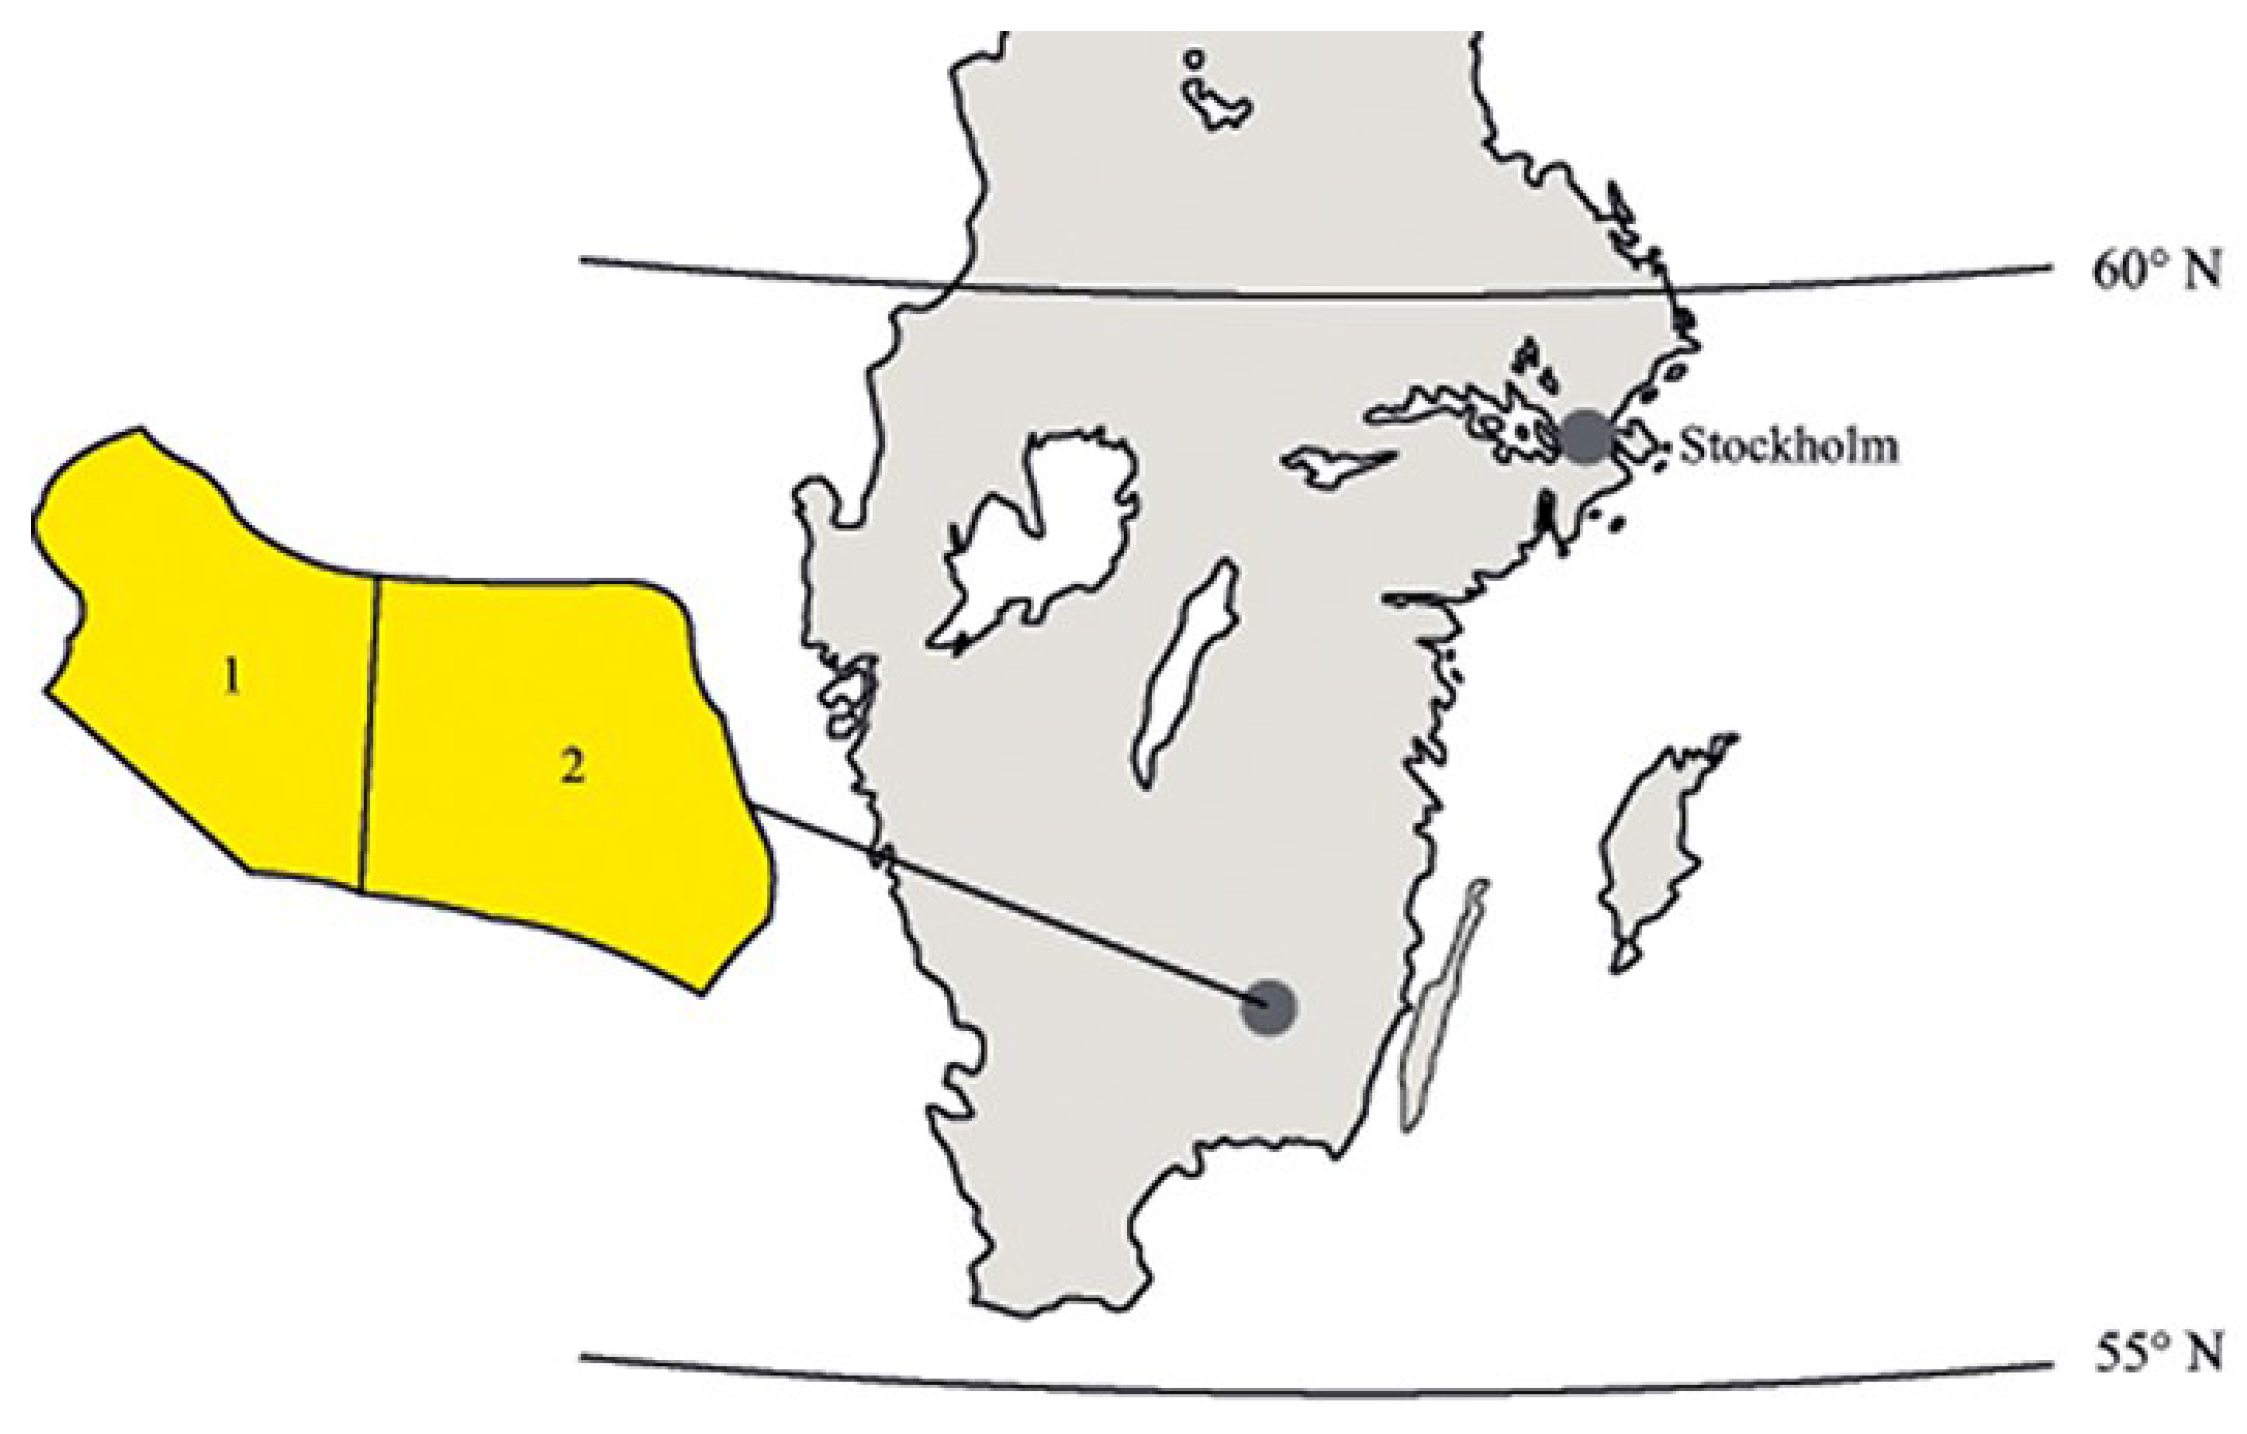
The study was conducted in 2013 in a stand dominated by 88-year-old Norway spruce at Tommeshult, in the municipality of Emmaboda, approximately 40 km east of Växjö (
Figure 1). The driving conditions at the clear-felling area were close to optimal for the machinery, in terms of absence of moist sites. There, none of the logging residues were needed for protecting the ground from rotting.
Visual examination indicated that there was less branch biomass than usual in a clear-felling area, because the crowns were hoisted. An experimental area of approximately one hectare was clear-felled; the site index was 26 (meaning dominant height in meters at 100 years of age). The clear-felled area was divided into two parts (
Figure 1). The logging residues from the western and eastern part were gathered using the fresh- and dried-stacked methods, respectively. The fresh-stacked part was very flat and had an area of 0.43 hectare, with a tree species distribution of 13% Scots pine (
Pinus sylvestris L.), 86% Norway spruce, and 1% broadleaf, mainly birch (
Betula spp.). The total harvested volume was 91 m
3 solid roundwood under bark, from 279 stems. The dried-stacked part had somewhat more broken ground, covered 0.55 hectare, and the tree species distribution was 18% Scots pine and 82% Norway spruce. The total harvested roundwood volume was 111 m
3 solid roundwood under bark, from 384 stems.
Figure 1.
The location of the experimental clear-felled area in southern Sweden, divided into two parts used for the study. Logging residues were fresh-stacked in area 1 and dried-stacked in area 2.
Figure 1.
The location of the experimental clear-felled area in southern Sweden, divided into two parts used for the study. Logging residues were fresh-stacked in area 1 and dried-stacked in area 2.
2.2. Logging Operations
Both parts of the stand were harvested by the same harvester operator in the middle of March 2013 (TR1) with a Rottne H20 final feller (
Table 1). The logging operation was adapted for fuel extraction, and the harvester operator made approximately 30 harvester heaps per hectare. The logging residues from the 13 fresh-stacked harvester heaps were forwarded at the beginning of April 2013 (TR2) with a Timberjack 1410 B, covering 7.7% of the clear-felled area. The logging residues were collected and placed in a fresh-stacked windrow (approximately 20 m long, 5 m wide and 4 m at its highest point) at the roadside. The delay in forwarding was caused by heavy snowfall the day after final felling. Therefore, these logging residues had some time to dry during the time it took for the snow to melt, and the initial moisture content was lower than expected for fresh logging residues.
Table 1.
Time references (TR1–TR5) for the different operations during the procurement of the logging residues (“x” means no activity).
Table 1.
Time references (TR1–TR5) for the different operations during the procurement of the logging residues (“x” means no activity).
| Time Reference | Time | Fresh-Stacked | Dried-Stacked |
|---|
| TR1 | Mar 2013 | Harvested | Harvested |
| TR2 | Apr 2013 | Forwarded and stacked | x |
| TR3 | Sept 2013 | x | Forwarded and stacked |
| TR4 | Sept 2013 | Covered with cardboard | Covered with cardboard |
| TR5 | Nov 2013 | Comminution | Comminution |
The logging residues from the 17 dried-stacked harvester heaps were stored in the harvester heaps (approximately 5 m in diameter and 1.5 m high), covering 7.2% of the clear-felled area. The dried-stacked harvester heaps were placed on permeable tarpaulins to trap all fall-off from the logging residues. The logging residues were then forwarded (by a John Deere 1110D) in the middle of September 2013 (TR3), and during the forwarding, were stacked in a roadside windrow, approximately 25 m long, 5 m wide and 4 m high at its highest point.
When the dried-stacked logging residues had been forwarded, both (the dried- and fresh-stacked) roadside windrows were covered with cardboard to avoid re-moistening after the summer drying (TR4). To allow gathering of most of the fines and needles, the roadside windrows were placed on plastic sheets, arranged in order to allow water from precipitation to drain away. Both windrows had similar locations along the roadside, with similar exposure to sunlight, wind and precipitation. The experiment ended in mid-November 2013 (TR5), when both windrows were comminuted separately by a Jenz Hem 582 chipper, mounted on a Volvo truck.
2.3. Sampling Methodology
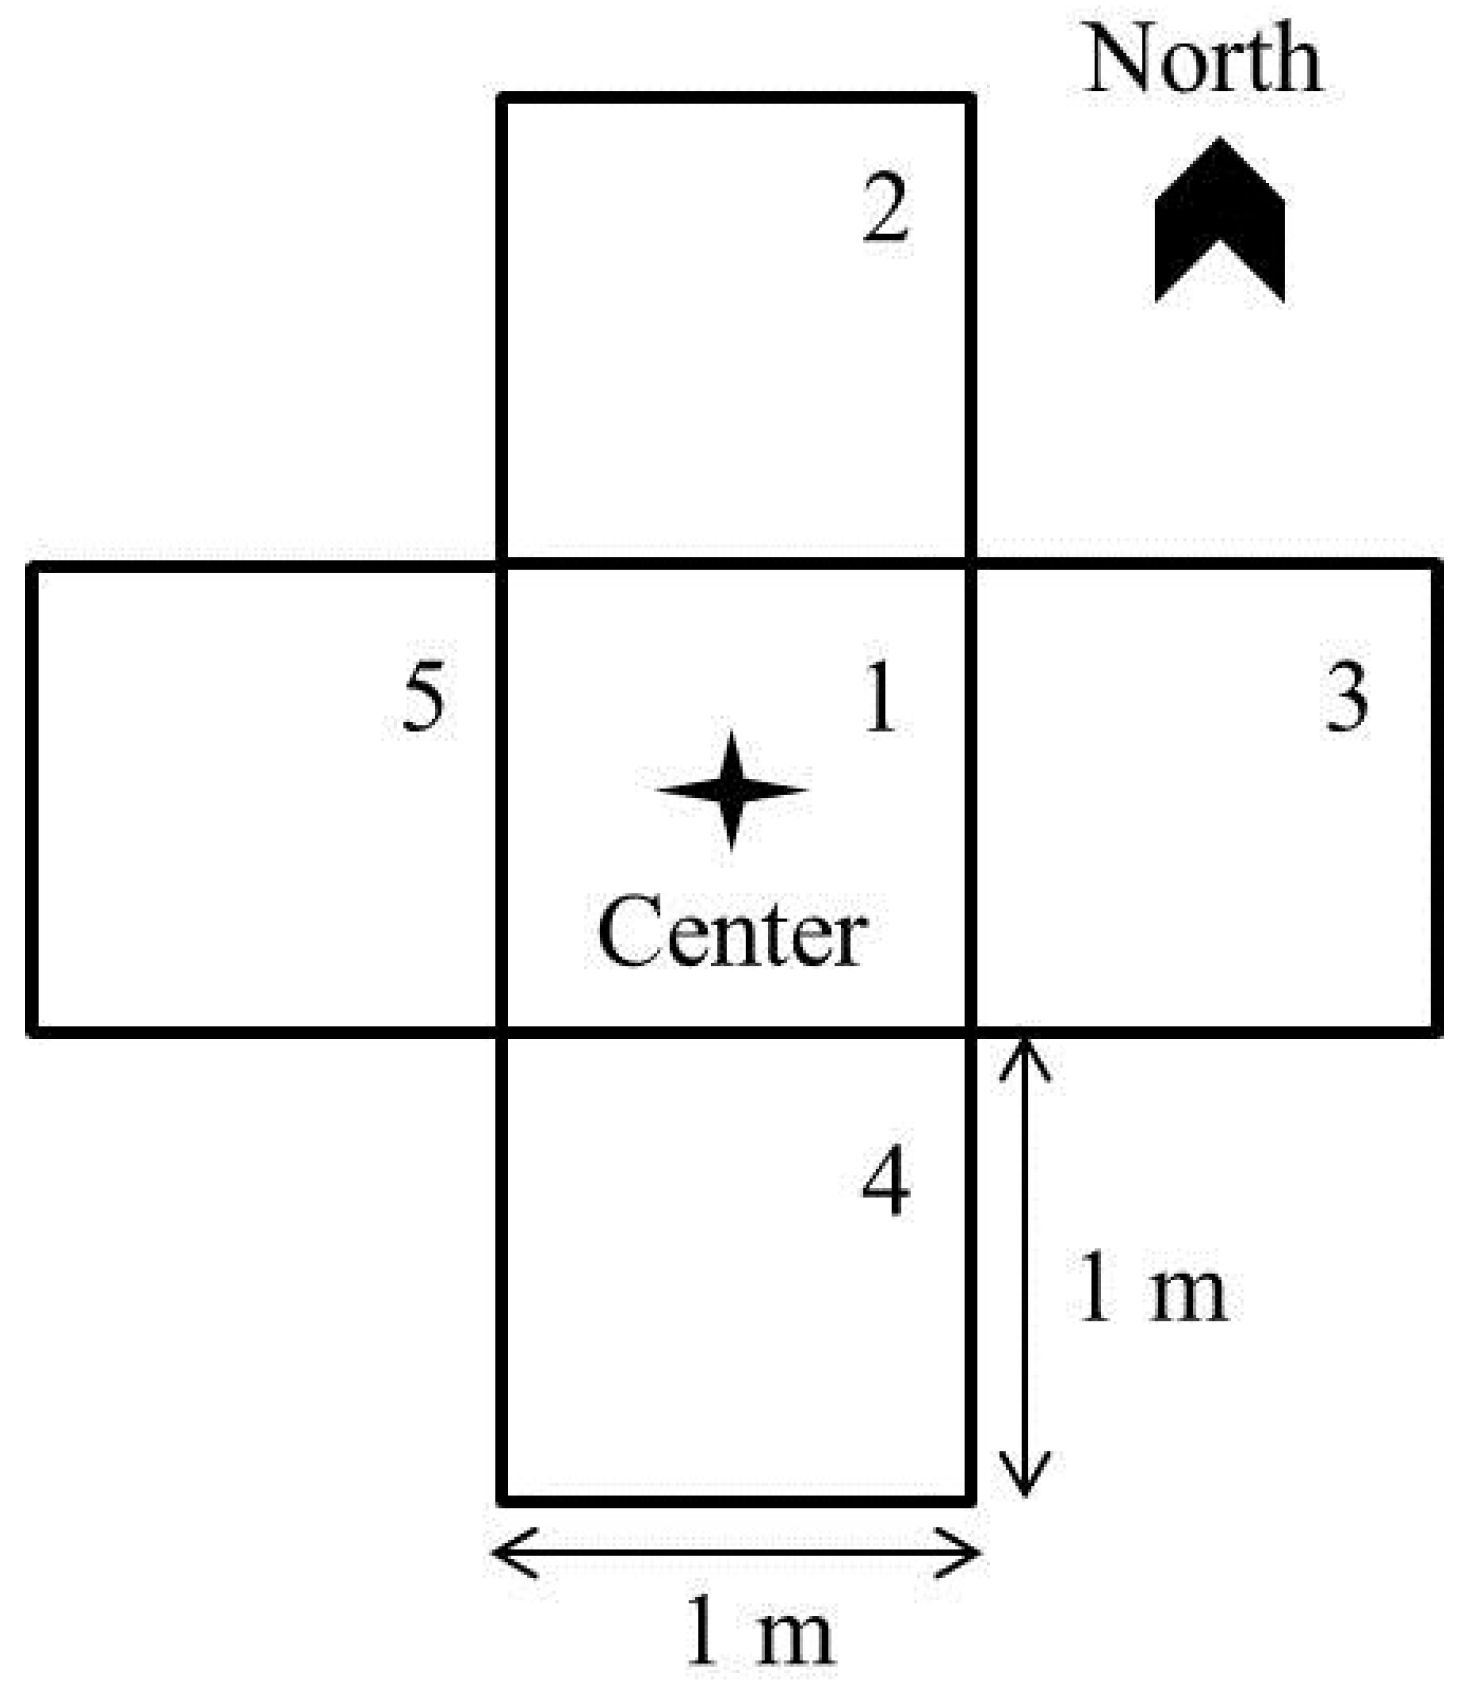
Fifteen sample plots between the harvester heaps were selected in each of the fresh- and dried-stacked parts of the clear-felled area, using a random number generator in Microsoft Office Excel. Each plot was then marked on a map of the clear-felled area and GPS coordinates were used to find each sample plot. Each plot was identified as the center point of a 5 m
2 sample plot (
Figure 2). If a sample plot overlapped an obstacle, for example a harvester heap or another sample plot, the center point was moved in 3 m intervals to the north, until the whole sample plot was free of the obstacle. All logging residues were collected from the entire sample plot. In the dried-stacking site, the sample plots were carefully marked, so that after forwarding, it would be possible to again collect new material that had fallen off with the intention to quantify losses occurred during forwarding. The moisture contents of the logging residues were determined by weighing before and after oven drying at 105 ± 2 °C for 24 h [
30].
Figure 2.
Sample plot pattern used for gathering the logging residues in the clear-felled area and under the harvester heaps.
Figure 2.
Sample plot pattern used for gathering the logging residues in the clear-felled area and under the harvester heaps.
After forwarding the fresh-stacked logging residues in April (TR2), one of the five 1 m
2 sample plots (
Figure 2) was selected at random under each harvester heap; all remaining residues were collected as previously described, and oven-dried to determine their moisture contents. The amount of dried-stacked logging residues left under the harvester heaps was determined in the same way after forwarding in September (TR3).
In November (TR5), when the logging residues had been chipped, the total area of the windrow had increased due to the chip truck’s handling of the residues during comminuting, by approximately 1 m width of the windrow. The logging residues on this increased surface, in terms of dry mass per unit surface area and fraction composition, were estimated to be similar to the logging residues left under the windrow. After chipping, the area under the windrow (including the increased surface area) was divided into a grid of 1 m2 squares. From each windrow, ten of the squares were randomly selected and all logging residues were collected to determine their moisture content and dry mass.
Since the amount of logging residues varied greatly between the investigated sample plots under the windrow, a boxplot was constructed in SPSS (
www.ibm.com) to see if some of the sample plots where outliers and should be excluded from the calculations.
2.4. Moisture Content and Fraction Composition
The moisture content and fraction composition of chipped logging residues were analyzed on four sampling occasions. The first occasion (A) was while forwarding the fresh logging residues in April (TR2), the second (B) while forwarding the dried logging residues in September (TR3), the third (C) after chipping the fresh-stacked windrow in November (TR5), and the fourth (D) after chipping the dried-stacked windrow in November (TR5). On the first two occasions, A and B, the operator of the forwarder was asked to fill a covered car trailer with unchipped logging residues. These logging residues were transported directly to the nearest wood chipper for processing and samples were taken for moisture content and fraction composition determinations. When the logging residues were chipped in November (TR5), samples were taken after the chip truck had unloaded the container at the energy-conversion plant. The sampling method on all four occasions was as follows: five bucket-samples (10 L each) were taken from different positions in the pile of chipped residues. The total volume of 50 L was then placed on a tarpaulin and mixed well before removing five 2 L samples. This procedure was repeated six times for each pile of residues. Thus, in total, 30 samples were gathered on each occasion. After collection, all samples were weighed and oven-dried, in order to calculate the moisture content.
When dried, all 30 samples were bulked into a larger sample. From this large sample, 15 smaller samples of approximately 0.3 L were gathered using a sampling board. The sampling board contained 15 holes, each 120 mm in diameter and equipped with a trapdoor for automatic sampling. Of these samples, five were randomly selected and separated into three different fractions. The fractionation was performed with a chip classifier using screen boxes with mesh sizes of 45, 13, 7 and 3 mm. From the screen boxes and the fines pan, three fractions were manually separated: (1) coarse material (wood, branches, and bark) over 3 mm in diameter; (2) fines less than 3 mm in diameter, and (3) needles. This was repeated on all four sampling occasions.
2.5. Weather Conditions
In order to describe the climatic conditions during the experiment, weather data were collected from SMHI (the Swedish Meteorological and Hydrological Institute) (
Figure 3 and
Figure 4). The weather data used for this study were gathered from weather stations located within 10 km of the clear-felled area. The weather data show monthly precipitation and mean temperatures during the study period, as well as normal average values, based on data for the 30-year period spanning from 1961–1990. Annual average precipitation is approximately 600 mm. During the study (March to November), the periodic average precipitation was 487 mm. The total precipitation during the study period from March to November 2013 was slightly lower at 421 mm.
Figure 3.
Monthly precipitation in mm at the Swedish Meteorological and Hydrological Institute (SMHI) weather stations over the study period (____). The 30-year average values for the same period (1961–1990; -----) are also shown.
Figure 3.
Monthly precipitation in mm at the Swedish Meteorological and Hydrological Institute (SMHI) weather stations over the study period (____). The 30-year average values for the same period (1961–1990; -----) are also shown.
Figure 4.
Average monthly temperature in °C at the SMHI weather stations over the study period (____). The 30-year average values for the same period (1961–1990; -----) are also shown.
Figure 4.
Average monthly temperature in °C at the SMHI weather stations over the study period (____). The 30-year average values for the same period (1961–1990; -----) are also shown.
4. Discussion
4.1. Moisture Content
When chipped in November (TR5), the moisture content was almost identical, and between 30% and 40% for both dried-stacked and fresh-stacked logging residues. This corresponds well with findings by [
9,
16] and corresponds well with the needs of the energy-conversion industry.
The plastic sheets beneath the windrows could have affected the results, for example by changing the microclimate around the residues from the usual conditions when in direct contact with the ground. The most obvious associated risk was accumulation of water, but this was prevented by the arrangement of the plastic sheets. After chipping, it was clear that most of the water had been able to drain away from the plastic beneath the roadside windrows. The logging residues had also pierced the plastic in several places, allowing additional water to drain away. Therefore, the plastic is believed to have had minor effects on the results.
4.2. Distribution and Yield of Logging Residues
The similarity in the results of the distribution of logging residues left at the clear-felling area was expected because the logging operation until forwarding was identical, so the amount of logging residues that fell off during the harvesting operation should have been very similar. A slightly higher proportion of logging residues is left beneath the harvester heaps after dried-stacking, compared to the amount left with fresh-stacking, which can be explained by needles and other fines falling off the branches during storage. However, recommendations from the Swedish Forest Agency [
5] to leave 20% of logging residues in clear-felling areas could clearly be satisfied, regardless of the method used for gathering the logging residues.
General thoughts by entrepreneurs and the industry state that the fresh-stacked method should yield more material left beneath the windrow, since the potential for fall-off should have been greater when handling the fresh-stacked residues with a higher amount of needles. Finding more material beneath the dried-stacked windrow was therefore unexpected. A possible explanation for the discrepancy is that the summer drought and re-humidification in the harvester heaps at the clear-felling area made the logging residues more brittle, resulting in more needles, bark and small branches breaking off during handling operations. This would imply that the fresh-stacked logging residues are more stable, as higher proportions of the finer fractions appeared to stay on the branches.
There were large differences in amounts of logging residues among the sample plots beneath the windrows, resulting in large standard deviations that obscured any potentially significant differences between the methods. The strongest deviations were among samples from beneath the dried-stacked roadside windrow, one of which amounted to 26 kg, while the rest of the sample plots yielded 0.1–9 kg of logging residues. This variability reflects the uneven ground; the plot yielding the extremely high sample was in a pit where the operator of the chipper truck was unable to gather all the logging residues. A boxplot, constructed in SPSS (
www.ibm.com), confirmed that the sample plot beneath the windrow with 26 kg m
−2 was an outlier and was therefore excluded from the calculations. The unevenness of the ground might also have affected the differences in residue amounts between plots beneath the windrow and beneath the harvester heaps. The amount of logging residues spilled beneath the chip truck was very low and was due to the design of the chipper feed, which incorporated a large feeding table.
As a field trial of this kind requires significant resources, this study was limited to one clear-felled area and the focus was to carefully determine the amounts and distribution of logging residues. That the results are derived from just one clear-felling should be kept in mind when interpreting the results. The potential of logging residues from other clear-fellings can certainly vary. However, once the harvest is complete, the assessment is that the distribution of logging residues spread in a similar fashion. The technique and skill among operators of both the harvester and the forwarder may influence the distribution at the clear-felled area and the possible withdrawal, equally as the total potential extraction of logging residues.
4.3. Distribution of Needles
The needle fall-off beneath the harvester heaps were lower than previously stated, despite leaving the residues in harvester heaps to promote high needle fall off with the dried-stacked method. This confirms the premise of Filipsson and Nordén [
25], and also Nilsson
et al. [
9], that attempts to shed the needles on the clear-felling area often do not succeed. Despite having optimum drying conditions, with a dry summer and a long storage period in small harvester heaps, most of the needles did not fall off in the clear-felled area. Relatively large harvester heaps may also have contributed to the fact that the needles did not fall off during the summer drying of the dried-stacked logging residues at the clear-felled area, as was demonstrated by Lehtikangas [
19]. Both methods in the end yielded a fuel with low needle content, as required by the energy-conversion industry. However, the possibility to actively leave most of the needles at the clear-felled area so that it may benefit the next generation of the forest is questionable.
Regardless of the method, approximately 30%–40% of the needles available in the stand were delivered to the energy-conversion plant. The windrow is not considered to be part of the clear-felled area, as it is often in the vicinity of a roadside ditch and hence close to streams. In summary, we estimated that one third of the needles end up at the energy-conversion site, one third is spread at the clear-felled area between the harvester heaps, and the last third is concentrated beneath the harvester heaps and the roadside windrow.
4.4. Fraction Composition
The proportion of needles found in the fresh logging residues (TR2) is considerably lower than the proportions (20%–30%) reported in earlier studies in Sweden, for example, Thörnqvist [
28] and Flinkman
et al. [
27]. This may have been partly due to the hoisted crowns in the study stand. Additional drying of the logging residues, during the delay in forwarding of the fresh residues, may also have reduced the needle content. However, the needles were seemingly firmly attached to the branches during forwarding, so the delay probably had little effect on the needle content of material reaching the windrow. Another factor that might have affected the amount of needles was the distribution of the three tree species. Contributions from either broadleaf trees or Scots pine would have reduced the total needle content.
Notably, the dried-stacked logging residue had a higher proportion of fines, but the proportion of the most valuable coarse fraction was very similar with both extraction methods. In fact, the results indicate that dry-stacking resulted in a higher total of needles and other fines content than fresh-stacking. This may be partly due to the dried-stacked residues being more brittle, leading to greater increases in fine contents during extraction.
5. Conclusions
Fresh- and dry-stacking extraction methods resulted in the delivery of very similar proportions (56% and 52%, respectively) of the logging residues to the energy-conversion plant in November, with nearly identical moisture contents (37% and 36%, respectively). Furthermore, for both methods approximately 30% of the total residues were found between the harvester heaps, approximately 10%–15% beneath the harvester heaps and 2%–5% beneath the windrows. This study also showed that the distribution of logging residues was well spread over the clear-felled area. Therefore, both methods satisfy recommendations of the Swedish Forest Agency to leave 20% of the logging residues spread on clear-felled areas, in order to prevent nutrient losses from the system. However, neither of the methods left the needles evenly spread because the needles that fell off beneath the harvester heaps were concentrated on 7%–8% of the total clear-felled area. Even though weather conditions during this study were favorable for needle fall off, a substantial proportion of needles reached the energy-conversion plant. This confirms that attempts to shed the needles on the clear-felling area using the dried-stacked method often do not have the desired effect.
Notably, the final product delivered to the energy-conversion industry was very similar, regardless of the method. Generally, the results are consistent with findings by Nilsson
et al. [
9], that logging residues stored over one summer consist of 5%–10% needles and have a moisture content of approximately 30%–40%, regardless of whether they are fresh- or dried-stacked. In practice, logging residues delivered to the energy-conversion plant are often neither fresh- nor dried-stacked, but something in between, due to that forwarding occurs when practically and logistically appropriate.
The results indicate that from a logistical perspective, it might be advantageous to forward logging residues directly after roundwood harvests, using the same forwarders while they are still on-site. This might be particularly suitable where the clear-felled areas are generally small with a high concentration of logging residues and machinery relocation costs are high. Additional studies are needed to investigate the needle content in fresh logging residues in southern Sweden, and to clarify more comprehensively the distribution of needles at clear-felled sites after logging residue extraction. Repeated studies at more clear-felled areas would be interesting to see if the results are generalizable to other areas, as well as to verify the influence of the operators skill and technique during logging and forwarding operations, of the distribution and withdrawal of logging residues. Detailed comparison of nutrient offtake with the different storage and extraction methods would also be valuable.


