Article

Microclimate and Modeled Fire Behavior Differ Between Adjacent Forest Types in Northern Portugal

1
Centre for the Research and Technology of Agro-Environmental and Biological Sciences (CITAB), University of Trás-os-Montes and Alto Douro, Apartado 1013, 5000-801, Vila Real, Portugal
2
Centro de Ecologia Aplicada Baeta Neves, Instituto Superior de Agronomia, Universidade de Lisboa, 1349-017, Lisboa, Portugal
*
Author to whom correspondence should be addressed.
Forests 2014, 5(10), 2490-2504; https://doi.org/10.3390/f5102490
Submission received: 22 July 2014 / Revised: 4 September 2014 / Accepted: 11 October 2014 / Published: 17 October 2014
(This article belongs to the Special Issue Climate Change and Forest Fire)

Abstract

:
Fire severity varies with forest composition and structure, reflecting micrometeorology and the fuel complex, but their respective influences are difficult to untangle from observation alone. We quantify the differences in fire weather between different forest types and the resulting differences in modeled fire behavior. Collection of in-stand weather data proceeded during two summer periods in three adjacent stands in northern Portugal, respectively Pinus pinaster (PP), Betula alba (BA), and Chamaecyparis lawsoniana (CL). Air temperature, relative humidity and wind speed varied respectively as CL < PP < BA, PP < CL < BA, and CL < BA < PP. Differences between PP and the other types were greatest during the warmest and driest hours of the day in a sequence of 10 days with high fire danger. Estimates of daytime moisture content of fine dead fuels and fire behavior characteristics for this period, respectively, from Behave and BehavePlus, indicate a CL < BA < PP gradient in fire potential. High stand density in CL and BA ensured lower wind speed and higher fuel moisture content than in PP, limiting the likelihood of an extreme fire environment. However, regression tree analysis revealed that the fire behavior distinction between the three forest types was primarily a function of the surface fuel complex, and more so during extreme fire weather conditions.

Graphical Abstract

1. Introduction

Wildfire severity in the Mediterranean basin and its corresponding socioeconomic and environmental impacts have reached unprecedented levels in the last decades due to changes in land use and land cover [1,2]. The abandonment of marginal agricultural activity [3] and promotion of extensive afforestation with conifers [4] led to flammable shrublands and forests. Abundant sources of ignition, favorable plant growth conditions and summer drought [5] further contribute to the onset and development of high-intensity fires difficult to control [6]. Worsening of the fire problem is expected in the future, as the wildland-urban interface expands and extreme weather events become more frequent [2,7].
The fire environment can be defined as the conditions, influences and modifying forces that affect fire behavior characteristics such as rate of spread, flame size and heat release rate [8]. Three groups of variables shape the fire environment, respectively weather, fuel, and topography. Forest composition and structure influence both microclimatic conditions [9,10] and fuel structure and quantity [11], hence, fire behavior and effects. Stand structure determines in-stand wind speed profile [12,13], solar radiation [10], and dead fuel moisture content [14,15]. Dry, wind-exposed, low (either open or dense) Mediterranean forest types experience fast-spreading, high-intensity crown fire [11].
Empirical studies generally indicate mitigation of fire behavior or fire severity in more mature stands [16,17] and in deciduous broadleaved forest [18,19,20,21,22] and short-needled conifers [22] in comparison with pine forests. Modification of fire behavior characteristics is expected to disturb or disrupt landscape fire growth, directly, by delaying or impeding fire spread and, indirectly, by allowing successful fire suppression operations, hence, translating into less area burned and differential burning rates among vegetation types. Fire selects flammable conifer types over evergreen broadleaves [23], deciduous broadleaves [24,25], broadleaves in general [26,27,28], and short-needled conifers [26], although preferential burning is affected by stand structure [29] and decreases with fire size [23,30]. Those studies support the contention that decreasing fire hazard, either by treating fuels in flammable cover types or their conversion to less fire-prone vegetation types [1,2] should supplement fuel-break networks that often fail to halt fire spread [31].
The effects of fuel treatments and silviculture on micrometeorology and fuel moisture content are now receiving attention [32,33,34], however, studies that compare forest types from the fire hazard viewpoint are lacking. Fuel and vegetation types influence fire behavior and severity, but the role of differences in micrometeorology between forest types is difficult to ascertain empirically, partly because of confounded effects between topography, fire spread patterns, and stand structure [16,22,35]. Fire modeling with typical fuel and weather inputs [36,37] potentially accomplishes a better understanding of the relative importance of the factors driving fire behavior. In this study we (i) compare micrometeorology between adjacent stands of three species associated with substantially different fire environments and located in a similar physiographic setting; and (ii) simulate fire behavior to disentangle the influences of fuel type and weather-related variables.

2. Methods

2.1. Study Site, Stand Characteristics and Weather Data Collection

The study site is located in Northern Portugal in the eastern slope of the Marão mountain’s main ridge (41°16′20′′ N, 7°53′45′′ W, 1100-m elevation) within a species-diverse communal forest established by the Forest Service in the 1960s. The climate is Mediterranean with an oceanic influence. Annual average precipitation (falling mostly from October through April) and temperature are 1200 mm and 10 °C, respectively. We choose three adjacent pure stands of Pinus pinaster Ait., Chamaecyparis lawsoniana (A. Murray) Parl. and Betula alba L., respectively a long-needled conifer, a short-needled conifer, and a deciduous broadleaf, hereafter PP, CL and BA. The stands were even-aged and uniform in structure and their characteristics (Table 1) were determined from 500-m2 forest inventory plots. Slope averages 25°.
Table 1. Stand characteristics. dbh = mean diameter at breast height; DH = dominant height; H = mean tree height; CBH = mean live crown height.
Forest TypeTree Density (no. ha−1)dbh (cm)Basal Area (m2 ha−1)Canopy Cover (%)DH (m)H (m)CBH (m)
PP106026.156.55517.815.89.0
CL78039.787.38526.723.110.1
BA120018.433.77517.212.77.9
One weather station was placed in each stand at representative locations (i.e., avoiding canopy gaps), approximately 50 m from the forest road edge and 100 m from each other. Air temperature (T, °C), relative humidity (RH, %), and wind speed (U, km h−1) were monitored at 1.5 m above ground with built-in sensors (Vantage PRO2, Davis Instruments, Haywood, USA). T, RH, and U were, respectively, read every 10 s, 1 min, and 3 s for hourly means. T and RH sensors were non-aspirated, shielded from radiation, with ±0.5 °C and ±3% accuracy. Wind measurement accuracy was ±5%, wind gust speed being the highest wind speed recorded for any hour period. Data collection proceeded continuously throughout the summer months (July to September 2006, July to August 2007) to coincide with the peak of potential fire activity.

2.2. Potential Fire Behavior

BehavePlus (version 5.0) [38] simulated surface fire behavior characteristics (rate of spread and flame length) in each stand. BehavePlus adopts the fire spread model of Rothermel [39] and associated models to generate the outputs from a fuel-complex description (the fuel model), in-stand surface wind speed, terrain slope, and the moisture contents of live fine fuels and three dead fuels size classes (1-hour, diameter < 6 mm; 10-hour, diameter between 6 and 25 mm; and 100-hour, diameter between 25 and 75 mm). Fuel models were chosen from the Portuguese fuel models collection [40,41], respectively M-PIN, long-needled conifer litter with woody understory; F-RAC, short-needled conifer litter; and M-CAD, deciduous hardwood litter with woody understory. Table A1 in the Appendix indicates the fuel model parameters.
We inspected the available data and selected 10 days during which more extreme fire behavior would occur as determined by weather conditions, starting 11 days after precipitation and corresponding to an uninterrupted sequence of days with minimum relative humidity below 30% in the PP stand. Fire behavior for those days was simulated hourly from 8 a.m. to 6 p.m. to ensure the simulation would capture the highest possible fire danger in any given day. The simulations describe the behavior of an upslope head fire in the direction of maximum spread, i.e., when wind direction aligns with slope. For wind and slope inputs we respectively used hourly records within each stand and the site average.
The moisture content of 1-hour fuels from 8 a.m. to 6 p.m. was obtained with the MOISTURE module of the FIRE2 program within BEHAVE software [42]. MOISTURE implements a model [43] that improves on the Fine Fuel Moisture Code of the Canadian FWI system [44], namely by accounting for the drying effect of solar radiation, as determined by latitude, time of year, time of day, topography, and shade (from stand characteristics). MOISTURE has been validated with data from different fuel types across North America [43]. The moisture content of downed woody fuels on the forest floor was assumed to equal the moisture of fine dead fuels plus 1% (10-hour fuels) or 2% (100-hour fuels). Typical summer values of live fuel moisture content were adopted from [11], respectively 84% (PP) and 102% (BA), and which are determined by distinct floristic composition; the CL stand had no understory vegetation.
Expanded sets of fire behavior simulations were additionally conducted for each stand, covering a wind speed range of 1–15 km h−1 (at steps of 1 km h−1) combined with 1-hour moisture content, varying from the minimum estimate for each stand during the 10-day sequence to a maximum of 28%, the moisture of extinction of CL, at steps of 1%; this resulted in 345 simulation runs for each stand.

2.3. Data Analysis

Examination of weather data inconsistencies resulted in discarding some BA temperature measurements caused by sensor malfunction. We summarized the hourly weather observations (air temperature, relative humidity, wind speed) for the complete set of data and for the 10-day sequence of high fire danger.
Statistical significance adopts the 95% confidence level (p < 0.05). Comparisons between forest types of weather variables for the whole study period, and of 1-hour fuel moisture content and fire behavior characteristics for the high fire danger period were carried out with a pair difference test, the Wilcoxon signed-rank test that accounts for non-normal distributions. Additionally, to visualize each stand patterns, we plotted the non-parametric bivariate densities of 1-hour moisture content and fire behavior characteristics using quantile contours in 5% intervals.
Individual influences of the non-fixed variables that determine fire behavior characteristics in BehavePlus (fuel model, wind speed, 1-hour fuel moisture content) were quantified through Classification and Regression Tree Analysis (CART) with 100 splits (explaining 99% of the modeled variation), for the high fire danger period and for the expanded weather scenarios.

3. Results

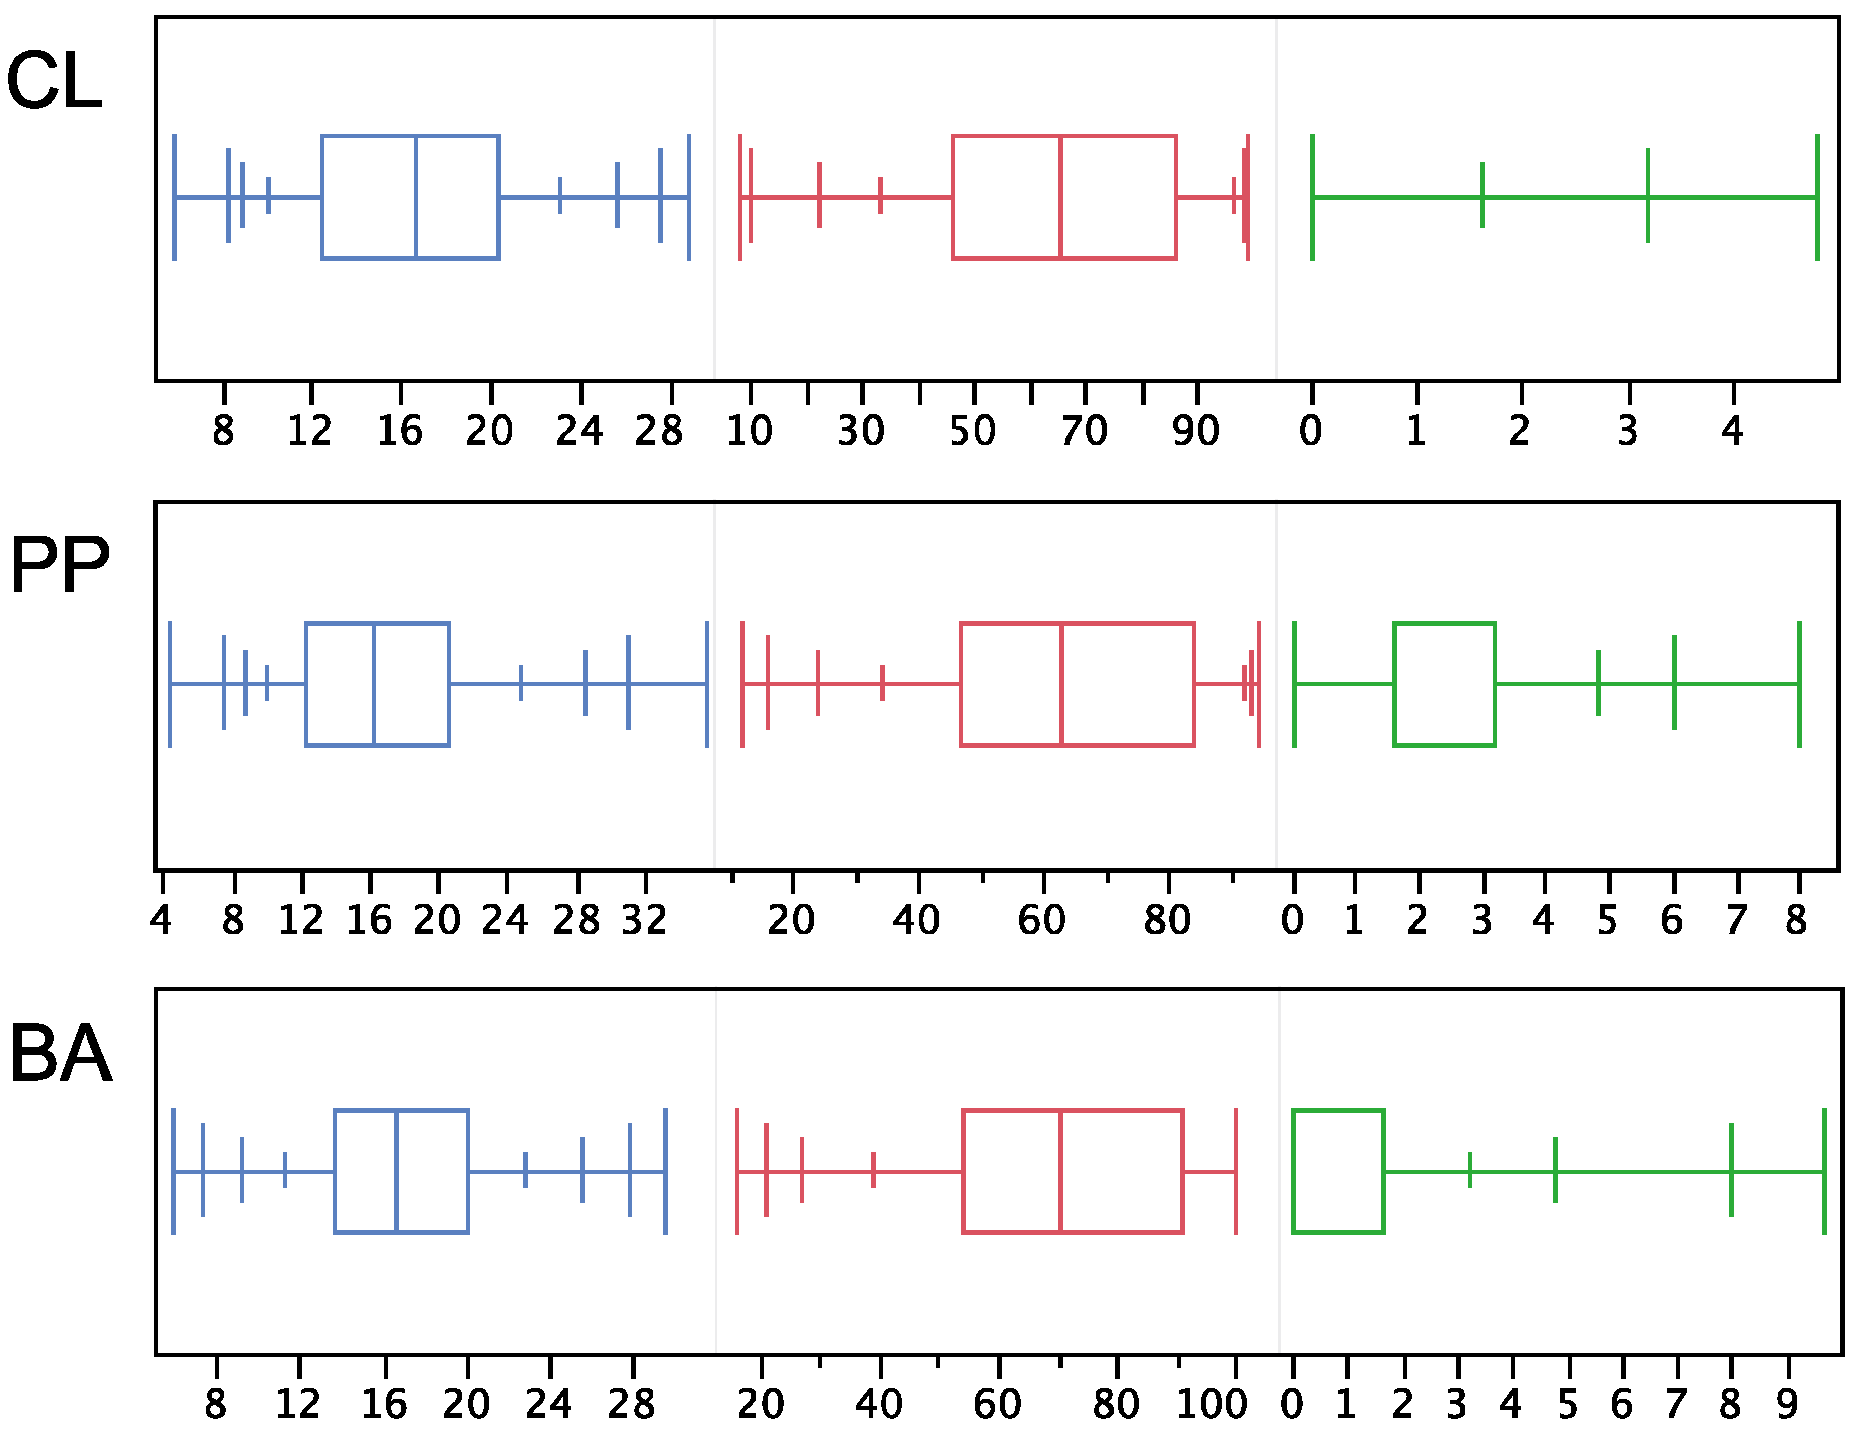
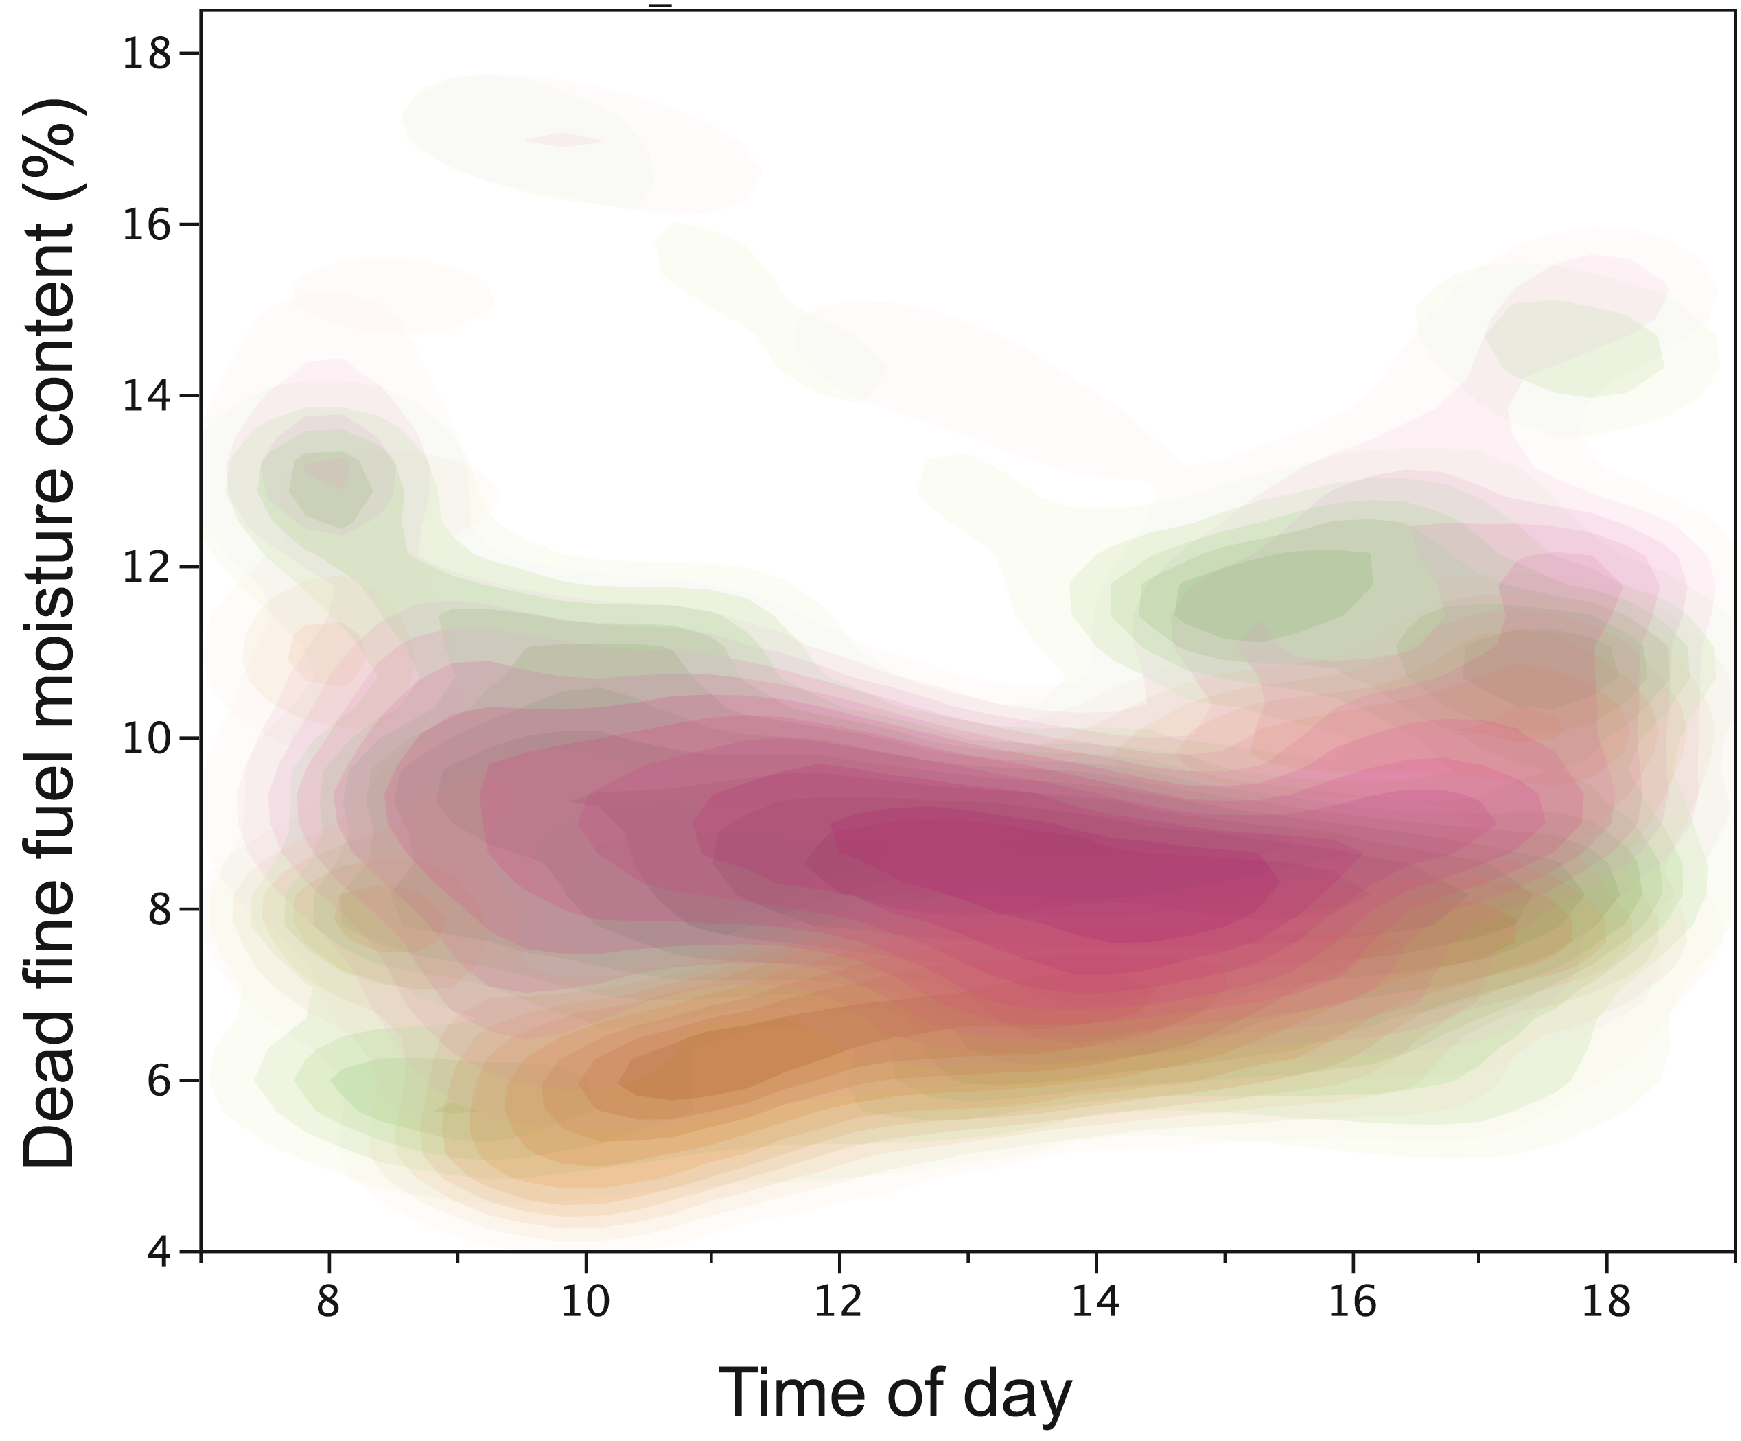
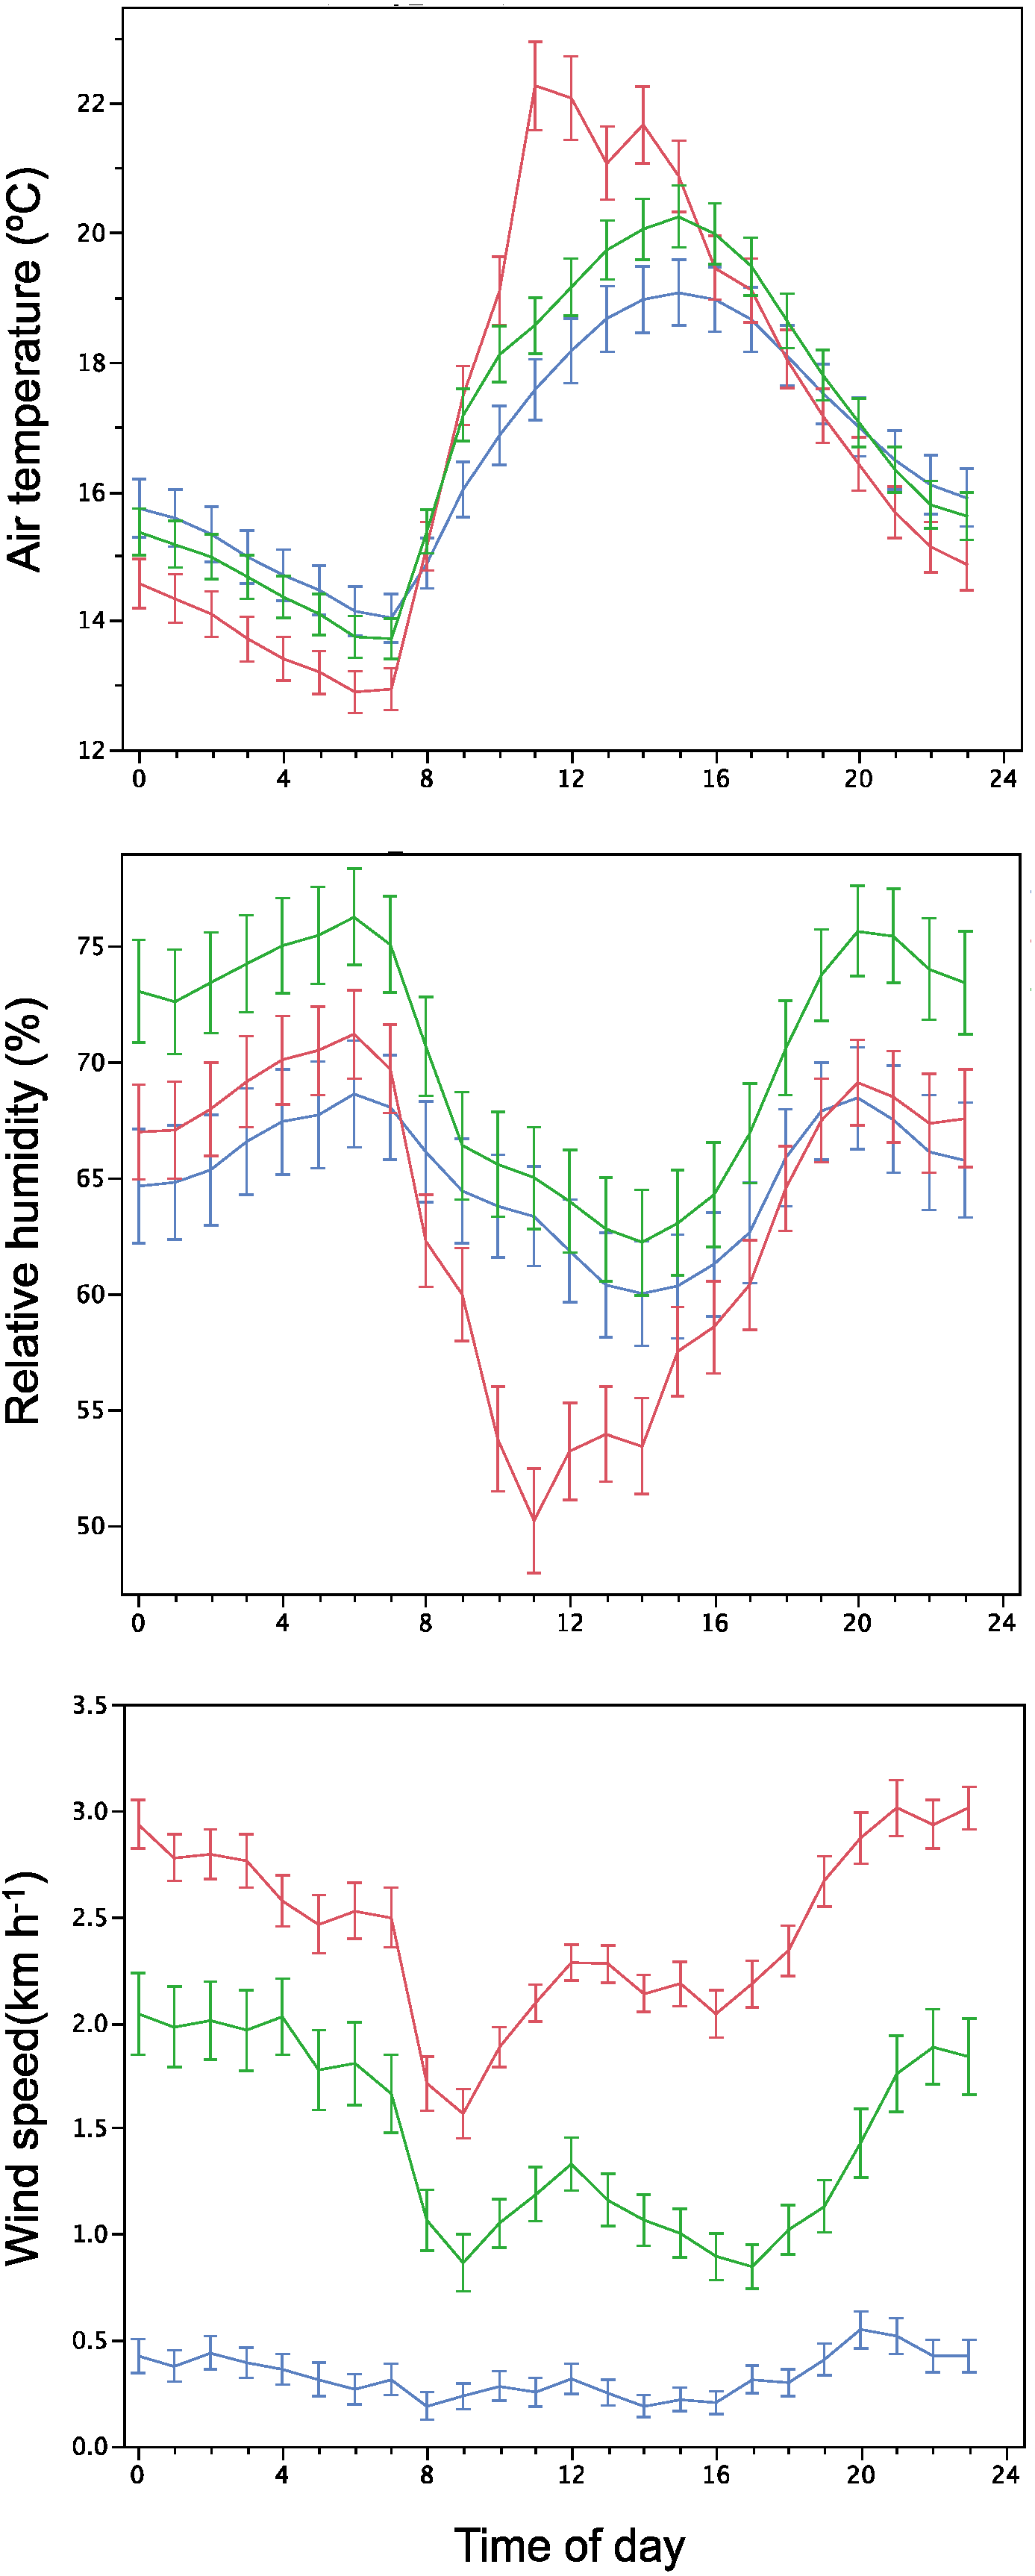
3.1. Weather and Fine Fuel Moisture content

Table 2 and Figure 1 summarize weather variables over the study period for the three forest types. The three stands experienced similar means and ranges of air temperature and relative humidity, with a greater difference in mean wind speed and gust strength. Correlations between paired hourly observations in the three stands were strong for air temperature and relative humidity (r > 0.91) and moderate for wind speed, and the means of all weather variables differ significantly (p < 0.0001) between forest types (Table 3). Differences in air temperature were small, and the greatest dissimilarities were between relative humidity in BA and in the conifer stands, and amid wind speeds in PP and CL. Regarding temperature the three are ranked as PP is greater than CL and BA is greater than PP (CL < PP < BA); and PP < CL < PP and CL < BA < PP, respectively, for relative humidity and wind speed.
Table 2. Weather observations in the three stands: hourly observations means and ranges (first line, n = 2446, except for BA temperature, n = 2269) and range of mean daily observations (second line, n = 102).
VariableCLPPBA
T (°C)16.6 (5.8–28.9)16.8 (4.4–35.5)16.9 (5.9–29.5)
13.3–19.712.2–23.413.1–20.8
RH (%)64.9 (8–99)63.3 (12–94)70.4 (16–100)
48.9–79.345.0–79.054.8–84.1
U (km h−1)0.3 (0–4.8)2.4 (0–8)1.5 (0–9.7)
0–1.20.7–4.30.1–3.8
Umax (km h−1)3.5 (0–10.0)8.2 (5.3–15.0)7.1 (1.7–15.5)
0–32.20–27.40–38.6
Figure 1. Boxplots of hourly weather observations per forest type, respectively air temperature (°C, left), relative humidity (%, center), and wind speed (km h−1, right); The line within the box indicates the median; the top and bottom boundaries of the box denote the 75th and 25th percentiles; the remaining lines correspond to percentiles 0, 0.5, 2.5, 10, 90, 97.5, 99.5, and 100.
Forests 05 02490 g001
Table 3. Weather variables hourly observations: differences (mean ± std. error) and correlations (r) within pairs of forest stands, with the significance of the Wilcoxon signed-rank test; n = 2446 except for temperature comparisons involving BA (n = 2269); values reported for wind speed correspond, respectively, to the mean and the maximum.
ComparisonAir Temperature (°C)Relative Humidity (%)Wind Speed (km h−1)
DifferencesrDifferencesrDifferencesr
PP-CL0.28 ± 0.04 ***0.93−1.60 ± 0.14 ***0.952.11 ± 0.02 ***
4.74 ± 0.06 ***
0.45
0.64
PP-BA−0.39 ± 0.05 ***0.92−7.02 ± 0.10 ***0.971.45 ± 0.99 ***
1.16 ± 0.07 ***
0.50
0.58
BA-CL0.11 ± 0.04 ***0.935.43 ± 0.11 ***0.971.12 ± 0.03 ***
3.59 ± 0.07 ***
0.37
0.47
*** Correlations were high and the three stands were significantly different (p < 0.0001).
Figure 2 shows the diurnal variation of weather variables during the 10-day period of high fire danger. Maximum T and minimum RH occur earlier in the day in PP, 3–4 h before CL and BA. 24-hour weather variation was smallest in CL and, at least for T and RH, largest in PP. While the BA ambient was consistently moister, differences between forest types were especially marked for wind speed, as shown by the lack of overlap between standard errors. The previous ordering of species is maintained during daytime, except for air temperature. PP now stands out as the driest, windiest and warmest forest type, and the differences are particularly noticeable from 10 a.m. to 2 p.m.
Dead fine fuel moisture content estimated for daytime hours during the high fire danger sequence of 10 days resulted in averages of 9.3%, 7.9%, and 9.8%, and in ranges of 5.3%–19.7%, 4.4%–15.2%, and 5.6%–19.3%, respectively, for CL, PP, and BA. Correlations were high and the three stands were significantly different (p < 0.0001) regarding dead fuel moisture content, which varied as PP < CL < BA (Table 4). The discrepancy in 1-hour fuel moisture content between PP and the other types is especially important in the morning and late afternoon, with some convergence visible during mid-afternoon, namely between CL and BA (Figure 3).
Table 4. Daytime (8 a.m.–6 p.m.) estimates of dead fine fuel moisture content (%) during the sequence of high fire danger days: differences (mean ± std. error) and correlations (r) within pairs of forest stands, with the significance of the Wilcoxon signed-rank test; n = 110.
ComparisonDifferencesr
PP-CL−1.4 ± 0.1 ***0.83
PP-BA−1.9 ± 0.1 ***0.87
BA-CL0.5 ± 0.1 ***0.96
*** Correlations were high and the three stands were significantly different (p < 0.0001).
Figure 2. Mean ± standard error of hourly weather data in CL (blue), PP (red), and BA (green) stands during the selected 10-day sequence.
Forests 05 02490 g002
Figure 3. Non-parametric bivariate density of the estimated dead fine (1-h) fuel moisture content in CL (green), PP (orange), and BA (pink) stands during the selected 10-day sequence.
Forests 05 02490 g003

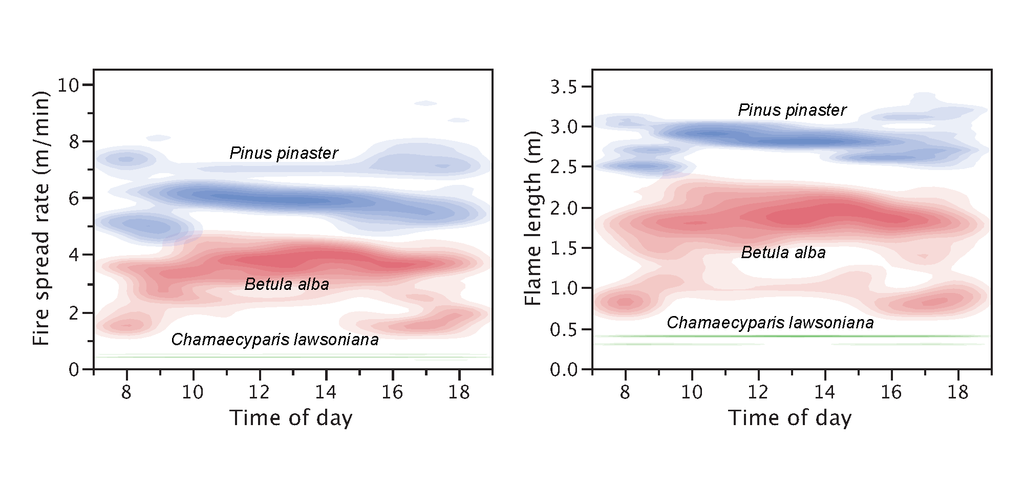
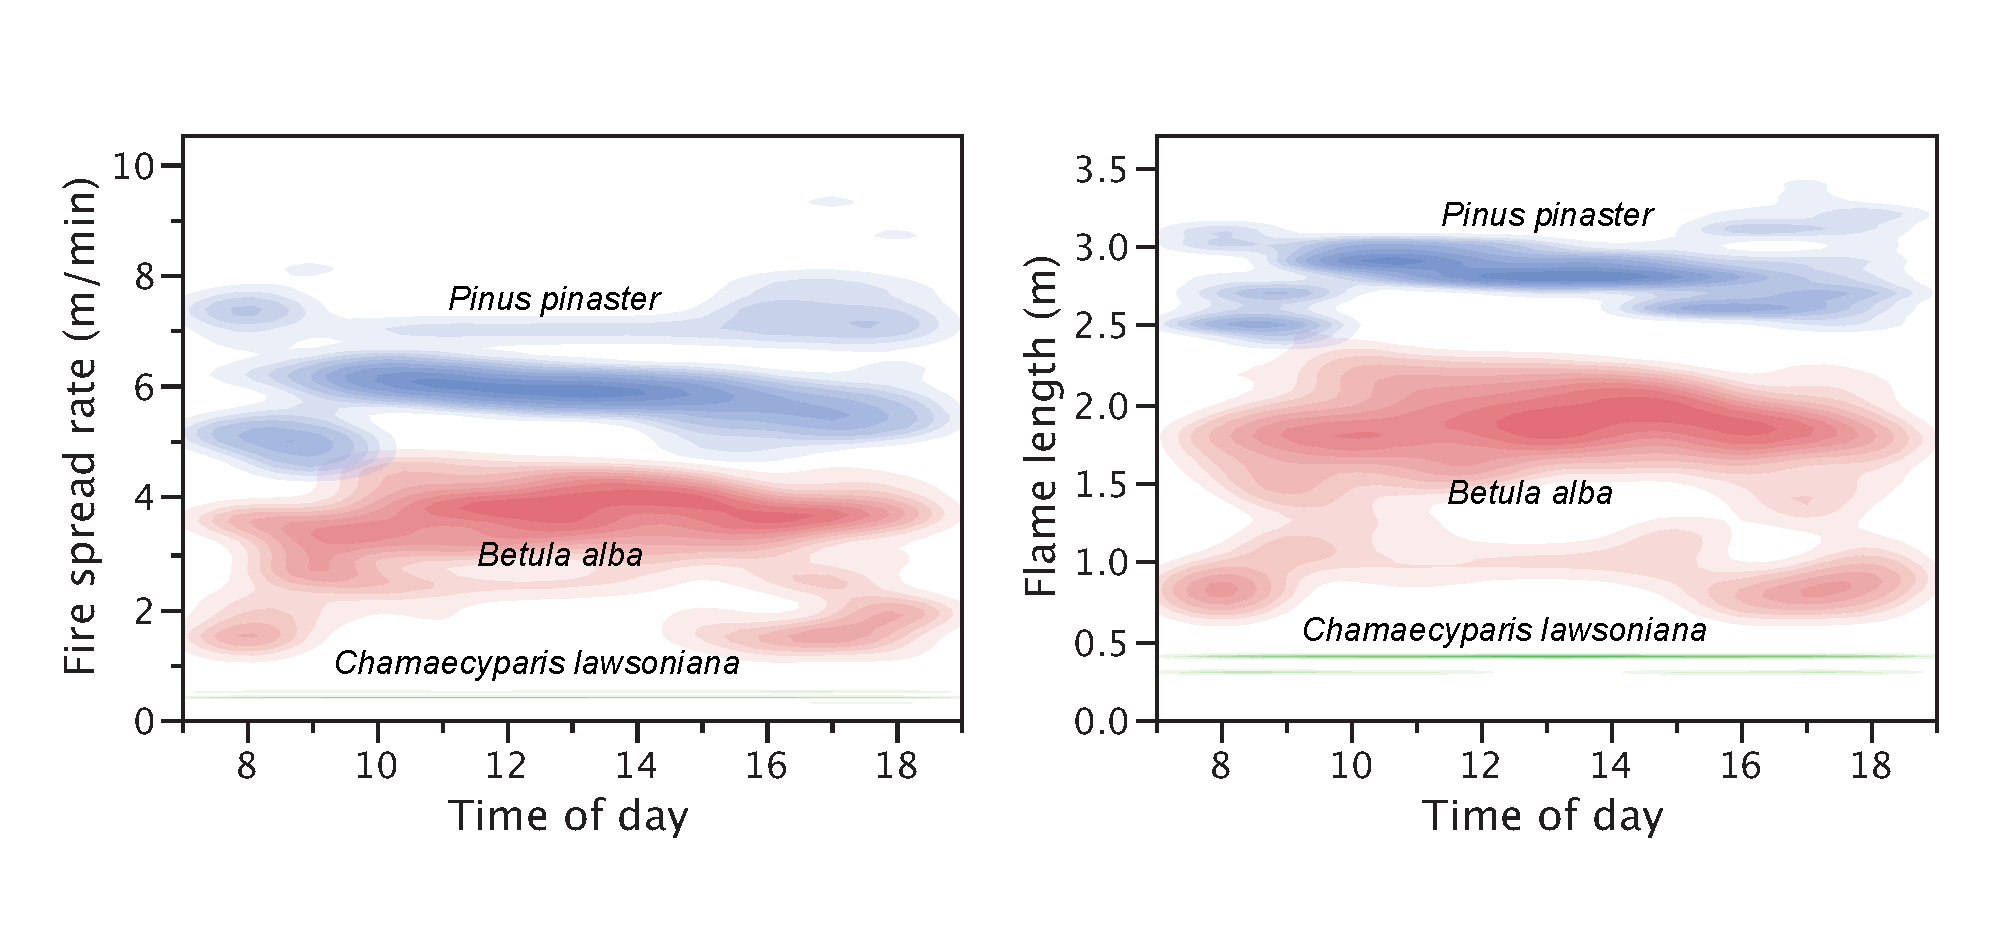
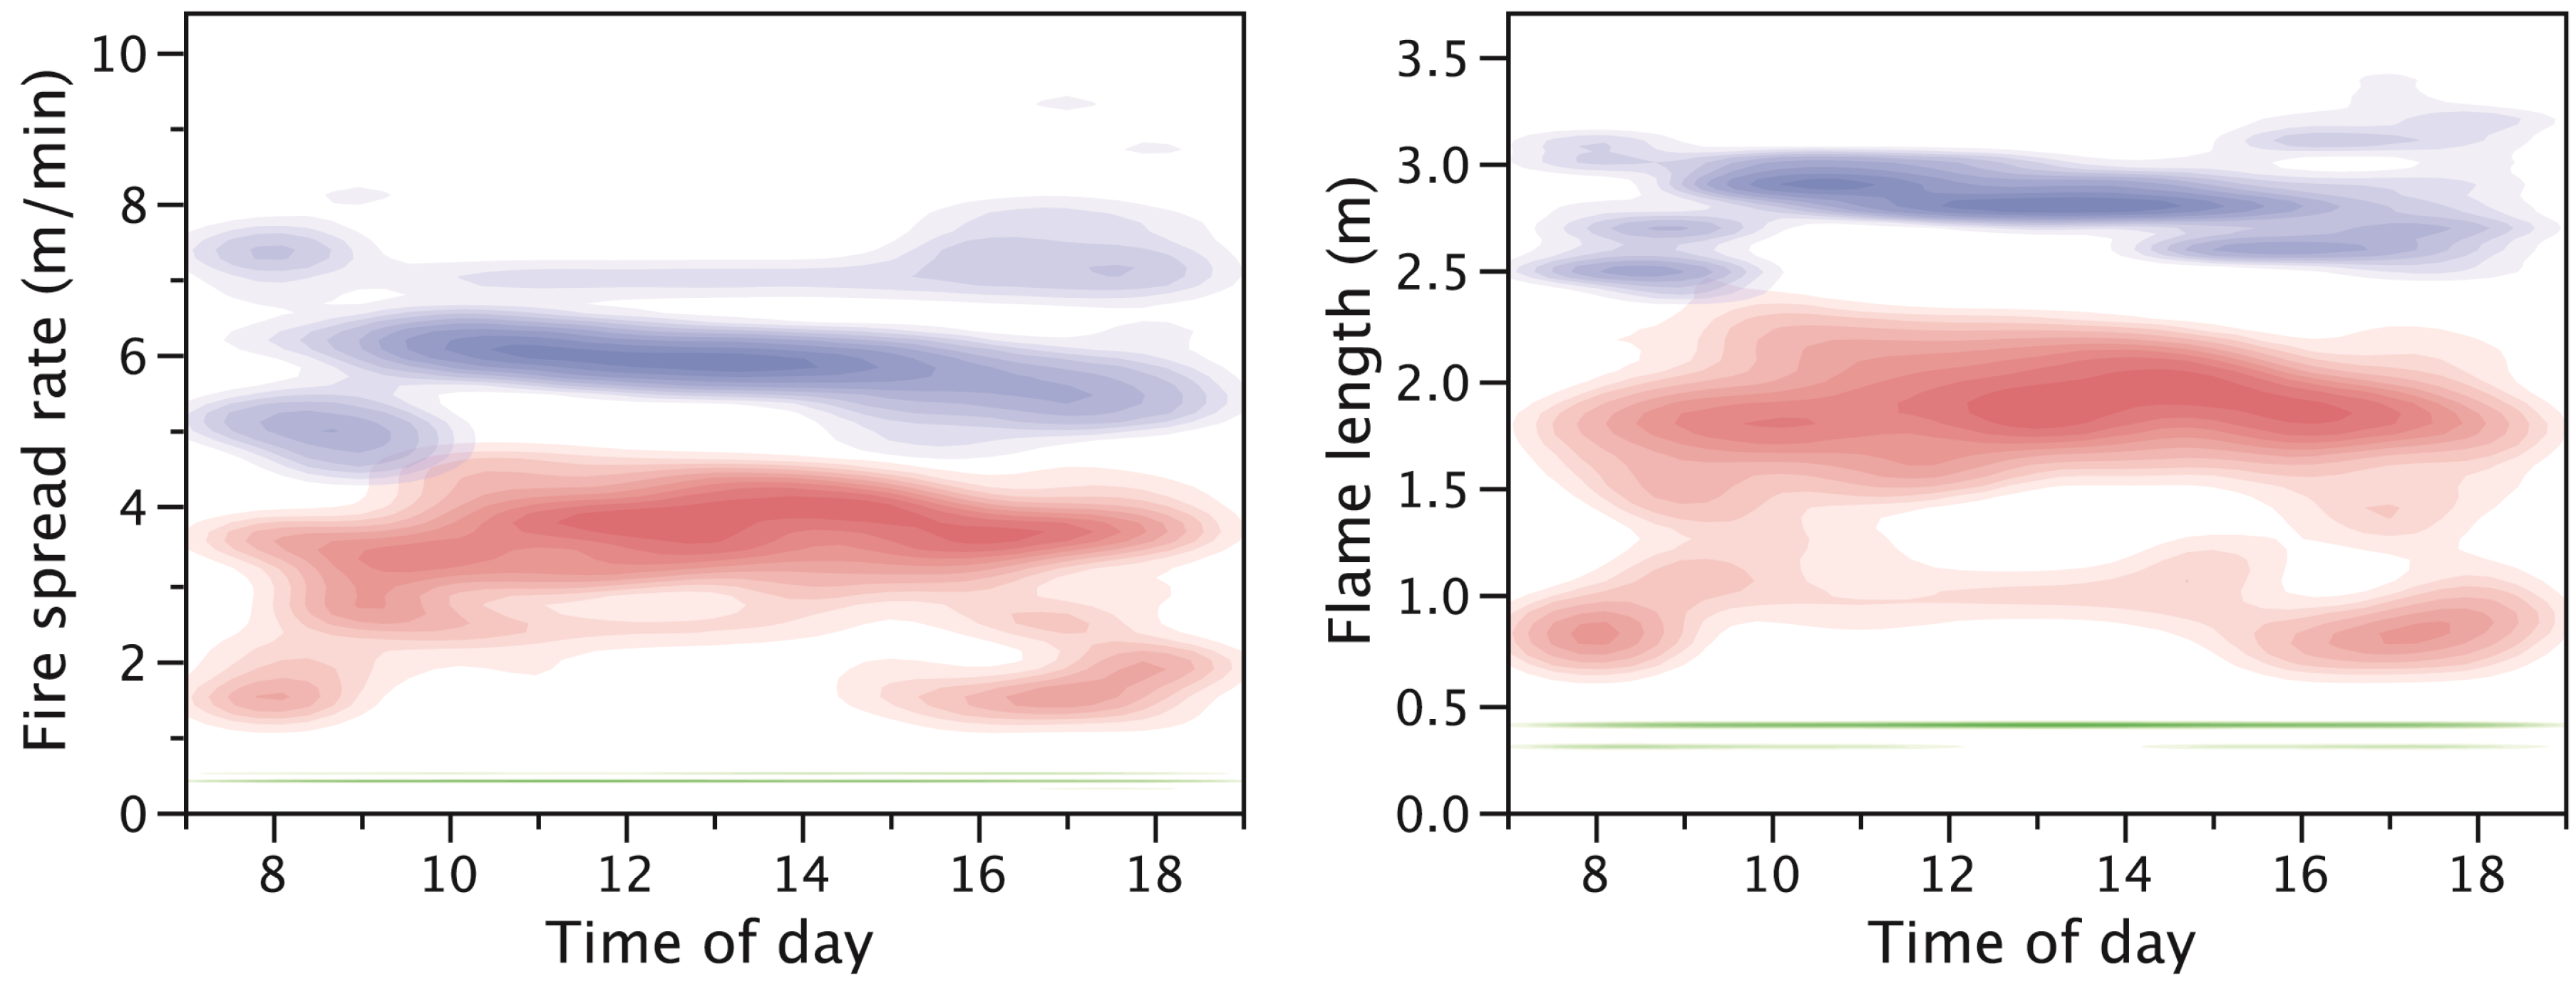
3.2. Fire Behavior Potential

Modeled fire behavior during the high fire danger period differed significantly (p < 0.0001) between the three forest types, with weak to moderate correlations between pairs of stands (Table 5). Fire potential ranked as CL < BA < PP for both spread rate and flame length, without overlapping between stands (Figure 4). Fire spread rate and flame length decrease respectively by 47% and 43% in BA, and by 93% and 87% in CL, on average and in reference to PP. Fire behavior in CL varied within a really narrow range with no apparent response to daytime weather variation, in contrast with the dynamics exhibited by PP and especially by BA (Figure 4).
Table 5. Daytime (8 a.m.–6 p.m.) simulations of fire behavior variables during the sequence of high fire danger days: differences (mean ± std. error) and correlations (r) within pairs of forest stands, with the significance of the Wilcoxon signed-rank test; n = 110.
ComparisonSpread Rate (m min−1)Flame Length (m)
DifferencesrDifferencesr
PP-CL5.68 ± 0.08 ***0.452.45 ± 0.02 ***0.43
PP-BA2.89 ± 0.11 ***0.221.20 ± 0.04 ***0.42
BA-CL2.79 ± 0.09 ***0.571.24 ± 0.04 ***0.72
*** Correlations were high and the three stands were significantly different (p < 0.0001).
Figure 4. Non-parametric bivariate density of simulated fire behavior characteristics for CL (green), PP (blue), and BA (red) stands during the selected 10-day sequence.
Forests 05 02490 g004
CART analyses for the high fire danger period reveal a strict fuel complex control over modeled fire behavior (Table 6), with fuel model accounting for more than 90% of the variation in spread rate and flame length. In the extended simulation fuel model still prevails as a factor of variation, especially of flame length, albeit with a less overwhelming influence (Table 6).
Table 6. CART analyses results: relative contributions (%) of fuel model, wind speed and 1-hour fuel moisture content in explaining variability in modeled fire behavior characteristics.
Simulation and Input VariablesSpread RateFlame Length
High fire danger
Fuel model92.093.3
Wind speed3.46.2
1-hour fuel moisture4.50.5
Expanded
Fuel model55.774.7
Wind speed34.212.7
1-hour fuel moisture10.112.6

4. Discussion

4.1. Differences in Weather and Fuel Moisture Content

Measured and modeled fire weather related variables were statistically different between forest types, with CL < PP < BA for air temperature, PP < CL < BA for relative humidity and fine dead fuel moisture content, and CL < BA < PP for wind speed. Highly significant correlation between forest types was expected and found for all weather variables given the proximity of the stands and their common topographic position. The association was strong for temperature and relative humidity (r > 0.90) but less so for wind speed, presumably because of its marked spatial variation [45]. Fuel moisture content in this study was estimated from atmospheric conditions and variables affecting solar radiation. The three forest types differ in litter structure and, possibly, in the moisture of the underlying duff. These factors affect the moisture content of fine dead fuels [46] but are not considered by the MOISTURE model. Under comparable conditions of weather and shading, surface fuels in deciduous hardwoods (BA in our case) are expected to be wetter than in conifers, but the difference decreases with dryness to the point of being insignificant [46].
PP represented the highest mean fire danger, as it combined the highest wind speed with the lowest dead fuel moisture content as a result of a comparatively more open environment. Mean differences between PP and the other stands in relative humidity, and especially in air temperature, were nevertheless low to moderate, except between 9 a.m. and 2 p.m. This temporal departure partially coincides with the lowest wind speeds observed. Weak winds decrease air mixing, promoting distinction in T and RH [10,34]. Hence, local wind patterns further differentiate micrometeorology between the three forest types and possibly contribute to explain why maximum T and minimum RH are attained earlier in the day in PP. The timing of maximum T in PP also agrees with the expectation for a east-facing slope; whereas the lower canopy cover in PP allows for the expression of the solar radiation effect, high stand density in CL and BA buffers external influences to a degree and determines a more “closed” fire environment [8]. The effect of stand structure is even more pronounced regarding wind speed, and is particularly striking in the highly sheltered CL stand. The sheltering effect explains that the daily range in weather variables (and in modeled fire behavior) follows the order CL < BA < PP. Note, however, that extreme fire weather is possible in CL and BA, as shown by the maximum recorded wind gusts.

4.2. Differences in Fire Behavior Potential

Daytime fire modeling resulted in a distinct fire behavior level for each forest type. Likewise, stem char height (a flame size surrogate) from extreme–weather wildfires in the study region varied between short-needled conifers, deciduous broadleaves, and maritime pine, as 1:4:6, respectively, and after accounting for other sources of variation [22]. Stand composition (through fuel characteristics) and stand structure are both relevant to fire hazard, but simulation studies indicate the latter can override the influence of surface fuel accumulation and structure on fire behavior characteristics [11]. The significance of stand structure and stand composition to fire severity was highlighted by [22], however, that study was unable to untangle the relative effects of surface fuel and micrometeorology, namely because the less flammable forest types occupied cooler and moister topographical positions and aspects. In this study, stand structure and surface fuels shared the flammability gradient (CL < BA < PP), reinforcing each other and potentially confounding the assessment of their individual influences.
Fire weather, which is locally modulated by stand structure, can also prevail over the fuel complex when modeling fire behavior at the stand [36] and landscape [47] levels. The CART analysis revealed however that the fuel complex overwhelmed the effects of micrometeorology on fire spread rate and flame length during the high fire danger period, different fuels causing more than 90% of the differences in modeled fire behavior among the three stands. Fuel model was still the major factor controlling fire behavior in the extended simulation despite the allowance for much larger variability in weather inputs, hence, decreasing the contribution of fuel to fire behavior variation. Results of the high fire danger analysis are more pertinent for management because a small number of days characterized by extreme fire weather respond for the bulk of burned area [48]. Our results then indicate that the most dramatic variation in fire behavior between forest types (as determined by their typical surface fuel complexes) is seen under more extreme fire weather, similar to other conifer-dominated landscapes [49].

4.3. Management Implications

In comparison with PP and for the weather scenarios tested, BA and especially CL stands are characterized by low-intensity, slow-spreading fire that can be tackled by fire suppression operations. Treatment of surface or canopy fuels is unnecessary in BA and CL and, in general, in mature deciduous hardwood and short-needled conifer stands. In contrast, the high flammability of PP advises increasing fire resistance through prescribed burning or other surface fuel treatments and, eventually, through pruning and thinning [50]. The vertical and horizontal discontinuities subsequent to canopy fuel treatments decrease the likelihood of crown fire activity but imply a trade-off, whereby surface fire behavior is potentially enhanced because of windier and drier conditions in the understory [51]. When a NW Spain maritime pine stand, with a basal area of 37 m2 ha−1, was thinned out to 22 m2 ha−1 the moisture content of 1-hour fuels decreased 2% [52]. The primacy of surface fuels in controlling fire behavior implies that concerns with a more hazardous fire environment arising from canopy fuel treatments are unjustified as long as surface fuels are also treated.
The results allow better understanding of why and to what extent fire behavior subsides in less flammable forest types. Fuel structure and accumulation are the main factor behind fire behavior distinctions between forest types. Nevertheless, deciduous hardwoods and mountain short-needled conifers often occupy moist and sheltered locations, which probably explains observations of localized fire extinction [22], and, therefore, warrants a more relevant landscape-scale role of weather and fuel moisture content than found here.

5. Conclusions

The relative influences of vegetation (fuel) and weather on fire activity are the subject on ongoing scientific debate. Stand-level variation in fire behavior and severity reflect the natural variability and complex interactions between microclimate, fuels, and topography. We have demonstrated and quantified the differences in weather-related components of the fire environment in three forest types that can further inform the spatial analysis and simulation of fire spread. The observed and modeled differences were unrelated to physiography because the three stands were contiguous and shared elevation, aspect, and terrain slope.
Spatial heterogeneity in forest cover composition is crucial to moderate fire growth and severity. Forest conversion to less flammable types, whether natural (i.e., intrinsic to vegetation dynamics) or human-assisted, can potentially form fire-resistant and fire-resilient landscapes. The fact that fire behavior characteristics in the deciduous hardwood and short-needled conifer types were distinct from maritime pine, especially under more stringent weather conditions, suggests a valuable role for low-flammability stands in buffering the consequences of current and future extreme fire weather.

Acknowledgments

This study was supported by national funds by FCT—Portuguese Foundation for Science and Technology under the projects PEst-OE/AGR/UI4033/2014 and POCI/AGR/58896/2004 “Phoenix—Forest conversion in burned areas’. We thank Luís Ruas, Délio Sousa, and Carlos Fernandes for setting up and managing the weather stations and for tree measurement. Three anonymous reviewers provided useful comments.

Author Contributions

Anita Pinto processed the weather data, carried out the fuel moisture and fire behavior modeling tasks, and was responsible for data analysis and writing. Paulo Fernandes supervised the study, did additional data analysis and reviewed and edited the work.

Appendix

Table A1. Fuel model parameters; SVR = surface-area-to-volume ratio; H = heat content; Mx = 1-hour fuel moisture content of extinction.
ModelFuel DepthFuel Loading (t ha−1)SVR (m-1)HMx
(m)1 hour10 hours100 hoursLive WoodyLive Herbs1 hourLive HerbsLive Woody(kJ kg-1)(%)
F-RAC0.053.752.001.001.180.006500-45002050028
M-CAD0.634.541.870.619.080.006000-50002000030
M-PIN0.507.213.000.006.890.005500-60002100040

Conflicts of Interest

The authors declare no conflict of interest.

References

  1. Moreira, F.; Viedma, O.; Arianoutsou, M.; Curt, T.; Koutsias, N.; Rigolot, E.; Barbati, A.; Corona, P.; Vaz, P.; Xanthopoulos, G.; et al. Landscape-wildfire interactions in southern Europe: Implications for landscape management. J. Environ. Manag. 2011, 92, 2389–2402. [Google Scholar]
  2. Fernandes, P.M. Fire-smart management of forest landscapes in the Mediterranean basin under global change. Landsc. Urban Plan. 2013, 110, 175–182. [Google Scholar] [CrossRef]
  3. Schelhaas, M.; Nabuurs, G.; Schuck, A. Natural disturbances in the European forests in the 19th and 20th centuries. Glob. Chang. Biol. 2003, 9, 1620–1633. [Google Scholar]
  4. Pausas, J.G.; Bladé, C.; Valdecantos, A.; Seva, J.P.; Fuentes, D.; Alloza, J.A.; Vilagrosa, A.; Bautista, S.; Cortina, J.; Vallejo, R. Pines and oaks in the restoration of Mediterranean landscapes of Spain: New perspectives for an old practice—A review. Plant Ecol. 2004, 171, 209–220. [Google Scholar]
  5. Moreno, J.M.; Vásquez, A.; Vélez, R. Recent history of forest fires in Spain. In Large Forest Fires; Moreno, J.M., Ed.; Backhuys Publishers: Leiden, The Netherlands, 1998; pp. 159–185. [Google Scholar]
  6. Fernandes, P.M. Forest fires in Galicia (Spain): The outcome of unbalanced fire management. J. For. Econ. 2008, 14, 155–157. [Google Scholar]
  7. Carvalho, A.; Carvalho, A.; Martins, H.; Marques, C.; Rocha, A.; Borrego, C.; Viegas, X.; Miranda, I. Fire weather risk assessment under climate change using a dynamical downscaling approach. Environ. Model. Softw. 2011, 26, 1123–1133. [Google Scholar] [CrossRef]
  8. Countryman, C.M. The concept of fire environment. Fire Control Notes 1966, 27, 8–10. [Google Scholar]
  9. Aussenac, G. Interactions between forest stands and microclimate: Ecophysiological aspects and consequences for silviculture. Ann. For. Sci. 2000, 57, 287–301. [Google Scholar] [CrossRef]
  10. Porté, A.; Huard, F.; Dreyfus, P. Microclimate beneath pine plantation, semi-mature pine plantation and mixed broadleaved-pine forest. Agric. For. Meteorol. 2004, 126, 175–182. [Google Scholar] [CrossRef]
  11. Fernandes, P. Combining forest structure data and fuel modelling to classify fire hazard in Portugal. Ann. For. Sci. 2009, 66, 415p1–415p9. [Google Scholar]
  12. Albini, F.A. A phenomenological model for wind speed and shear stress profiles in vegetation cover layers. J. Appl. Meteorol. 1981, 20, 1325–1335. [Google Scholar] [CrossRef]
  13. Harman, I.N.; Finnigan, J.J. A simple unified theory for flow in the canopy and roughness sublayer. Bound. Layer Meteorol. 2007, 123, 339–363. [Google Scholar] [CrossRef]
  14. Ray, D.; Nepstad, D.; Moutinho, P. Micrometeorological and canopy controls of fire susceptibility in a forested Amazon landscape. Ecol. Appl. 2005, 15, 1664–1678. [Google Scholar] [CrossRef]
  15. Tanskanen, H.; Granstrom, A.; Venalainen, A.; Puttonen, P. Moisture dynamics of moss-dominated surface fuel in relation to the structure of Picea abies and Pinus sylvestris stands. For. Ecol. Manag. 2006, 226, 189–198. [Google Scholar] [CrossRef]
  16. Oliveras, I.; Gracia, M.; Moré, G.; Retana, J. Factors influencing the pattern of fire severities in a large wildfire under extreme meteorological conditions in the Mediterranean basin. Int. J. Wildland Fire 2009, 18, 755–764. [Google Scholar]
  17. Róman-Cuesta, R.M.; Gracia, M.; Retana, J. Factors influencing the formation of unburned forest islands within the perimeter of a large fire. For. Ecol. Manag. 2009, 258, 71–80. [Google Scholar] [CrossRef]
  18. Kafka, V.; Gauthier, S.; Bergeron, Y. Fire impacts and crowning in the boreal forest: Study of a large wildfire in western Quebec. Int. J. Wildland Fire 2001, 10, 119–127. [Google Scholar]
  19. Epting, J.; Verbyla, D. Landscape-level interactions of prefire vegetation, burn severity, and postfire vegetation over a 16-year period in interior Alaska. Can. J. For. Res. 2005, 35, 1367–1377. [Google Scholar]
  20. Lee, S.; Lee, M.; Lee, Y.; Won, M.; Kim, J.; Hong, S. Relationship between landscape structure and burn severity at the landscape and class levels in Samchuck, South Korea. For. Ecol. Manag. 2009, 258, 1594–1604. [Google Scholar] [CrossRef]
  21. Proença, V.M.; Pereira, H.M.; Vicente, L. Resistance to wildfire and early regeneration in natural broadleaved forest and pine plantation. Acta Oecol. 2010, 36, 626–633. [Google Scholar] [CrossRef]
  22. Fernandes, P.; Luz, A.; Loureiro, C. Changes in wildfire severity from maritime pine woodland to contiguous forest types in the mountains of northwestern Portugal. For. Ecol. Manag. 2010, 260, 883–892. [Google Scholar] [CrossRef]
  23. Barros, A.M.G.; Pereira, J.M.C. Wildfire selectivity for land cover type: Does size matter? PLoS One 2014, 9, e84760. [Google Scholar] [CrossRef]
  24. Cumming, S.G. Forest type and wildfire in the Alberta boreal mixedwood: What do fires burn? Ecol. Appl. 2001, 11, 97–110. [Google Scholar]
  25. Moreno, J.M.; Viedma, O.; Zavala, G.; Luna, B. Landscape variables influencing forest fires in central Spain. Int. J. Wildland Fire 2011, 20, 678–689. [Google Scholar] [CrossRef]
  26. Diaz-Delgado, R.; Lloret, F.; Pons, X. Spatial patterns of fire occurrence in Catalonia, NE, Spain. Landsc. Ecol. 2004, 19, 731–745. [Google Scholar]
  27. González, J.R.; Palahí, M.; Trasobares, A.; Pukkala, T. A fire probability model for forest stands in Catalonia (north-east Spain). Ann. For. Sci. 2006, 63, 169–176. [Google Scholar]
  28. Moreira, F.; Vaz, P.; Catry, F.; Silva, J. Regional variations in wildfire preference for land cover types in Portugal: Implications for landscape management to minimise fire hazard. Int. J. Wildland Fire 2009, 18, 563–574. [Google Scholar] [CrossRef]
  29. Silva, J.S.; Moreira, F.; Vaz, P.; Catry, F.; Godinho-Ferreira, P. Assessing the relative fire proneness of different forest types in Portugal. Plant Biosyst. 2009, 143, 597–608. [Google Scholar]
  30. Podur, J.J.; Martell, D.L. The influence of weather and fuel type on the fuel composition of the area burned by forest fires in Ontario, 1996–2006. Ecol. Appl. 2009, 19, 1246–1252. [Google Scholar] [CrossRef] [PubMed]
  31. Syphard, A.D.; Keeley, J.E.; Brennan, T.J. Factors affecting fuel break effectiveness in the control of large fires on the Los Padres National Forest, California. Int. J. Wildland Fire 2011, 20, 764–775. [Google Scholar]
  32. Faiella, S.M.; Bailey, J.D. Fluctuations in fuel moisture across restoration treatments in semi-arid ponderosa pine forests of northern Arizona, USA. Int. J. Wildland Fire 2007, 16, 119–127. [Google Scholar] [CrossRef]
  33. Ma, S.; Concilio, A.; Oakley, B.; North, M.; Chen, J. Spatial variability in microclimate in a mixed-conifer forest before and after thinning and burning treatments. For. Ecol. Manag. 2010, 259, 904–915. [Google Scholar] [CrossRef]
  34. Bigelow, S.W.; North, M.P. Microclimate effects of fuels-reduction and group-selection silviculture: Implications for fire behaviour in Sierran mixed-conifer forests. For. Ecol. Manag. 2012, 264, 51–59. [Google Scholar] [CrossRef]
  35. Broncano, M.J.; Retana, J. Topography and forest composition affecting the variability in fire severity and post-fire regeneration occurring after a large fire in the Mediterranean basin. Int. J. Wildland Fire 2004, 13, 209–216. [Google Scholar] [CrossRef]
  36. Bessie, W.; Johnson, E. Relative importance of fuels and weather on fire behaviour in subalpine forests. Ecology 1995, 76, 747–762. [Google Scholar]
  37. Azevedo, J.C.; Possacos, A.; Aguiar, C.F.; Amado, A.; Miguel, L.; Dias, R.; Loureiro, C.; Fernandes, P.M. The role of holm oak edges in the control of disturbance and conservation of plant diversity in fire-prone landscapes. For. Ecol. Manag. 2013, 297, 37–48. [Google Scholar] [CrossRef]
  38. Heinsch, F.A.; Andrews, P.L. BehavePlus Fire Modeling System, Version 5.0: Design and Features; General Technical Report; RMRS-GTR-249; USDA, Forest Service Rocky Mountain Research Station: Fort Collins, CO, USA, 2010. [Google Scholar]
  39. Rothermel, R.C. A Mathematical Model for Predicting Fire Spread in Wildland Fuels; Research Paper INT-115; USDA Forest Service Intermountain Forest and Range Experiment Station: Ogden, UT, USA, 1972. [Google Scholar]
  40. Cruz, M.G.; Fernandes, P.M. Development of fuel models for fire behavior prediction in maritime pine (Pinus pinaster Ait.) stands. Int. J. Wildland Fire 2008, 17, 194–204. [Google Scholar] [CrossRef]
  41. Fernandes, P.; Gonçalves, H.; Loureiro, C.; Fernandes, M.; Costa, T.; Cruz, M.G.; Botelho, H. Modelos de Combustível Florestal para Portugal. In Actas do 6° Congresso Florestal Nacional; Ponta Delgada, Portugal; Sociedade Portuguesa de Ciências Florestais: Lisboa, Portugal, 2009; pp. 348–354. [Google Scholar]
  42. Andrews, P.L.; Chase, C.H. BEHAVE: Fire Behavior Prediction and Fuel Modeling System-BURN Subsystem, Part 2; General Technical Report INT-260; USDA Forest Service Intermountain Forest and Range Experiment Station: Ogden, UT, USA, 1989. [Google Scholar]
  43. Rothermel, R.C.; Wilson, R.A.; Morris, G.A.; Sackett, S.S. Modeling Moisture Content of Fine Dead Wildland Fuels: Input to the BEHAVE Fire Prediction System; Research. Papar INT-359; USDA Forest Service Intermountain Forest and Range Experiment Station: Ogden, UT, USA, 1986. [Google Scholar]
  44. Van Wagner, C.E. Structure of the Canadian Fire Weather Index; Publication n°. 1333; Department of the Environment, Canadian Forest Service: Ottawa, Canada, 1974. [Google Scholar]
  45. Sullivan, A.L.; Knight, I.K. Estimating error in wind speed measurements for experimental fires. Can. J. For. Res. 2001, 31, 401–409. [Google Scholar] [CrossRef]
  46. Wotton, B.M.; Beverly, J.L. Stand-specific litter moisture content calibrations for the Canadian Fine Fuel Moisture Code. Int. J. Wildland Fire 2007, 16, 463–472. [Google Scholar]
  47. Penman, T.D.; Collins, L.; Price, O.F.; Bradstock, R.A.; Metcalf, S.; Chong, D.M.O. Examining the relative effects of fire weather, suppression and fuel treatment on fire behaviour—A simulation study. J. Environ. Manag. 2013, 131, 325–333. [Google Scholar] [CrossRef]
  48. Pereira, M.G.; Trigo, R.M.; da Câmara, C.; Pereira, J.M.C.; Leite, S.M. Synoptic patterns associated with large summer forest fires in Portugal. Agric. For. Meteorol. 2005, 129, 11–25. [Google Scholar] [CrossRef]
  49. Syphard, A.D.; Scheller, R.M.; Ward, B.C.; Spencer, W.D.; Strittholt, J.R. Simulating landscape-scale effects of fuels treatments in the Sierra Nevada, California, USA. Int. J. Wildland Fire 2011, 20, 364–383. [Google Scholar] [CrossRef]
  50. Fernandes, P.; Rigolot, E. Fire ecology and management of maritime pine (Pinus pinaster Ait.). For. Ecol. Manag. 2007, 241, 1–13. [Google Scholar] [CrossRef]
  51. Graham, R.; McCaffrey, S.; Jain, T. Science Basis for Changing Forest Structure to Modify Wildfire Behavior and Severity; General Technical Report RMRS-GTR-120; USDA Forest Service Rocky Mountain Research Station: Fort Collins, CO, USA, 2004. [Google Scholar]
  52. Ruiz-González, A.D. Efecto de las Claras Sobre la Humedad de los Combustibles Muertos en Masas de Pino. In Wildfire 2007, Proceedings of the 4th International Wildland Fire Conference, Seville, Spain, 13–17 May 2007; p. 11.

