Next Article in Journal
Sequestering Carbon in China’s Forest Ecosystems: Potential and Challenges
Next Article in Special Issue
Index for Characterizing Post-Fire Soil Environments in Temperate Coniferous Forests
Previous Article in Journal
Harvesting Carbon from Eastern US Forests: Opportunities and Impacts of an Expanding Bioenergy Industry
Previous Article in Special Issue
Long and Short-Term Effects of Fire on Soil Charcoal of a Conifer Forest in Southwest Oregon
 
 
Correction published on 21 June 2013, see Forests 2013, 4(2), 517.
Article

The Long-Term Effects of Wildfire and Post-Fire Vegetation on Sierra Nevada Forest Soils

Natural Resources and Environmental Science, University of Nevada, Reno, NV 89557, USA
*
Author to whom correspondence should be addressed.
Forests 2012, 3(2), 398-416; https://doi.org/10.3390/f3020398
Submission received: 12 April 2012 / Revised: 12 June 2012 / Accepted: 13 June 2012 / Published: 20 June 2012
(This article belongs to the Special Issue Long-Term Effects of Fire on Forest Soils)

Abstract

:
This paper compares carbon (C) and nutrient contents in soils (Alfisols derived from andesite), forest floor and vegetation in a former fire (1960) and an adjacent forest in the Sagehen Watershed in the Sierra Nevada Mountains of California. Soils from the former fire (now occupied predominantly by Ceanothus velutinus, a nitrogen-fixing shrub) had significantly lower contents of extractable SO42 and P (both Bray and bicarbonate) but significantly greater contents of exchangeable Ca2+ than the adjacent forested site (dominated by Pinus jeffreyii). 15N data suggested that N fixation had occurred in the former fire site, but N contents did not differ between the two sites. O horizon C and nutrient contents did not differ between the two sites, but vegetation C and nutrient contents were significantly greater in the forested than former fire site. These results contrast with those from a nearby, previous study at Little Valley Nevada, also dominated by P. jeffreyii growing on a different soil type (Entisols derived from granite). In the Little Valley study, soil C, N, Ca2+, Mg2+, and K+ contents within the former fire (1981, now also occupied predominantly by Ceanothus velutinus) were greater than in the adjacent forest (Pinus jeffreyii) but soil extractable P contents either did not differ or were greater in the former fire. We conclude that soil parent material is an indirect but strong mediator of the effects of post-fire vegetation on soils in this region, especially with respect to soil P changes, which vary substantially between andesite- and granite-derived soils.

1. Introduction

In forest ecosystem of the Sierra Nevada Mountains of Nevada and California, wildfire was a natural event prior to European settlement. These fires were frequent, with a mean return interval ranging from 10–25 years [1], and for that reason, they often remained beneath the forest canopy because they kept so-called “ladder fuels” at a minimum. After the ill-advised implementation of complete fire suppression around the turn of the 20th century, ladder fuels built up and today the combination of excessive fuels and climate warming, wildfires are usually stand-replacing and often catastrophic [2].
Fire has well-documented immediate effects on soils, including volatilization of nitrogen (N) from burned material, mobilization of NH4+ and SO42− from organic matter in mineral soils, and increases in ionic or otherwise labile fractions of less volatile nutrients (P, K, Ca, Mg) left in ash [3,4]. The net result is often increases in extractable SO42−, exchangeable NH4+, K+, Ca2+, and Mg2+, and increases in pH in surface mineral soils. Changes in soil organic C or N are usually minimal because mineral soils normally do not achieve temperatures necessary for organic matter combustion unless fires are very severe. Changes in ortho-P availability vary considerably depending on the amount of mobilization by fire from organic matter and immobilization with increased Ca2+ [5,6,7].
Fire has major and lasting effects on nutrient budgets of forests ecosystems, both in the short- and long-term. Short-term losses of N by volatilization are usually substantial [3,8,9,10,11,12,13,14]. Wildfire typically burns components of forest ecosystem that have high N concentrations (forest floor and foliage), leaving low-N organic matter such as boles and large branches charred but not combusted [11,12,15]. Over the longer-term, N lost via volatilization during fires can be quickly replaced and even exceeded by inputs from N fixers after fire if they are present [16,17,18,19,20]. In our experience, however, replenishment of the C lost during forest fire usually requires the re-growth of forest vegetation, which can be greatly hindered by competition from post-fire shrubs [17].
One of the largest of the more recent wildfires was the Donner Ridge fire, which burned over 15,000 ha in the Tahoe National Forest near Truckee, California during four days in August, 1960. The fire burned part of what is now the Sagehen experimental forest, allowing a post-fire comparison of stream water quality in adjacent burned and unburned areas at Sagehen [18]. We relocated the fire boundary sampled by Johnson and Needham [18] and sampled soils and vegetation on either side of it in the present study. We were especially interested in comparing the results from this site with those of a previous, similar study in Little Valley, Nevada a site located on different parent material about 50 km south of Sagehen. In the Little Valley study, we compared the C and nutrient contents of soils, O horizons, and vegetation in a site burned two decades previously (1981) with an adjacent forest [17]. We found that soils (Entisols derived from granite) and O horizons in the former fire, now dominated by Ceanothus velutinus, an N-fixing shrub, had significantly greater contents of bicarbonate-extractable P (but not Bray P), exchangeable K+, Ca2+, and Mg2+ than the adjacent forest. Carbon and N in soils from the former fire did not differ significantly from those in the adjacent forest, but total ecosystem C was significantly lower in the former fire (because of large differences in vegetation content), and ecosystem N was significantly greater in the former fire (because of differences in soils and O horizon N content). The differences in N could be accounted for by a reasonable rate of N-fixation (from 40 to 70 kg ha−1 yr−1), but the differences in soil and ecosystem K+, Mg2+, and especially Ca2+ were many fold greater than could be accounted for by ash inputs from the burned vegetation. We hypothesized that recycling by post-fire shrub vegetation accounted for the latter differences.
The Sagehen and Little Valley sites are similar in vegetation, climate, and fire history but differ in soil parent material: soils at Sagehen are derived from andesite whereas those in Little Valley are derived from granite. The difference in soil type was of special interest because previous work had shown that andesite-derived soils typically have greater exchangeable base cation but much lower extractable P concentrations than granite-derived soils [21].

2. Experimental Section

2.1. Sites

2.1.1. Sagehen

The site is located at the boundary of the Donner Ridge fire in the Sagehen watershed near Truckee, California. The forested site may have experienced fire in the past, but was not burned in the Donner Ridge fire. It was located just inside the boundary approximately at the “unburned, hill” site identified by Johnson and Needman [18], and the burned site was located approximately 100 m to the east, within the former fire. The elevation of the site is 1944 m; mean annual temperature is 5.2 °C and mean annual precipitation is 850 mm, 80% of which falls as snow. Vegetation in the forest site consisted of an overstory of Jeffrey pine (Pinus jeffreyii Grev. and Balf.) with occasional white fir (Abies concolor Godr. and Glend. Lindl.) and lodgepole pine (Pinus contorta Dougl). Understory in the forest site was dominated by prostrate ceanothus (Ceanothus prostratus Benth.) and greenleaf manzanita (Arcotstaphylos patula Greene) with occasional snowbrush (Ceanothus velutinus Douglas ex Hook.) minor amounts of bush chinquapin (Chrysolepis sempervirens (Kellog) Hjelmqvist), creeping snowberry (Symphoricarpos mollis Nutt.), wax currant (Ribes cereum Douglas), bitter cherry (Prunus emarginata (Douglas ex Hook.) D. Dietr.), Utah serviceberry (Amelanchier utahensis Koehne), wooly mule’s ears (Wyethia mollis A. Gray), yellow rabbit brush (Chrysothamnus viscidiflorus (Hook.) Nutt.), rose thistle (Cirsium andersonii (A. Gray) Petr.), bottlebrush squirreltail (Elymus elymoides (Raf.) Swezey), Holboell’s rockcress (Arabis holboellii Hornem.), antelope bitterbrush (Purshia tridentate (Pursh) DC.), and Sandberg bluegrass (Poa seconda J. Presl). Overstory on the burned site consisted of widely scattered Jeffrey pine, with occasional white fir and lodgepole pine. Understory in the former fire was dominated by snowbrush and manzanita with minor amounts of snowberry, bitter cherry, serviceberry, mule’s ears, wax currant, chinquapin, squirrel tail, rabbit brush, Anderson’s thistle, and Sandberg’s bluegrass. Soils in both areas are the Jorge series, Loamy-skeletal, isotic, frigid Andic Haploxeralfs derived from andesite. According to Johnson and Needham [18], vegetation in the burned area before the fire was very similar to the forested site in this study: an overstory of white fir, ponderosa pine (Pinus ponderosa Dougl.), Jeffrey pine and lodgepole pine (Pinus contorta Dougl), and understory consisted of snowbrush, prostrate ceanothus, greenleaf manzanita, rabbit brush, wooly mule’s ears, and wax currant.

2.1.2. Little Valley

The Little Valley fire site, the results of which have been previously published [17], is located approximately 30 km southwest of Reno, Nevada in the eastern Sierra Nevada Mountains. Elevation in the valley ranges from 2010 to 2380 m, and elevation at the site is 2010 m. The climate is characterized by warm, dry summers and cold winters; and the major hydrologic event is snowmelt. Mean annual air temperature near the valley floor is 5 °C and mean annual precipitation is 550 mm, approximately 50% of which falls as snow. Vegetation at the study site is dominated by 110–130 year old jeffrey pine (Pinus jeffreyii Grev. and Balf.). Soils are the Corbett series, sandy, fine-loamy, mixed frigid Typic Xeropsamments derived from colluvium of decomposed granite.
The entire valley, as well as much of the eastern Sierra Nevada mountains, was logged and probably burned during the Comstock mining era between 1870 and 1890. An area just east of the valley, which had consisted of 100-year-old jeffrey pine forest, burned in a stand-replacing wildfire in 1981. As is usually the case, the wildfire did not consume much of the large standing woody tissues (tree boles and large branches); and thus the area was salvage logged for merchantable timber (snags) the following year. Since that time, the burned area has been dominated by snowbush (Ceanothus velutinus Dougl.), a species that often invades after fire and fixes N [16,19,20] with lesser amounts of manzanita (Arcostaphylos patula Greene) and spotty regeneration of Jeffrey pine planted in 1985.

2.2. Methods

2.2.1. Sagehen

In June–July 2006 (46 years after the fire), forest floor and soils from the sites were sampled in three 0.05 ha circular plots within each area (former fire and forest) with six randomly-located replicates (ranging from approximately 2 to 7 m from one another) taken within each plot. The forest floor was sampled by horizon (Oi, Oe, Oa, and other, the latter being a category of miscellaneous composition of bark, reproductive parts, and woody material less than 2.5 cm in diameter) within a 698 cm2 ring. Once the forest floor was removed, a surface set of mineral soil samples was taken at each point with a trowel to a depth of 5 cm, taking care to sample depth-proportionally such that an even volume of soil was taken with depth over the 5 cm increment. In a separate location, soil samples were taken in 15 cm intervals to a depth of 90 cm using the rotary coring device described by Rau et al. [22]. The method utilizes a 7.62 cm internal-diameter diamond-tipped core device manufactured by Diteq™, and is driven by a two-person rotary Briggs and Stratton™ power head, allowing it to core through rocks and soil with minimal compaction. Each sample increment was extracted before the core was driven to the next depth increment. All soil samples from surface and cores were bagged individually, brought back to the lab, dried at 100 °C for 48 hours, and weighed. Cores were then sieved to 2 mm, and bulk density and % > 2mm were calculated for each sample.
O horizon samples were ground using a Wiley Mill for total nutrient analysis. Subsamples of forest floor components were analyzed for total N, P, K, Ca, Mg, and S at A&L Agricultural Laboratories, Modesto, CA. Total N was analyzed at A&L by Kjeldahl digestion followed by colorimetric ammonium analysis. Phosphorus, K, Ca, Mg, and S in vegetation and litter were analyzed using a Jarrell Ash ion coupled plasma spectrophotometer (ICP; Thermo Jarrell Ash Corp., Franklin, MA, USA) after microwave digestion (Method 985.01, Association of Official Analytical Chemists) in a nitric acid hydrogen/peroxide mixture. Total C and N were analyzed using a dry combustion C and N analyzer (LECO, St. Joseph, MI, USA) at the Oklahoma State University Soil, Water, and Forage Analytical Laboratory (Stillwater, OK, USA).
The <2 mm fraction of all soils were analyzed for total C, total N, NH4+ and NO3 at Oklahoma State University Soil, Water, and Forage Analytical Laboratory (Stillwater, OK, USA). Total C and N were analyzed using a dry combustion C and N analyzer (LECO, St. Joesph, MI, USA). For soil NH4+ and NO3, ten g of soil was shaken with 20 mL of 2 M KCl for 30 minutes then filtered and analyzed using a Quick Chem 800 flow-injection analyzer (Lachat, Milwaukee, WI, USA). Soil subsamples were then sent to A&L Western Agricultural Laboratories (Modesto, CA, USA) for analysis of the remaining nutrients. Samples were analyzed for Bray extractable P (2 g soil in 0.5 M HCl plus 1 M NH4F) and bicarbonate-extractable P (2 g soil in 50 mL 0.05 M NaHCO3-) using a Jarrell Ash ion-coupled plasma spectrophotometer (ICP; Thermo Jarrell Ash Corp., Franklin, MA, USA) and SO42, exchangeable Ca2+, K+, and Mg2+ (10 g soil in 50 mL 1 N ammonium acetate) using ICP analyses. Subsamples of soils ground into a powder and weighed for analysis of 15N. The weighed samples were analyzed at the University of California, Davis, using a Europa Scientific ‘Integra’ analyzer.
Six replicate ceramic cup falling head lysimeters (Soil Moisture Inc) were installed to a depth of 20 cm in each plot to collect soil solution. Tension was set to 0.4 kPa and solutions were collected in once in April 2007 and analyzed for NH4+, NO3, SO42, and PO43 using high performance ion exchange chromatography (Dionex) at the Oklahoma State University Soil, Water and Forage Analytical Laboratory. Because of the relatively dry year, it was only possible to collect soil solution one time.
Six replicate resin lysimeters consisting of Rexyn® 300 (H–OH) ion exchange resin according to the design developed by Susfalk and Johnson (2002) were installed at a depth of 15 cm in each plot in the summer of 2006. Resin lysimeters were removed in the spring of 2007. Resins were recovered from the lysimeters and extracted by shaking in 100 mL of 1 M KCl for one hour and analyzed with either a Quick Chem 800 flow injection auto analyzer (Lachat, Milwaukee, WI, USA) or an Alpkem segmented flow auto analyzer (Pulse Instrumentation Ltd., Saskatoon, SK, Canada) for ortho-P, NH4+, and NO3. Samples were analyzed at the Oklahoma State University Soil, Water, and Forage Analytical Laboratory (Stillwater, OK, USA).
In October 2011, six randomly-located 0.04 ha plots were established in each site (burned and unburned) for vegetation and fuels inventory. All trees of pole size and larger, i.e., ≥10.2 cm DBH, within these plots were measured for DBH and tallied by species. The DBH values were then used to derive above-ground tree biomass by plot according to the formulas of Gholz et al. [23].
Downed and dead fuels inventories for the 100-h and 1000-h timelag categories [24] were also conducted. For 100-h (>2.5 to ≤7.6 cm diameter) fuels, a single 4-m2 plot was established with the same plot center as that of each of the 0.04-ha plots used for overstory measurements, and collection of these fuels permitted a weight determination by direct measurement of samples dried to a constant weight. For 1000-h (>7.6 cm diameter) fuels, a single 54-m2 circular plot was established, also with the same plot center as that of each 0.04-ha plot, and the lengths and diameters at the midpoint of each segment were measured for use in calculating an estimate of volume according to the Huber formula [25]. Collection of 10 log sections from random locations, measuring their dimensions, and then drying and weighing them provided a density constant for conversion of volume to dry weight by plot.
The 54-m2 circular plots used for measuring 1000-h fuels were also used for mapping of shrub and herbaceous understory species, which permitted expression of their prevalence on a percent ground cover basis. In order to express their prevalence on a dry weight basis as well, 10 samples of known ground cover area were collected of each species from random locations, dried to a constant weight, and weighed. For shrub species, each sample consisted of all tissues occupying a ground area of 0.093 m2, while 0.01 m2 was used for herbaceous species. These species-specific weight constants permitted the conversion of percent cover to dry weight within each plot. In addition to the determination of the cover and weights by species, those of all species in total were determined.
Seedling (≤1.37 m tall) and sapling (>1.37 m tall and ≤10.1 cm DBH) inventories were also conducted which encompassed counts by species within the two size classes. Seedling counts were performed using 40-m2 circular plots established with the same centers as those for the 0.04-ha plots used in the overstory measurements, while the sapling counts relied upon the aforementioned 54-m2 plots involved with the 1000-h fuel and understory vegetation measurements.
Tree nutrient content was estimated from biomass estimates by component (foliage, branch, bole bark, bole wood) combined with previous analyses of nutrient concentrations within these tissues from nearby sites [12,17]. Understory nutrient content was estimated from biomass estimates combined with nutrient analyses of samples taken from the sites as described above for O horizon samples.

2.2.2. Little Valley

Between 1997 and 2001 (approximately two decades after the fire), we established four 0.1 ha plots in the shrub area (former fire) and three in the adjacent forested with the same soils, slope and aspect [17]. Within each shrub plot, six randomly established 1 m2 subplots were established for measurement of current (1997 and 2001) aboveground shrub, litter and soil C and nutrient pools. Within each subplot, all aboveground vegetation was removed, sorted by species and component (foliage and woody), weighed, and subsampled for moisture content. After the vegetation was removed, all litter within a 15 cm diameter ring was removed by horizon (Oi, Oe, and Oa) and transported to the laboratory for drying, weighing, and analyses. After litter was removed, the soil was sampled at three depths corresponding to the A (0–7 cm) and AB (7–20 cm) and BC (20–40 cm) horizons. Bulk density was determined by the core method for each horizon at three of the sampling points in each plot. Coarse fragment contents were negligible. Large woody debris mass was estimated in each plot by measuring the length and diameter of each piece of debris within the plot, calculating the volume and applying density measurements from subsamples.
Within the forested plots, all trees were measured at dbh and tree biomass and nutrient contents were estimated as described above. Large woody debris, O horizon, and soil mass and nutrient contents within the forested plots were estimated as described above. Understory in the forested plots was negligible.
Subsamples of vegetation and litter components were taken from the site and analyzed for total C and N using a Perkin-Elmer 2400 CHN analyzer and for P, K, Ca, K, Mg, and S at A&L Agricultural Laboratories, Modesto, CA. At A&L, P, K, Ca, K, Mg, and S in vegetation and litter were analyzed by inductively-coupled plasma emission spectroscopy (ICP) after microwave digestion using a nitric acid hydrogen peroxide digestion mixture. Soils were analyzed at A&L for exchangeable cations (10 g soil in 50 mL 1 N ammonium acetate followed by ICP analyses for Ca2+, Mg2+, K+, and Na+), extractable P analyzed by the bicarbonate (2 g soil in 50 mL 0.05 M NaHCO3) and the weak Bray method (0.5 M HCl plus 1 M NH4F), and extractable SO42− (by ICP analysis on the ammonium acetate extraction).

2.2.3. Statistical Analyses

Statistical analyses at the Sagehen site were conducted using Microsoft Excel for Student’s t-tests for treatment effects (former fire and forest, n = 3 each) in each site and for each soil horizon (n = 6 per plot, for 18 samples each in forest and former fire), and linear models in DataDesk for comparisons (treatment and soil depth by site). Statistical analyses on soil concentrations were conducted on unbulked samples, but statistical analyses on O horizon and soil contents were on samples bulked by plot. The data showed significant skew so all data were log-transformed to achieve approximate normal distributions prior to statistical analyses. Statistical analyses at the Little Valley site were performed using student’s t-tests in Microsoft Excel software [17].
As the reviewers of this paper have strongly pointed out, the experimental design of both of these studies can be criticized as invalid because of the often-cited issue of pseudo-replication [26]. Unfortunately, it simply is not possible to avoid such a criticism in wildfire studies because it is not feasible to replicate wildfires in a statistically rigorous fashion. Nor, for that matter, is it possible to replicate planet earth in a statistically rigorous fashion for global C studies, for example. It should also be noted that we did not know in advance that these wildfires would take place, and therefore we were not able to obtain pre-treatment samples. Such is usually the case with wildfires, with one nearby notable but very serendipitous exception noted [27]. The authors feel that while such a criticism can be leveled in each case, it does not warrant the abandonment of such studies and thus we have forged ahead to present this data, with the caveat of pseudo-replication and lack of pre-treatment data duly noted. We also note the opposing view of Oksanen [28] who opines that “The concept of ‘pseudoreplication’ amounts to entirely unwarranted stigmatization of a reasonable way to test predictions referring to large-scale systems.”

3. Results and Discussion

3.1. Sagehen Site Results

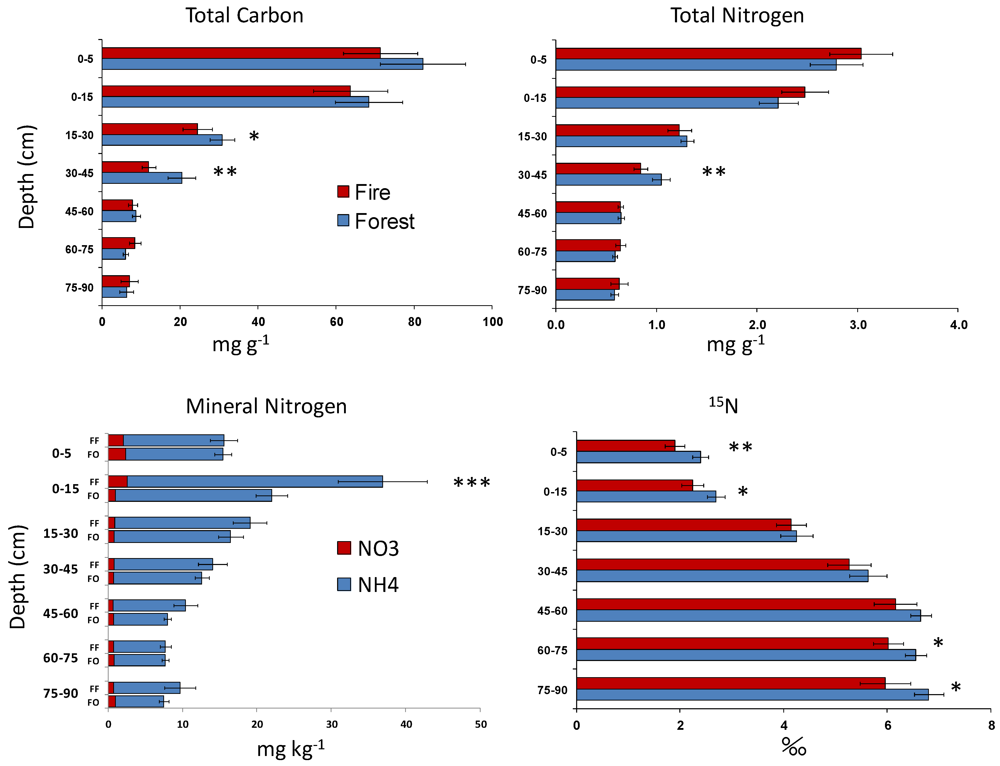
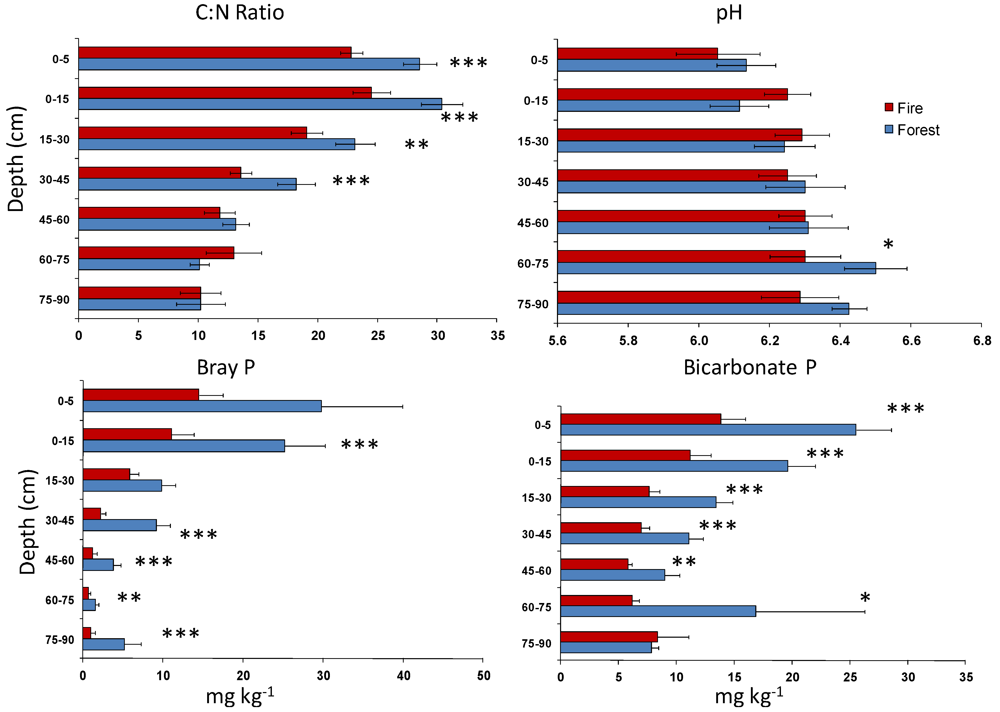
3.1.1. Soil Physical and Chemical Properties
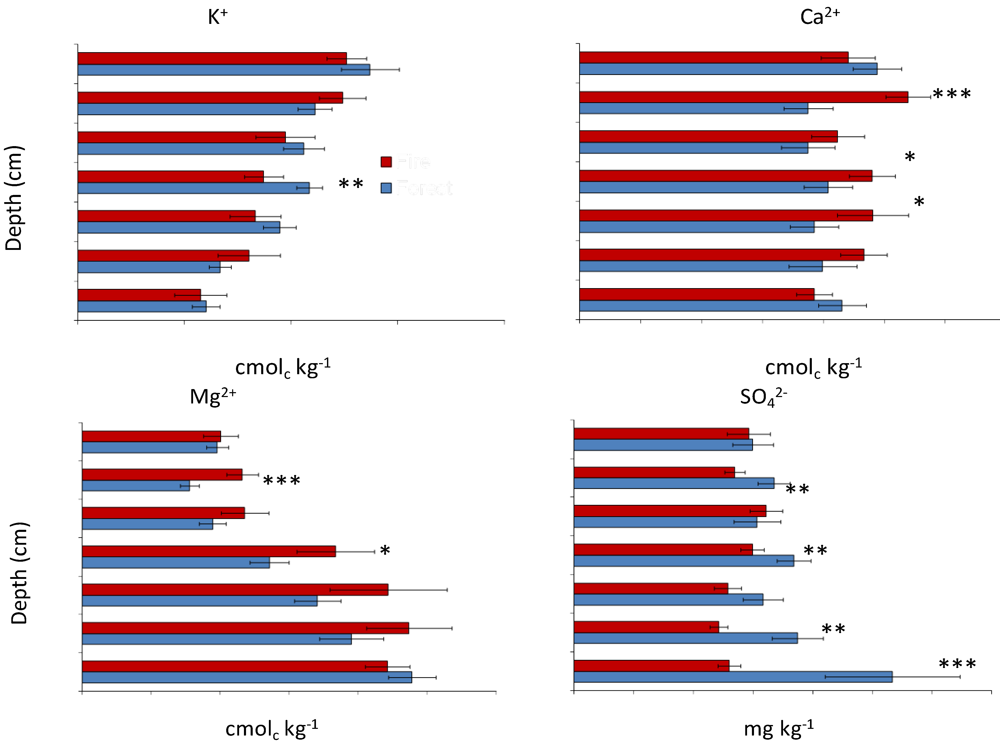
Site (former fire versus forest) was significant for C:N ratio, 15N, Bray and bicarbonate P, and extractable SO42, all of which were lower in the former fire than in the forest (Figure 1, Figure 2, Figure 3 and Table 1 and Table 2). Site was also significant for NH4+, exchangeable Ca2+ and Mg2+, all of which were higher in the former fire (Figure 1 and Figure 3; Table 2). Site was not significant for bulk density, % > 2 mm, total C, total N, or exchangeable K+. Depth was significant for bulk density and all measured nutrients except exchangeable Ca2+ and extractable SO42. Carbon, N, C:N ratio NH4+, NO3, mineral N, and Bray P concentrations decreased substantially with soil depth whereas 15N and Mg2+ increased with depth.
Table 1. Soil physical properties of adjacent former fire (Fire in 1960) and unburned forested sites at Sagehen, California.
DepthFireForestFireForest
(cm)Bulk Density (g cm−2)% > 2 mm
0–150.89 ± 0.080.78 ± 0.0949 ± 650 ± 4
15–301.33 ± 0.081.51 ± 0.1154 ± 463 ± 4 *
30–451.67 ± 0.131.57 ± 0.1037 ± 553 ± 6 **
45–601.50 ± 0.091.56 ± 0.1232 ± 642 ± 6
60–751.79 ± 0.321.46 ± 0.1336 ± 542 ± 6
75–901.61 ± 0.211.25 ± 0.1732 ± 243 ± 6
* and ** indicate statistically significant differences, student’s t-test, p < 0.10 and 0.05, respectively.
Table 2. Probability values for differences in site, depth and site × depth of log transformed soil physical and chemical data from the Sagehen site.
SiteDepthSite × Depth
Degrees of Freedom165
Bulk Density0.22<0.010.56
%>2mm0.380.40.83
pH0.430.020.63
Total C0.12<0.010.6
Total N0.96<0.010.50
C:N Ratio<0.01<0.010.17
15N<0.01<0.010.62
NH4+0.04<0.010.53
NO30.42<0.010.28
Mineral N0.04<0.010.35
Bray P<0.01<0.010.15
Bicarbonate P<0.01<0.010.73
K+0.17<0.010.63
Ca2+0.030.780.12
Mg2+0.02<0.010.2
SO42−<0.010.310.05
Bicarbonate P, SO42, and Ca2+ showed no particular pattern with depth. The site × depth interaction was significant only for extractable SO42 (Figure 1, Figure 2, Figure 3 and Table 2).
Figure 1. Total C, total N, mineral N, and 15N in the Sagehen soils. *, ** and *** indicate statistically significant differences, student’s t-test on log transformed data. Standard errors are shown.
Forests 03 00398 g001
Although site was not significant for total C concentrations overall, the forest site generally had higher concentrations than the former fire in the surface depths (significant at the 15–30 and 30–45 cm depths) (Figure 1). Similarly, although site was not significant for total N overall, N was slightly but significantly greater in the forested than in the former fire site at the 30–45 cm depth. Mineral N was greater in the former fire site at most depths but significantly so only in the 0–15 cm depth. 15N was lower in the former fire at all depths and significantly so at the 0–5, 0–15, 60–75 and 75–90 cm depths. C:N ratio was consistently and significantly lower in the former fire at all depths up to 45 cm (Figure 2). The largest and most consistent differences between the sites were for Bray and bicarbonate P (Figure 2) Bray P was lower in the former fire at all depths and significantly so in all but the 0–5 and 15–30 cm depths. Bicarbonate P was also lower in the former fire and significantly so in all but the 75–90 cm depth. Differences in K+ were inconsistent and significant only at the 30–45 cm depth where the forested site was slightly higher (Figure 3). Calcium was greater in the former fire site at most depths, and significantly so at the 0–15, 30–45, and 45–60 cm depths. Similarly, Mg2+ was greater in the former fire site at all but the 75–90 cm depth and significantly so in the 0–15 and 30–45 cm depths. Sulfate was greater in the forested site at most depths and significantly so at the 0–15, 30–45, 60–75, and 75–90 cm depths (Figure 3).
Figure 2. C:N ratio, pH, Bray P, and bicarbonate P in the Sagehen soils. *, ** and *** indicate statistically significant differences, student’s t-test on log transformed data. Standard errors are shown.
Forests 03 00398 g002
Figure 3. Exchangeable K+, Ca2+, Mg2+ and extractable SO42 in the Sagehen soils. *, ** and *** indicate statistically significant differences, student’s t-test on log transformed data. Standard errors are shown.
Forests 03 00398 g003

3.1.2. O horizon and Mineral Soil Contents

There were no significant differences in O horizon C, N, K, Ca, Mg or S, but O horizon P contents were greater in the forest than in the former fire, consistent with the soil concentration and content data, which showed greater Bray and bicarbonate P contents in the former fire (Figure 2 and Table 3). Both Bray and bicarbonate P contents were greater in the forest than in the former fire, but only the Bray P differences were statistically significant. Soils in the former fire contained significantly greater total N, exchangeable Ca2+, and exchangeable Mg2+ than soils in the forest. Similarly, the former fire contained significantly greater total (O horizon + mineral soil) contents of N, Ca, and Mg than the forest area whereas the forest area contained greater total P content (Bray and bicarbonate).
Table 3. Carbon and nutrient contents of O horizons and soils in adjacent previously former fire (Fire in 1961) and unburned forested sites at Sagehen, California. Mg ha−1 for C, kg ha−1 for nutrients. Contents of K, Ca, and Mg in soils represent exchangeable values and contents of S in soils represent extractable values. Standard errors are shown.
O HorizonSoil (to 90 cm)Total
Former FireForestFormer FireForestFormer FireForest
Mg ha−1 or kg ha−1
Total C45.6 ± 2.249.1 ± 5.299.6 ± 10.4103.5 ± 7.4145.2 ± 8.3152.6 ± 4.3
Total N1,186 ± 331,100 ± 706,321 ± 3855,366 ± 415 *7,507 ± 3806,466 ± 357 *
NH4+–N92 ± 1059 ± 5
NO3–N7 ± 15 ± 0.3
Mineral N99 ± 1264 ± 5
Bray P52 ± 779 ± 6 **17 ± 143 ± 9 **69 ± 8123 ± 11 **
Bicarb P52 ± 779 ± 6 **56 ± 871 ± 12109 ± 15150 ± 6 *
K+104 ± 27129 ± 142,558 ± 3062,036 ± 1942,662 ± 3322,165 ± 201
Ca2+1,392 ± 1111,261 ± 31613,567 ± 17369,135 ± 1555 *14,959 ± 179510,396 ± 1330 *
Mg2+135 ± 5162 ± 193,554 ± 6752,348 ± 253 *3,689 ± 6702,510 ± 246 *
SO42−–S65 ± 1077 ± 420 ± 121 ± 385 ± 1098 ± 6
*, **, and *** indicate statistically significant differences at p < 0.10, 0.05, and 0.01, respectively. Student’s t-test on log transformed data.

3.1.3. Soil Solution and Leaching

Table 4 shows NH4+, NO3, mineral N, ortho-P, and SO42 concentrations in soil solutions collected by ceramic cup lysimeters in the Spring of 2007 (during snowmelt) and Table 5 shows the fluxes of NH4+, NO3, mineral N, and ortho-P leaching rates for the 2006–2007 water year as measured by resin lysimeters at the two sites. Neither data set indicates a significant difference in the leaching of NH4+, NO3, or mineral N, and the ceramic cup data shows no difference in SO42. (It is not possible to analyze resin lysimeters for SO42). The ceramic cup data indicates a significantly lower leaching rate for ortho-P in the former fire site, which is consistent with the differences in soil and O horizon data which is also shown lower values in the former fire site (Figure 2 and Table 3). The resin lysimeter data do not show any difference in ortho-P leaching rates, however.
Table 4. Soil solution concentrations (averages and standard errors) from ceramic cup lysimeters collected in April 2007. Probabilities of differences between sites from Student’s t-tests were conducted on log transformed values are shown.
Former fireForestP
mg L−1
NO3–N0.74 ± 0.320.35 ± 0.110.22
NH4+–N0.28 ± 0.090.39 ± 0.150.27
Mineral N1.02 ± 0.360.54 ± 0.110.18
Ortho-P0.03 ± 0.0030.13 ± 0.090.02
SO42−–S2.23 ± 0.132.19 ± 0.200.41
Table 5. Leaching fluxes during the 2006–2007 water years from resin lysimeters. Probabilities of differences between sites from Student’s t-tests were conducted on log transformed values are shown.
Former FireForestP
kg ha−1
NO3–N0.27 ± 0.100.35 ± 0.280.34
NH4+–N0.14 ± 0.040.18 ± 0.110.33
Mineral N0.41 ± 0.120.53 ± 0.380.33
Ortho-P0.86 ± 0.040.90 ± 0.130.35

3.2. Comparisons to the Little Valley Study

The results of this study are consistent with those from a previous study in Little Valley, Nevada where we compared soils (Entisols derived from granite) from a former fire (1981, sampled 16–20 years after the fire) and forested area in some cases and different in others. Figure 4 and Figure 5 depict the ecosystem contents of C and nutrients at these two sites. At the Sagehen site, vegetation biomass was not estimated until 6 years after the soil and O horizon contents were measured, so the comparison is not exact; but given the length of time since the fire (46 years for soil and 52 years for vegetation), we feel that the values are approximately correct. In these figures, we have plotted the contents of the 0–45 cm soil depths separately from the 45–90 cm depths so that they are approximately comparable to the depths sampled at Little Valley (40 cm). In the Sagehen case, some trees within the former fire were survivors from the fire, and these are shown separately from the new regeneration. There were no tree survivors within the former fire at Little Valley.
Not surprisingly, vegetation C and nutrient contents were significantly greater in the forest than in the former fire at both sites, and vegetation contained approximately half of the total ecosystem C content. For the Sagehen site, this was true even if surviving trees were included. Carbon and most nutrient (except S) contents in O horizons were greater in the former fire than in the forest site at Little Valley but differences were small and insignificant at Sagehen except in the case of P. Soil C and N contents to the 40 to 45 cm depth were similar at the two sites. Differences in soil C and N content between former fire and forest areas were small at both sites and not significantly different at Little Valley. At the Sagehen site, soil C to a depth of 45 cm was significantly (p < 0.10) greater in the forest site, but when values for the entire 95 cm depth are considered, differences between former fire and forest sites are not significant. Differences in soil N content between former fire and forest sites to depths of 40 and 45 cm were not significant at either site, but total N in the former fire was significantly greater than in the forest at Sagehen when the entire 95 cm profile was considered.
Figure 4. Carbon, nitrogen, and phosphorus distribution in former fire and forest areas of the Sagehen site. Soil Bray and bicarbonate Pare shown separately. *, ** and *** indicate statistically significant differences in vegetation, O horizon, and soil content, respectively. For the Sagehen site, soil values to the 45 cm depth are shown for comparison with Little Valley and soil values to 95 cm are shown separately as negative numbers below the 0 line.
Forests 03 00398 g004
Figure 5. Potassium, calcium, magnesium and sulfur distribution in former fire and forest areas of the Sagehen site. Soil values for potassium, calcium, magnesium represent exchangeable values, and soil values for sulfur represent extractable SO42. *, ** and *** indicate statistically significant differences in vegetation, O horizon, and soil content, respectively. For the Sagehen site, soil values to the 45 cm depth are shown for comparison with Little Valley and soil values to 95 cm are shown separately as negative numbers below the 0 line.
Forests 03 00398 g005
The Little Valley and Sagehen sites differed greatly in soil extractable P contents, especially for Bray P. These results are consistent with previous comparisons of these two soil types, where extractable P levels are much greater in soils derived from granite than those derived from volcanic (andesite, lahar, basalt) in this region [21]. There were no significant differences between former fire and forest sites in Bray P at Little Valley, but bicarbonate P was greater in the former fire than in the forest site. At Sagehen, both Bray and bicarbonate P were significantly lower in the former fire than in the forest site. Soil exchangeable K+, Ca2+ and Mg2+ were considerably greater at Sagehen than at Little Valley, but the effects of burning were similar: exchangeable K+, Ca2+ and Mg2+ were significantly greater in the former fire than in the forest site at Little Valley, and the same was true of exchangeable Ca2+ and Mg2+ at Sagehen for both the 45 and 95 cm depths. Soil SO42 was somewhat lower at Sagehen (to 45 cm) than Little Valley, but in both cases there was no effect of burning and soil contents were small in comparison to O horizon and vegetation contents.
Similar to the results from Sagehen, soils from the former fire of the Little Valley site had significantly greater concentrations of NO3 and NH4+ at the 0–7 cm depth [19]. Deeper samples were not analyzed for NO3 and NH4+ at Little Valley. Stein [19] and Stein et al. [20] also measured leaching in the Little Valley site using both ceramic cup and resin lysimeters, as was the case in the Sagehen study. They hypothesized that NO3 leaching would be greater in the former fire because of the presence of N fixers. While soil solution NO3 concentrations sampled with ceramic cup lysimeters were greater in the former fire, the differences were neither large nor statistically significant. Resin lysimeter data showed either no differences or slightly greater leaching rates of NO3 and NH4+ in the forest than in the former fire. Thus, the Little Valley and Sagehen sites are similar with respect to N leaching in that there was no elevation in the former fire despite the presence of N-fixers. In contrast to the results from Sagehen, however, Stein [29] and Stein et al. [30] found no differences in ortho-P leaching at Little Valley.

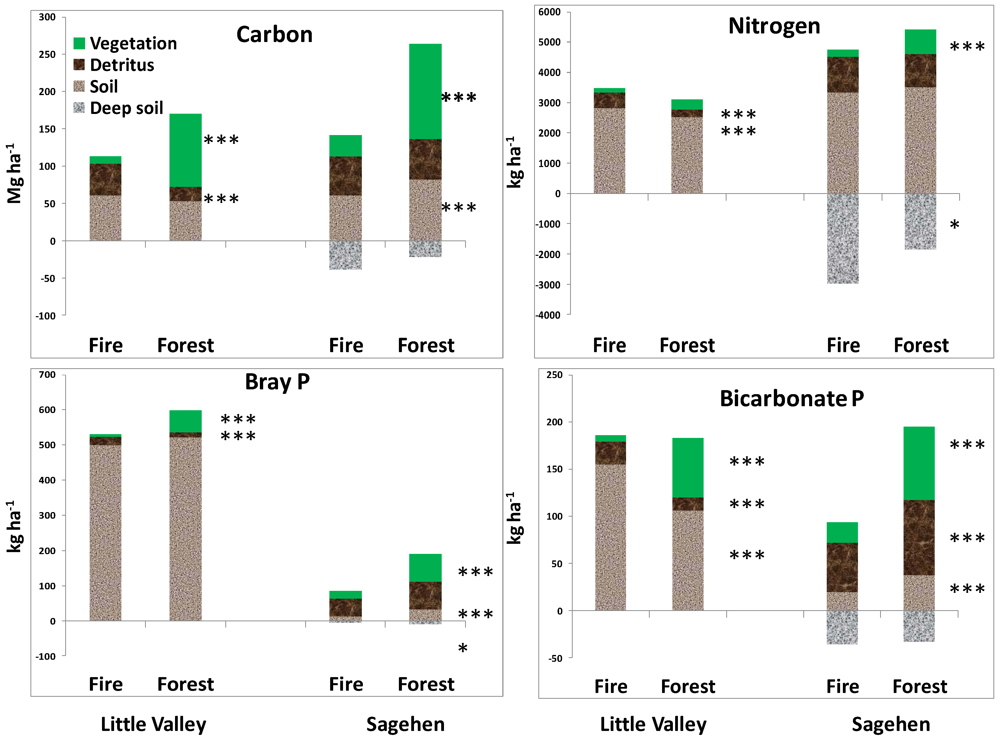
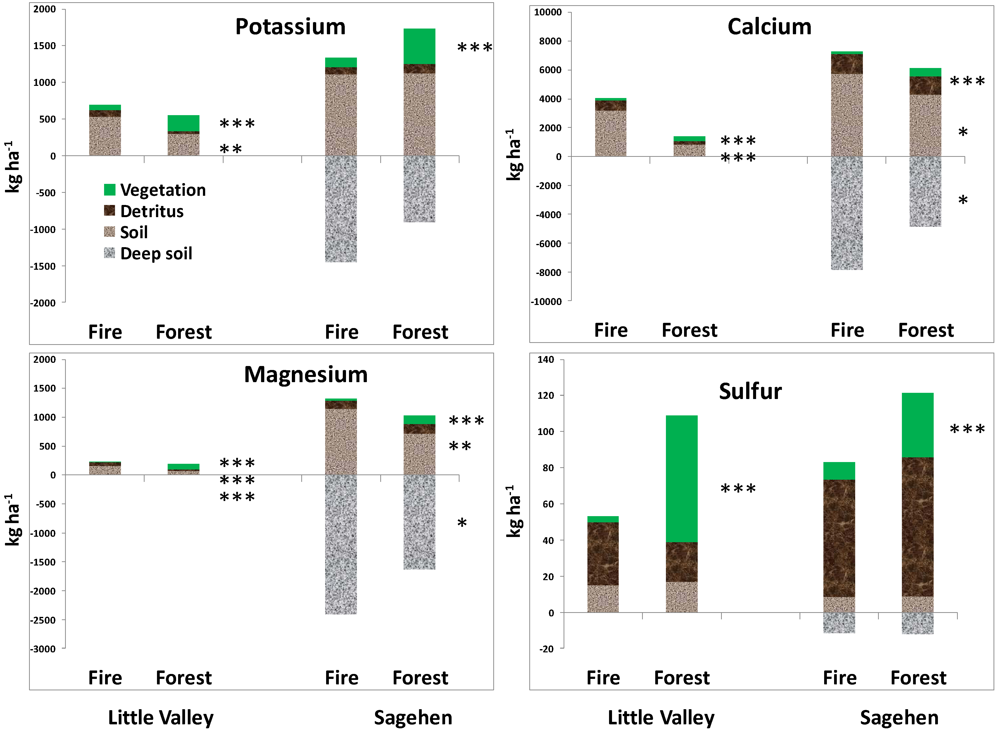
3.3. Potential Reasons for the Differences between Sites

The immediate effects of fire on soils are well-known [3,4]. They include volatilization of N, mobilization of NH4+ from soil organic matter, increases in pH and exchangeable K+, Ca2+, and Mg2+ as a result of ash inputs, increases in SO42 from oxidized organic S and desorption, and variable effects on extractable P depending on pH and Ca2+ availability. The longer term effects of fire will depend on how long these immediate effects persist and how post-fire vegetation affects soil properties. In the Little Valley study, we concluded that ecosystem C contents would not return to pre-fire levels until forest vegetation was re-established. Given the preponderance of vegetation C over O horizon and soil contents at Sagehen, it seems quite safe to draw the same conclusion there. In the Little Valley study, we also concluded from the differences in ecosystem N content that N lost during the fire was more than replaced by N-fixation over the subsequent decades. At Sagehen, we did not statistically analyze ecosystem N contents because of uncertainties due to the different timing of vegetation and O horizon/soil sampling. Given the presence of N-fixing vegetation in the former fire at Sagehen, it seems safe to assume that at least some of the N lost by volatilization during the fire has now been replaced by N fixation there, as was the case in Little Valley. The 15N data support that hypothesis in that soil values within the former fire were closer to atmospheric than those in the forest. In the Little Valley study, we concluded from estimates of vegetation and O horizon contents in unburned forests that the observed differences in exchangeable Ca2+ could not possibly have come from ash input and we hypothesized that they were a result of high rates of Ca cycling by post-fire vegetation [17]. Soil exchangeable Ca2+ contents at Sagehen are considerably greater than those at Little Valley, but it is also the case that differences in exchangeable Ca2+ contents between former fire and forest sites exceed current Ca contents in O horizons and vegetation in unburned forests. Given that the post-fire vegetation at Sagehen is very similar to that in Little Valley (dominantly Ceanothus velutinus), at least some of the differences in soil exchangeable Ca2+ could be due to recycling by post-fire vegetation as well. Similarly, exchangeable K+ and Mg2+ contents in the former fire at Little Valley are greater than in the forest, and the differences cannot be accounted for by K and Mg contents in O horizons and vegetation in unburned forests, although the disparities in these cases are not as extreme as for Ca. Exchangeable K+ and Mg2+ contents at Sagehen are considerably greater than at Little Valley, and exchangeable Mg2+ content in the former fire is significantly greater than in the forest area and cannot be accounted for by potential ash inputs from O horizons and vegetation.
The largest differences between the two sites in both absolute amounts and responses to burning are for extractable P. Little Valley showed either no effect (Bray) or increased (bicarbonate) extractable P in the former fire compared to the forest, whereas both forms of P were lower in the former fire at Sagehen. The latter certainly cannot be due to inputs of P in ash; it may be due to immobilization in soil organic matter or charcoal in the former fire, or perhaps by enhanced post-fire ortho-P adsorption and P “fixation” in those sesquioxide-rich soils. Sequestration of P in post-fire O horizons and vegetation is also possible but seems less likely given the comparative magnitudes of vegetation and O horizon P contents in former fire and forested areas. Without further experimentation, we cannot conclusively state what the most important factor might be, but in the case of P, it could be that soil differences between former fire and forested areas (assuming that they were not present before the fire) are a legacy of the immediate but indirect effects of fire on the soil.

4. Conclusions

As is so often the case with wildfire studies, this study suffers from a lack of true statistical replication and also from pre-treament data. Nonetheless, we feel that some patterns in the long-term effects of fire on soils and ecosystem nutrient contents at these two sites can be observed. Specifically, it appears that the long-term effects of wildfire at the Sagehen site are similar to those at the formerly investigated Little Valley site in that:
  • (1) Soil total C and total N between former fire and forested sites are similar at both sites.
  • (2) Ecosystem C is much lower in the former fire because of lower vegetation biomass and will not recover to pre-fire values until forest vegetation is re-established.
  • (3) Ecosystem N lost during the fire has been more than made up for by post-fire N fixation at Little Valley and this is probably the case at Sagehen as well.
  • (4) Soil exchangeable Ca2+, Mg2+, and to some degree K+ are greater in the former fire than in the forested sites, probably due largely to recycling by post-fire vegetation because potential ash inputs cannot account for the observed differences.
  • (5) Mineral N leaching in the former fire is not greater than in the forested site despite the presence of N-fixers in the former.
  • (6) The long-term effects of fire on soil and ecosystem P contents at the Sagehen site differ considerably: O horizon total P and soil extractable P were lower in the former fire at Sagehen whereas soil extractable P is either no different or higher in the former fire in Little Valley. This difference in P response at the two sites may be related to the inherently lower soil extractable P values at the Sagehen site overall, which in turn is a reflection of the andic nature of the soils there: one of the defining features of an andic soil is high sesquioxide content and high phosphate retention as a result [31].
We conclude that the long-term effects of wildfire on the C and nutrient contents of soils and ecosystems in these sites are strongly affected by post-fire vegetation. In this comparison, soil parent material has an indirect but strong mediating effect on such long-term changes in the case of P because of the andic nature of the soils at Sagehen.

Acknowledgments

Research supported by the Nevada Agricultural Experiment Station, University of Nevada, Reno, Nevada USA.

Conflict of Interest

The authors declare no conflict of interest.

References

  1. Taylor, A.H. Identifying forest reference conditions on early cut-over lands, Lake Tahoe Basin, USA. Ecol. Appl. 2004, 14, 1903–1920. [Google Scholar] [CrossRef]
  2. Westerling, A.L.; Hidalgo, H.L.; Cayan, D.R.; Swetnam, W. Warming and earlier spring increases western U.S. forest wildfire activity. Science 2006, 313, 940–943. [Google Scholar] [CrossRef]
  3. Neary, D.G.; Klopatek, C.C.; DeBano, L.F.; Ffolliott, P.F. Fire effects on belowground sustainability: A review and synthesis. For. Ecol. Manag. 1999, 122, 51–71. [Google Scholar] [CrossRef]
  4. Certini, G. Effects of fire on properties of forest soils. Oecologia 2005, 143, 1–10. [Google Scholar] [CrossRef]
  5. Lynham, T.J.; Wickware, G.M.; Mason, J.A. Soil chemical changes and plant succession following experimental burning in immature jack pine. Can. J. Soil Sci. 1998, 78, 93–104. [Google Scholar]
  6. Hauer, F.R.; Spencer, C.N. Phosphorus and nitrogen dynamics in streams associated with wildfire: A study of immediate and longterm effects. Int. J. Wildland Fire 1998, 8, 183–198. [Google Scholar] [CrossRef]
  7. Carriera, J.A.; Arvevalo, J.R.; Neill, F.X. Soil degradation and nutrient availability in fire-prone Mediterranean shrublands of southeastern Spain. Arid Soil Res. Rehab. 1996, 10, 53–64. [Google Scholar] [CrossRef]
  8. Baird, M.; Zabowski, D.; Everett, R.L. Wildfire effects on carbon and nitrogen in inland coniferous forests. Plant Soil 1999, 209, 233–243. [Google Scholar] [CrossRef]
  9. Caldwell, T.G.; Johnson, D.W.; Miller, W.W.; Qualls, R.G. Forest floor carbon and nitrogen losses due to prescription fire. Soil Sci. Soc. Am. J. 2002, 66, 262–267. [Google Scholar]
  10. Grier, C.L. Wildfire effects on nutrient distribution and leaching in a coniferous ecosystem. Can. J. For. Res. 1975, 5, 599–607. [Google Scholar] [CrossRef]
  11. Johnson, D.W.; Susfalk, R.B.; Caldwell, T.G.; Murphy, J.D.; Miller, W.W.; Walker, F.F. Fire effects on carbon and nitrogen budgets in forests. Water Air Soil Pollut. Focus 2004, 4, 263–275. [Google Scholar]
  12. Johnson, D.W.; Murphy, J.D.; Walker, R.F.; Miller, W.W.; Todd, D.E. The combined effects of thinning and prescribed fire on carbon and nutrient budgets in a Jeffrey Pine Forests. Ann. For. Sci. 2008, 65, 601–612. [Google Scholar] [CrossRef]
  13. Rasion, R.J.; Khanna, P.K.; Woods, P.V. Mechanisms of element transfer to the atmosphere during vegetation fires. Can. J. For. Res. 1985, 15, 132–140. [Google Scholar] [CrossRef]
  14. Trabaud, L. The effect of fire on nutrient losses and cycling in a Quercus coccifera garrigue (southern France). Oecologia 1994, 99, 379–386. [Google Scholar] [CrossRef]
  15. Auclair, A.N. Postfire regeneration of plant and soil organic pools in a Picea mariana-Cladonia stellaris ecosystem. Can. J. For. Res. 1985, 15, 297–291. [Google Scholar]
  16. Binkley, D.; Cromack, K.; Fredriksen, R.L. Nitrogen accretion and availability in some snowbrush ecosystems. For. Sci. 1982, 28, 720–724. [Google Scholar]
  17. Johnson, D.W.; Murphy, J.F.; Susfalk, R.B.; Caldwell, T.G.; Miller, W.W.; Walker, R.B.; Powers, R.F. The effects of wildfire, salvage logging and post-fire N-fixation on the nutrient budgets of a Sierran Forest. For. Ecol. Manag. 2005, 220, 155–165. [Google Scholar] [CrossRef]
  18. Johnson, C.M.; Needham, P.R. Ionic composition of Sagehen Creek, California following an adjacent fire. Ecology 1966, 47, 636–639. [Google Scholar] [CrossRef]
  19. Youngberg, C.T.; Wollum, A.G. Nitrogen accretion in developing Ceanothus velutinus stands. Soil Sci. Soc. Am. J. 1976, 40, 109–112. [Google Scholar] [CrossRef]
  20. Zavitovski, J.; Newton, M. Ecological importance of snowbrush Ceanothus velutinus in the Oregon Cascades. Ecology 1968, 49, 1113–1145. [Google Scholar] [CrossRef]
  21. Johnson, D.W.; Susfalk, R.B.; Dahlgren, R.A. Nutrient fluxes in forests of the eastern Sierra Nevada Mountains. Glob. Biogeochem. Cyc. 1997, 11, 673–681. [Google Scholar] [CrossRef]
  22. Rau, B.M.; Melvin, A.M.; Johnson, D.W.; Goodale, C.L.; Blank, R.R.; Fredicksen, G.; Todd, D.E., Jr.; Miller, W.W.; Murphy, J.D.; Walker, R.F. Revisiting soil C and N sampling: Quantitative pits vs. rotary cores. Soil Sci. 2011, 176, 273–279. [Google Scholar]
  23. Gholz, H.; Grier, C.C.; Campbell, A.; Brown, A. Equations for Estimating Biomass and Leaf Area of Plants in the Pacific Northwest; Research Paper 41; Forest Research Laboratory, Oregon State University: Corvallis, OR, USA, 1979. [Google Scholar]
  24. Pyne, S.J.; Andrews, P.L.; Laven, R.D. Introduction to Wildland Fire, 2nd ed; John Wiley and Sons: New York, NY, USA, 1996. [Google Scholar]
  25. Avery, T.E.; Burkhart, T.E. Forest Measurements, 5th ed; McGraw-Hill: New York, NY, USA, 2002. [Google Scholar]
  26. Hurlbert, S.H. Pseudoreplication and the design of ecological field experiments. Ecol. Mon. 1984, 54, 187–211. [Google Scholar] [CrossRef]
  27. Murphy, J.D.; Johnson, D.W.; Miller, W.W.; Walker, R.F.; Carroll, E.M.; Blank, R.R. Wildfire effects on soil nutrients and leaching in a Tahoe Basin watershed. J. Environ. Qual. 2006, 35, 479–489. [Google Scholar] [CrossRef]
  28. Oskanen, L. Logic of experiments in ecology: Is pseudoreplication a pseudoissue? Oikos 2001, 94, 27–38. [Google Scholar]
  29. Stein, C.M. Post-fire Vegetation in Sierran Forests: Effects of Nitrogen Fixation, Soil Nitrogen Availability, and Water Quality. M.S. Thesis, Hydrologic Sciences, University of Nevada, Reno, NV, USA, 2006. [Google Scholar]
  30. Stein, C.M.; Johnson, D.W.; Miller, W.W.; Powers, R.F.; Young, D.A.; Glass, D.W. Snowbrush (Ceanothus velutinus Dougl.) effects on soil leaching and water quality in a Sierran ecosystem. Ecohydrology 2010, 3, 79–97. [Google Scholar]
  31. Buol, S.W.; Hole, F.D.; McCracken, R.J.; Southard, R.J. Soil Genesis and Classification, 4th ed; Iowa State University Press: Ames, IA, USA, 1997; p. 65. [Google Scholar]

